Sub-Saharan Africa Eurobond Performance 2022, & Cytonn Weekly #27/2022
By Cytonn Research, Jul 10, 2022
Executive Summary
Fixed Income
During the week, T-bills were oversubscribed, with the overall subscription rate coming in at 102.5%, up from 37.1% recorded the previous week, the increase in the subscription rate was partly attributable to investors’ preference for the shorter dated papers as they seek to avoid duration risk. The 91-day paper recorded the highest subscription rate, receiving bids worth Kshs 11.0 bn against the offered Kshs 4.0 bn, translating to a subscription rate of 276.0%, an increase from the 118.2% recorded the previous week. The subscription rate for the 364-day and 182- day papers also increased to 51.2% and 84.3%, from 24.4% and 17.5%, respectively, recorded the previous week. The yields on the government papers recorded mixed performance, with the yields on the 182-day and the 91-day papers increasing by 5.7 bps and 7.0 bps to 9.3% and 8.2%, respectively while the 364-day paper declined by 0.5 bps to 10.0%. In the primary bond market, the government released the auction results for the tap sale of infrastructure bond, IFB1/2022/18, for the month of July highlighting that the bond recorded an undersubscription of 32.1%;
Also during the week, Stanbic Bank released its monthly Purchasing Manager’s Index (PMI) highlighting that the index for the month of June 2022 declined for the third consecutive month to 46.8, from 48.2 recorded in May 2022 signaling a further deterioration in the business environment in the Kenyan private sector. Additionally, during the week, the Kenya Revenue Authority (KRA) released the annual revenue performance for the FY’2021/2022 highlighting that the revenues collected amounted to Kshs 2.03 tn against the revised target of Kshs 1.98 tn, representing an outperformance rate of 2.8%;
Equities
During the week, the equities market was on an upward trajectory with NASI, NSE 20 and NSE 25 gaining by 8.4%, 4.3% and 6.7%, respectively, taking their YTD performance to losses of 19.0%, 11.6% and 15.7%, for NASI, NSE 20 and NSE 25, respectively. The equities market performance was mainly driven by gains recorded by large-cap stocks such as Safaricom of 12.7% as well as banking stocks such as KCB Group, Standard Chartered Bank (SCBK), Equity Group and ABSA, which recorded gains of 8.7%, 7.7%, 7.0% and 5.7%, respectively. The gains were however weighed down by losses recorded by Jubilee Holdings of 2.0%;
Real Estate
In the Q1’2022 Gross Domestic Product report by the Kenya National Bureau of Statistics (KNBS), the Real Estate sector grew by 6.1% in Q1’2022, representing 0.6% points decline from the 6.7% growth that was recorded in Q1’2021. During the week, property developer Mi Vida Homes announced plans to break ground of 800 affordable housing units project worth more than Kshs 2.0 bn in Nairobi’s Riruta area, by the end of the year. In the retail sector, Java House, an international restaurant chain, announced plans to open five new outlets in the country by October 2022. In the hospitality sector, global five-star hotel Fairmont Mount Kenya Safari Club located in Nanyuki, resumed activities after having been closed for more than two years, following the onset of the Covid-19 pandemic that caused cash flow challenges. In the infrastructure sector, the national government through the Kenya National Highway Authority (KeNHA) announced plans to revamp the Thika-Garissa highway into a dual carriageway, at an estimated cost of Kshs 5.5 bn. Additionally, the national government through KeNHA awarded three Chinese firms a project tender worth Kshs 15.9 bn, to rehabilitate the Kisumu-Chemelil-Muhoroni road. For the listed Real Estate, ILAM Fahari I-REIT closed the week trading at an average price of Kshs 6.0 per share;
Focus of the Week
Overtime, African governments have gained traction towards more commercial funding structures comprising of Eurobonds and syndicated loans as their economies progress from low-income to lower-middle-income status. However, Africa’s high appetite for commercial debt has slowed down in 2022, with the only issuers being Nigeria and Angola who raised USD 1.3 bn and USD 1.8 bn in March and April 2022, respectively. The reduced issuance of Eurobonds is on the back of increasing yields as investors demand more compensation due to increasing inflationary pressures across most African countries coupled with fiscal challenges in some countries and the debt distress concerns compounded by the global economic challenges. This week, we provide a detailed analysis of Sub-Saharan Africa (SSA) Eurobonds performance painting a picture of the investor sentiments, risk tolerance and an outlook on yield performance;
Investment Updates:
- Weekly Rates:
- Cytonn Money Market Fund closed the week at a yield of 10.52%. To invest, dial *809#;
- Cytonn High Yield Fund closed the week at a yield of 13.92% p.a. To invest, email us at sales@cytonn.com and to withdraw the interest, dial *809# or download the Cytonn App from Google Play Store or Apple App Store
- We continue to offer Wealth Management Training every Wednesday and every third Saturday of the month, from 9:00 am to 11:00 am, through our Cytonn Foundation. The training aims to grow financial literacy among the general public. To register for any of our Wealth Management Trainings, click here;
- If interested in our Private Wealth Management Training for your employees or investment group, please get in touch with us through wmt@cytonn.com;
- Any CHYS and CPN investors still looking to convert are welcome to consider one of the five projects currently available for assignment, click here for the latest term sheet;
- Cytonn Insurance Agency acts as an intermediary for those looking to secure their assets and loved ones’ future through insurance namely; Motor, Medical, Life, Property, WIBA, Credit and Fire and Burglary insurance covers. For assistance, get in touch with us through insuranceagency@cytonn.com;
- Cytonnaire Savings and Credit Co-operative Society Limited (SACCO) provides a savings and investments avenue to help you in your financial planning journey. To enjoy competitive investment returns, kindly get in touch with us through clientservices@cytonn.com;
Real Estate Updates:
- For an exclusive tour of Cytonn’s real estate developments, visit: Sharp Investor's Tour, and for more information, email us at sales@cytonn.com;
- Phase 3 of The Alma is now ready for occupation. To rent please email properties@cytonn.com;
- We have 8 investment-ready projects, offering attractive development and buyer targeted returns; See further details here: Summary of Investment-ready Projects;
- For Third Party Real Estate Consultancy Services, email us at rdo@cytonn.com;
- For recent news about the group, see our news section here;
Hospitality Updates:
- We currently have promotions for Staycations. Visit cysuites.com/offers for details or email us at sales@cysuites.com;
Money Markets, T-Bills Primary Auction:
During the week, T-bills were oversubscribed, with the overall subscription rate coming in at 102.5%, up from 37.1% recorded the previous week, partly attributable to investors’ preference for the shorter dated papers as they avoid duration risk. The 91-day paper recorded the highest subscription rate, receiving bids worth Kshs 11.0 bn against the offered Kshs 4.0 bn, translating to a subscription rate of 276.0%, an increase from the 118.2% recorded the previous week. The subscription rate for the 364-day and 182- day papers also increased to 51.2% and 84.3%, from 24.4% and 17.5%, respectively, recorded the previous week. The yields on the government papers recorded mixed performance, with the yields on the 182-day and the 91-day papers increasing by 5.7 bps and 7.0 bps to 9.3% and 8.2%, respectively while the yield on the 364-day paper declined by 0.5 bps to 10.0%. The government continued to reject expensive bids, accepting a total of Kshs 24.2 bn worth of bids out of the Kshs 24.6 bn received, translating to an acceptance rate of 98.4%.
In the primary bond market, the government released the auction results for the tap sale of the infrastructure bond, IFB1/2022/18, for the month of July highlighting that the bond recorded an undersubscription of 32.1%, partly attributable to the relatively tight liquidity in the money market during the period of issue. The government sought to raise Kshs 20.0 bn for funding infrastructural projects and received all the bids worth Kshs 6.4 bn, translating to a 100.0% acceptance rate. The bond had a coupon rate and a market weighted average rate of 13.7%.
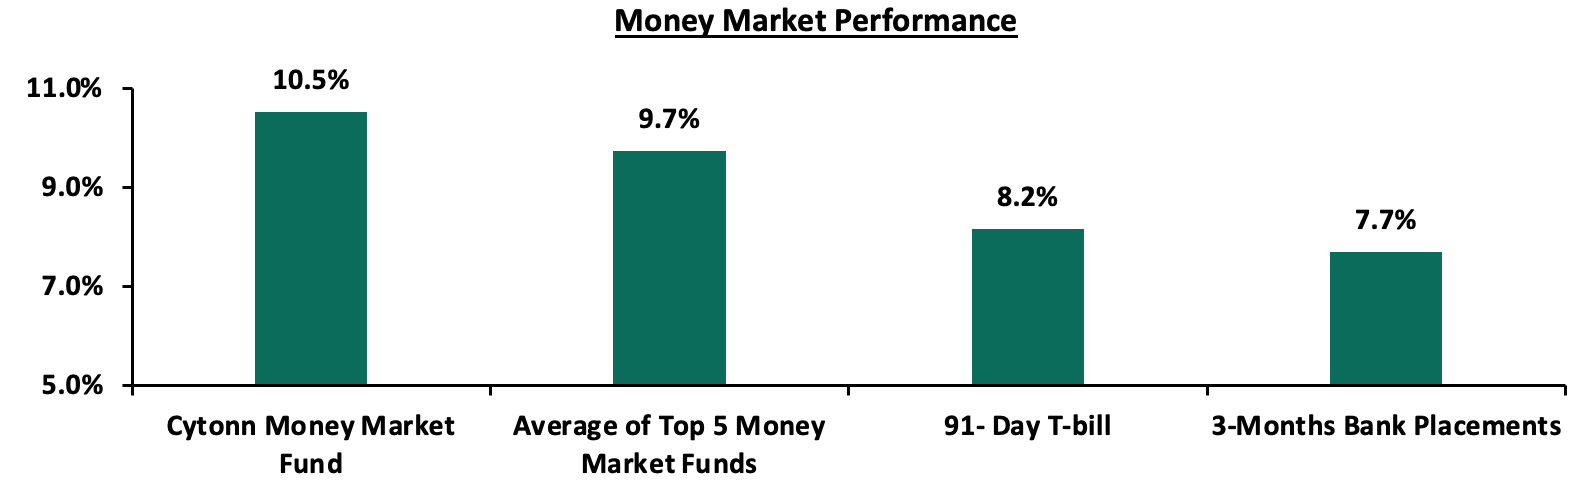
In the money markets, 3-month bank placements ended the week at 7.7% (based on what we have been offered by various banks), while the yield on the 91-day T-bill increased by 7.0 bps to 8.2%. The average yield of the Top 5 Money Market Funds and the Cytonn Money Market Fund remained relatively unchanged at 9.7% and 10.5% respectively, as was recorded last week.
The table below shows the Money Market Fund Yields for Kenyan Fund Managers as published on 8th July 2022:
|
Money Market Fund Yield for Fund Managers as published on 8th July 2022 |
||
|
Rank |
Fund Manager |
Effective Annual Rate |
|
1 |
Cytonn Money Market Fund |
10.5% |
|
2 |
Zimele Money Market Fund |
9.9% |
|
3 |
Sanlam Money Market Fund |
9.6% |
|
4 |
Madison Money Market Fund |
9.4% |
|
5 |
Apollo Money Market Fund |
9.3% |
|
6 |
NCBA Money Market Fund |
9.2% |
|
7 |
Nabo Africa Money Market Fund |
9.2% |
|
8 |
Dry Associates Money Market Fund |
9.1% |
|
9 |
Old Mutual Money Market Fund |
9.0% |
|
10 |
CIC Money Market Fund |
8.9% |
|
11 |
Co-op Money Market Fund |
8.9% |
|
12 |
GenCap Hela Imara Money Market Fund |
8.8% |
|
13 |
ICEA Lion Money Market Fund |
8.6% |
|
14 |
Orient Kasha Money Market Fund |
8.3% |
|
15 |
AA Kenya Shillings Fund |
7.9% |
|
16 |
British-American Money Market Fund |
7.6% |
Source: Business Daily
Liquidity:
During the week, liquidity in the money markets tightened, with the average interbank rate rising to 5.8% from 5.3% recorded the previous week, partly attributable to tax remittances that offset government payments. The average interbank volumes traded increased by 12.7% to Kshs 20.6 bn from Kshs 18.3 bn recorded the previous week.
Kenya Eurobonds:
During the week, the yields on Eurobonds were on an upward trajectory, partly attributable to investors attaching higher risk premium on the country due to perceived higher risks arising from increasing inflationary pressures and local currency depreciation. The yields on the 10-year Eurobond issued in 2014 and the 7-year Eurobond issued in 2019 both recorded the highest increase having increased by 0.5% points to 17.4% and 16.6%, from 16.9% and 16.1%, respectively recorded the previous week. The table below shows the summary of the performance of the Kenyan Eurobonds as of 8th July 2022;
|
Kenya Eurobond Performance |
||||||
|
2014 |
2018 |
2019 |
2021 |
|||
|
Date |
10-year issue |
10-year issue |
30-year issue |
7-year issue |
12-year issue |
12-year issue |
|
03-Jan-22 |
4.4% |
8.1% |
8.1% |
5.6% |
6.7% |
6.6% |
|
30-Jun-22 |
17.0% |
14.7% |
13.7% |
16.1% |
13.8% |
12.7% |
|
01-Jul-22 |
16.9% |
14.6% |
13.8% |
16.1% |
13.8% |
13.0% |
|
04-Jul-22 |
16.8% |
14.6% |
13.8% |
16.1% |
13.7% |
13.0% |
|
05-Jul-22 |
16.6% |
14.6% |
13.7% |
16.1% |
13.7% |
13.0% |
|
06-Jul-22 |
17.2% |
14.8% |
13.9% |
16.3% |
13.8% |
13.1% |
|
07-Jul-22 |
17.4% |
15.0% |
14.0% |
16.6% |
14.0% |
13.2% |
|
Weekly Change |
0.5% |
0.4% |
0.2% |
0.5% |
0.2% |
0.2% |
|
MTD Change |
0.4% |
0.3% |
0.3% |
0.5% |
0.2% |
0.5% |
|
YTD Change |
13.0% |
7.0% |
5.9% |
11.0% |
7.3% |
6.6% |
Source: Central Bank of Kenya (CBK)
Kenya Shilling:
During the week, the Kenyan shilling depreciated by 0.2% against the US dollar to close the week at Kshs 118.1, from Kshs 117.9 recorded the previous week, partly attributable to increased dollar demand from the oil and energy sectors. Key to note, this is the lowest the Kenyan shilling has ever depreciated against the dollar. On a year to date basis, the shilling has depreciated by 4.4% against the dollar, in comparison to the 3.6% depreciation recorded in 2021. We expect the shilling to remain under pressure in 2022 as a result of:
- Continued rise in global crude oil prices on the back of persistent supply chain bottlenecks further exacerbated by the Russian-Ukrainian geopolitical pressures at a time when demand is picking up with the easing of COVID-19 restrictions and as economies reopen. Key to note, risks abound the recovery following the resurgence of COVID-19 infections in the country,
- Increased demand from merchandise traders as they beef up their hard currency positions in anticipation for more trading partners reopening their economies globally,
- An ever-present current account deficit due to an imbalance between imports and exports, with Kenya’s current account deficit estimated to come in at 5.3% of GDP in the 12 months to May 2022 compared to the 5.0% for a similar period in 2021. The wider deficit reflects a higher import bill, particularly for oil, which more than offset increased receipts from agricultural and services exports, and remittances, and,
- The aggressively growing government debt, with Kenya’s public debt having increased at a 10-year CAGR of 19.8% to Kshs 8.5 tn in April 2022, from Kshs 1.4 tn in April 2011 thus putting pressure on forex reserves to service some of the public debt. It is worth noting that the average GDP growth over the same period has been 3.9%, an indicator that the increase in debt is not translating into GDP growth.
The shilling is however expected to be supported by:
- High Forex reserves currently at USD 8.0 bn (equivalent to 4.6-months of import cover), which is above the statutory requirement of maintaining at least 4.0-months of import cover, and the EAC region’s convergence criteria of 4.5-months of import cover. In addition, the reserves were boosted by the USD 750.0 mn World Bank loan facility received in March 2022 and are expected to be boosted further by the expected USD 244.0 mn from the International Monetary Fund (IMF), and,
- Improving diaspora remittances evidenced by a 7.6% y/y increase to USD 339.7 mn as of May 2022, from USD 315.8 mn recorded over the same period in 2021 which has continued to cushion the shilling against further depreciation. In the recently released May 2022 diaspora remittances figures, North America remained the largest source of remittances to Kenya accounting for 59.9% in the period, followed by Europe at 17.8% while the rest of the world accounted for 22.3% of the total.
Weekly Highlights:
- Stanbic Bank’s June 2022 Purchasing Manager’s Index (PMI)
During the week, Stanbic Bank released its monthly Purchasing Manager’s Index (PMI) highlighting that the index for the month of June 2022 declined for the third consecutive time to 46.8, from 48.2 recorded in May 2022 signaling a further deterioration in the business environment in the Kenyan private sector. Notably, this was the lowest reading since April 2021, when the index came in at 41.5. The decline was largely attributable to the prevailing inflationary pressures with the inflation rate for the month of June coming in at 7.9%, from the 7.1% recorded in May 2022. Additionally, there was a rise in input costs, occasioned by the increasing fuel prices, supply constraints as well as a weakening currency. Selling prices increased in tandem leading to a decline in new order volumes as consumers reduced their spending. Key to note, purchasing activity by businesses fell compared to May, although inventories continued to rise due to stockpiling efforts amid concerns that supply would worsen or prices would rise. The chart below summarizes the evolution of the PMI;
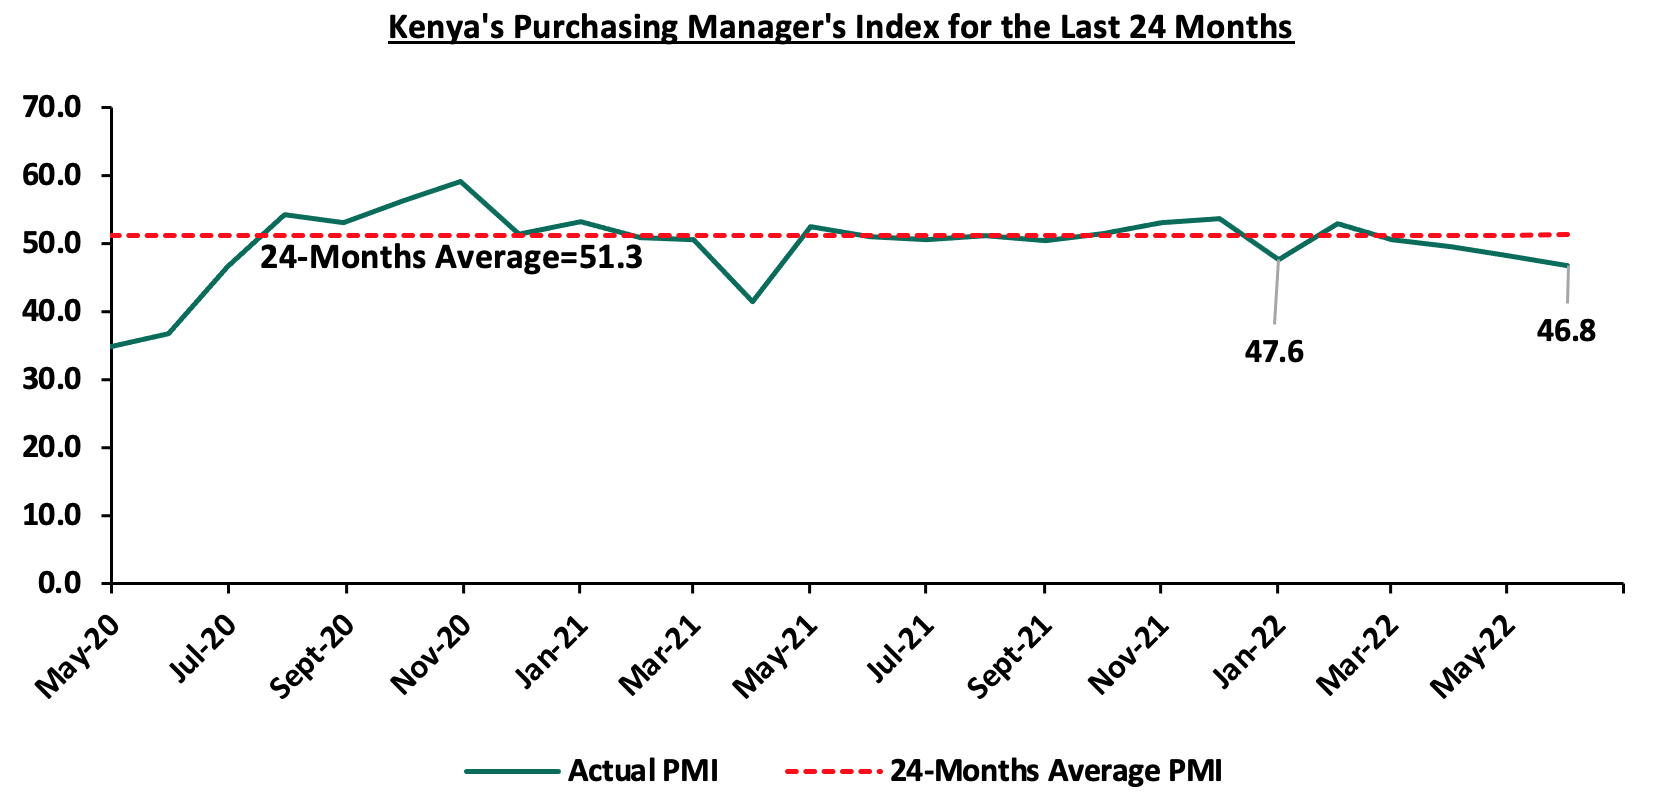
*** Key to note, a reading above 50.0 signals an improvement in business conditions, while readings below 50.0 indicate a deterioration.
Kenya’s general business environment has continued to deteriorate amid increased cost of living occasioned by constrained supply chains exacerbated by persistent geopolitical pressures, all of which have led to reduced consumer spending. Going forward, we maintain a cautious outlook owing to the continued rise in cost of fuel and production materials which has resulted to an increase in input costs. Additionally, the continued depreciation of the Kenyan shilling is expected to further increase the production cost given that Kenya is a net importer. As such, the recovery of the private sector business environment in Kenya is largely pegged on how quickly the global economy stabilizes with a key concern on the rising fuel prices as well as the upcoming August 2022 general elections.
- FY’2021/2022 Revenue Performance
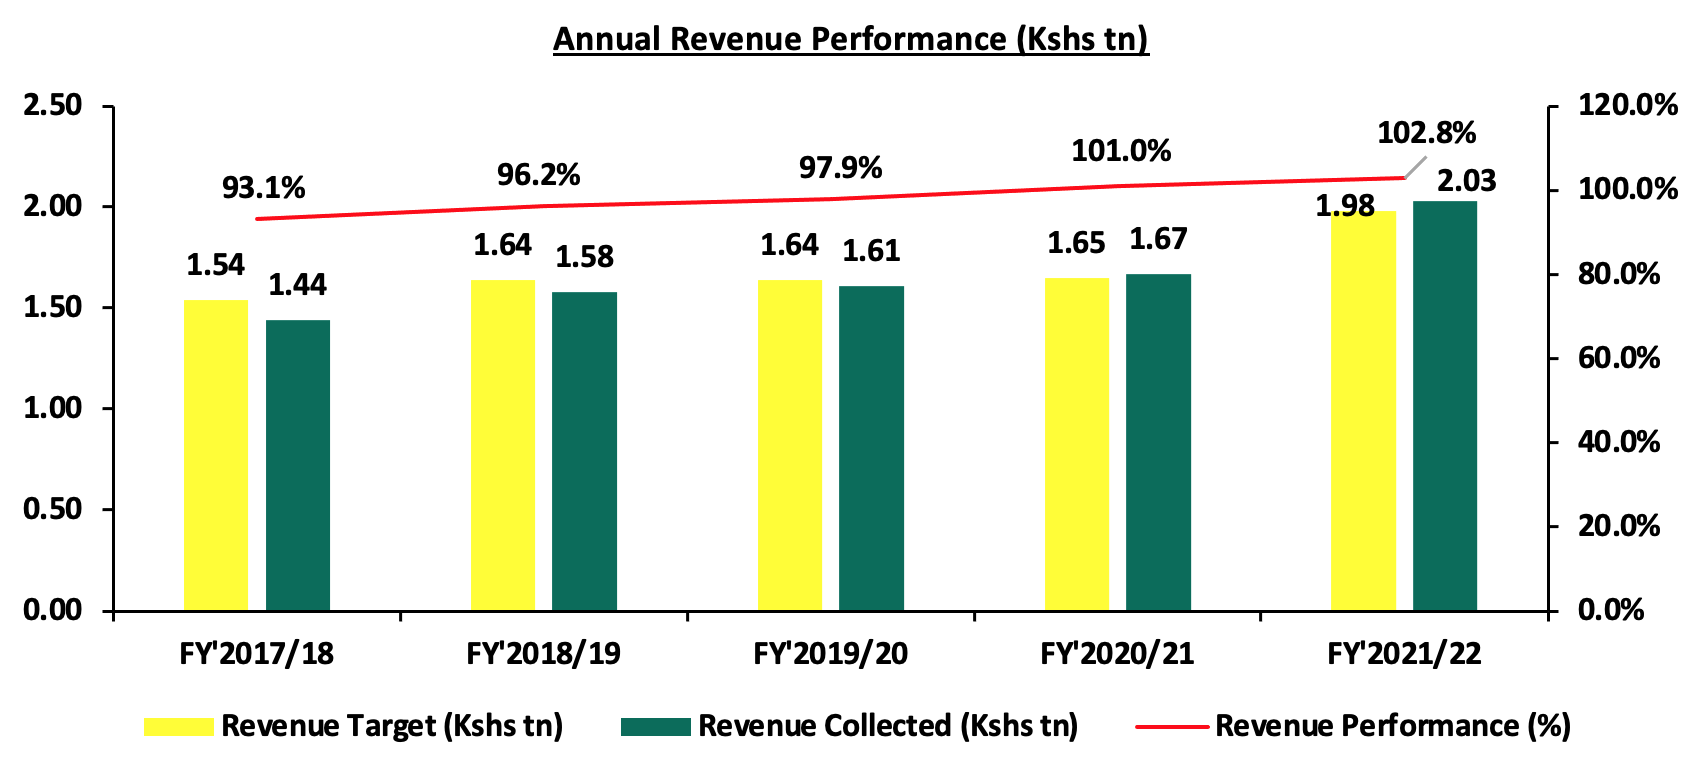
During the week, the Kenya Revenue Authority (KRA) released the annual revenue performance for the FY’2021/2022 highlighting that the total revenue collected came in at Kshs 2.03 tn, against the revised target of Kshs 1.98 tn, representing an out-performance rate of 102.8%. Notably, this was the second time, the KRA surpassed its revenue collection target in eight years albeit the challenges posed by the COVID-19 pandemic on the business environment. Overall, revenues grew by 21.7% in FY’2021/2022 to Kshs 2.0 tn from Kshs 1.7 tn in FY’2020/2021. The performance is mainly attributable to (i) enhanced compliance enforcement efforts and the implementation of new tax measures, focused on ensuring that that non-compliant taxpayers pay their due taxes, (ii) introduction of new taxes such as digital services tax, minimum tax and voluntary tax disclosure as KRA bid to expand sources of revenue, and, (iii) employment of technological strategies to assist seal revenue loopholes. The graph below shows a summary of Kenya’s revenue performance over the last 5 years, as per data by the Kenya Revenue Authority (KRA):
The revenue performance for the FY’2021/2022 is commendable given that the economy was still recovering from the adverse effects of the COVID-19 pandemic. With the revenue collection target having increased by 20.0% to Kshs 2.4 tn from the Kshs 2.0 tn in FY’2021/2022, we expect the government in collaboration with the Kenya Revenue Authority to put more initiatives so as to meet the target. Additionally, we expect the continued economic recovery coupled with the new tax policies which will see an increase in excise duty, income tax as well as Value Added Tax to support the growth in revenues. However, risks lie on the downside given the increasing inflationary pressures, resurgence of COVID-19 infections and the upcoming elections which could have a negative effect on the economic environment. In our view, the performance of the FY’2022/2023 revenue collection will be largely determined by the stability of the international markets, how well the government contains the spread of COVID-19 infections and the August 2022 elections.
Rates in the Fixed Income market have remained relatively stable due to the relatively ample liquidity in the money market. The government is 18.0% ahead of its prorated borrowing target of Kshs 12.8 bn having borrowed Kshs 15.1 bn of the Kshs 581.7 bn borrowing target for the FY’2022/2023. We expect sustained gradual economic recovery as evidenced by the revenue collections of Kshs 2.0 tn during the FY’2021/2022, which was equivalent to 102.8% of the prorated revenue collection target. Additionally, despite the projected high budget deficit of 8.1% and the affirmation of the `B+’ rating with negative outlook by Fitch Ratings, we believe that the support from the IMF and World Bank will mean that the interest rate environment will remain stable since the government is not desperate for cash. Owing to this, our view is that investors should be biased towards short-term fixed-income securities to reduce duration risk.
Market Performance:
During the week, the equities market was on an upward trajectory with NASI, NSE 20 and NSE 25 gaining by 8.4%, 4.3% and 6.7%, respectively, taking their YTD performance to losses of 19.0%, 11.6% and 15.7%, for NASI, NSE 20 and NSE 25, respectively. The equities market performance was mainly driven by gains recorded by large-cap stocks such as Safaricom of 12.7% as well as banking stocks such as KCB Group, Standard Chartered Bank (SCBK), Equity Group and ABSA, which recorded gains of 8.7%, 7.7%, 7.0% and 5.7%, respectively. The gains were however weighed down by losses recorded by Jubilee Holdings of 2.0%.
During the week, equities turnover increased by 18.1% to USD 22.9 mn from USD 19.4 mn recorded the previous week, taking the YTD turnover to USD 495.8 mn. During the week, foreign investors remained net sellers, with a net selling position of USD 7.3 mn, from a net selling position of USD 6.6 mn recorded the previous week, taking the YTD net selling position to USD 115.3 mn.
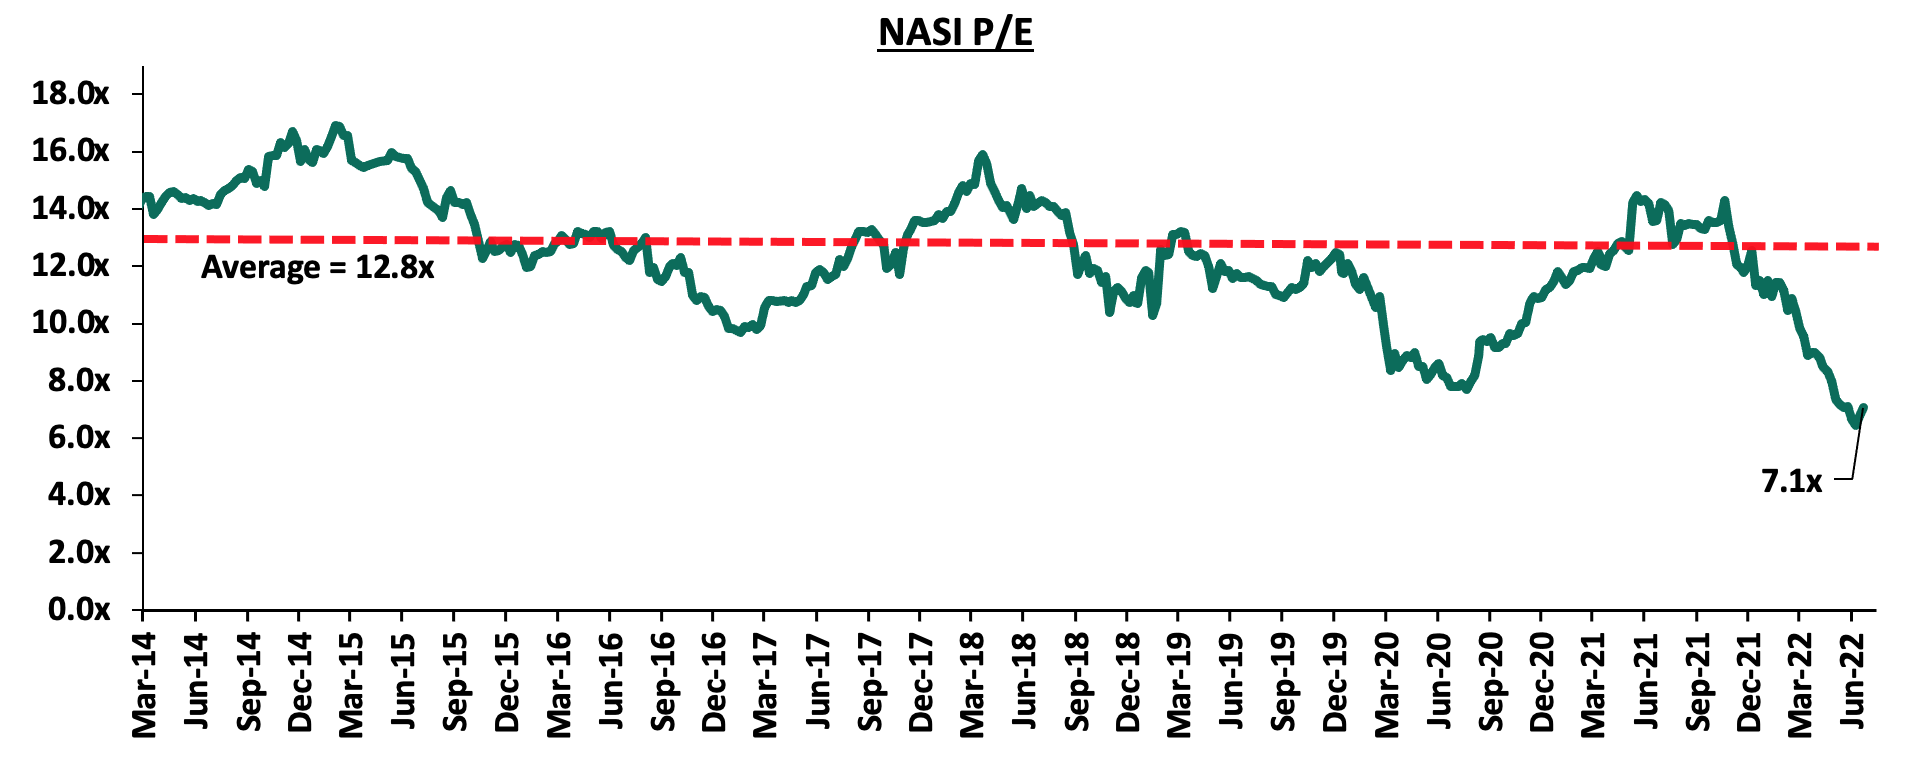
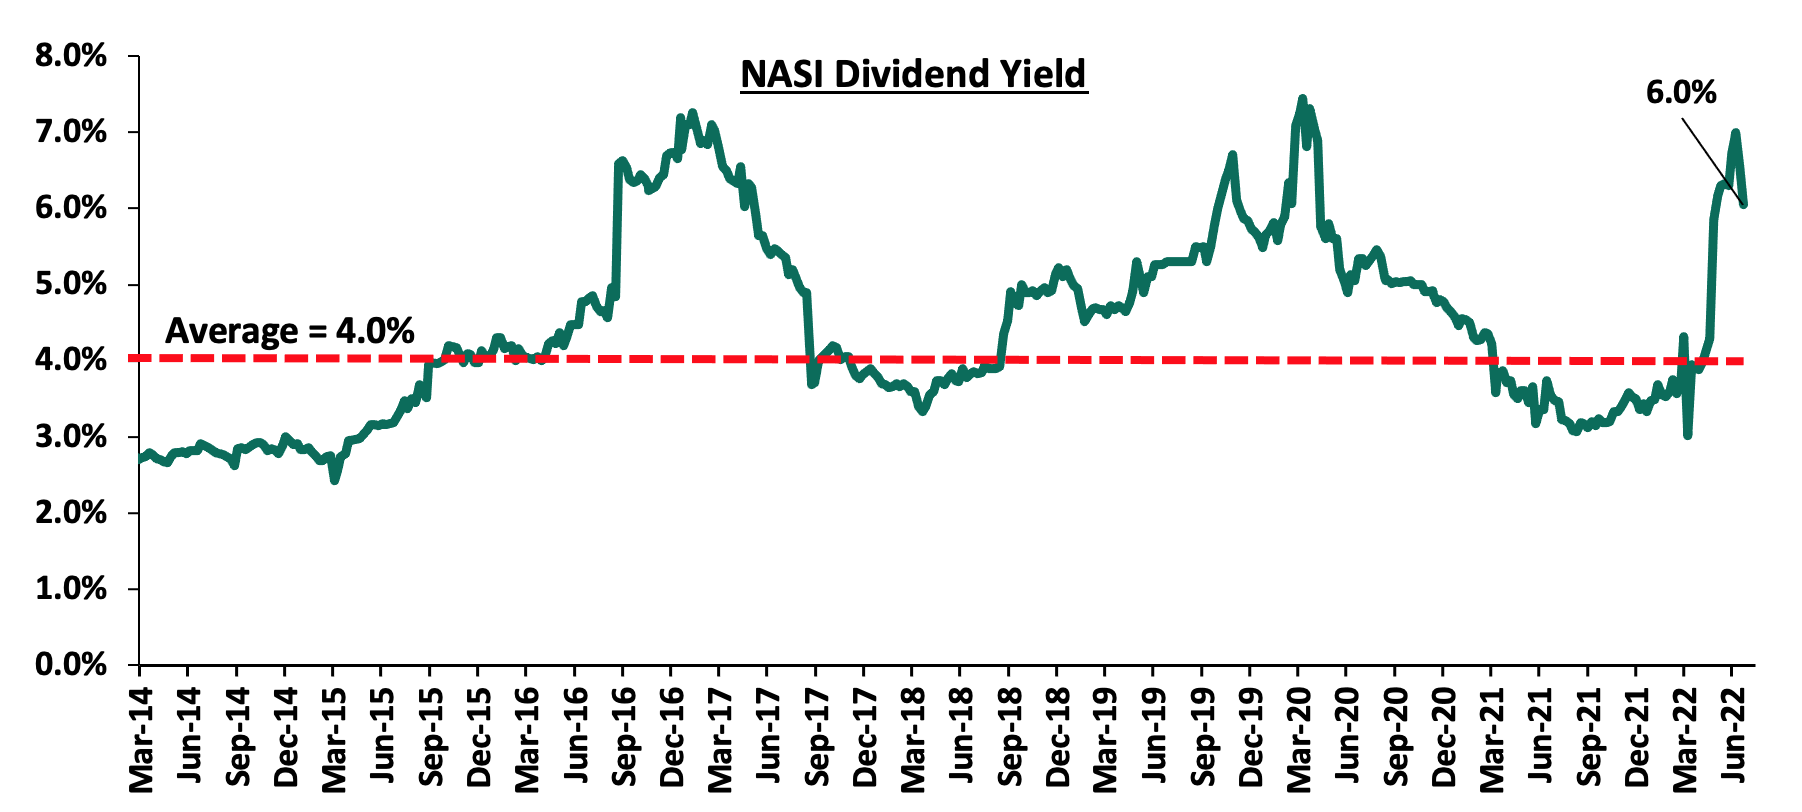
The market is currently trading at a price to earnings ratio (P/E) of 7.1x, 44.7% below the historical average of 12.8x, and a dividend yield of 6.0%, 2.0% points above the historical average of 4.0%. Key to note, NASI’s PEG ratio currently stands at 0.9x, an indication that the market is undervalued relative to its future growth. A PEG ratio greater than 1.0x indicates the market may be overvalued while a PEG ratio less than 1.0x indicates that the market is undervalued.
The charts below indicate the historical P/E and dividend yields of the market;
Cytonn coverage:
|
Company |
Price as at 01/07/2022 |
Price as at 08/07/2022 |
w/w change |
YTD Change |
Target Price* |
Dividend Yield |
Upside/ Downside** |
P/TBv Multiple |
Recommendation |
|
Kenya Reinsurance |
2.0 |
2.1 |
1.0% |
(10.0%) |
3.2 |
4.9% |
59.2% |
0.2x |
Buy |
|
Jubilee Holdings |
255.0 |
250.0 |
(2.0%) |
(21.1%) |
379.4 |
5.6% |
57.4% |
0.5x |
Buy |
|
Sanlam |
12.0 |
11.0 |
(8.3%) |
(4.8%) |
15.9 |
0.0% |
44.5% |
1.2x |
Buy |
|
I&M Group*** |
17.0 |
17.0 |
0.0% |
(20.6%) |
22.3 |
8.8% |
40.0% |
0.5x |
Buy |
|
Liberty Holdings |
5.4 |
5.7 |
4.8% |
(19.8%) |
7.8 |
0.0% |
37.8% |
0.4x |
Buy |
|
NCBA*** |
23.7 |
24.0 |
1.3% |
(5.7%) |
29.1 |
12.5% |
33.8% |
0.6x |
Buy |
|
Co-op Bank*** |
11.0 |
11.5 |
4.5% |
(11.5%) |
14.1 |
8.7% |
31.3% |
0.9x |
Buy |
|
ABSA Bank*** |
10.6 |
11.2 |
5.7% |
(4.7%) |
13.6 |
9.8% |
31.3% |
1.1x |
Buy |
|
KCB Group*** |
39.0 |
42.4 |
8.7% |
(6.9%) |
52.2 |
7.1% |
30.2% |
0.9x |
Buy |
|
Diamond Trust Bank*** |
49.7 |
50.5 |
1.6% |
(15.1%) |
62.4 |
5.9% |
29.5% |
0.2x |
Buy |
|
Britam |
5.7 |
6.0 |
5.3% |
(20.6%) |
7.7 |
0.0% |
28.3% |
1.0x |
Buy |
|
Equity Group*** |
43.0 |
46.0 |
7.0% |
(12.8%) |
54.4 |
6.5% |
24.8% |
1.2x |
Buy |
|
Stanbic Holdings |
99.0 |
99.0 |
0.0% |
13.8% |
109.8 |
9.1% |
20.0% |
0.9x |
Buy |
|
Standard Chartered*** |
124.0 |
133.5 |
7.7% |
2.7% |
137.0 |
10.5% |
13.1% |
1.1x |
Accumulate |
|
CIC Group |
2.0 |
2.1 |
4.0% |
(4.1%) |
2.1 |
0.0% |
1.0% |
0.7x |
Lighten |
|
HF Group |
3.3 |
3.7 |
12.7% |
(1.8%) |
2.8 |
0.0% |
(24.9%) |
0.2x |
Sell |
|
Target Price as per Cytonn Analyst estimates **Upside/ (Downside) is adjusted for Dividend Yield ***For Disclosure, these are stocks in which Cytonn and/or its affiliates are invested in |
|||||||||
We are “Neutral” on the Equities markets in the short term due to the current adverse operating environment and huge foreign investor outflows, and, “Bullish” in the long term due to current cheap valuations and expected global and local economic recovery.
With the market currently trading at a discount to its future growth (PEG Ratio at 0.9x), we believe that investors should reposition towards value stocks with strong earnings growth and that are trading at discounts to their intrinsic value. We expect the current high foreign investors sell-offs, the upcoming Kenyan general elections and the slow vaccine rollout to continue weighing down the economic outlook in the short term.
- Industry Reports
In the Q1’2022 Gross Domestic Product report by the Kenya National Bureau of Statistics (KNBS), the following were the key take outs from the report with regards to Real Estate and related sectors;
- The Real Estate sector grew by 6.1% in Q1’2022, representing 0.6% points decline from the 6.7% growth that was recorded in Q1’2021. The decline in performance was attributed to a slow-down in activities in the market, which resulted to a decline in transactions in the sector. The graph below shows the performance of the Real Estate sector GDP from Q1’2020-Q1’2022;
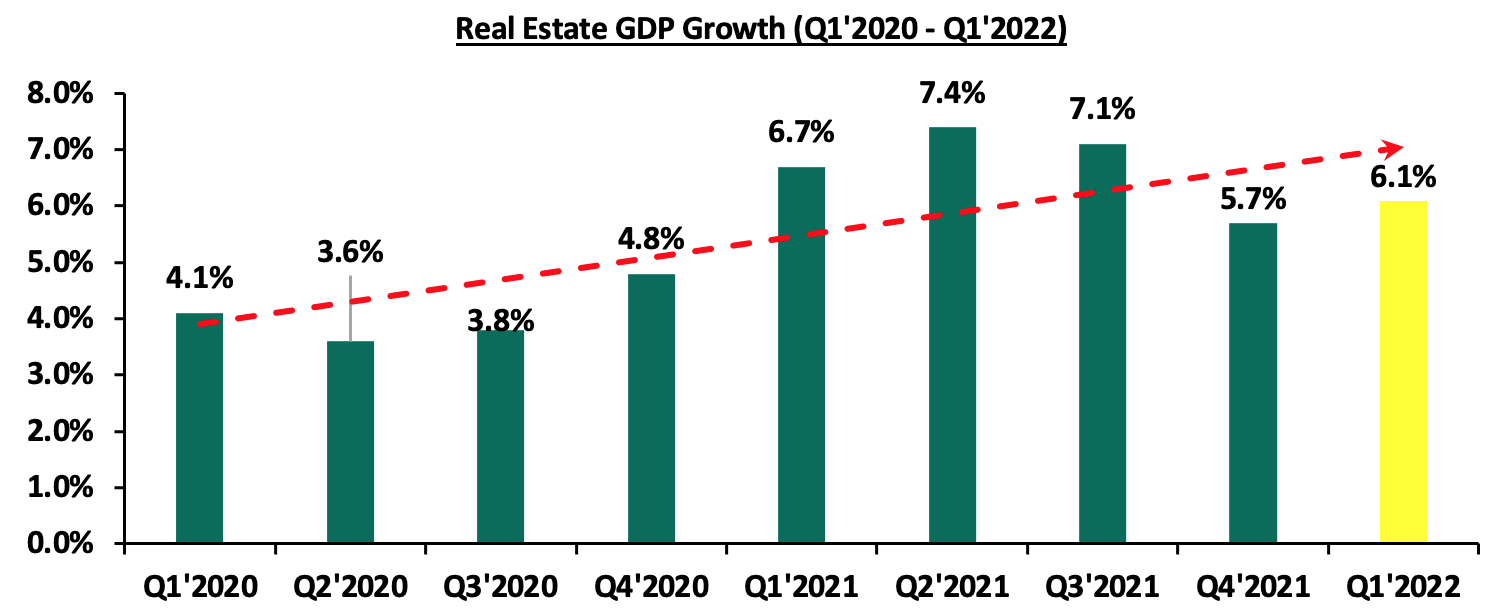
Source: Kenya National Bureau of Statistics (KNBS)
- The construction sector grew by 6.4% in Q1’2022, 0.4% points decline from the 6.8% growth that was realized in Q1’2021. The decline in performance was mainly driven by increased construction cost of materials that in turn caused developers to streamline their activities. However, on q/q basis, the sector grew faster compared to the 6.0% growth rate recorded in Q4’2021, following the near and completion of mega projects such as the Nairobi expressway and the Western Bypass, among others. The graph below shows performance of construction sector from Q1’2020-Q1’2022;
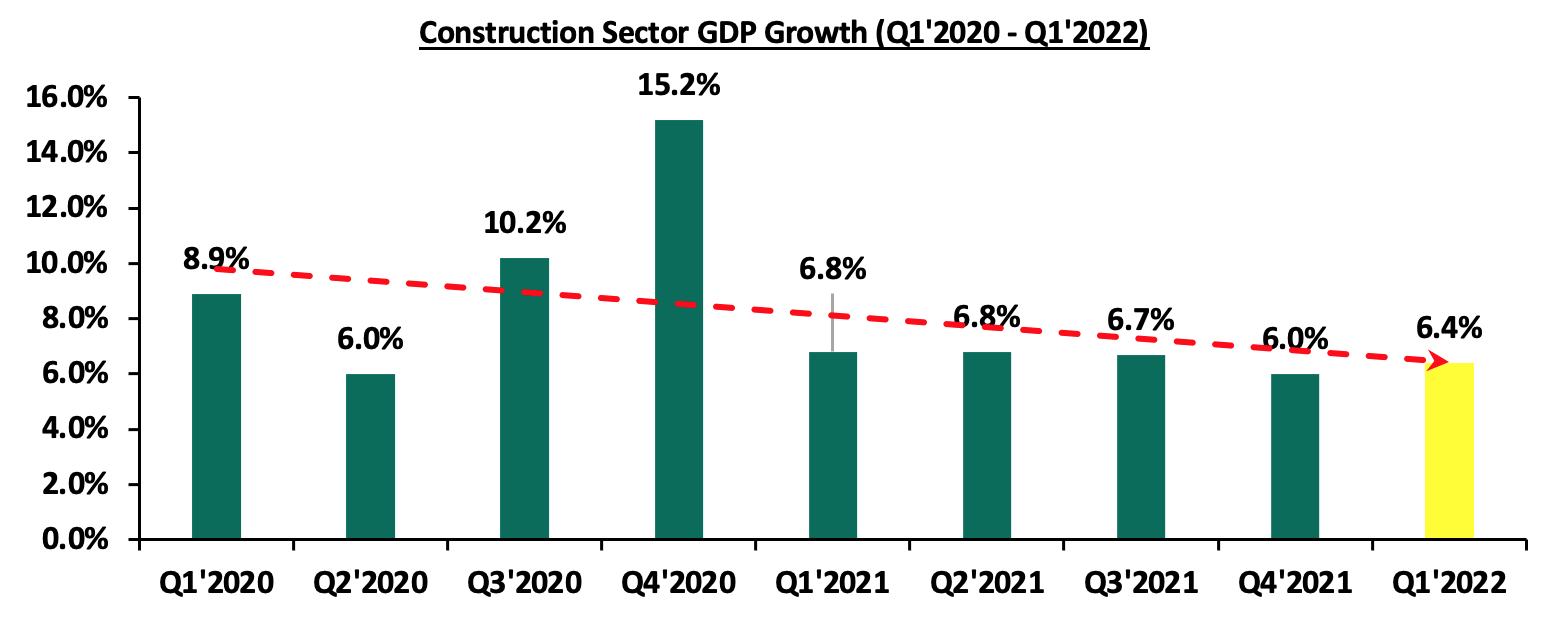
Source: Kenya National Bureau of Statistics (KNBS)
- The Accommodation & Food services sector grew by 56.2% in Q1’2022, 89.2% points higher than the 33.0% contraction recorded in Q1’2021. This was mainly driven by the lowered pandemic restrictions and flight bans, that led to increased visitor arrivals into the country as well as increased leisure and conference activities boosting the sector’s performance. However, on a q/q basis, the performance was a sharp decline by 62.4% from the 118.6% growth that was recorded in Q4’2021. The reduced growth is mainly because of the prior quarter growth we saw from depressed tourism numbers, during the height of the pandemic. The graph below shows the GDP performance of the hospitality sector between Q1’2020-Q1’2022;
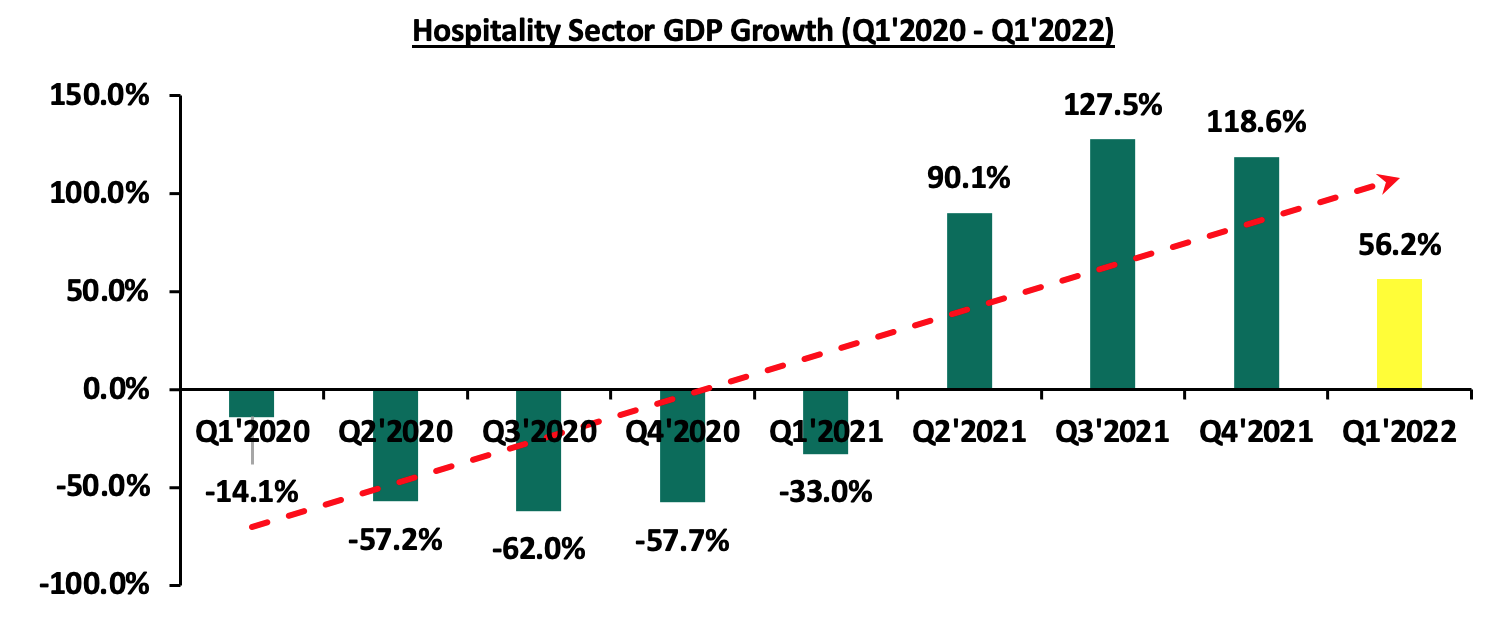
Source: Kenya National Bureau of Statistics (KNBS)
We expect Kenya’s property market to be on an upward trajectory, driven by factors such as rapid infrastructure developments, increased development and expansion in the hospitality and retail sectors, and, government’s continued focus on the affordable housing initiative. However, setbacks such as oversupply in select Real Estate sectors, coupled with financial constraints is expected to weigh down optimum performance of the sector.
- Residential Sector
During the week, property developer Mi Vida Homes announced plans to break ground of 800 affordable housing units project worth more than Kshs 2.0 bn in Nairobi’s Riruta area, by end of the year. The project which will sit on a six-acre piece of land off Ngong Road, will consist of studios, one-bedroom, two-bedroom, and three-bedroom units, with prices ranging between Kshs 2.0 mn and Kshs 6.0 mn. Moreover, the project will be undertaken through a Joint Venture (JV) partnership strategy between Actis Limited, a private equity firm, Indian construction firm Shapoorji Pallonji Real Estate through Mi Vida Homes, and an undisclosed land owner. This comes after Mi Vida also mentioned plans to commence phase two of its Garden City housing project located along Thika Road, after the completion of phase one comprising of 221 housing units, which is expected to take place in August 2022. The decision by Mi Vida Homes to construct its project in Riruta is supported by;
- Strategic location with the area being approximately 10.0 km from Nairobi CBD,
- Relatively affordability land prices in the area, with an acre currently averaging at Kshs 90.2 mn in Dagoretti constituency where Riruta is located, compared to a market average of Kshs 128.2 mn, as per our Cytonn H1’2022 Markets Review report,
- Consumer demand for housing units due to their affordability,
- High concentration of middle-income class earners in the area, which are the target population due to their favorable purchasing power, and,
- Close proximity to infrastructure and amenities servicing the area such as Ngong Road.
In terms of performance, according to Cytonn H1’2022 Markets Review, Dagoretti where Riruta is located recorded average total return to investors at 5.9%, 0.1% points higher than the lower mid-end suburbs average of 5.8%. The average selling prices came in at Kshs 85,017 per SQM against a market average of Kshs 93,772 per SQM, indicating affordability of housing units in the area. The average rental yield also came in at 5.9%, 0.5% points higher than the market average of 5.4%, signifying the impressive performance and the investor’s decision to invest in Riruta, as indicated in the table below;
(All values in Kshs unless stated otherwise)
|
Apartments Performance H1’2022 |
||||||||
|
Area |
Average of Price per SQM H1'2022 |
Average of Rent per SQM H1'2022 |
Average of Occupancy H1'2022 |
Average of Uptake H1'2022 |
Average of Annual Uptake H1'2022 |
Average of Rental Yield H1'2022 |
Average of Price Appreciation H1'2022 |
Total Returns |
|
Lower Mid-End Suburbs |
||||||||
|
Waiyaki Way |
88,518 |
537 |
84.1% |
86.6% |
18.3% |
6.2% |
1.1% |
7.3% |
|
South C |
117,736 |
723 |
82.3% |
79.6% |
18.2% |
6.1% |
0.4% |
6.5% |
|
Imara Daima |
80,559 |
421 |
87.3% |
89.6% |
12.9% |
5.2% |
1.2% |
6.4% |
|
Dagoretti |
85,017 |
572 |
88.1% |
81.2% |
14.4% |
5.9% |
0.1% |
5.9% |
|
Donholm & Komarock |
77,683 |
394 |
93.1% |
93.9% |
12.5% |
5.8% |
0.1% |
5.9% |
|
Race Course/Lenana |
99,676 |
633 |
81.9% |
93.6% |
19.9% |
5.9% |
(0.1%) |
5.8% |
|
Kahawa West |
74,409 |
314 |
88.8% |
92.5% |
10.7% |
5.2% |
0.6% |
5.7% |
|
South B |
105,460 |
463 |
82.4% |
95.2% |
14.9% |
4.2% |
0.2% |
4.4% |
|
Langata |
114,887 |
537 |
81.2% |
88.1% |
13.0% |
4.5% |
(0.6%) |
4.0% |
|
Average |
93,772 |
510 |
85.5% |
88.9% |
15.0% |
5.4% |
0.3% |
5.8% |
Source: Cytonn Research 2022
Joint Ventures continue to gain momentum in the country as they have proven to be cost effective ways of implementing projects such as the affordable housing projects that continue to gain traction in Kenya as well. These projects have also been realized and implemented by private developers such as Mi Vida Homes and Edderman Limited among others, thus promoting the program which is a government initiative. Some of the ongoing projects by private developers include; Pangani Housing project, Athi River Waterfront project, and, River Estate project in Ngara, among many others. We expect a similar trend to continue shaping performance of Kenya’s Real estate residential sector, with some of the factors expected to drive developments in the sector being rapid infrastructure developments promoting investments, and, project partnership strategies such as Joint Ventures and Public Private Partnerships.
- Retail Sector
During the week, Java House, an international restaurant chain, announced plans to open five new outlets in the country by October 2022. The new outlets will be distributed as follows: two at Nairobi’s Jomo Kenyatta International Airport, one at Mombasa’s Moi International Airport, one in Nairobi’s Eastleigh, and, one in Machakos town. This will bring the retailer’s total operating outlets to 87 in East Africa, with 75 being in Kenya, a sign of the retailer’s massive appetite for Kenya’s retail market. The decision to open the new outlets is driven by:
- Increased demand for services in the market, evidenced by Kenya’s high urbanization and population growth rates of 4.0% p.a and 2.3% p.a, respectively, against the global average of 1.8% p.a and 1.0% p.a, respectively, as at 2020,
- Increase its footprint in the country amidst its need to grow, and,
- Need to step up competition from its rivals such as Art café and Café Java, among others.
In terms of performance, according to our Kenya Retail Report 2021, Nairobi recorded an average rental yield of 7.5% against a market average of 6.8% in 2021, whereas Mombasa’s average rental yield was at par with the average market yield of 6.8%. Additionally, Cytonn H1’2022 Markets Review highlights that satellite towns, where Machakos is categorized, recorded an average rent of Kshs 142 per SQFT against a market average of Kshs 170 per SQFT, thus the retailer is leveraging on affordability of retail spaces in the area for investments as well. The table below shows the retail performance in key urban cities in Kenya 2021;
|
Summary of Retail performance in key urban cities in Kenya 2021 |
|||
|
Region |
Rent (Kshs) 2021 |
Occupancy Rate |
Rental Yield |
|
Mount Kenya |
128 |
81.7% |
7.9% |
|
Nairobi |
168 |
75.8% |
7.5% |
|
Mombasa |
119 |
77.6% |
6.8% |
|
Kisumu |
101 |
74.6% |
6.4% |
|
Eldoret |
131 |
80.8% |
6.3% |
|
Nakuru |
59 |
80.0% |
6.1% |
|
Average |
118 |
78.4% |
6.8% |
Source: Cytonn Research
Kenya’s Real Estate retail sector is expected to record increased activities that in turn boosts its performance. This will be mainly fueled by; i) the rapid expansion drive by local and international retailers such as Naivas, Eatn’Go Limited, and Java among others, ii) recognition of Kenya as a regional hub thereby attracting massive investments, and, iii) the ease of doing business in the country. However, setbacks such as e-commerce still being adopted by some retailers, coupled with the existing oversupply of retail spaces is expected to weigh down the optimum performance of the sector. The oversupply in the retail sector is currently 3.0 mn SQFT in the Nairobi Metropolitan Area, and 1.7 mn SQFT in Kenya at large.
- Hospitality Sector
During the week, global five-star hotel Fairmont Mount Kenya Safari Club located in Nanyuki, resumed activities after having been closed for more than two years, following the onset of Covid-19 pandemic that caused cashflow challenges. This comes barely three months after Nairobi’s Fairmont Norfolk, and Radisson Blu hotels resumed operations in April and May 2022, respectively, and Fairmont Mara Safari Club in September 2021. This signifies the normalcy that has been regained in the hospitality sector that was one of the worst hit economic sectors in the country with the onset of the pandemic. Some of the factors that drove the reopening of the hotel includes; i) the lowered pandemic restrictions, ii) lifting of flight bans which boosted tourism arrivals int the country, iii) increasing tourism and leisure activities in the country, and, iv) increasing vaccination activities boosting visitor arrivals and investor confidence in the sector.
We expect the hospitality sector to continue recording more activities that in turn boosts its overall performance. According to Central Bank of Kenya’s Monetary Policy Committee Hotels Survey May 2022, average hotel bed occupancy in the month of May came in at 55.0 %, 4.0% points higher than 51.0% recorded in the of April 2022 indicating an improvement in the sector. Moreover, KNBS’ Q1’2022 GDP report highlights that the sector grew by 56.2% in Q1’2022, 89.2% points increase from a contraction of 33.0% recorded in Q1’2021, a sign of the bouncing back. We expect the performance to be further boosted by; i) continuous roll out of COVID-19 vaccine which in turn boost tourism confidence and arrival into the country, ii) annual world rally championship program boosting hotel and serviced apartments occupancies, iii) Positive accolades such as the 28th World Travel Awards winners, where Nairobi was voted as Africa’s leading business travel destination, and, iv) the aggressive marketing of Kenya’s tourism sector via the Magical Kenya Platform, and, Kenya Tourism Board.
- Infrastructure Sector
During the week, the national government through the Kenya National Highway Authority (KeNHA) announced plans to revamp the Thika-Garissa highway into a dual carriageway, at an estimated cost of Kshs 5.5 bn. Dualling of the 15.0 Km Road which begins from the Thika Superhighway and stretches to Makongeni, Kissi and Gatuanyanga areas is expected to kick off by October 2022. Additionally, the national government through KeNHA awarded three Chinese firms a project tender worth Kshs 15.9 bn, to rehabilitate the Kisumu-Chemelil-Muhoroni road. The three firms constructing the 63.0 Km Road project that already commenced in June 2022 include;
- China Railways Tenth Group which will construct Lot I of the project which runs from Mamboleo junction to Miwani, at a cost of Kshs 5.1 bn,
- Sinohydo Company Limited which will construct Lot II of the project which runs from Miwani to Chemelil, at a cost of Kshs 5.0 bn, and,
- H-Young Company Limited which will construct Lot III of the project which runs from Chemelil to Kipsitet, at a cost of Kshs 5.7 bn.
Upon the completion of both projects, they are expected to; i) reduce traffic snarl-ups, ii) further open up areas for Real Estate investments, and, iii) promote trade activities in the surrounding areas.
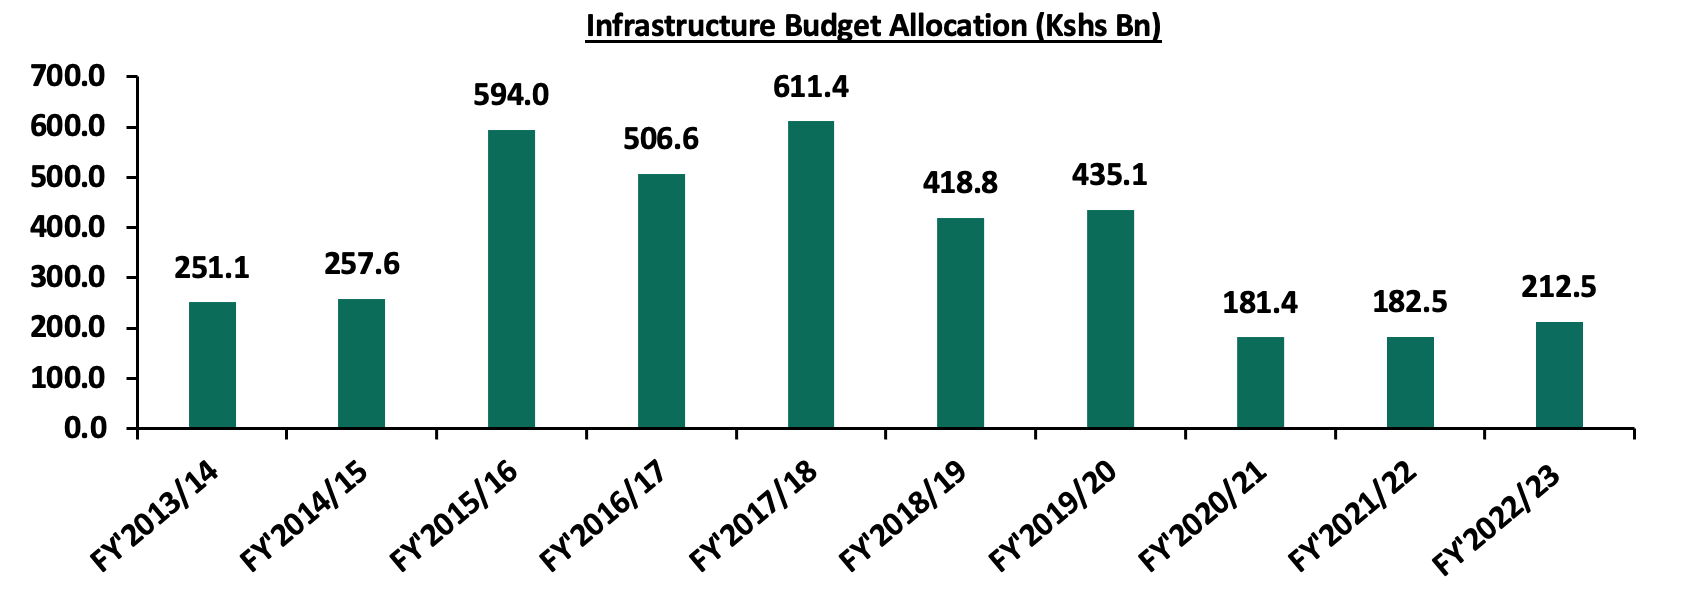
The government continues to be aggressive towards the implementation and development of quality and adequate roads to make Kenya an intra-regional hub for trade in East Africa in the country, as also evidenced by the various projects initiated and ongoing such as; i) Nairobi Commuter Rail project, ii) Nairobi-Nakuru Highway project, iii) Standard Gauge Railway Phase 2A, and, iv) Nairobi Western Bypass, among other key projects. We expect a similar trend to continue taking shape in the country bearing in mind that infrastructure is a key factor boosting performance of Real Estate market, with some of the strategies the government has used in order to realize it objectives being; i) project partnerships such as PPPs and JVs, ii) floating of infrastructure bonds in order to raise construction funds, and, iii) high priority in the budget allocations, with the sector having been allocated Kshs 212.5 bn in the FY’2022/2023 Budget Statement, which is a 6.4% representation of the Kshs 3.3 tn total budget. The graph below shows the budget allocation to the transport sector over last ten financial years;
- Listed Real Estate
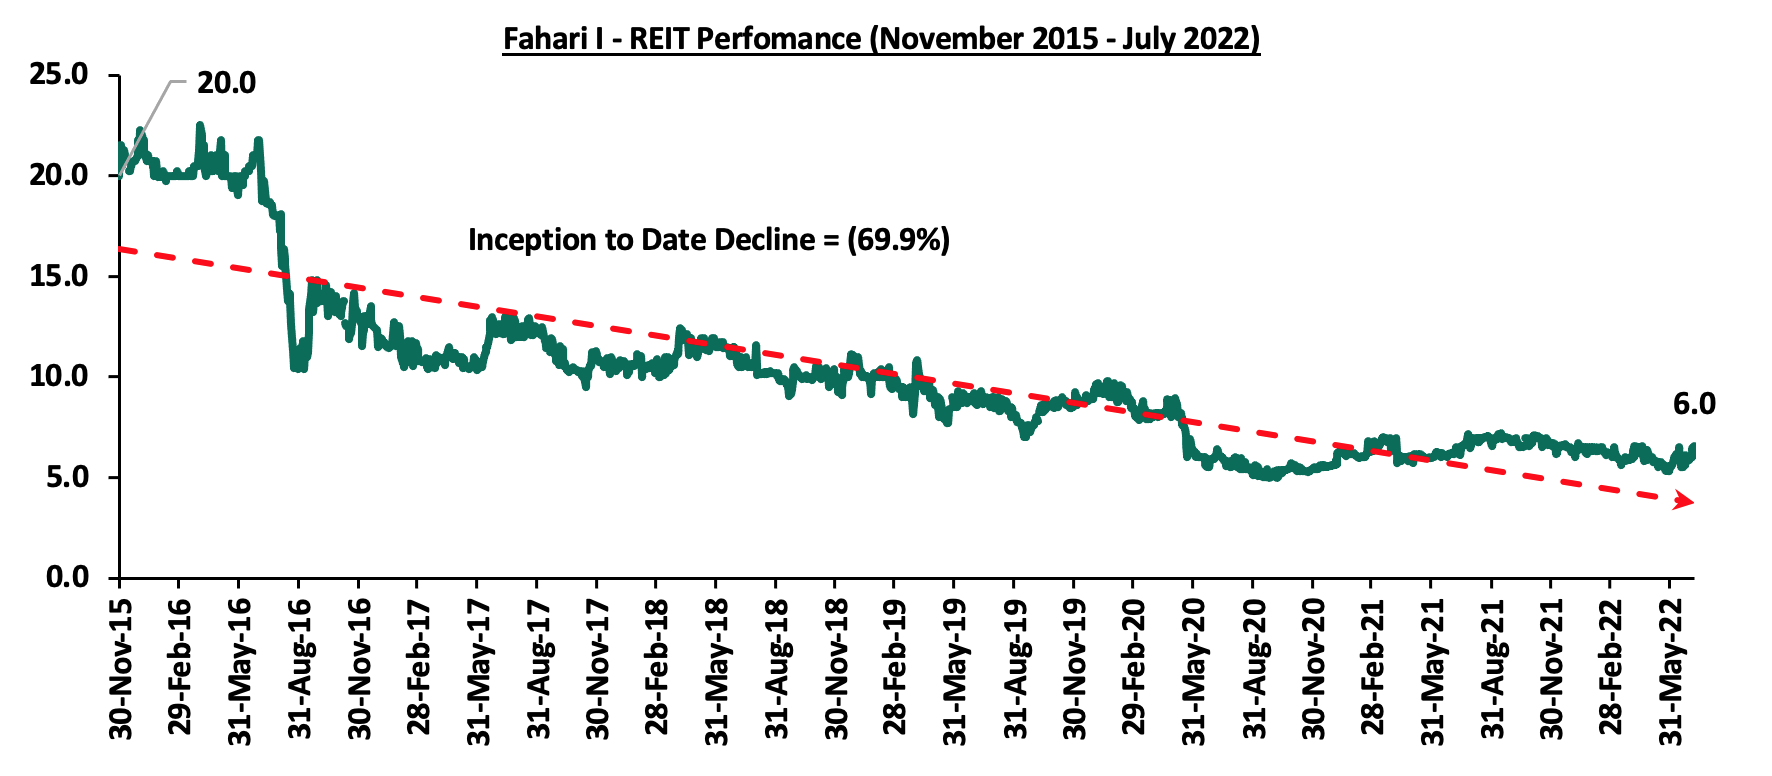
In the Nairobi Stock Exchange, ILAM Fahari I-REIT closed the week trading at an average price of Kshs 6.0 per share, a similar price as last week as well. On a Year-to-Date (YTD) and Inception-to-Date (ITD) basis, the REIT’s performance continues to be weighed down having realized a 5.9% and 69.9% decline, respectively, from Kshs 6.4 and Kshs 20.0, respectively. The graph below shows Fahari I-REIT’s performance from November 2015 to July 2022:
We expect Kenya’s property market to continue being shaped by; increasing investor confidence in Kenya’s housing, retail, and, hospitality markets, coupled with government’s aggressiveness towards infrastructural developments particularly roads which open areas for investments. However, setbacks such as financial constraints further fueled by the increasing construction costs, and, investor’s minimal appetite for the REIT instrument is expected to continue weighing down the overall investments in REITs.
Eurobonds are fixed income debt instruments denominated in a currency other than the currency in which the bonds are issued. Sub-Saharan Eurobonds, of which most are listed on the London and Irish stock exchanges, allow governments and corporations to raise funds by issuing bonds in a foreign currency. Majority of countries in the region issue Eurobonds to finance maturing debt obligations and heavy infrastructural projects.
Africa’s appetite for foreign-denominated debt has slowed down in 2022, with the only issuers being Nigeria and Angola who raised USD 1.3 bn and USD 1.8 bn in March and April 2022, respectively. The reduced issuance of Eurobonds is on the back of increasing yields, as investors demand more compensation due to increasing inflationary pressures across most African countries. Key to note, the region’s continued economic recovery has been dented by surging fuel and food prices that have strained the external and fiscal balances of commodity importing countries. In order to finance their fiscal deficits as well as existing debt, the countries in the region are expected to return to the market for further issuance.
We have previously covered a topical on the “Sub-Saharan Africa (SSA) Eurobonds: 2019 Performance” in January 2020, where we expected the Eurobond yields to stabilize mainly on the back of loosened monetary policy regimes in advanced countries. Additionally, we did a note on “Sub-Saharan Africa Q3’2021 Eurobonds Performance” in September 2021, where we expected yields to rise given the resurgence in the number of Covid-19 infections in many countries in the region. This week we analyze the Sub-Saharan Africa (SSA) Eurobond performance so far in 2022, given the significantly rising yields. The analysis will be broken down as follows:
- Background of Eurobonds in Sub Saharan Africa,
- Eurobond Performance in Sub-Saharan Africa,
- Debt Sustainability in the Sub-Saharan African region, and,
- Outlook on SSA Eurobonds Performance.
Section I. Background of Eurobonds Issued in Sub-Saharan Africa
Collectively, in H1’2022, only two countries in the Sub-Saharan Region issued Eurobonds, raising a collective USD 3.0 bn. The new instruments attracted investors’ interest with both issues recording an oversubscription of 2.6x, underlining the sustained investor confidence in the African debt market.
Nigeria became the first African nation to access funds from the International Capital Market (ICM) after issuing a Eurobond in March 2022, raising an equivalent total of USD 1.3 bn. The issue had a tenor of 7.0 years, and a coupon rate of 8.4%. The issue received bids worth USD 3.7 bn translating to a 2.9x subscription rate as the government sought to raise funds for budgeted capital intensive infrastructural projects, strengthen economic recovery and boost the country’s level of external reserves. Angola also went in to the market by issuing a 10.0 year Eurobond that raised USD 1.8 bn, with a coupon rate of 8.8%. The issue received bids worth USD 4.0 bn translating to a 2.3x subscription rate with the government intending to use USD 750.0 mn to buy back existing Eurobonds due in 2025 and 2028 as well as finance the country’s budget. The table below summarizes the two Eurobonds issued in 2022 so far:
|
Country |
Amount Issued USD bn |
Issue Tenor (yrs) |
Issue Date |
Maturity Date |
Coupon |
Yield at Issue Date |
Subscription Rate |
Yield as at 30th June 2022 |
Yield Change (% points) |
|
Nigeria |
1.25 |
7.0 |
18-Mar-22 |
9-Mar-29 |
8.4% |
8.4% |
2.9x |
10.9% |
2.5% |
|
Angola |
1.75 |
10.0 |
8-Apr-22 |
26-Mar-32 |
8.8% |
8.8% |
2.3x |
9.4% |
0.6% |
|
H1’ 2022 Issues |
3.0 |
8.5 |
- |
- |
8.6% |
8.6% |
2.6x |
10.2% |
1.6% |
|
H1’ 2021 Issues |
6.1 |
- |
- |
- |
- |
- |
3.8x |
- |
- |
Key take-outs:
- The region’s H1’2022 issues raised USD 3.0 bn, compared to USD 6.1 bn raised over a similar period in 2021, a decline of 49.3%, due to heightened risk perception which has pushed up interest rates and caused yields on previously issued bonds to rise significantly making issuing more expensive for Sub-Saharan countries and made governments across the continent opt against further issuance including Kenya,
- The issues in 2022 recorded an average oversubscription of 2.6x, lower than the 3.8x oversubscription recorded in H1’2021. The oversubscription underlines the continued demand by premium investors to hold riskier assets coupled with high yields offering to investors by Sub-Saharan countries,
- Since issuance in March 2022, the yields on the Nigeria 7-year Eurobond issue have increased by 2.5% points to 10.9% as at 30th June 2022, from the 8.4% recorded on 18th March, 2022. The rise in the Eurobond yields has been driven by the high perceived risk as well as reduced attractiveness on the country’s and other emerging markets Eurobonds due to the hike in US interest rates targeting to curb the rising inflation which has led to increased costs borrowing. This has led to a decline in foreign-debt issuance, and,
- The Angola’s 10-year issue comes after IMF’s 3-year support program totaling USD 4.5 bn elapsed in December 2021. The program aimed at restoring Angola’s external and fiscal sustainability, which left the economy in a good shape. Consequently, the Eurobond recorded an oversubscription of 2.3x, an indication of improved investor confidence in Angola’s economy.
Section II: Analysis of Existing Issues
Yields on select SSA Eurobonds were on an upward trajectory both year on year (y/y) and Year to Date (YTD). The significant increase in the yields is partly attributable to investors attaching higher risk premium on the Sub-Saharan region and other emerging markets due to heightened perceived risks arising from increasing inflationary pressures and local currency depreciation. Further, the region is expected to record slower economic growth of 3.8% in 2022 as compared to 4.5% growth estimates recorded in 2021. The slowdown is mainly on the back of supply chain disruptions brought about by the pandemic as well as the persistent Russian-Ukrainian geopolitical pressures coupled with high debt levels and wider fiscal deficits. The table below highlights the recent performance of select African Eurobonds:
|
Yield Changes in Select SSA Eurobonds Issued Before 2022 |
|||||||||
|
Country |
Issue Tenor (yrs) |
Issue Date |
Maturity Date |
Coupon |
Yield as at June 2021 |
Yield as at Jan 2022 |
Yield as at June 2022 |
y/y change (%Points) |
YTD change (%Points) |
|
Benin |
6 |
Jun-19 |
Jun-26 |
5.8% |
3.7% |
3.7% |
6.3% |
2.6% |
2.5% |
|
Benin |
31 |
Jan-21 |
Jan-52 |
4.9% |
6.5% |
6.9% |
10.3% |
3.7% |
3.4% |
|
Ivory Coast |
11 |
Feb-21 |
Dec-32 |
4.8% |
5.6% |
5.6% |
9.3% |
3.6% |
3.7% |
|
Ivory Coast |
12 |
Nov-20 |
Jan-32 |
4.9% |
4.9% |
5.3% |
9.4% |
4.5% |
4.1% |
|
Senegal |
30 |
Mar-18 |
Mar-48 |
4.8% |
6.6% |
6.9% |
11.0% |
4.3% |
4.1% |
|
Benin |
11 |
Jan-21 |
Jan-32 |
4.9% |
4.8% |
5.1% |
9.4% |
4.6% |
4.3% |
|
Kenya |
30 |
Feb-18 |
Feb-48 |
8.3% |
7.4% |
8.0% |
13.7% |
6.3% |
5.7% |
|
Kenya |
12 |
Jun-21 |
Jun-34 |
6.3% |
6.2% |
6.5% |
12.5% |
6.3% |
6.1% |
|
Senegal |
10 |
Jul-14 |
Jul-24 |
6.3% |
2.4% |
3.2% |
9.8% |
7.4% |
6.6% |
|
Kenya |
12 |
May-19 |
May-32 |
8.0% |
6.3% |
6.7% |
13.3% |
7.0% |
6.6% |
|
Zambia |
12 |
Jul-15 |
Jul-27 |
9.0% |
19.3% |
14.8% |
22.8% |
3.5% |
8.0% |
|
Ghana |
10 |
Jul-13 |
Jul-23 |
7.9% |
4.0% |
7.6% |
16.0% |
12.0% |
8.4% |
|
Kenya |
8 |
May-19 |
May-27 |
7.0% |
5.0% |
5.7% |
14.3% |
9.3% |
8.6% |
|
Kenya |
10 |
Feb-18 |
Feb-28 |
7.3% |
5.3% |
5.7% |
14.6% |
9.3% |
8.9% |
|
Ghana |
7 |
Nov-20 |
Nov-27 |
6.4% |
6.2% |
10.4% |
21.4% |
15.2% |
11.0% |
|
Ghana |
7 |
Jul-21 |
May-29 |
7.8% |
7.3% |
11.1% |
22.4% |
15.1% |
11.3% |
|
Ghana |
6 |
Sep-16 |
Sep-22 |
9.3% |
4.7% |
8.0% |
20.2% |
15.6% |
12.2% |
|
Kenya |
10 |
Jun-14 |
Jun-24 |
7.3% |
3.3% |
4.4% |
17.0% |
13.7% |
12.6% |
|
Ghana |
4 |
Jul-21 |
Jul-25 |
5.8% |
6.7% |
13.3% |
27.6% |
20.9% |
14.3% |
|
Zambia |
10 |
Apr-14 |
Apr-24 |
8.5% |
26.3% |
19.1% |
39.0% |
12.7% |
19.9% |
Source: Reuters
From the table above,
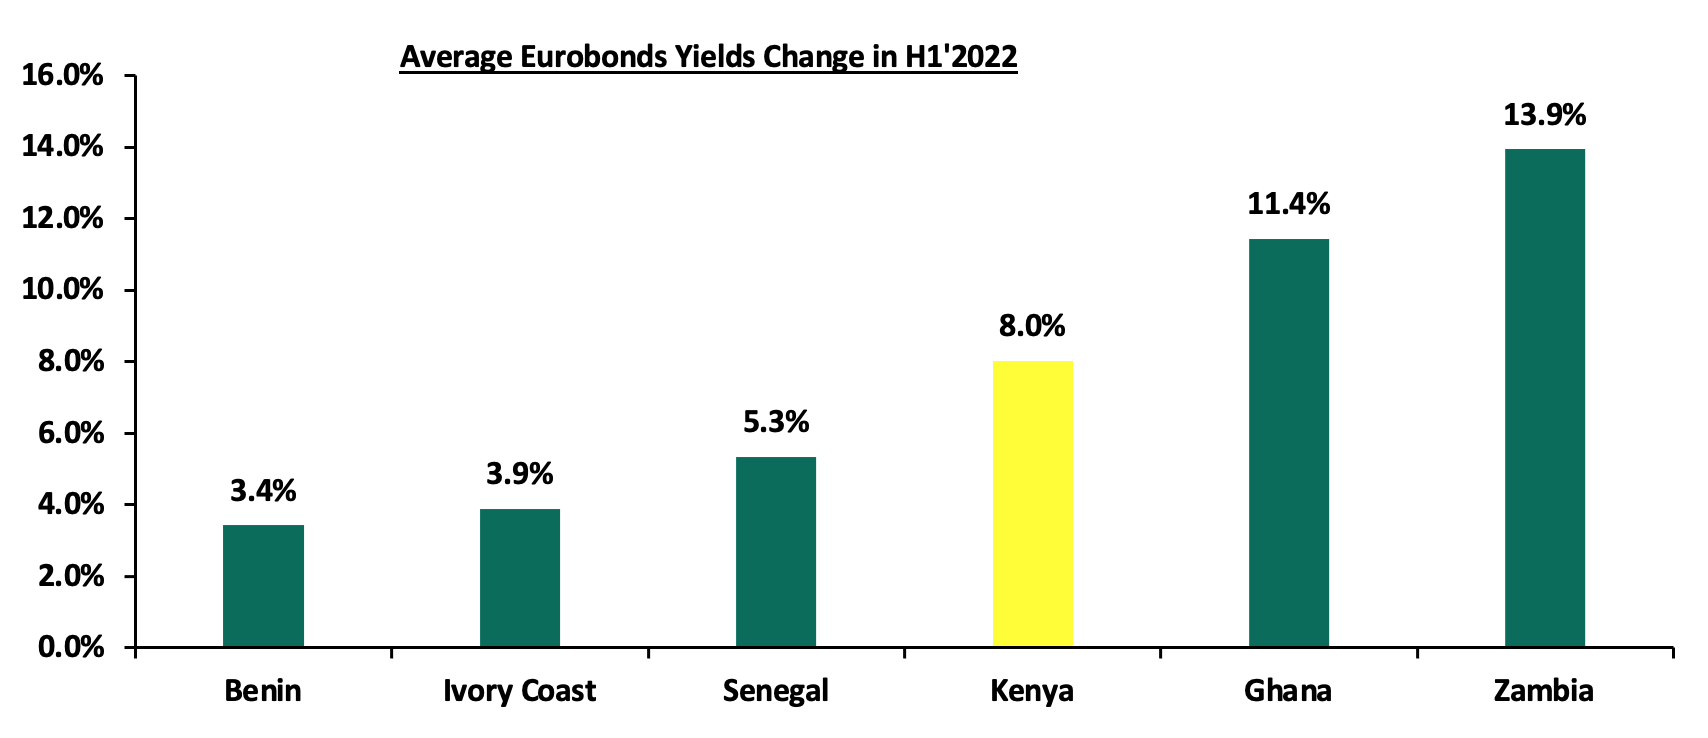
- Yields on the Zambia Eurobonds continued to rise at an average of 13.9% with yields of the 10-year Eurobond issued in 2014 increasing by 19.9% points to 39.0% in June 2022, from 19.1% at the beginning of the year. This is mainly attributable to the high risk attached to the country following its default on the USD 42.5 mn and USD 56.1 mn Eurobond debt in 2020 and 2021, respectively. Further, the country is still struggling with high debt levels which stood at 123.0% to GDP as at the end of 2021,
- Yields on Kenyan Eurobonds also recorded significant increases at an average of 8.0% with the 10-year Eurobond issued in 2014, increasing by 12.6% points to 17.0% in June 2022, from 4.4% recorded at the beginning of the year partly attributable to the heightened perceived risk stemming from inflationary pressures as well as uncertainties surrounding the August 2022 general election, and,
- Yields on the Benin’s Eurobonds recorded the least increase at an average of 3.4% with yields of the 6-year Eurobond issued in 2019 increasing by 2.5% points to 6.3% in June 2022, from 3.7% at the beginning of the year. This is mainly attributable to improved investor sentiment on Benin as a result of strong economic growth and low government debt to GDP ratio of 50.6% at the end of 2021, which is significantly lower than most countries in the region.
The graph below summarizes the average YTD change in the Eurobond yields of select countries;
Source: Reuters
*Average yields increase calculated as an average of the Country’s Eurobonds yields increase
Since Eurobonds are denominated in foreign currency, the depreciation of a country’s local currency means that they will incur a relatively higher cost to purchase foreign currency used to service outstanding debt obligations. Below is a summary of the performance of the different resident currencies as at the end of June 2022:
|
Select Sub Saharan Africa Currency Performance vs USD |
|||||
|
Currency |
Jun-21 |
Jan-22 |
Jun-22 |
Last 12 Months change (%) |
H1’2022 change (%) |
|
Nigerian Naira |
410.5 |
412.4 |
415.1 |
(1.1%) |
(0.6%) |
|
South African Rand |
14.3 |
15.9 |
16.0 |
(12.1%) |
(0.9%) |
|
Tanzanian Shilling |
2319 |
2,304.5 |
2,330.5 |
(0.5%) |
(1.1%) |
|
Zambian Kwacha |
22.6 |
16.7 |
17.2 |
24.0% |
(2.6%) |
|
Mauritius Rupee |
42.7 |
43.6 |
45.0 |
(5.3%) |
(3.1%) |
|
Botswana Pula |
10.8 |
11.7 |
12.2 |
(12.8%) |
(3.8%) |
|
Kenyan Shilling |
107.9 |
113.2 |
117.8 |
(9.2%) |
(4.1%) |
|
Ugandan Shilling |
3556.8 |
3,544.6 |
3,749.5 |
(5.4%) |
(5.8%) |
|
Malawian Kwacha |
805.8 |
816.8 |
1,019.5 |
(26.5%) |
(24.8%) |
|
Ghanaian Cedi |
5.8 |
6.1 |
7.9 |
(35.9%) |
(29.1%) |
Source: S&P Capital
All the select currencies depreciated against the US Dollar in H1’2022 mainly due to the rising commodity prices given that most countries in the region are import-dependent economies. The Ghanaian Cedi recorded the worst performance having depreciated by 29.1% year to date. The performance is attributable to increased dollar demand since most economic activities in Ghana are recovering from the Covid-19 shock. Further, high government borrowing with Ghana’s public debt to GDP ratio reaching 81.8% in 2021 has put pressure on forex reserves to service some of the public debt. Similarly, the Kenya Shilling depreciated by 4.1% in 2022 to close June at Kshs 117.8 against the US Dollar, compared to Kshs 113.2 recorded at the beginning of the year. Going forward, we expect continued depreciation of the local currencies given the continued rise in global crude oil prices following supply chain disruptions arising from the Russia’s invasion of Ukraine.
Section III: Debt Sustainability in the Sub-Saharan Africa Region
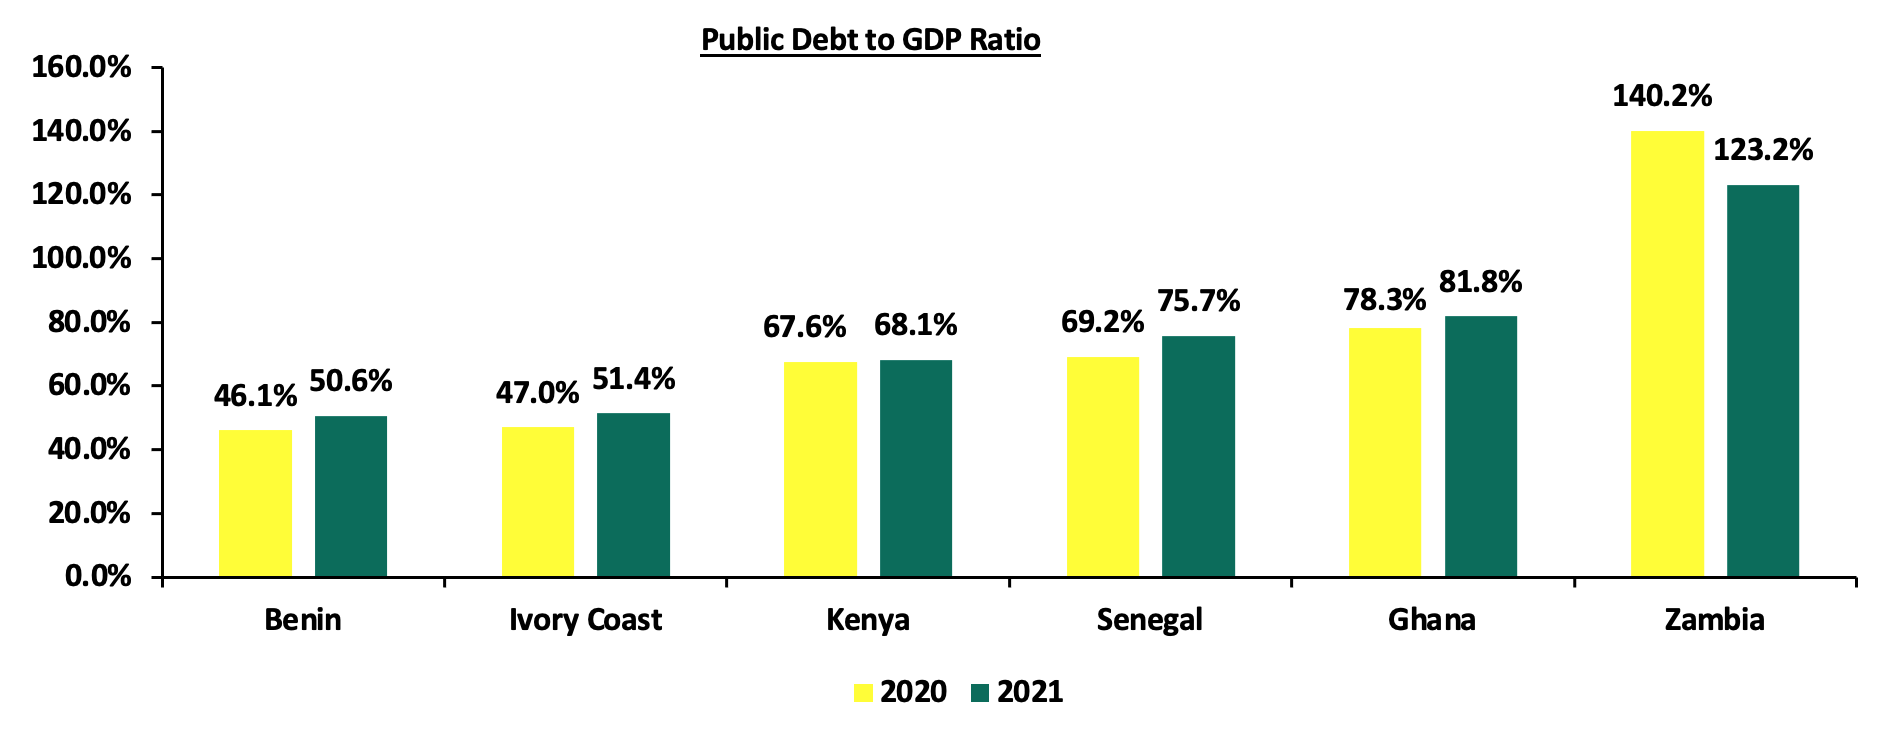
For the African countries, rising public debt levels and increased debt vulnerabilities were already a concern in most countries prior to the onset of the COVID-19 pandemic. However, the pandemic posed unprecedented challenges to low- and middle-income countries increasing financing needs and thus public borrowing. This saw a weakening of individual countries' economic fundamentals and capacity to service and repay their existing public debt. Below is a summary of public debt to GDP ratios of the select Sub-Saharan African countries:
Source: IMF
From the graph above the key take outs include;
- Public debt to GDP ratio for all the select countries increased in 2021 with the exception of Zambia. Zambia’s public debt to GDP ratio stood at 123.2% in 2021, a decrease from 140.2% in 2020. The high ratios reflect Zambia’s indebtedness with outstanding foreign debt including USD 3.0 bn in international bonds, USD 2.1 bn to multilateral lending agencies such as the IMF and USD 3.0 bn to China and Chinese entities. In 2020 and 2021, Zambia failed to make Eurobonds interest payment totaling USD 98.6 bn. Consequently, in April 2022, Fitch Ratings affirmed Zambia's Long-Term Foreign-Currency Issuer Default Rating (IDR) at 'RD’. Despite deterioration of the debt sustainability ratings, Zambia is expected to restructure its debt before the end of 2022 after securing a staff level agreement with the IMF on a USD 1.4 bn under the Extended Credit Facility (ECF) programme,
- Kenya’s public debt to GDP has grown to 68.1% as at the end of 2021. The increase in debt stock has been partly driven by huge spending on large infrastructure projects as well as widening fiscal deficit, which was at 8.1% of GDP in FY’2021/2022. Concerns are also high on the progressive shift of the debt portfolio in favor of expensive commercial loans and the bilateral loans comprising 50.1% of the total debt. IMF downgraded the country’s risk of external debt distress from moderate to high on the account of elevated vulnerabilities instigated by the Covid-19 crisis. Kenya’s debt-carrying capacity was also downgraded by the IMF from strong to medium in 2021, coupled with Fitch Ratings affirmation of Kenya's Long-Term Foreign-Currency Issuer Default Rating (IDR) at 'B+' with a Negative Outlook,
- Ghana’s total public debt has grown at a 5-year CAGR of 14.9% to USD 58.6 bn in 2021, from USD 29.2 bn in 2016 making the country classified as being at high risk of debt distress as the country struggles to service its debts. The public debt to GDP ratio stood at 81.8% in 2021 and is projected to rise further to 84.6% in 2022. The continued increase in the public debt stock has largely been driven by the continuous accumulation of budget deficits, the currency depreciation and off-budget borrowings. In January 2022, Fitch Ratings downgraded Ghana's Long-Term Foreign-Currency Issuer Default Rating (IDR) to 'B-' from 'B' and affirmed a Negative Outlook in May 2022 mainly attributable to existing macroeconomic imbalance. Ghana faces the risk of being locked out of international debt markets due to inflationary concerns making it urgent for the government to seek an IMF debt-relief program before public finances deteriorate further. Depreciating currency has also worsened debt repayment due to high interest rates amid slowed fiscal consolidation in Ghana.
Section IV: Outlook on SSA Eurobonds Performance
- Yields will continue to rise: From the analysis, most of the Eurobond yields in Sub-Saharan Africa increased in 2022, attributable to economic performance uncertainties, with investors attaching a higher risk premium on the region and increased interest in the developed economies. Notably, the debt levels in Sub-Saharan Africa has been on the rise mainly due to fiscal deficits given inflated import bills and widening trade deficit as oil prices continue to rise. To bridge the fiscal deficit gap, some countries have been forced to re-enter the international fixed income market to raise funds to fund their budget deficits as well as refinance existing debt obligations as seen by Angola’s issue in March 2022 to partly repay part of the 2025 and 2028 Eurobonds,
- Public Debt to GDP levels are elevated and will continue to increase: High public debts in Sub-Saharan Africa continue to raise sustainability concerns as many countries face the risk of losing access to the international financial markets. Public debt in the region has recorded significant growth and as per World Bank’s Africa’s Pulse April 2022, the region’s public debt to GDP ratio increased to 61.0% in 2021, from 60.0% in 2020. The public debt is expected to increase in most countries following tightened global financial conditions arising from policy rates increases in the developed economies. Additionally, many countries are providing subsidies in order to mitigate inflationary pressures which could worsen public finances further, increase public debt and weigh down on the debt sustainability, and,
- Rising yields and Debt levels raises Debt Sustainability concerns: Debt sustainability in the SSA continues to be a major concern given the high debt burden as well as the change in the composition of the regions public debt profile to sovereign bonds. Countries with a higher debt service and riskier debt profiles are expected to face debt sustainability issues. According to the IMF’s Regional Economic Outlook: Sub-Saharan Africa, April 2022, six countries were in debt distress with fourteen being at high risk of falling into debt distress in 2022. This is due to significant shortfalls in revenue collection and depreciating local currencies which in turn make debt servicing more expensive. We expect continued deterioration of the region’s debt sustainability given the rising sovereign and corporate spreads as well as debt servicing costs which in turn could lead to a series of defaults.
Conclusion: With rising public debt and debt sustainability concerns, SSA countries are faced with one of two choices, either restructure the existing debt or restructure their economies to be more productive to service the existing debt even as they reduce future borrowings.
Disclaimer: The views expressed in this publication are those of the writers where particulars are not warranted. This publication, which is in compliance with Section 2 of the Capital Markets Authority Act Cap 485A, is meant for general information only and is not a warranty, representation, advice or solicitation of any nature. Readers are advised in all circumstances to seek the advice of a registered investment advisor.

- Talk to us
- Kenya
- P.O Box 20695 - 00200, Nairobi, Kenya
- Cell +254709101200
- Tel +254709101200
- WhatsApp +254741676635
- United States
- +254709101200
- DOWNLOAD OUR APP
-


- Kenya
- 8th Floor, Pinetree Plaza, Kaburu Drive, Ngong Road, Nairobi, Kenya
- USA
- Suite 1150, 1775 Eye Street NW, USA, Washington DC 20006, USA
- Investments
- High Yield
- Private Equity
- Real Estate
- Real Estate
- RiverRun Estates
- Cytonn Towers
- The Ridge
- Taraji Heights
- The Alma