Understanding Collective Investment Schemes, & Cytonn Weekly #39/2020
By Research Team, Sep 27, 2020
Executive Summary
Fixed Income
During the week, T-bills were undersubscribed, with the subscription rate coming in at 29.7%, down from 70.4% the previous week, this can be attributed to the tightening liquidity conditions in the money markets as can be seen from the rise in with the average interbank rate which was at 3.3%, from the 2.7% recorded the previous week. The highest subscription rate was in the 364-day paper, which came in at 47.3%, down from 89.2% recorded the previous week. The subscription for the 91-day and 182-day paper also fell to 28.0% and 12.7%, respectively from 151.3% and 19.2% recorded the previous week. The yields on the 91-day paper remained unchanged at 6.3%, while that of the 182-day and 364-day paper increased marginally to 6.8% and 7.7%, respectively from the 6.7% and 7.6% recorded the previous week. We are projecting the y/y inflation rate for the month of September to increase marginally to between 4.6% - 4.9%, compared to the 4.4% recorded in August, due to the increases in food and fuel prices;
Equities
During the week, the equities market was on an upward trajectory, with NSE 20 recording marginal gains of 0.01%, while both NASI and NSE 25 gained by 0.1%, taking their YTD performance to losses of 15.6%, 20.9%, and 30.4%, for NASI, NSE 25 and NSE 20, respectively. The performance was driven by gains recorded by large-cap stocks, with the highest gains being recorded in BAT, NCBA Group, KCB Group and ABSA, which gained by 6.4%, 3.8%, 2.6% and 1.6%, respectively. The gains were however weighed down by declines in Bamburi and Diamond Trust Bank (DTB-K) which were both down by 4.0%.
Real Estate
During the week, NCBA Bank Kenya Plc, partnered with Tatu City, an urban developer in Kenya, to provide mortgage facilities to home buyers within their mixed-use development. In the retail sector, the management of the Waterfront Mall Karen and Naivas Supermarket signed an agreement which will see the retail chain open an outlet at the mall taking up space that was previously occupied by Shoprite as the anchor tenant. Additionally, French retailer Carrefour, announced plans to open three outlets in Mombasa;
Focus of the Week
The Capital Markets Authority recently updated its guidelines with regards to how performance reporting for collective investment schemes (CIS) is carried out. Putting this into consideration, we felt the need to shed some light on the collective investment industry. This week we shall be covering the industry’s performance and what its drivers are;
- Weekly Rates:
- Cytonn Money Market Fund closed the week at a yield of 10.5%. To invest or withdraw, just dial *809#;
- Cytonn High Yield Fund closed the week at a yield of 12.6% p.a. To invest, email us at sales@cytonn.com and to withdraw the interest you just dial *809#
- For an exclusive tour of Cytonn’s real estate developments, visit: Sharp Investor's Tour and for more information, email us at sales@cytonn.com;
- We continue to offer Wealth Management Training daily, from 9:00 am to 11:00 am, through our Cytonn Foundation. The training aims to grow financial literacy among the general public. To register for any of our Wealth Management Training, click here;
- For Pension Scheme Trustees and members, we shall be having different industry players talk about matters affecting Pension Schemes and the pensions industry at large. Join us every Wednesday from 9:00 am to 11:00 am for in-depth discussions on matters pension;
- If interested in our Private Wealth Management Training for your employees or investment group, please get in touch with us through wmt@cytonn.com;
- For recent news about the company, see our news section here;
We have 10 investment-ready projects, offering attractive development and buyer targeted returns. See further details here: Summary of Investment-ready Projects.
Money Markets, T-Bills & T-Bonds Primary Auction:
During the week, T-bills remained undersubscribed, with the subscription rate coming in at 29.7%, down from 70.4% the previous week, this can be attributed to the tightening liquidity conditions in the money markets with the average interbank rate coming in at 3.3%, from the 2.7% recorded last week. The highest subscription rate was in the 364-day paper, which came in at 47.3%, down from 89.2% recorded the previous week. The subscription for the 91-day and 182-day paper also fell to 28.0% and 12.7%, respectively from 151.3% and 19.2% recorded the previous week. The yields on the 91-day paper remained unchanged at 6.3%, while that of the 182-day and 364-day paper increased marginally to 6.8% and 7.7%, respectively from the 6.7% and 7.6% recorded the previous week. The acceptance rate decreased to 93.4%, from 100.0% recorded the previous week, with the government accepting bids worth Kshs 6.7 bn out of the Kshs 7.1 bn worth of bids received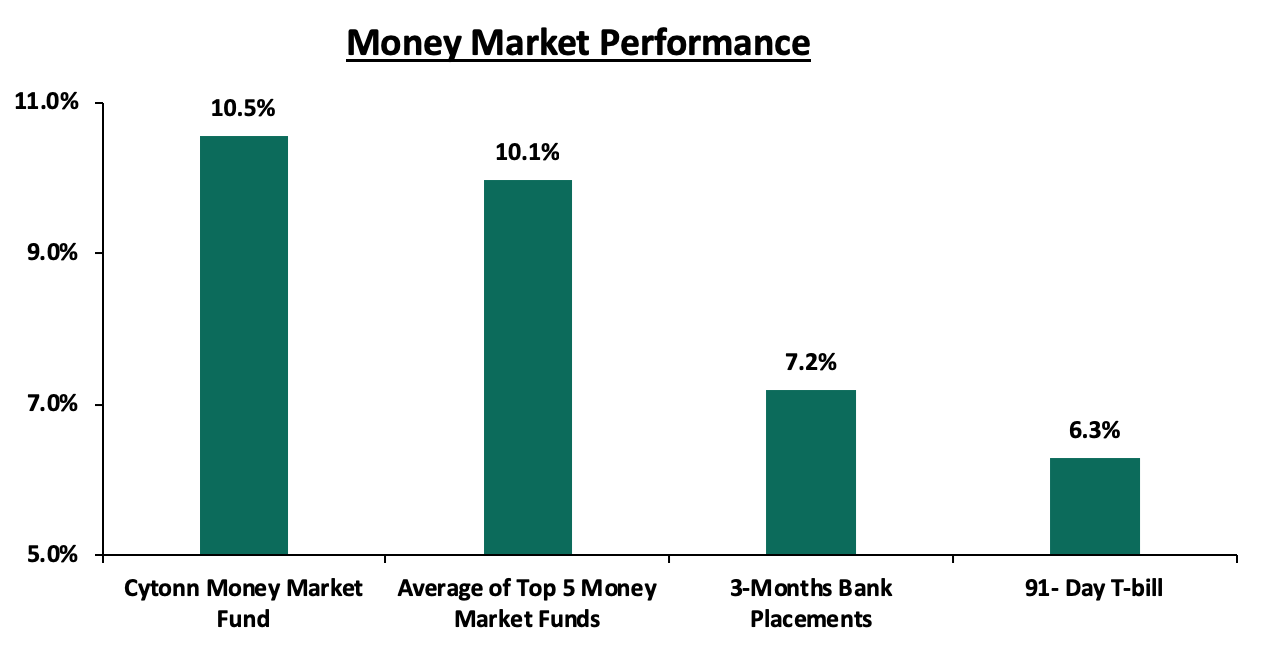
In the money markets, 3-month bank placements ended the week at 7.2% (based on what we have been offered by various banks), while the yield on the 91-day T-bill remained unchanged at 6.3%. The average yield of Top 5 Money Market Funds increased marginally to 10.1%, from 10.0% the previous week. The yield on the Cytonn Money Market declined marginally to close at 10.5%, down from the 10.6% recorded the previous week.
Liquidity:
The money markets tightened during the week, with the average interbank rate increasing to 3.3%, from 2.7% recorded the previous week, mainly supported by tax remittances which more than offset government payments. The average interbank volumes declined by 19.0% to Kshs 10.4 bn, from Kshs 12.8 bn recorded the previous week. According to the Central Bank of Kenya, commercial banks’ excess reserves came in at Kshs 14.1 bn in relation to the 4.25% Cash Reserve Ratio.
Kenya Eurobonds:
The yields on all Eurobonds increased significantly during the week, pointing to the perception of increased risk by foreign investors on the country’s outlook. During the week, according to Reuters, the yield on the 10-year Eurobond issued in June 2014 increased by 0.7% points to 6.2%, from 5.5% the previous week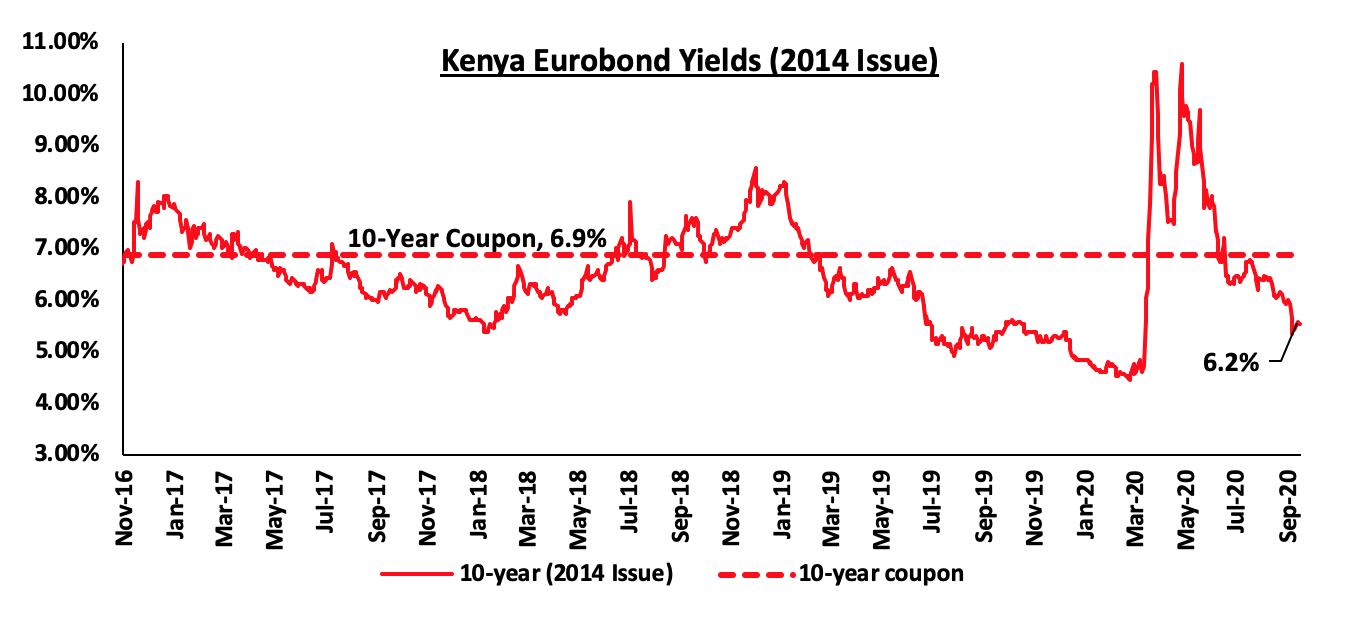
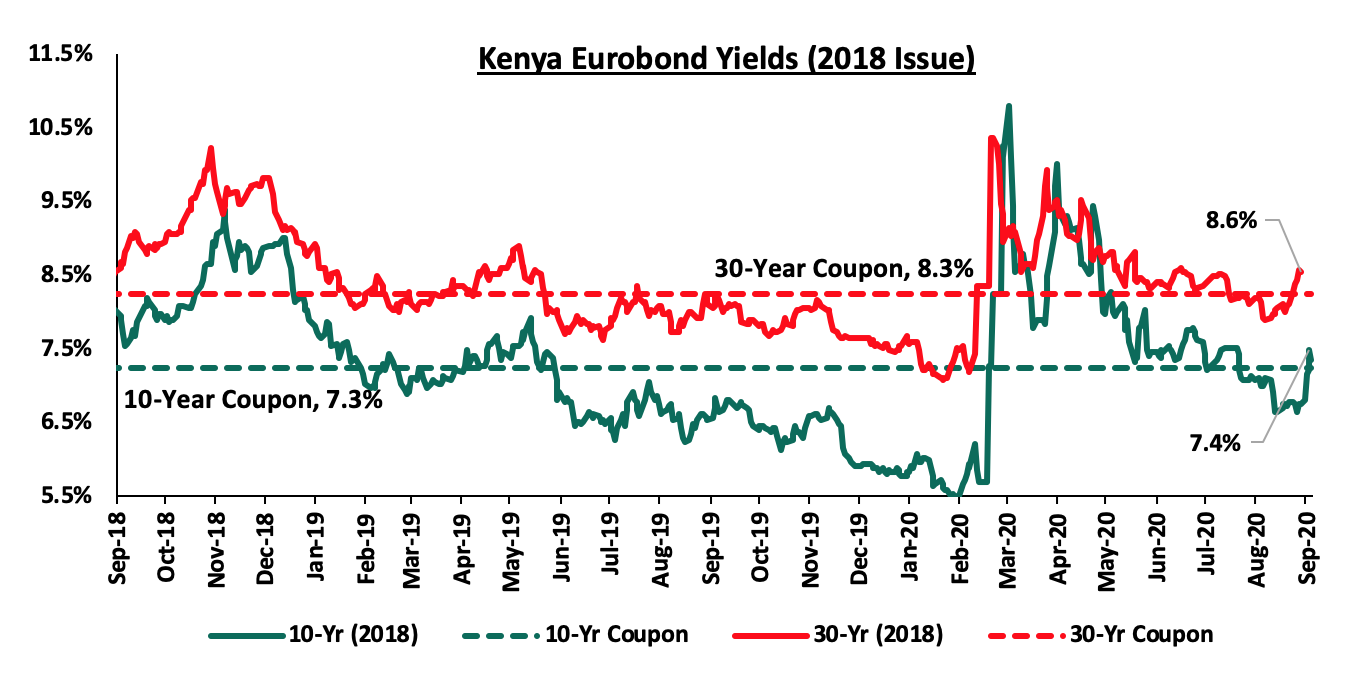
During the week, the yields on the 10-year and 30-year Eurobonds both increased by 0.6% and 0.5%, respectively to close at 7.4% and 8.6%, from the 6.8% and 8.1% recorded the previous week.
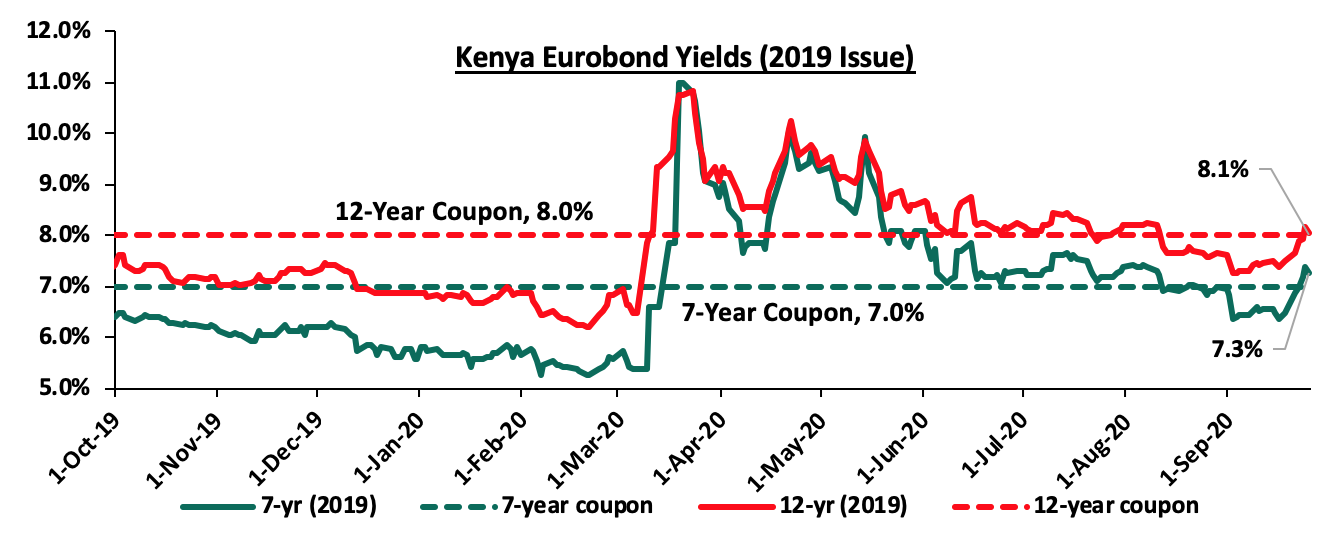
During the week, the yields on the 2019 dual-tranche Eurobond issue with 7-years increasing by 0.8% points to 7.3%, from 6.5% the previous week. The 12-year Eurobond also increased by 0.6% points to close at 8.1%, from the 7.5% recorded the previous week.
Kenya Shilling:
During the week, the Kenyan shilling depreciated marginally by 0.1% against the US dollar, to close at Kshs 108.5, from Kshs 108.4 recorded the previous week, mainly attributable to the build-up of dollar demand ahead of the end of the month when firms typically meet their hard currency obligations. On a YTD basis, the shilling has depreciated by 7.0% against the dollar, in comparison to the 0.5% appreciation in 2019.
In the short term, the shilling is expected to be supported by:
- The high levels of forex reserves, currently at USD 8.6 mn (equivalent to 5.2-months of import cover), above the statutory requirement of maintaining at least 4.0-months of import cover, and the EAC region’s convergence criteria of 4.5-months of import cover;
- Relatively strong Diaspora remittances that increased by 27.9% to USD 274.1 million in August compared to USD 214.3 million in August 2019, despite being 1.0% lower than the USD 277.0 million in July 2020, leading to the narrowing of the country’s current account deficit to 4.7% of GDP in the 12 months to August 2020, similar to the level in July.
Inflation Projections
We are projecting the y/y inflation rate for September 2020 to increase marginally to between 4.6% - 4.9%, compared to the 4.4% recorded in August, supported by the gains from the stable food prices while fuel prices only increased marginally, specifically:
- Petrol prices having increased by 1.3%, while both diesel and kerosene have declined marginally by 0.1% and 0.6% respectively. The current pump prices are likely to have an upward pressure on the transport index which holds a weighting of 8.7%, since it has been on the increase in line with recoveries across the globe. Also, we expect the increased fuel prices to not only affect the transport index, but have a trickle-down effect on the prices of other commodity basket food prices due to higher transport costs, and,
- Food prices have remained relatively stable during the month given the favorable weather and an improvement in agricultural output.
Rates in the fixed income market have remained relatively stable due to the high liquidity in the money markets, coupled with the discipline by the Central Bank as they reject expensive bids. The government is 79.2% ahead of its prorated borrowing target of Kshs 121.6 bn having borrowed Kshs 217.9 bn. In our view, the government will not be able to meet their revenue collection targets of Kshs 1.9 tn for FY’2020/2021 because of the current subdued economic performance in the country brought about by the spread of COVID-19, and therefore leading to a larger budget deficit than the projected 7.5% of GDP, ultimately creating uncertainty in the interest rate environment as additional borrowing from the domestic market may be required to plug in the deficit. Owing to this uncertain environment, our view is that investors should be biased towards short-term to medium-term fixed income securities to reduce duration risk.
Market Performance
During the week, the equities market was on an upward trajectory, with NSE 20 recording marginal gains of 0.01%, while both NASI and NSE 25 gained by 0.1%, taking their YTD performance to losses of 15.6%, 20.9%, and 30.4%, for NASI, NSE 25 and NSE 20, respectively. The performance was driven by gains recorded by large-cap stocks, with the highest gains being recorded in BAT, NCBA Group, KCB Group and ABSA, which gained by 6.4%, 3.8%, 2.6% and 1.6%, respectively. The gains were however weighed down by declines recorded by stocks such as Bamburi and Diamond Trust Bank (DTB-K) which both declined by 4.0%.
Equities turnover declined by 33.1% during the week to USD 31.7 mn, from USD 47.4 mn recorded the previous week, taking the YTD turnover to USD 1.1 bn. Foreign investors turned net sellers during the week, with a net selling position of USD 3.6 mn, from a net buying position of USD 7.6 mn recorded the previous week, taking the YTD net selling position to USD 254.4 mn.
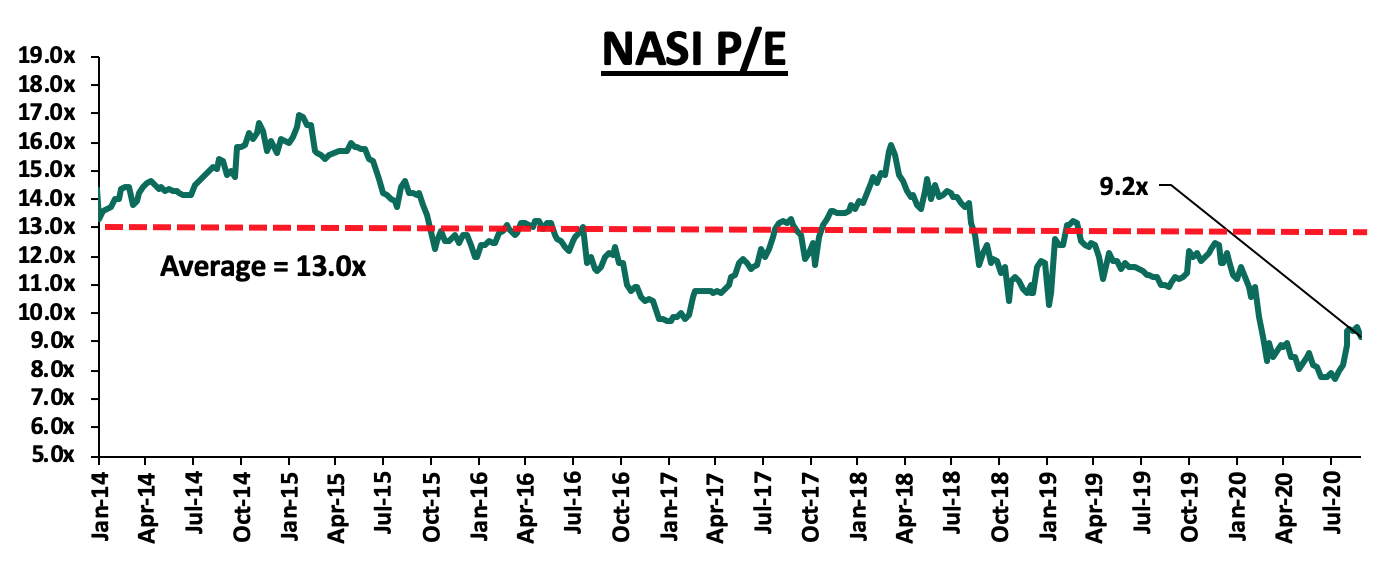
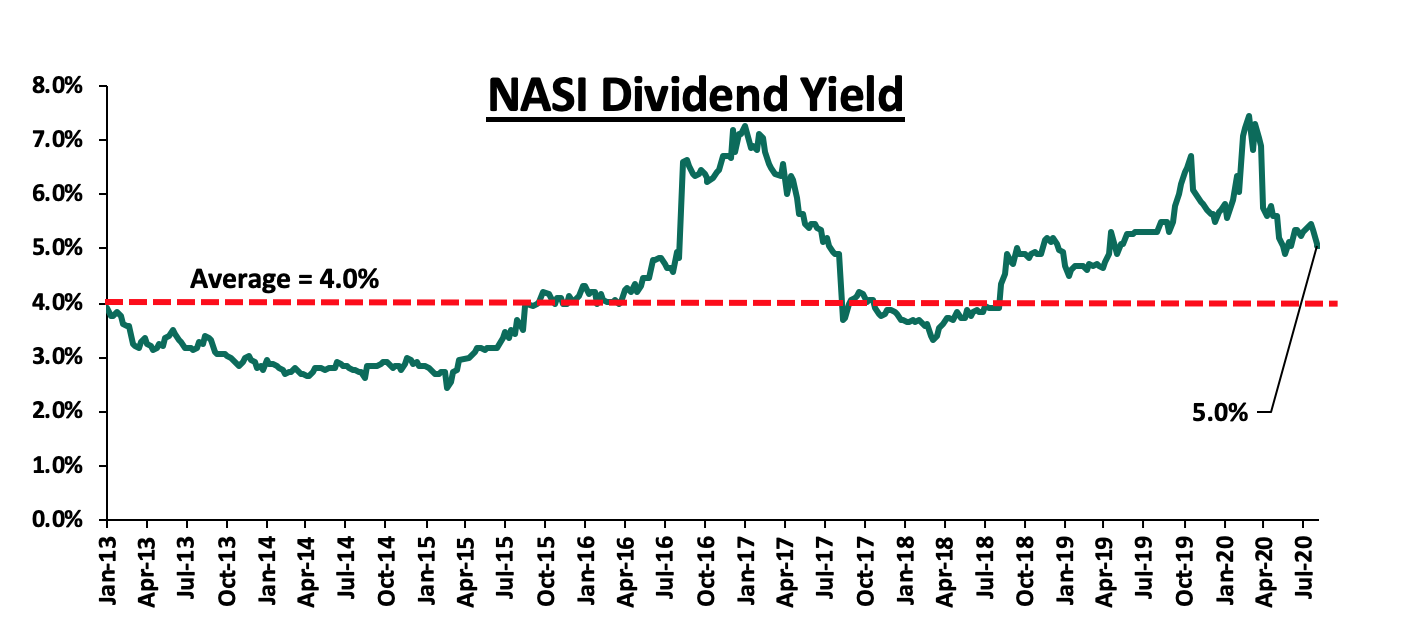
The market is currently trading at a price to earnings ratio (P/E) of 9.2, 29.5% below the 11-year historical average of 13.0x. The average dividend yield is currently at 5.0%, unchanged from the previous week and 1.0% points above the historical average of 4.0%.
With the market trading at valuations below the historical average, we believe there are pockets of value in the market for investors with higher risk tolerance and are willing to wait out the pandemic. The current P/E valuation of 9.2x is 19.1% above the most recent valuation trough of 7.7x experienced in the first week of August 2020. The charts below indicate the historical P/E and dividend yields of the market.
Universe of Coverage:
|
Company |
Price at 18/09/2020 |
Price at 25/09/2020 |
w/w change |
YTD Change |
Year Open |
Target Price* |
Dividend Yield |
Upside/ Downside** |
P/TBv Multiple |
Recommendation |
|
Diamond Trust Bank*** |
62.5 |
60.0 |
(4.0%) |
(42.7%) |
109.0 |
119.4 |
3.9% |
95.0% |
0.3x |
Buy |
|
Kenya Reinsurance |
2.2 |
2.3 |
4.5% |
(26.4%) |
3.0 |
4.0 |
4.6% |
84.0% |
0.2x |
Buy |
|
Sanlam |
12.3 |
13.1 |
6.5% |
(28.5%) |
17.2 |
18.4 |
0.0% |
49.6% |
1.2x |
Buy |
|
Jubilee Holdings |
220.0 |
220.0 |
0.0% |
(37.3%) |
351.0 |
313.8 |
3.6% |
46.2% |
0.5x |
Buy |
|
NCBA*** |
22.2 |
23.1 |
3.8% |
(39.8%) |
36.9 |
30.7 |
1.0% |
39.3% |
0.6x |
Buy |
|
I&M Holdings*** |
45.0 |
44.4 |
(1.3%) |
(16.7%) |
54.0 |
57.8 |
5.1% |
33.6% |
0.7x |
Buy |
|
KCB Group*** |
37.9 |
38.9 |
2.6% |
(29.8%) |
54.0 |
46.4 |
9.9% |
32.4% |
0.8x |
Buy |
|
Equity Group*** |
36.2 |
36.1 |
(0.1%) |
(32.4%) |
53.5 |
44.5 |
5.9% |
29.0% |
0.9x |
Buy |
|
Standard Chartered*** |
164.5 |
159.8 |
(2.9%) |
(18.8%) |
202.5 |
197.2 |
7.8% |
27.7% |
1.2x |
Buy |
|
Co-op Bank*** |
12.0 |
11.9 |
(0.8%) |
(26.6%) |
16.4 |
14.2 |
8.4% |
26.8% |
0.8x |
Buy |
|
Liberty Holdings |
8.0 |
7.8 |
(2.5%) |
(22.9%) |
10.4 |
9.8 |
0.0% |
22.8% |
0.6x |
Buy |
|
Stanbic Holdings |
75.0 |
76.0 |
1.3% |
(31.4%) |
109.3 |
84.9 |
9.0% |
22.2% |
0.6x |
Buy |
|
ABSA Bank*** |
9.8 |
10.0 |
1.6% |
(26.3%) |
13.4 |
10.8 |
12.0% |
21.7% |
1.2x |
Buy |
|
Britam |
7.4 |
7.2 |
(1.6%) |
(18.2%) |
9.0 |
8.6 |
3.3% |
20.2% |
0.8x |
Buy |
|
CIC Group |
2.2 |
2.1 |
(3.7%) |
(19.8%) |
2.7 |
2.1 |
0.0% |
(2.3%) |
0.7x |
Sell |
|
HF Group |
4.4 |
4.0 |
(8.2%) |
(32.4%) |
6.5 |
4.1 |
0.0% |
(6.2%) |
0.2x |
Sell |
|
*Target Price as per Cytonn Analyst estimates **Upside/ (Downside) is adjusted for Dividend Yield ***For Disclosure, these are banks in which Cytonn and/ or its affiliates are invested in |
||||||||||
We are “Neutral” on equities for investors because, despite the sustained price declines, which have seen the market P/E decline to below its historical average presenting investors with attractive valuations in the market, the economic outlook remains grim.
- Residential Sector
During the week, NCBA Bank Kenya Plc, partnered with Tatu City, a leading urban developer in Kenya, to provide mortgage facilities to home buyers within their mixed-use development. The partnership marks the second banking institution to partner with the Kiambu based mixed-use property developer after they signed an agreement with ABSA Bank Kenya in June 2020, to provide mortgage loans for home financing including insurance products. The partnership between NCBA and Tatu City will provide home owners with a variety of options including purchase of plots, construction financing and loans to buy and build. The mortgage financing, which will be available for both salaried and non-salaried individuals, is expected to be at an interest rate of 13.0% with a minimum deposit rate of 10.0% of the property value. Buyers purchasing land within the Tatu City project will receive up to 70.0% financing with a repayment period of up to 5 years while those taking the buy and build option will receive up to 80.0% financing with a maximum repayment period of 25 years depending on their employment status. Home ownership has remained low in Kenya at approximately 21.3% implying that more than 78.7% of the total population are renters, compared to more developed countries such as South Africa which have more than 53.0% of the population owning homes. The low home ownership level in Kenya is attributed to unavailability and unaffordability of housing finance. The graph below shows the home ownership percentages for different countries in comparison to Kenya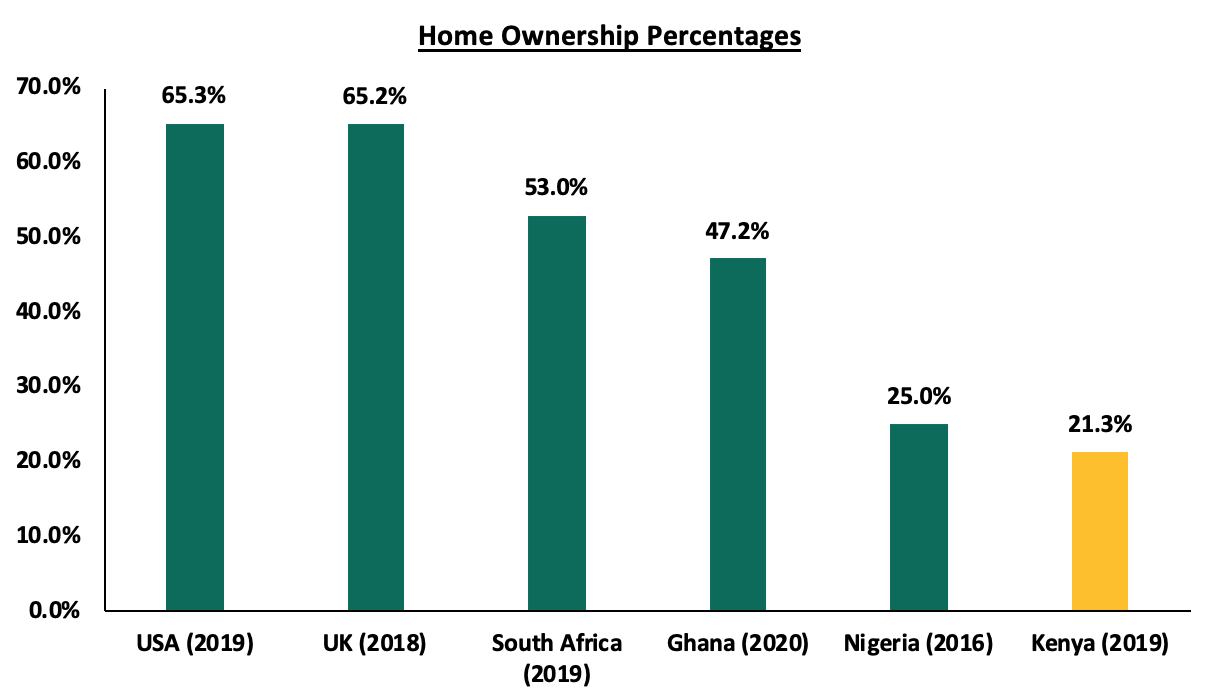
Source: Center for Affordable Housing Africa, Federal Reserve Bank
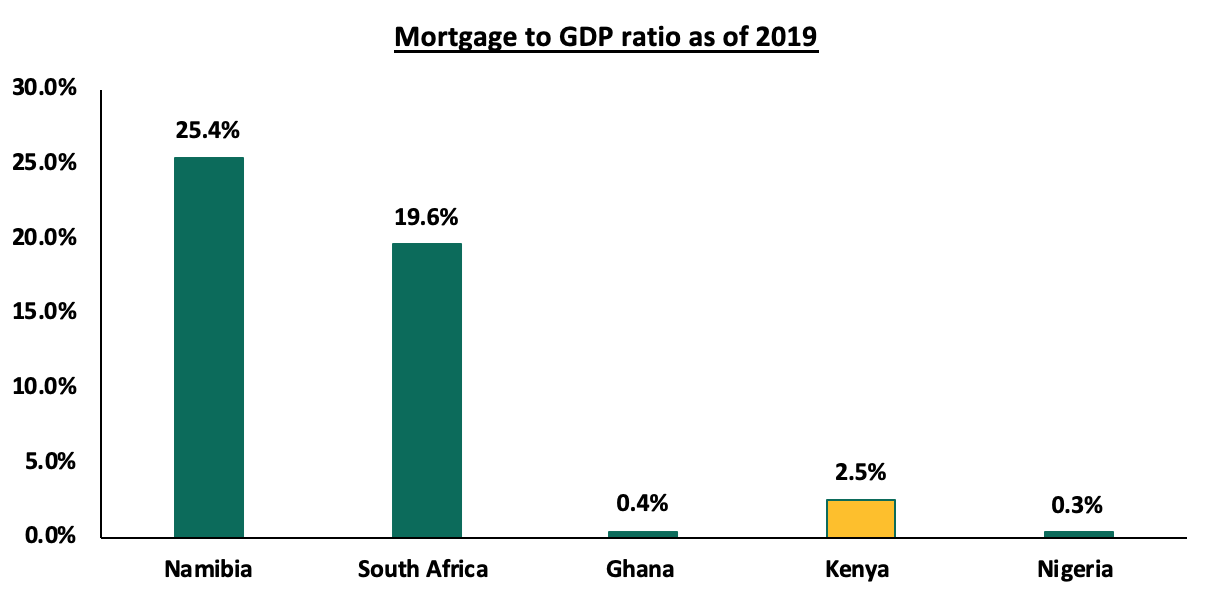
The graph below shows the mortgage to GDP ratio as of 2019 for some selected African counties;
Source: Center for Affordable Housing Africa
The subject partnership is a step in the right direction towards promoting increased access to mortgages but it is yet to address the key issues affecting mortgage affordability. As at 2018, mortgage accounts in Kenya stood at 26,504 accounts out of an adult population of more than 24 million, the low uptake is attributed to; i) high-interest rates and high deposit requirements, ii) soaring of property prices, iii) low-income levels making it hard to service loans, and, v) lack of credit risk information for those in the informal sector leading to their exclusion.
In our view, the continued focus on increasing access to mortgages by private partners also complements government efforts geared towards enhancing affordable home ownership supported by the availability of mortgage facilities particularly through the Kenya Mortgage Refinancing Company (KMRC).
- Retail Sector
During the week, the management of the Waterfront Mall, Karen and Naivas Supermarket, signed an agreement that will see the retail chain take up space that was previously occupied by Shoprite at the mall. Naivas will be the anchor tenant occupying approximately 3,500 SQM, and bringing its total outlets to 66, out of which 4 have been opened in 2020. The opening of the branch in Karen is supported by the high purchasing power of the consumers within the affluent submarket which hosts high-income earners. In terms of performance, according to the Cytonn H1’2020 Markets Review, Karen was the second-best performing retail node within the Nairobi Metropolitan Area with an average yield of 9.2% against the market average of 7.4% and an average occupancy of 75.0% against the market average of 74.0%.
The table below shows the H1’2020 NMA Retail market performance;
(All values in Kshs unless stated otherwise)
|
Nairobi Retail Market H1’2020 performance |
|||
|
Location |
Rent per SQFT H1’2020 (Kshs) |
Occupancy H1’ 2020 |
Rental Yield H1' 2020 |
|
Westlands |
207 |
81.2% |
9.8% |
|
Karen |
219 |
75.0% |
9.2% |
|
Kilimani |
173 |
83.1% |
8.7% |
|
Ngong Road |
183 |
80.1% |
8.3% |
|
Kiambu Road |
175 |
67.1% |
6.9% |
|
Thika road |
164 |
69.3% |
6.5% |
|
Mombasa Road |
144 |
69.6% |
6.0% |
|
Eastlands |
143 |
69.6% |
5.9% |
|
Satellite Towns |
128 |
71.4% |
5.4% |
|
Average |
170 |
74.0% |
7.4% |
Source: Cytonn research
French retailer, Carrefour announced plans to open three stores in Mombasa, to be located at City Mall in Nyali, Center Point Plaza in Diani and Shanzu Mall in Shanzu. The first two stores which are expected to be commissioned in November 2020, will be in Nyali and Diani, and are set to occupy 2,150 SQM and 1,800 SQM, respectively, while the third outlet will be opened at Shanzu Mall once it is completed in 2023. The opening of the three stores will bring the total number of the retailer’s outlets in Kenya to 11, with 8 currently in Nairobi. The plans to open the three new stores signals the commitment by Carrefour to invest in the Kenya retail market supported by positive demographics with Mombasa having a population of 1.21 mn in 2019, 28.6% higher than 0.9 mn recorded in 2009 according to the Kenya population and housing census, a growing middle class, attractiveness as a tourist hub and availability of retail space with Mombasa having the second-largest mall space supply in Kenya after Nairobi at 1.4 mn SQFT.
The table below shows the key local and international retail supermarket chains opened in 2020 taking up spaces left out by struggling retailers such as Tuskys and Shoprite;
|
Main Local and International Retail Supermarket Chains |
|||||
|
Name of Retailer |
Initial number of branches |
Number of branches opened in 2020 |
Closed branches |
Branches expected to be opened |
Projected total number of branches |
|
QuickMart |
32 |
3 |
0 |
0 |
32 |
|
Carrefour |
8 |
1 |
0 |
3 |
11 |
|
Game Stores |
3 |
1 |
0 |
0 |
3 |
|
Naivas Supermarket |
65 |
4 |
0 |
1 |
66 |
|
Chandarana Foodplus |
20 |
1 |
0 |
0 |
20 |
|
Tuskys |
63 |
0 |
8 |
0 |
55 |
|
Uchumi |
37 |
0 |
33 |
0 |
4 |
|
Shoprite |
4 |
0 |
4 |
0 |
0 |
|
Nakumatt |
65 |
0 |
65 |
0 |
0 |
|
Choppies |
15 |
0 |
13 |
0 |
2 |
|
Total |
312 |
10 |
123 |
4 |
193 |
Source: Online research
We expect continued expansion of retailers in Kenya’s retail market taking up space left behind by struggling retailers to cushion the sector’s performance. According to H1’2020 Real Estate Market Review, the sector recorded an average rental yield of 7.4%, with the occupancy rates at 74.0%. The expansion is supported by i) positive demographics with Kenya’s current urbanization and population growth rates at 4.0% and 2.2% against a global average of 1.9% and 1.1%, respectively according to World Bank, ii) improving infrastructure hence supporting the opening up of areas, and iii) demand for varieties as a result of the changing preferences of consumers. Additionally, according to data published in 2018 by Nielsen, a leading global information and measurement company, Kenya has been experiencing shifting consumer trends which have driven growth in formal retail, with 30.0% of the Kenyan population now shopping in formal retail establishments compared to 4.0% in Ghana and 2.0% in Cameroon and Nigeria. Kenya is the second-highest in Sub-Saharan Africa after South African which has a formal retail penetration of 60.0%. Nevertheless, factors likely to constrain the performance of the sector include the existing oversupply of space estimated at approximately 2.8 mn SQFT as of 2019, the exit of some local and international retailers on the back of a decline in revenue inflows, and the growing focus on e-commerce thus affecting demand for physical retails space.
Other highlights during the week;
- Tuskys Supermarket, a local retail chain announced that it received Kshs 500.0 mn capital injection from a Mauritius-based equity fund. This is part of Kshs 2.0 mn that the retailer is supposed to receive after signing terms of agreement with an undisclosed Mauritius based firm for the provision of a financing facility. The funds will be used to pay off landlords, suppliers, and other immediate working capital requirements, with Kshs 321.0 mn being used directly to settle supplier’s debts. The funds are intended to ease the financial pressure that the retailer has been facing and stabilize operations.
The real estate sector is expected to record increased activities supported by the increased availability of mortgages thus boosting home ownership and the expansion of retailers within the Kenyan retail market.
Introduction
The Capital Markets Authority recently updated its guidelines of Collective Investments Schemes (CIS) on matters affecting valuation, performance measurement and reporting by Fund Managers in a bid to encourage international best practice in the capital markets through standardization. This move by the regulator was necessitated by the feedback and observations they have received and made from the market. Aside from enhancing accountability and transparency in the reporting of CIS’ performance, the guidance will also be critical for investor protection and encourage the fair treatment of customers.
As such, we felt the need to shed some light on the collective investment space, as an update to the previous work we have done on the same where, in May 2019, we wrote about investing in unit trusts from the personal finance perspective. In the topical, we highlighted the various types of unit trusts as well as the performance of the unit trusts in Kenya. Therefore, given the recent developments in the industry vis-à-vis the recently published guidelines by the Capital Markets Authority, we shall reiterate the topic and address the following;
- Current CIS regulation framework,
- Performance of CIS’ in Kenya,
- What are the drivers to the recent prominence of CIS in Kenya? and,
- Conclusion – we shall give an outlook on the industry.
Section I: Current CIS regulation framework
To start with, a Collective Investment Scheme (CIS) is a pool of funds from various investors who have a common goal, it is promoted in most cases by a fund manager. The first law that defined collective investment schemes was the Unit Trusts Act of 1965 which was used when the first unit trusts were set up in the 1990s and remained applicable until 2000. Further to this, the Capital Markets Authority through the Capital Markets Act is empowered to regulate both the funds and the funds’ service providers:
- Unit Trusts – the investment schemes where investors sharing the same financial objective pool funds, give a group of professional managers who will then invest in securities like shares, bonds, money market instruments or other authorized securities in order to achieve the objective of the fund. There are various kinds of funds depending on the underlying assets.
- Fund Managers – the individuals authorized by the authority having met certain requirements to be make investment decisions on behalf of the fund,
- Unit Trust Trustees – a corporate trustee assigned to the fund to ensure the fund is run in-line with the fund’s goals and objectives and the key responsibility is to safeguard the assets of the trust, and,
- Custodians – a bank or a financial institution approved by the regulator to ensure safe custody of all assets of the unit trust,
The governance structure of CIS is such that there are checks and balances to ensure investors capital and returns are truly protected. The trustees oversee what the fund manager does within the confines of laws, regulations and consititutive documents. There is monthly reporting to the Capital Markets Authority as the referee of the investment industry.
Section II: Performance of CIS’ in Kenya
In the country, most CIS’ are set up as “Unit Trusts” where the scheme is formed under trust law and the holdings in such a scheme are known as units. The fund manager, in collaboration with the custodian and the unit trust’s trustee, invest funds on behalf of unitholders, in line with the fund’s objectives. The table below shows the objectives, asset allocation, risk tolerance and investment horizon for the different types of funds.
|
Factor |
Money Market Fund/ Fixed-income Fund |
Equity Fund |
Balanced Fund |
|
Objective |
Prefers liquidity & stable returns |
Capital appreciation |
Both liquidity and capital appreciation |
|
Asset Allocation |
The fund manager will invest in fixed income like treasury bills and bonds |
The fund manager will invest in equities |
The fund manager will invest in fixed income like treasury bills and bonds and equities |
|
Risk Tolerance |
Low Risk |
High Risk |
Moderate Risk |
|
Time Horizon |
Short-term investors |
Long-term investors |
Medium-term investors |
According to our report on Q1’2020 unit trust performance, Money Market Funds continued to be the most popular product in terms of market share having a share of 88.2%, an increase from 87.0% in FY’2019 Growth of Unit Trusts as shown in the table below;
|
Assets Under Management (AUM) by Type of Collective Investment Scheme (All values in Kshs mns unless stated otherwise) |
||||||
|
No. |
Product |
FY'2019 AUM |
Q1’2020 AUM |
FY'2019 Market Share |
Q1’2020 Market Share |
Variance |
|
1 |
Money Market Funds |
66,193.0 |
67,358.0 |
87.0% |
88.2% |
1.2% |
|
2 |
Equity Fund |
4,485.2 |
3,631.6 |
5.9% |
4.8% |
(1.1%) |
|
3 |
Balanced Fund |
1,312.0 |
1,166.5 |
1.7% |
1.5% |
(0.2%) |
|
4 |
Others |
4,108.1 |
4,188.2 |
5.4% |
5.5% |
0.1% |
|
|
Total |
76,098.4 |
76,344.3 |
100.0% |
100.0% |
|
Source: Capital Markets Authority: Collective Investments Scheme Quarterly Report
According to the Capital Markets Authority, there were 24 approved collective investment schemes made up of 92 funds in Kenya as of Q1’2020, unchanged since Q1’20015. Out of the 24 however, only 19 are currently active while 5 are inactive. During the month of September, the CMA granted African Diaspora Asset Management (ADAM) a fund manager’s License, bringing the total number of licensed fund managers to 25.
Assets ˜Under Management (AUM) of the industry during the period of review grew at a rate of 0.32% to Kshs 76.3 bn in Q1’2020, from Kshs 76.1 bn as at FY’2019, as per the below diagram;
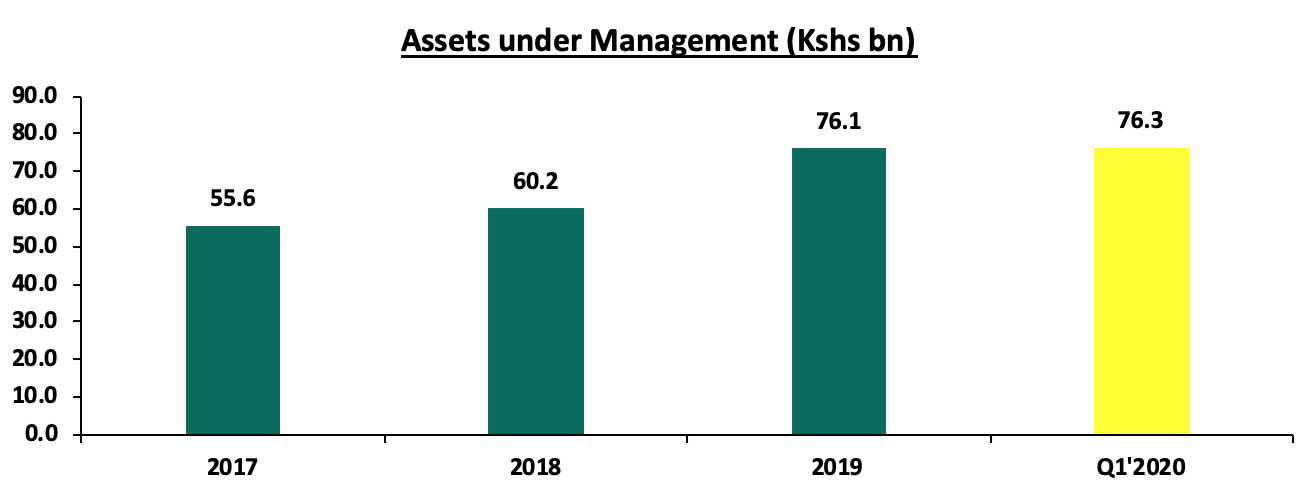
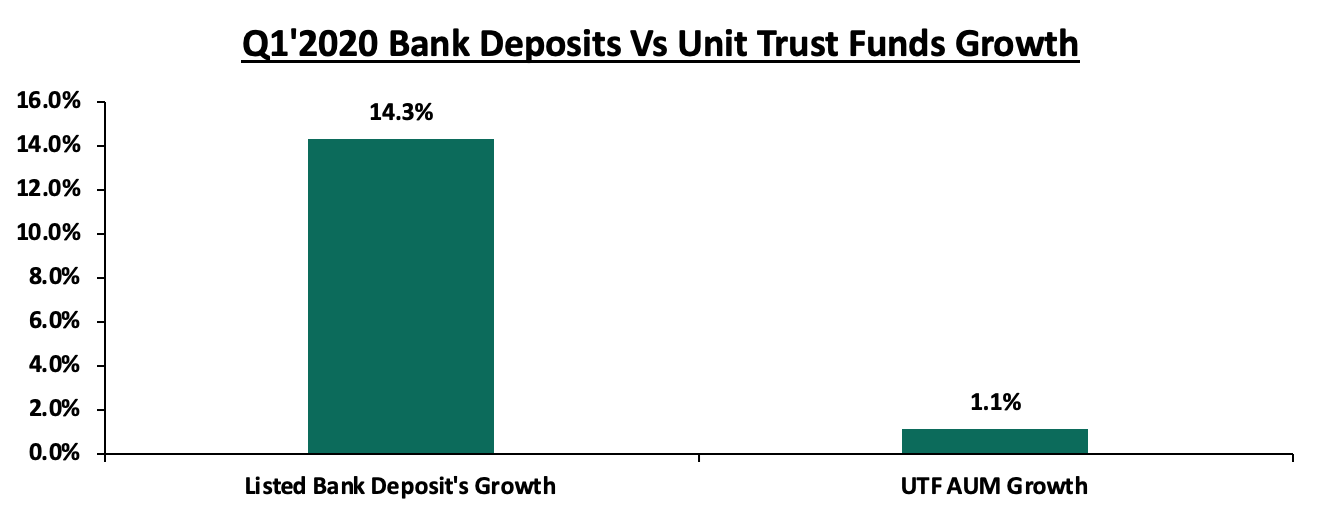
The sector has continued to grow to record a 2-year CAGR growth of 17.0%, but in Q1’2020 the growth was muted growing by 1.1%, down from the 26.5% recorded in FY’2019. Compared to bank deposits, Unit trusts funds usually grow at a much slower pace, an indication that our capital markets potential and growth remains constrained. The chart below shows the aunnualized unit trust growth versus bank deposit growth for the first quarter of the year.
*Growth is annualized
Section III: What are the drivers to the recent prominence of CIS in Kenya?
Collective investment schemes are becoming popular in the Kenyan market mainly driven by the attractive features they possess which include:
- Affordability: Compared to other avenues of investing, a majority of the Collective Investment Schemes’ (CIS’) in the market require an initial investment ranging between Kshs 100.0 - Kshs 10,000.0, which is relatively more affordable. This works to the benefit of both the investor and the fund manager in that for an investor; he/she can access investment opportunities which would otherwise be inaccessible due to the size of their initial investment amount, while for the fund manager; he/she can access a wider customer base and ultimately grow their assets under management,
- Liquidity: Compared to other investment options such as equities, unit trusts are liquid, as it is easy to sell and buy units without depending on supply and demand at the time of investment or exit. Furthermore, the advent of digitization and automation within the industry has enhanced liquidity enabling an investor to receive their funds within 3 to 5 working days if they are withdrawing to their bank accounts, and immediate access to funds when withdrawing via M-pesa. This is part of the reason for the popularity of products such as Money Market Funds in Kenya apart from the funds’ affordability in its initial and additional investment requirements, and,
- Diversification: CIS’ are advantageous since investors get the opportunity to diversify their portfolio as a result of the access to a wider range of investment securities even with limited capital, which would have otherwise been inaccessible if they invested on their own. For example, an investor who puts in Kshs 2,000.0 in a CIS can get exposure and ultimately returns from both the equities and fixed income market which in some instances require high initial investment amounts,
Aside from the attractive features they possess, investing through a CIS comes with certain benefits such as:
- Professional Fund Management: Unit trusts are run by investment managers who have successfully made investment decisions through a wide variety of market conditions over a long period and thus have the expertise to screen for high yielding investments opportunities in the market, coupled with other support functions such as operations which process the day to day transactions to ensure efficiency,
- Security of Fund: Unit trusts are well regulated through the Capital Markets Authority and controlled by the Collective Investment Schemes Act, which prohibits investment managers from taking certain risks. They also come with safeguards like unit trust fund is compelled by law to appoint a trustee who looks after all the assets that the fund owns which means that if anything happens to the unit trust company or the asset manager the investments will not be affected,
- Transparency and Effective Communication: Unit trusts are required to publish their daily and effective annual yields on the daily newspapers, and thus an investor can therefore always confirm the value of their investment as well as benchmark the performance against other unit trusts. It is also mandatory for the scheme to issue monthly statements showing an investor’s investments position,
- Excellent Returns: History has shown that average returns from unit trust companies compare very favorably with returns from more traditional investment products. Unit trusts have also proven themselves as an excellent way of beating inflation,
- Easy Access to the Investment: Funds invested in unit trust investments can easily be redeemable either the full or partial investment based on the prevailing unit price, and,
- Diversification: Unit trust Funds ensure diversification of risk through investing in a variety of asset classes. Through this, they provide an avenue for small scale investors to get exposure to a wide range of investments which would otherwise require one to have a lot of capital to access. Due to this nature, unit trusts have universally been identified as the small investor’s answer to achieving wide investment diversification without the need of huge and prohibitive sums of money, while still offering a safe haven for the less sophisticated and less capitalized, conservative individuals as the market becomes sophisticated and more volatile as the funds are managed by qualified fund managers who screen for viable investment opportunities.
To show the benefit that a CIS has, we came up with the below scenario which shows the amount one would require as initial investment, in order to get a return of at least 10.0% from the public markets. The case also assumes that the client is risk-averse and requires a security that provides a guaranteed return as the bare minimum i.e. Fixed-income.
|
|
Client A* |
Client B |
|
Investment Vehicle |
Money Market Fund |
4-year T-Bond (Fixed Income) |
|
Investment Period |
1 year |
4 years |
|
Return |
10.08%** |
10.11% |
|
Minimum Investment Required |
1,000.00 |
1,000,000.00 |
*Collective Investment Scheme
**Average Return for the top five Money Market Funds
Based on the above, client A can start earning a return of about 10.0% on amounts as low as 1,000.0 when investing through a CIS, in this case, a money market fund. If the client opts to invest directly in the markets, they would require at least Kshs 1,000.000.0 to purchase a four-year government bond that will get them the same return of about 10.1%.
Section IV: Conclusion
Despite the good regulations in place, there is always room for improvement. During the month, the CMA published the guidance to collective investment schemes on performance measurement and presentation. The guidance, which will be effective 1st January 2021, gives directives to fund managers on the valuation, performance measurement and reporting of the relevant schemes. CMA highlighted that these guidelines are meant to encourage international best practice in the capital markets through standardization thereby enhancing the comparability and consistency of the information presented across the sector. Fund managers will now be required to establish comprehensive and documented investment policies and procedures to govern the valuation of the assets held by the CIS. The same policies will indicate how performance is calculated, measured and presented aside from identifying the methodology to be used for valuing each asset type. Additionally, they will be required to provide performance measurement reports to the CMA and all existing and prospective investors within 21 days after the end of each quarter.
The move by the CMA is commendable although we believe certain actions on their part can help improve the growth and formation of more schemes. This includes but not limited to; (i) allowing the formation of sector funds which will allow investors to invest in specific sectors i.e. a technology fund or a real estate fund, (ii) expand eligibility of trustees of Unit Trust Funds to include non-bank trustees such as corporate trustees, and, (iii) allowing funds to have as many custodians as it suites the unit holders which will help reduce transaction costs for those investing between various financial institutions. Ultimately, the above will promote capital market growth since it reduces the existing conflict of interest and levels the playing field.
We shall be covering the changes done by the CMA in more details next week and how the same shall impact the sector.
Disclaimer: The views expressed in this publication are those of the writers where particulars are not warranted. This publication, which is in compliance with Section 2 of the Capital Markets Authority Act Cap 485A, is meant for general information only and is not a warranty, representation, advice or solicitation of any nature. Readers are advised in all circumstances to seek the advice of a registered investment advisor.

