Cytonn H1’2020 Markets Review
By Research Team, Jul 5, 2020
Executive Summary
Global Markets Review:
According to the International Monetary Fund (IMF) World Economic Outlook (WEO) Update June 2020, dubbed “A Crisis like No Other, An Uncertain Recovery”, the global economy has been significantly impacted by the pandemic and is projected to contract by (4.9%) in 2020, down from the initial outlook of (3.0%) in April 2020. This is largely driven by lower demand for goods due to lower incomes and also the impact of supply chain disruptions;
Sub-Saharan Africa Regional Review
The International Monetary Fund (IMF) revised the Sub-Saharan Regional GDP growth to a contraction of 3.2% from a contraction of 1.6% projected earlier in April 2020, due to continued spread of the Virus. Except for the Malawian Kwacha, all the major African Currencies have depreciated against the US Dollar on an YTD basis. Due to increased levels of risk, emerging markets have witnessed significant outflows from their bond funds and there has been a spike in the yield on government-issued Eurobonds especially by African Countries;
Kenya Macroeconomic Review
The macroeconomic environment in Kenya remained negative in the first half of 2020, as evidenced by (i) Slower economic growth, with Q1’2020 GDP growth coming in at 4.9%, a 2-year low, (ii) Volatility in the foreign exchange market driven by uncertainties concerning the impact of COVID-19 with the shilling having depreciated by 5.1% against the US Dollar in H1’2020. The average inflation has remained within the government projections and it ended H1’2020 at 5.6%, a slight increase from 5.2% in H1’2019;
Fixed Income
During H1’2020, T-bills were oversubscribed, with the overall subscription rate coming in at 152.8%, up from 144.6% in H1’2019. The oversubscription is partly attributable to the continued preference for shorter-dated papers by investors looking to avoid duration risk especially during this period of uncertainty. Overall subscriptions for the 91, 182, and 364-day papers came in at 133.4%, 80.1%, and 228.1% in H1’2020, from 103.5%, 80.5%, and 255.0% in H1’2019. During the week, T-bills remained oversubscribed, with the subscription rate coming in at 317.4% up from 245.6% the previous week, with most interest being on the 91-day bill that received a 511.3% subscription up from 245.6% the previous week. The oversubscription is largely attributable to the high liquidity in the money markets as can be seen by the decline in the average interbank rate to 3.0%, from 3.9% recorded the previous week. The yields on the 91-day, 182-day, and 364-day papers declined by 15.4 bps, 34.2 bps, and 42.5 bps respectively to 6.5%, 7.0%, and 7.8%;
Equities
In H1’2020, the equities market was on a downward trend, with NASI, NSE 20 and NSE 25 declining by 17.3%, 26.8% and 21.5%, respectively. For the last twelve months (LTM), NASI, NSE 25 and NSE 20 have declined by 8.0%, 10.3% and 26.2%, respectively. During the first half of 2020, listed banks in Kenya released their FY’2019 and Q1’2020 results, recording earnings growth and loss of 8.9% and (7.4%) in their core EPS in FY’2019 and Q1’2020, respectively;
Real Estate
According to the KNBS Quarterly GDP Report Q1'2020, the real estate sector grew by 4.3% in Q1’2020, 0.5% points lower than Q1’2019, attributable to a decline in activity amidst a tough financial environment. The spread of the Coronavirus took its toll on key sectors with hospitality and retail sectors being the worst hit. In terms of performance, average rental yields softened across all sectors coming in at 7.4%, 7.3% and 5.1%, for retail, office and residential sectors, respectively from 7.7%, 7.8% and 5.2% in Q1’2020.
- Weekly Rates:
- Cytonn Money Market Fund closed the week at a yield of 10.6%. To invest, just dial *809#;
- Cytonn High Yield Fund closed the week at a yield of 13.5% p.a. To invest, email us at sales@cytonn.com;
- Phase 1 of The Alma is now 100% sold with early buyers having achieved up to 55% capital appreciation. We are now running promotions:
- For Phase 2: Buy a unit in Phase 2 with a 15-year payment plan and 0% deposit;
- For Phase 1: Get a 10% rent discount on units we manage for investors;
- For inquiries, please email us on clientservices@cytonn.com;
- For an exclusive tour of Cytonn’s real estate developments, visit: Sharp Investor's Tour and for more information, email us at sales@cytonn.com;
- We continue to offer Wealth Management Training daily, from 9:00 am to 11:00 am, through our Cytonn Foundation. The training aims to grow financial literacy among the general public. To register for any of our Wealth Management Training, click here;
- For Pension Scheme Trustees and members, we shall be having different an industry players talk about matters affecting Pension Schemes and the pensions industry at large. Join us every Wednesday from 9:00 am to 11:00 am for in-depth discussions on matters pension;
- If interested in our Private Wealth Management Training for your employees or investment group, please get in touch with us through wmt@cytonn.com;
- For recent news about the company, see our news section here;
- We have 10 investment-ready projects, offering attractive development and buyer targeted returns. See further details here: Summary of Investment-ready Projects.
Introduction
According to the International Monetary Fund (IMF) World Economic Outlook (WEO) Update June 2020, dubbed “A Crisis Like No Other, An Uncertain Recovery”, the global economy is projected to contract at a rate of (4.9%) in 2020, 1.9% lower than their initial outlook of (3.0%) in April 2020, largely driven by an 8% decline in developed markets and a 3% decline in emerging markets’ GDP growth. Some of the themes underpinning the outlook include:
- Continued worsening of the pandemic in some economies despite levelling in others, which has led to more stringent lockdowns, leading to even larger disruptions in business activity than expected,
- Decline in consumption and services as people have had to rely on their savings as they adhere to social distancing and movement restrictions set in place to reduce the Virus spread,
- Labour markets have been hit hard as a result of job losses and/or reduced pay; According to the International Labour Organization, the global decline in work hours seen in Q1’2020 compared to Q4’2019 was equivalent to the loss of 130 million full-time jobs and its projected to increase to 200 mn fulltime jobs in Q2’2020,
- Depressed mobility as travel is impacted,
- A contraction in global trade which can be attributed to the subdued business activity in the global economy, and
- Lower Inflation due to subdued demand in most economies coupled with the current low oil prices.
Commodity Prices:
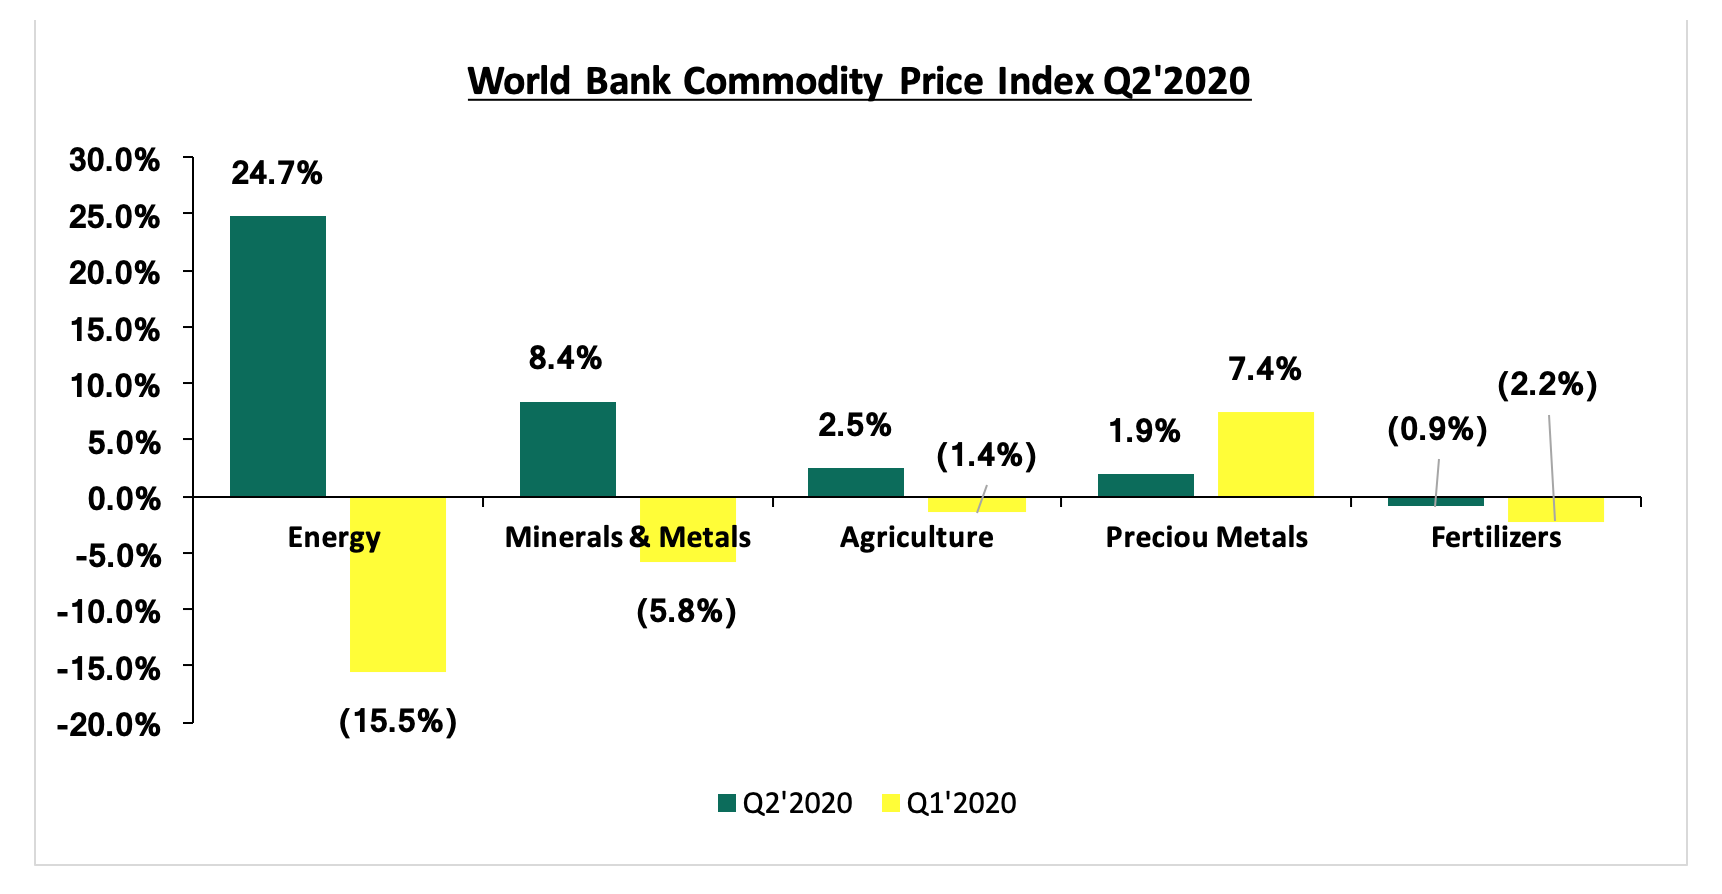
Global commodity prices improved in Q2’2020 after they had been adversely affected by the spread of COVID-19 as evidenced by the lower prices in Q1’2020 due to the easing of movement restrictions in some countries such as China. Below is a summary performance of various commodities:
The African regional growth is expected to be significantly lower with the World Bank in their Africa’s Pulse report revising the growth to a contraction of 5.1% in 2020 from a growth of 3.0% projected at the beginning of the year. The International Monetary Fund (IMF) on the other hand, released the Sub-Saharan Regional Economic Outlook, revising the Sub-Saharan Africa (SSA) GDP growth to a contraction of 3.2%, from a contraction of 1.6% projected earlier in April 2020, in their World Economic Outlook (The Great Lockdown) report. The lower growth rate is mainly attributable to the uncertainty around the tenor of the pandemic and its implications around the various SSA economies given the acceleration of the virus despite the measures taken by most governments to contain its spread. Commodity driven economies saw their GDP revised downwards by an average of 2.0% due to the plummeting of oil prices, declining economic activities as well as low oil production in countries such as Nigeria. Economies dependent on Tourism activities such as Mauritius, on the other hand, saw their GDP growths revised downwards by more than 5.0% on average.
Currency Performance
All select currencies depreciated against the US Dollar except for the Malawian Kwacha, which remained relatively stable against the dollar attributable to the high forex reserves, which continue to provide a buffer to the Kwacha against exchange shocks. The depreciation recorded by the currencies is partly attributable to the ongoing COVID-19 pandemic, which has seen a fast-falling demand for export commodities given the lockdown measures put in place. The Zambian Kwacha was the worst performer, depreciating by 28.6% against the dollar YTD, owing to the low economic productivity given the fall of copper prices as well as increased imports, which continue to increase pressure to the currency. Credit Rating Agencies such as Moody’s had flagged the default risk and thereby downgraded their assessments of the country’s debt in April to Ca from Caa2 and revised the outlook to negative from stable. The Kenya Shilling depreciated by 5.1% in H’1 2020 to close at Kshs 106.5 against the US Dollar, attributable to high dollar demand from foreigners exiting the market amidst the pandemic.
Below is a table showing the performance of select African currencies:
|
Select Sub Saharan Africa Currency Performance vs USD |
|||||
|
Currency |
Jun-19 |
Dec-19 |
Jun-20 |
Last 12 Months change (%) |
YTD change (%) |
|
Malawian Kwacha |
762.1 |
729.1 |
728.4 |
4.4% |
0.1% |
|
Tanzanian Shilling |
2295.0 |
2293.0 |
2313.0 |
(0.8%) |
(0.9%) |
|
Ghanaian Cedi |
5.4 |
5.7 |
5.7 |
(6.5%) |
(1.2%) |
|
Ugandan Shilling |
3690.0 |
3660.0 |
3719.1 |
(0.8%) |
(1.6%) |
|
Kenyan Shilling |
102.3 |
101.3 |
106.5 |
(4.1%) |
(5.1%) |
|
Mauritius Rupee |
35.5 |
36.2 |
40.0 |
(12.7%) |
(10.5%) |
|
Botswana Pula |
10.7 |
10.5 |
11.9 |
(11.0%) |
(13.0%) |
|
Nigerian Naira |
305.9 |
306.0 |
360.0 |
(17.7%) |
(17.6%) |
|
South African Rand |
14.1 |
14.0 |
17.3 |
(23.1%) |
(23.7%) |
|
Zambian Kwacha |
12.8 |
14.1 |
18.1 |
(40.8%) |
(28.6%) |
Source: Reuters
African Eurobonds:
During the first half of 2020, emerging market bond funds recorded heavy net outflows with the yields increasing as investors dumped risky assets amid the deepening coronavirus crisis. However, we saw some recoveries towards the tail end of Q2’2020, attributable to the easing of the lockdown measures in most economies, thus improving investor sentiments. In February 2020, the Government of Ghana launched the sale of a USD 750.0 mn tranche at a yield of 8.9% and with a tenor of 40-years, the longest dated Eurobond, as part of debt issuance to raise USD 3.0 bn. The bond was oversubscribed 5x attracting USD 14.0 bn, an indication that investors are still looking for value investments despite the pandemic.
Gabon also issued their maiden Eurobond in February 2020 of USD 1.0 bn with a tenor of 11-years and a coupon rate of 6.6%. The bond received bids worth USD 3.5 bn translating to a 3.5x subscription rate. The bond was for financing the country’s efforts in diversifying its exports by venturing into logging and agriculture to reduce the country’s over-dependence on the world demand for Manganese and Oil, and hence reduce exposure to the impact of fluctuating crude oil prices.
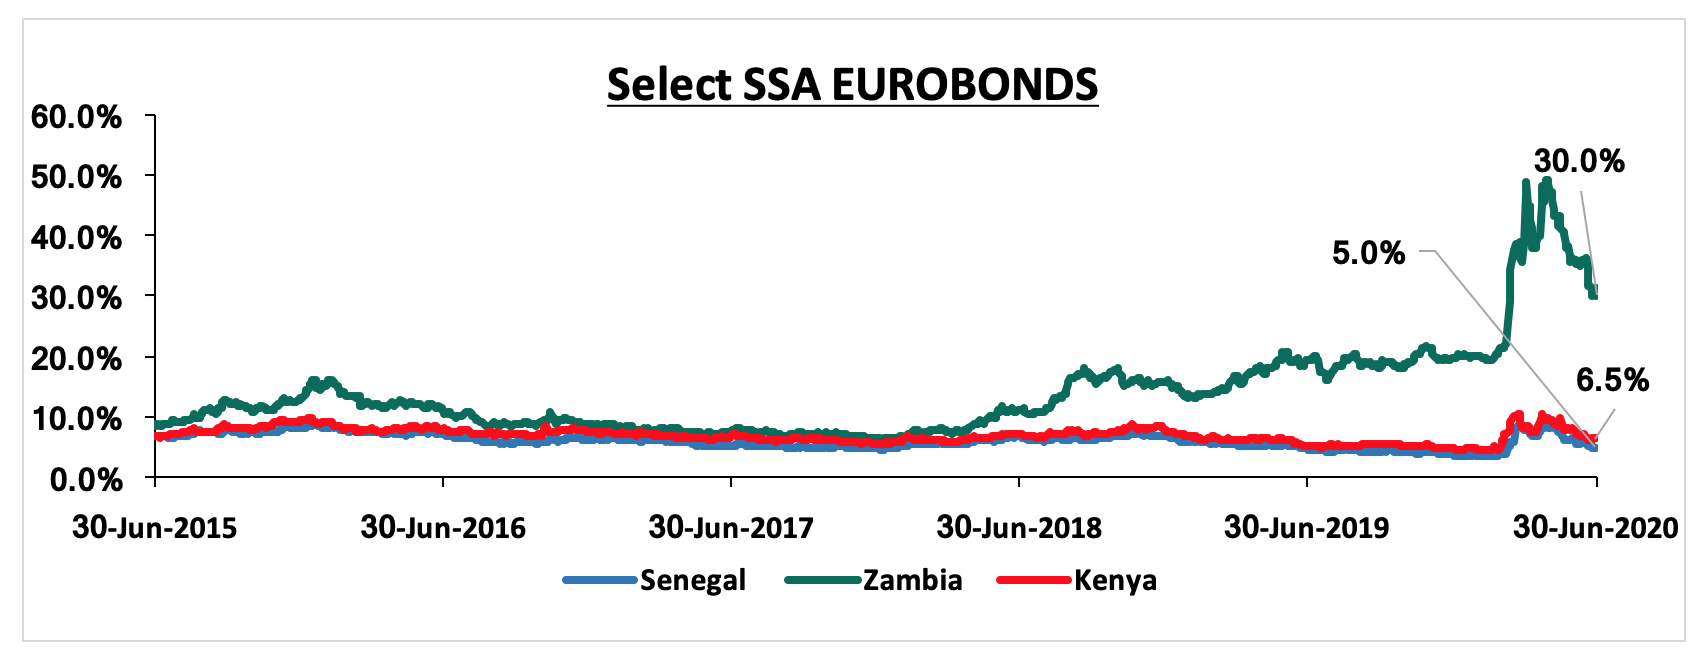
Below is a graph showing the Eurobond secondary market performance of select 10-year Eurobonds issued by the respective countries:
Source: Reuters
Key Takeout from the chart:
- Yields on the Zambia Eurobond increased in H1’2020 by 10.4% points to 30.0% from 19.6% recorded at the end of December 2019, attributable to exits by foreign investors amid fears of the country’s debt sustainability given the high servings levels and as COVID-19 impacts their Copper exports in terms of volumes and the prices have come off. In April 2020, Fitch Ratings downgraded Zambia’s Long Term debt to CC from CCC due to the country’s already constrained external liquidity that is likely to increase their defaulting risks.
Equities Market Performance
Most of the Sub-Saharan African (SSA) stock markets recorded negative returns in H1’2020, attributable to foreign investors’ selloffs in favor of safe havens, given the expected economic fallout. Below is a summary of the performance of key exchanges:
|
Equities Market Performance (Dollarized*) |
||||||
|
Country |
Index |
Jun-19 |
Dec-19 |
Jun-20 |
Last 12 Months change (%) |
YTD change (%) |
|
Rwanda |
RSEASI |
0.1 |
0.1 |
0.2 |
12.8% |
12.8% |
|
Ghana |
GGSECI |
440.5 |
405.5 |
333.2 |
(24.4%) |
(17.8%) |
|
Kenya |
NASI |
1.5 |
1.6 |
1.3 |
(11.6%) |
(19.4%) |
|
Nigeria |
NGSEASI |
83.4 |
87.7 |
68.0 |
(18.4%) |
(22.5%) |
|
South Africa |
JALSH |
4104.6 |
4079.3 |
3138.5 |
(23.5%) |
(23.1%) |
|
Uganda |
USEALSI |
0.4 |
0.5 |
0.4 |
(15.1%) |
(27.0%) |
|
Zambia |
LASILZ |
355.5 |
303.3 |
216.8 |
(39.0%) |
(28.5%) |
|
Tanzania |
DARSDSEI |
0.8 |
1.5 |
0.7 |
(18.5%) |
(55.4%) |
|
*The index values are dollarized for ease of comparison |
||||||
Source: Reuters
Analysis of trends observed in the chart above is as follows:
- RSEASI was the best performing index showing resilience amid the COVID-19 pandemic attributable to the easing of the lockdown measures with the government allowing restricted movement of people and restricted opening of businesses such as hotels and restaurants. The country received a total of USD 220.5 mn from the IMF to finance the country’s budget needs as well as the urgent balance of payments,
- DARSDSEI was the worst-performing index with losses of 55.4% YTD, attributable to the continued selloffs brought by concerns about the economic fallout caused by the Coronavirus. The ban on International travel bans has taken a toll on the country’s tourism sector, which had been one of the fastest-growing sectors in the economy, and,
- Nairobi All Share Index (NASI), recorded losses of 19.4% YTD, attributable to the ongoing Coronavirus pandemic, with investors selling out of the equities market.
GDP growth in Sub-Saharan Africa region is expected to decline owing to the ongoing COVID-19 pandemic that is expected to disrupt global supply chains and as the currencies lose value against the dollar in an uncertain global economy. Key risks remain difficult business conditions and poor infrastructure, reliance on commodity exports, political tension in some countries and debt sustainability due to high levels of public debt in most economies in the region. Stock market valuations remain unattractive for long-term investors.
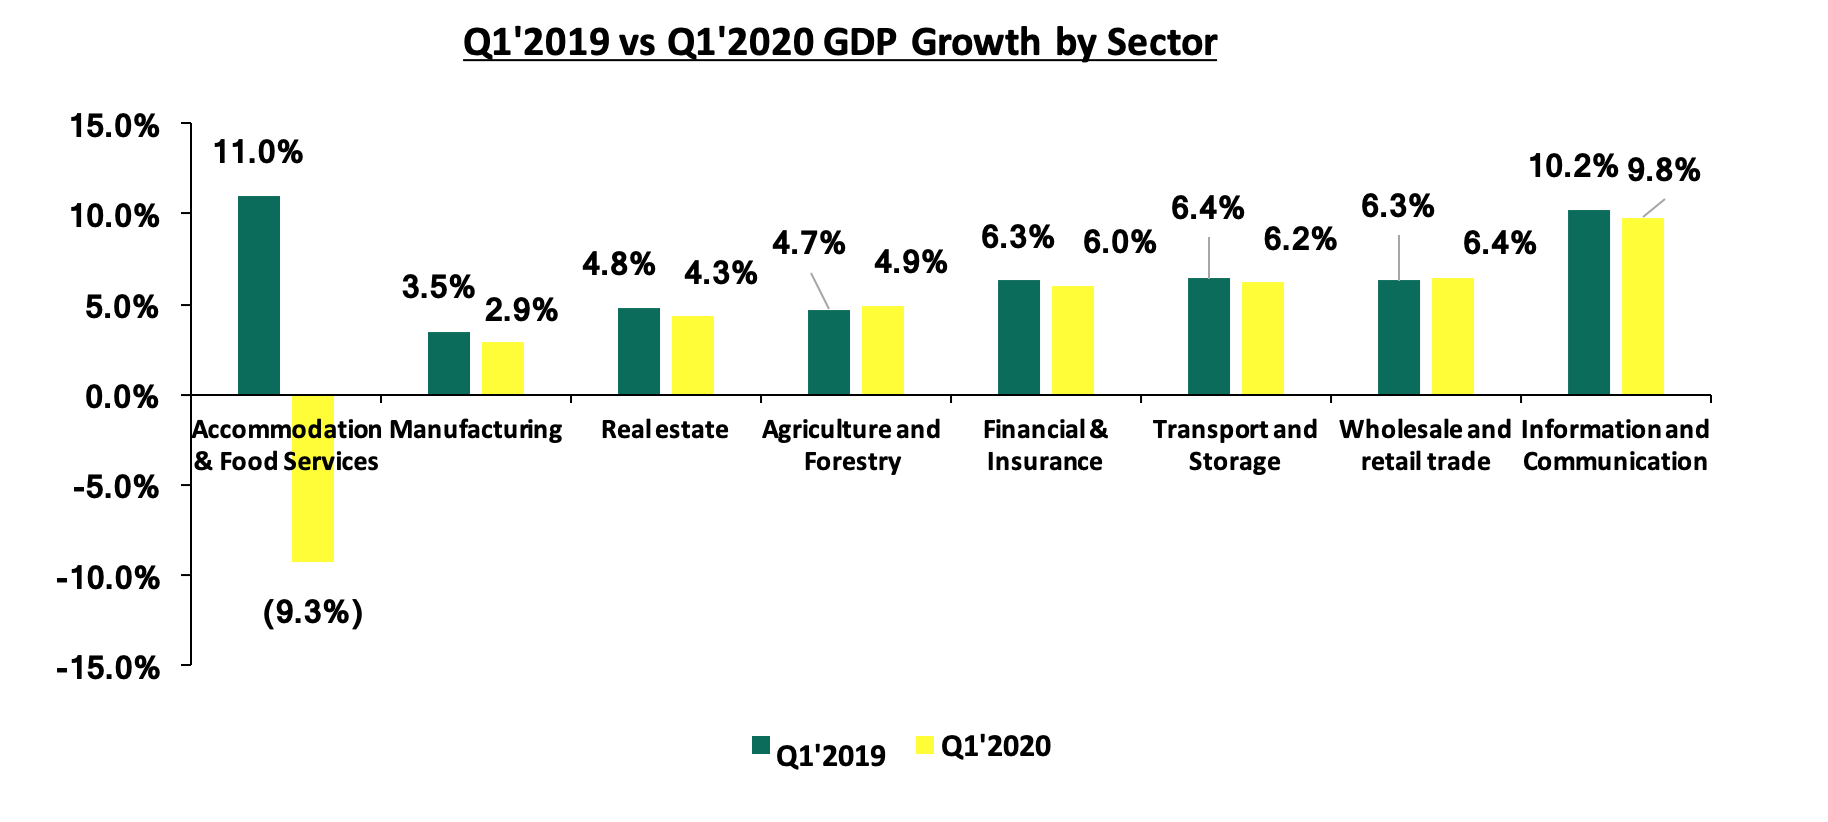
Economic growth for Kenya is projected to be significantly lower with the IMF projecting a growth of 1.0% while the treasury projected 2.5% growth. For the first quarter of 2020, the impact of the virus had not taken a big toll and we saw growth coming in at 4.9%, a 2 – year low, compared to 5.5% recorded in a similar period of review in 2019.
The chart below shows the Q1’2019 and Q1’2020 GDP growth by sector;
Below are the sectorial Q1’2020 GDP contributions;
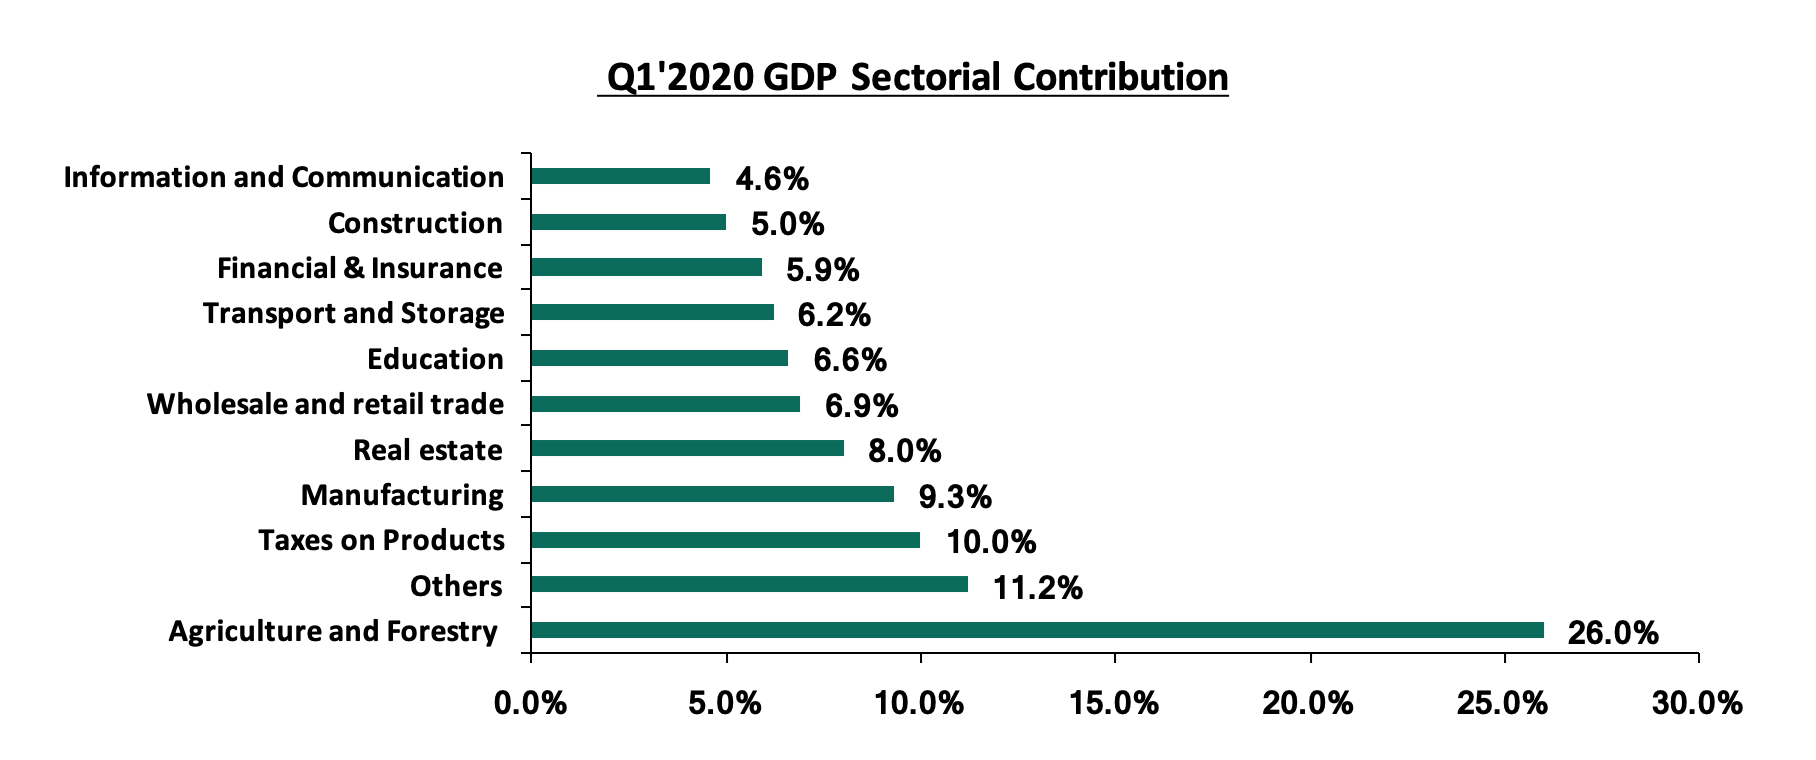
For more information, see our Q1’2020 GDP Note;
According to Stanbic Bank’s Monthly Purchasing Manager’s Index (PMI), released earlier during the week, the seasonally adjusted PMI came in at 46.6 in June, an improvement from 36.7 in May 2020 and higher than the H1’2020 average of 42.2 but lower than the H1’2019 average of 51.7. The lower PMI is due to lower business revenues in sectors like the Tourism and Hospitality sectors that have witnessed significant layoffs. A PMI reading of above 50 indicates improvements in the business environment, while a reading below 50 indicates a worsening outlook. The slow decline in output and new orders was due to the reduction in curfew hours as well as relaxed measures in Europe thus improving demand for exports. This saw employment numbers fall at the slowest pace in the last three months. Input costs declined for the third month in a row due to lower wage costs.
The International Monetary Fund released the first chapter of the World Economic Outlook (The Great Lockdown), where they revised Kenya’s 2020 GDP growth rate for 2020 to 1.0%, from the 6.0% growth rate projected at the beginning of the year. For more information, see our, Cytonn Weekly #16/2020.
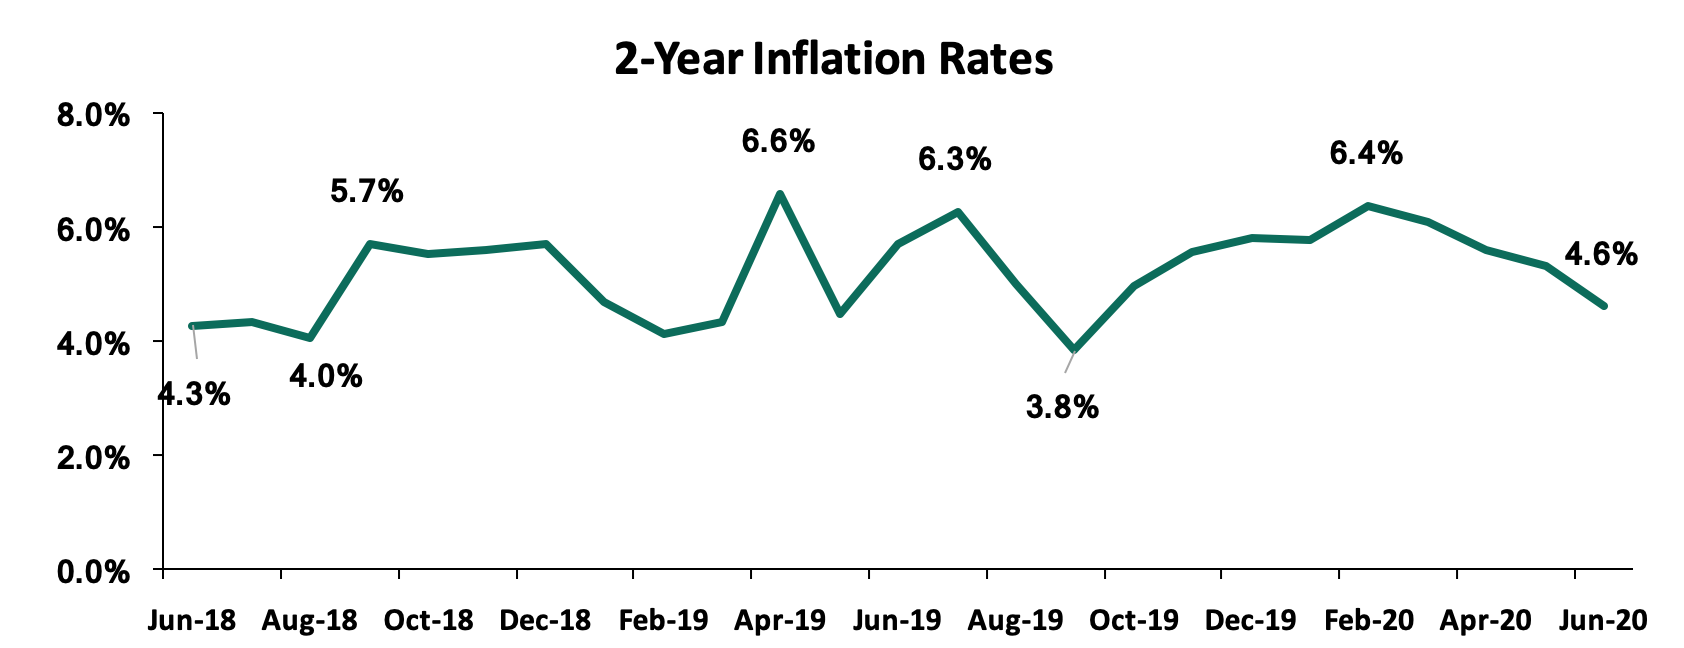
Inflation:
Inflation rates have remained relatively stable and we saw the average inflation rate rising to 5.6% compared to 5.0% recorded in H1’2019. In a bid to ensure that the inflation basket is representative of what is happening on the ground, KNBS, revised the components of the Inflation basket some of the items increased include; mobile phone airtime, pay-tv, and garbage collection while they dropped archaic items such as radio and video cassettes. The revision brings the number of items included in the commodity basket to 330 from 234 while data collection zones have increased from the previous 25 to 50. KNBS also adjusted the weighting assigned to items in the commodity basket such as the Food and Non-Alcoholic Beverages, Alcoholic Beverages, Tobacco and Narcotics, and Transport Indices, which previously had a weighting of 36.0%, 2.1%, and 8.7%, respectively, to 32.9%, 3.3%, and 9.7%, respectively.
For the month of June, inflation came in at 4.7% with the m/m inflation decreasing marginally by 0.3%. The decrease in the month-on-month inflation in June was mainly due to:
- A 1.3% decrease in the food and non-alcoholic beverage index, driven by a decrease in prices of some food items such as tomatoes, Irish potatoes, and cabbages, which decreased by 12.2%, 5.1%, and 4.8%, respectively,
- A 0.8% decrease in Housing, Water, Electricity, Gas and Other Fuels Index stimulated by a 21.3% decrease in prices of kerosene which offset the 0.9% increase in electricity, and,
- The decrease was however weighed down by the 2.1% increase in transport cost driven by a 6.8% increase in pump prices for petrol which outweighed the 4.8% decrease in the cost of diesel.
We expect inflation to remain stable despite supply-side disruption due to COVID-19 as low demand for commodities compensates for the cost-push inflation, coupled with the low oil prices in the international markets. The recent reopening of a majority of the global markets will also address supply chain issues causing import prices to stabilize.
Below is the trend analysis of the inflation figures for the last two years:
The Kenya Shilling:
The Kenya Shilling depreciated by 5.1% against the US Dollar in H1’2020, to close at Kshs 106.5, from Kshs 101.3 at the end of December 2019, attributable to high dollar demand from foreigners exiting the market as they direct their funds to safer havens. At the tail end of the period review, there was increased dollar demand from merchandise importers as the easing of coronavirus restrictions jumpstarted economic activities thus boosting demand for hard currency.
Some of the key challenges facing the currency include:
- A deteriorating current account position: we saw current account deficit deteriorated by 10.2% during Q1’2020, coming in at Kshs 110.9 bn, from Kshs 100.6 bn in Q1’2019 attributable to;
- 3.0% decline in the secondary income (transfers recorded in the balance of payments whenever an economy provides or receives goods, services, income or financial items) balance, to Kshs 124.1 bn, from Kshs 128.0 bn in Q1’2019, and,
- A 67.0% decline in the services trade balance (the difference between the imports and exports of services) to Kshs 20.4 bn, from Kshs 61.9 bn. For more information see our Q1’2020 BOP Note
- Demand from merchandise and energy sector importers as they beef up their hard currency positions amid a slowdown in foreign dollar currency inflows, and,
- Subdued diaspora remittances evidenced by the 9.0% decline to USD 208.2 mn in April 2020, from USD 228.8 seen the previous month, mainly due to the decline in economic activities globally, coupled with increased prices of household items leading to lower disposable income. Key to note, the Central Bank of Kenya (CBK) expects a 12.0% decline in remittances in 2020.
The shilling is however expected to be supported by:
- High levels of forex reserves, currently at USD 9.7 bn (equivalent to 5.8-months of import cover), above the statutory requirement of maintaining at least 4.0-months of import cover, and the EAC region’s convergence criteria of 4.5-months of import cover.
Monetary Policy:
After holding the Central Bank rates Stable last year the monetary policy Committee in a bid to support the economy met five times reducing the Central Bank Rate CBR) to 7.00% from 8.25% at the beginning of the year. In addition to the CBR rate, the Cash Reserve Ratio was also reduced to 4.25%, from 5.25% to provide liquidity to banks for onward lending.
H1’2020 Key Highlights:
During the period of review, the government was able to receive funds from international organizations to help the country fight against the negative effects of the pandemic. For more information, see our Cytonn Weekly #19/2020 and Cytonn Weekly #20/2020. The table below shows the funds the government has received so far towards supporting the economy during the Coronavirus pandemic period;
|
Entity |
Amount Received in Kshs bn |
|
Central Bank of Kenya |
7.4 |
|
International Monetary Fund |
78.7 |
|
International Development Association (IDA) |
80.0 |
|
World Bank |
80.0 |
|
International Bank for Reconstruction and Development |
26.6 |
|
Total |
272.7 |
- Finance Act 2020
During H1’2020, the president signed into law, the Finance Bill 2020. Below are some of the key highlights affecting investments decisions more directly:
- Under the Income Tax Act, the key highlights included:
- Extending the upper limit of the Residential Income Tax to Kshs 15.0 mn from Kshs 10.0 mn to allow landlords with rental income of between Kshs 288 and Kshs 15.0 mn to access the more concessional tax rate of 10% of gross income, and reduce administrative costs of ascertaining profit for such landlords,
- Introduction of a minimum tax, to be introduced at a rate of 1.0% of the gross turnover. This new tax will apply to all persons whether they’re making profits or incurring losses.
- Introduction of Digital Service Tax, to be introduced at a rate of 1.5% of the gross transaction value, to be charged on individuals who generate income from the provision of services through the digital market place., and,
- Some allowable items such as (i) any entrance fee or annual subscription paid during that year of income to a trade association, (ii) capital expenditure on expenses relating to authorization and issue of shares, debentures or similar securities offered for purchase, listing on any securities exchange and acquiring a rating for purposes of listing, (iii) income from a registered home ownership savings plan, and, (iv) Income from employment paid in the form of bonuses, overtime, and retirement benefits to employees whose taxable employment income before bonus and overtime allowances does not exceed the lowest tax band will now not be tax allowable.
- Introduction of taxation of lump sum payments from Retirement Benefits schemes for people
2020/2021 Budget
During H1’2020 the Cabinet Secretary for the National Treasury read the FY’2020/21 budget. Some of the highlights from the budget included;
- The total FY’2020/21 budget is estimated at Kshs 3.2 tn, a 2.6% increase from the Kshs 3.1 tn revised FY’2019/20 budget, mainly due to an 18.1% increase in the Consolidated Fund Services (CFS) to Kshs 1.0 bn from Kshs 0.9 bn in the FY’2019/20 revised estimates. The increase in Consolidated Fund Services expenditures is mainly as a result of an increase in public debt servicing expenses which will form 88.0% of the total CFS expenditure,
- For the financial year 2020/2021, the government projects that total revenue will contract by 2.1% to Kshs 1.85 tn from the Kshs 1.89 tn in FY’2019/2020. The decline is mainly due to a 1.3% decline in ordinary revenue to Kshs 1.62 tn from an estimated Kshs 1.64 tn,
- Total expenditure is set to decline by 2.2% to Kshs 2.71 tn from Kshs 2.74 tn as per the revised FY’2019/20 Budget. The Treasury estimates that the post-COVID-19 Economic Stimulus Package will cost Kshs 53.74 bn, and,
- Public debt is expected to continue growing in FY’2020/21 as the approximate Kshs 822.7 bn fiscal deficits will be financed through both domestic and foreign debts. The fiscal deficit (excluding grants) as a share of GDP, is expected to come in at 7.6% in FY’2020/2021 from 5.6% in FY 2019/2020. For more information, see our FY 2020/2021 Pre-Budget Discussion Note
Of the 7 indicators, we track, security and inflation are positive, investor sentiments is neutral and government borrowing, exchange rate, interest rates, and GDP are negative. We have switched our outlook on the 2020 macroeconomic environment from positive to negative depending on how fast the Coronavirus is contained.
Money Markets, T-Bills & T-Bonds Primary Auction:
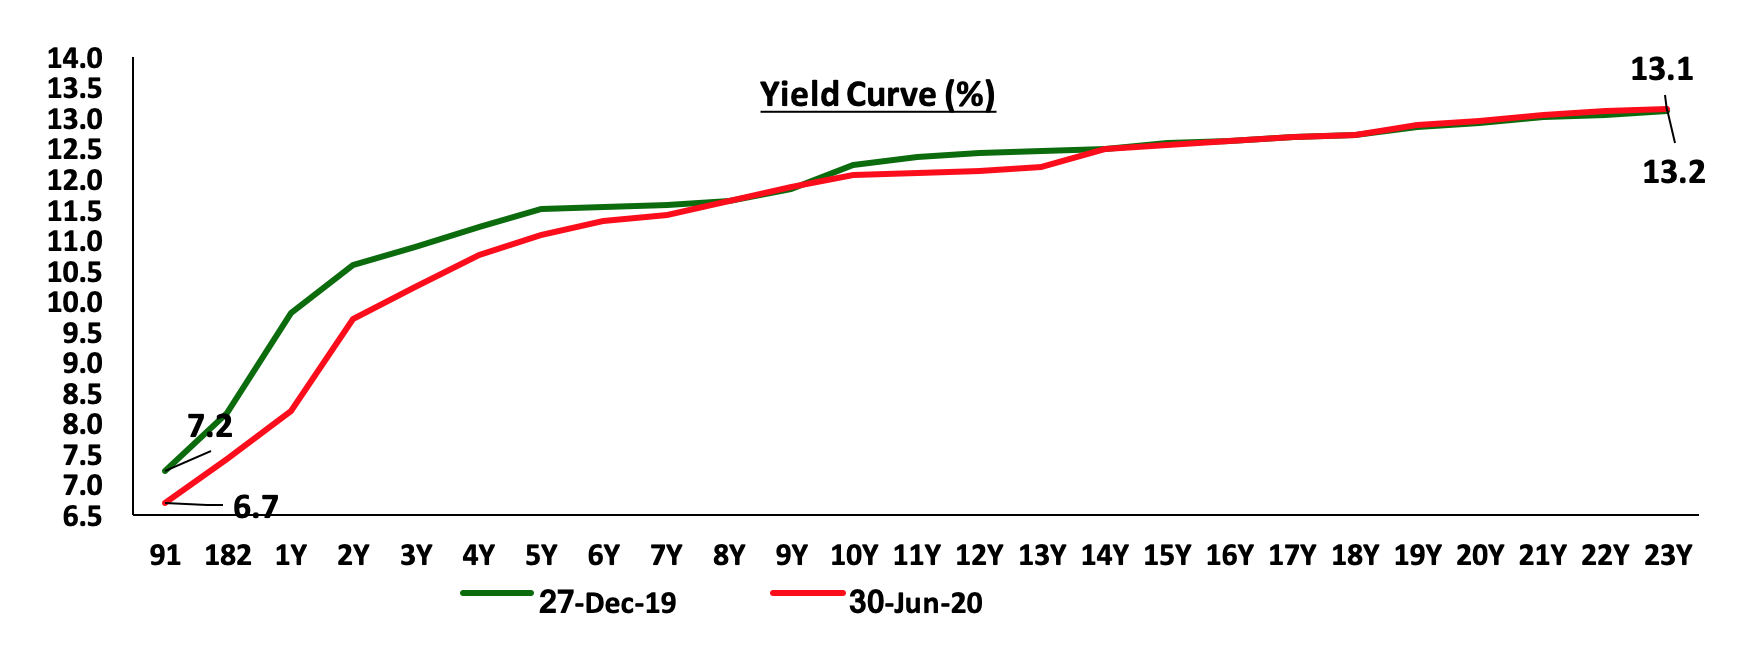
Demand for government securities remained high in the first half of 2020 with Treasury bills being 152.6% subscribed, attracting bids worth Kshs 916.7 bn, and the government accepting Kshs 551.0 bn while Treasury bonds received a 119.6% subscription, Kshs. 414.7 bn worth of bids and the government accepting only Kshs 278.3 m. The yields on the 91-day T-bill and 182-day T-bill declined to 6.7%, 7.4%, and 8.2% in H1’2019, from 7.2%, 8.2%, and 9.8% recorded as at the end of 2019.
During the week, T-bills remained oversubscribed, with the subscription rate coming in at 317.4% up from 245.6% the previous week. The subscription rates for the 91-day paper increased to 511.3% from 245.6% recorded the previous week with investors preferring to hold the shortest dated paper due to uncertainty in the market. The subscription for the 182-day and 364-day papers also increased to 267.5% and 289.8%, respectively, from 140.3% and 284.4%, recorded the previous week. The yields on the 91-day, 182-day, and 364-day papers declined by 15.4 bps, 34.2 bps, and 42.5 bps respectively to 6.5%, 7.0%, and 7.8%. The acceptance rate increased to 57.6%, from 23.3% recorded the previous week, with the government accepting only Kshs 43.9 bn of the Kshs 76.2 bn worth of bids received.
The Central bank of Kenya was keen to ensure that rates remained low and therefore continued to reject expensive bids and this led to a decline in the yields on the short end of the yield curve. Yields on longer-dated papers experienced some slight pressure leading to a 1.0% decline in The FTSE bond index in the first half. The chart below is the yield curve movement during the period.
Secondary Bond Market Activity:
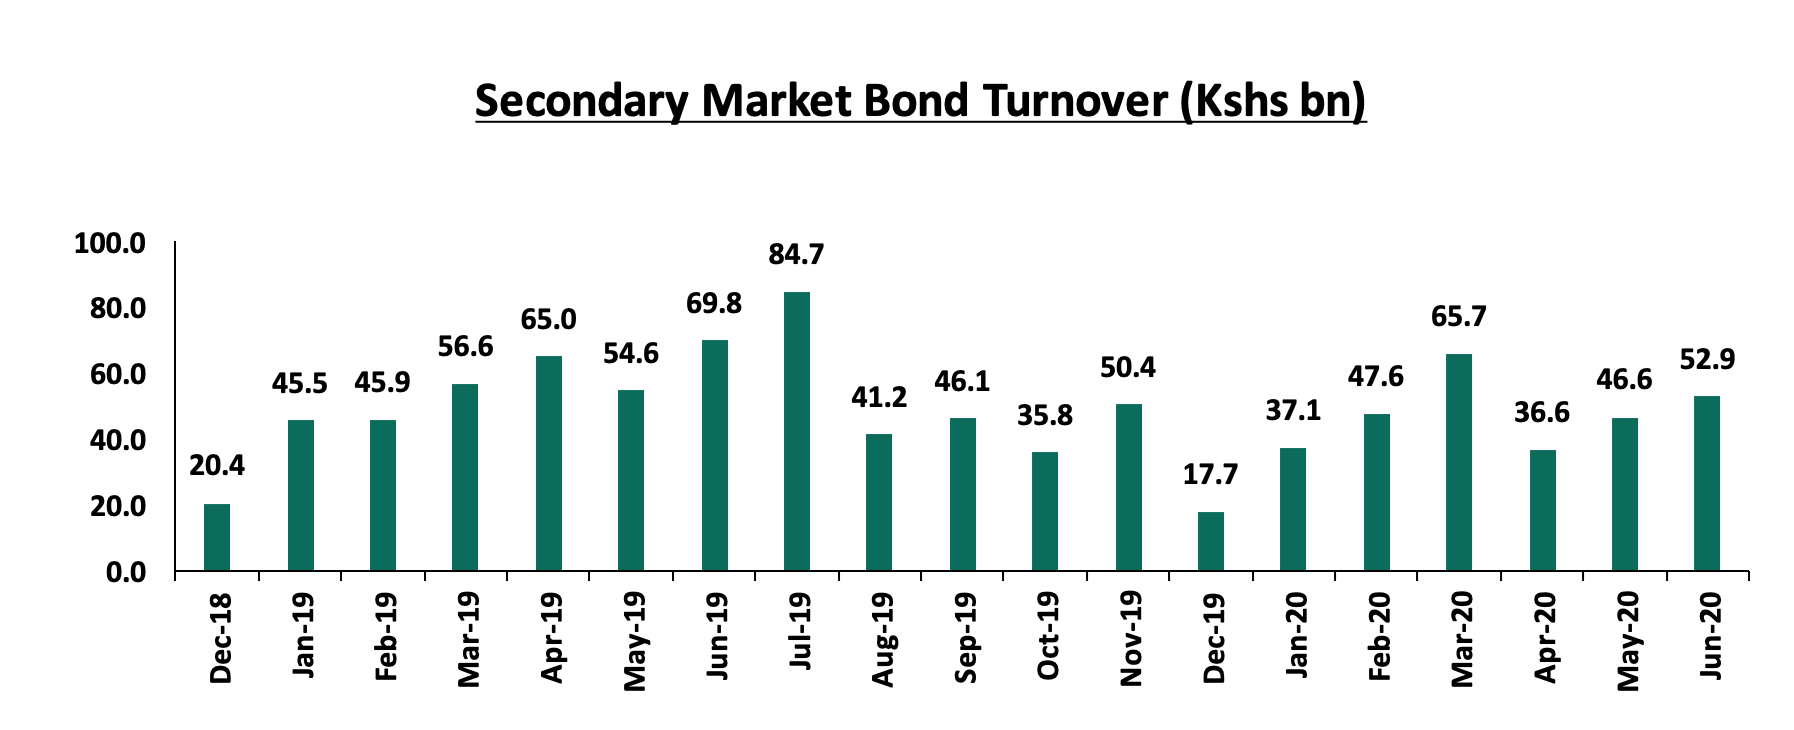
The secondary bond market recorded decreased activity, with the turnover declining by 15.1% to Kshs 286.5 bn from Kshs 337.4 bn in H1’2019. The decline in secondary bond turnover can be attributed to investors’ preference to hold safe assets at the moment due to the uncertainty in the market affecting the performance of riskier asset classes.
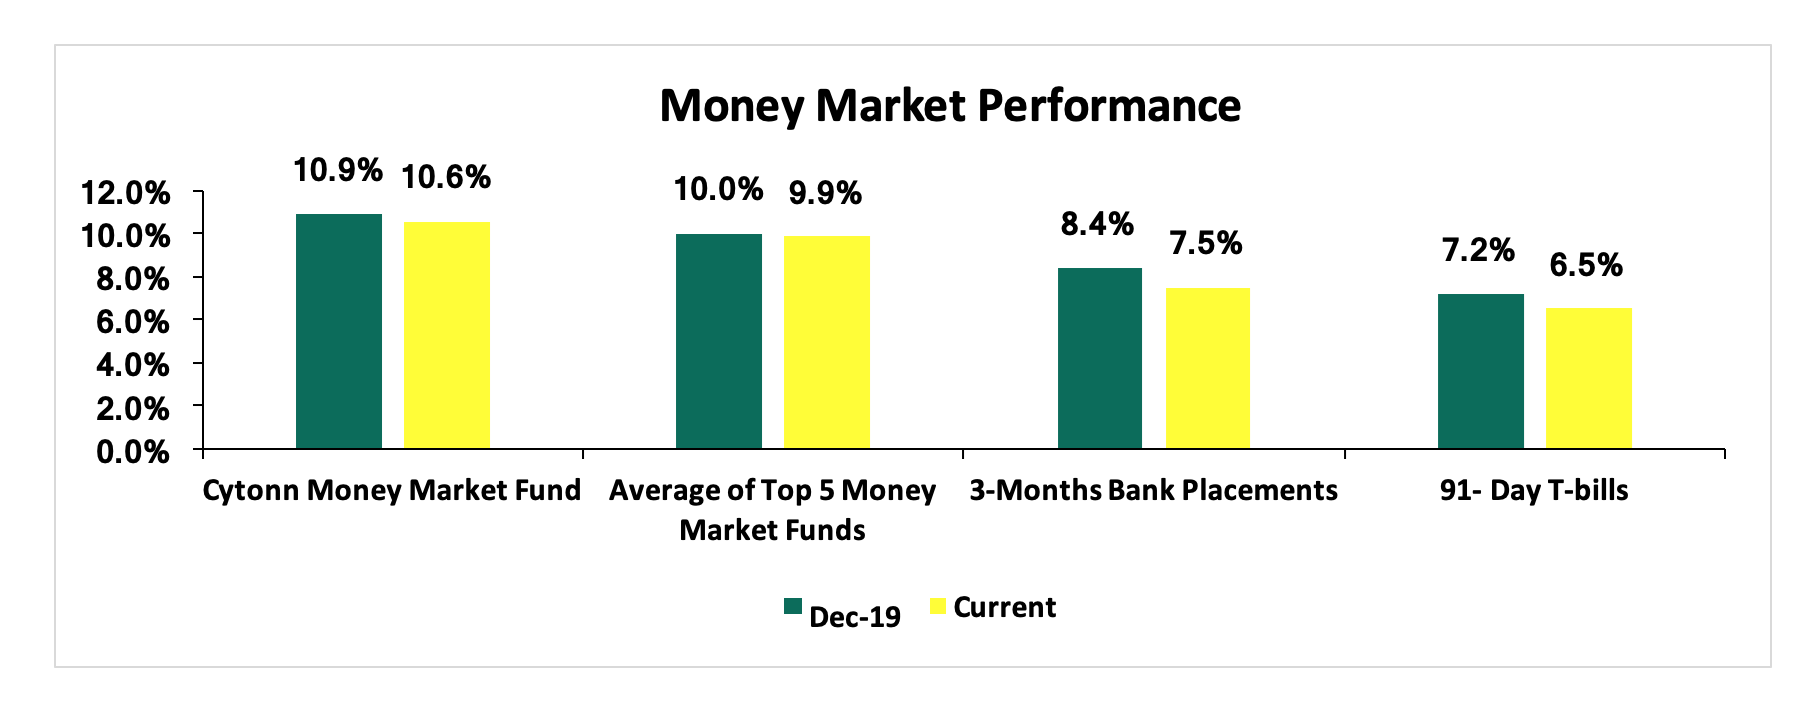
Yields on the money markets remained relatively stable losing slightly as can be seen in the chart below.
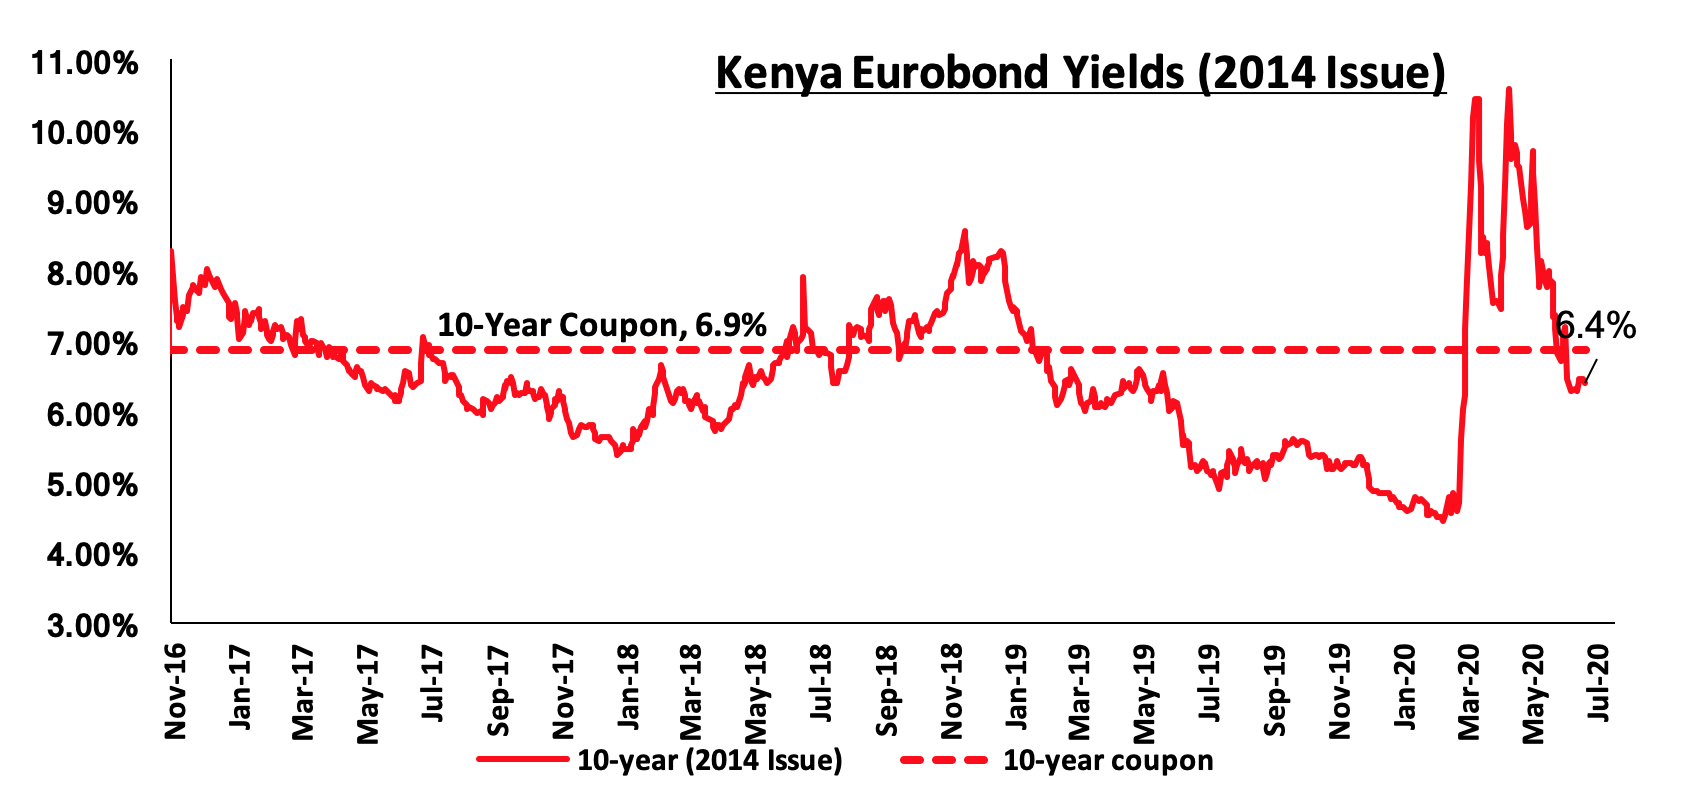
Kenya Eurobonds:
During H1’2020, specifically in March 2020, the yield on all Eurobonds increased significantly attributable to investors attaching a higher risk premium on the country. In the third week of March, there was a sharp increase in the yields of all the issued Eurobonds due to Kenya announcing its first Coronavirus case. Since the jump recorded in March, the investor sentiments have been improving over the past two months attributable to the market reacting to the news by the World Bank that they had approved USD 1.0 bn funding to support the economy as well as the Rapid Credit Facility (RCF) which reaffirmed investors’ confidence despite the recent downgrade by Moody’s where Kenya’s sovereign credit outlook was changed to negative from stable. For more information, see our Cytonn Weekly #19/2020 and Cytonn Weekly #20/2020.
According to Reuters, the yield on the 10-year Eurobond issued in 2014, increased by 1.7% points to close at 6.5%, in H1’2020, from 4.8% at the end of 2019. Key to note is that this bond has 4.0-years to maturity. During the week, the yield on the 10-year Eurobond issued in June 2014 remained unchanged at 6.4%, recorded the previous week.
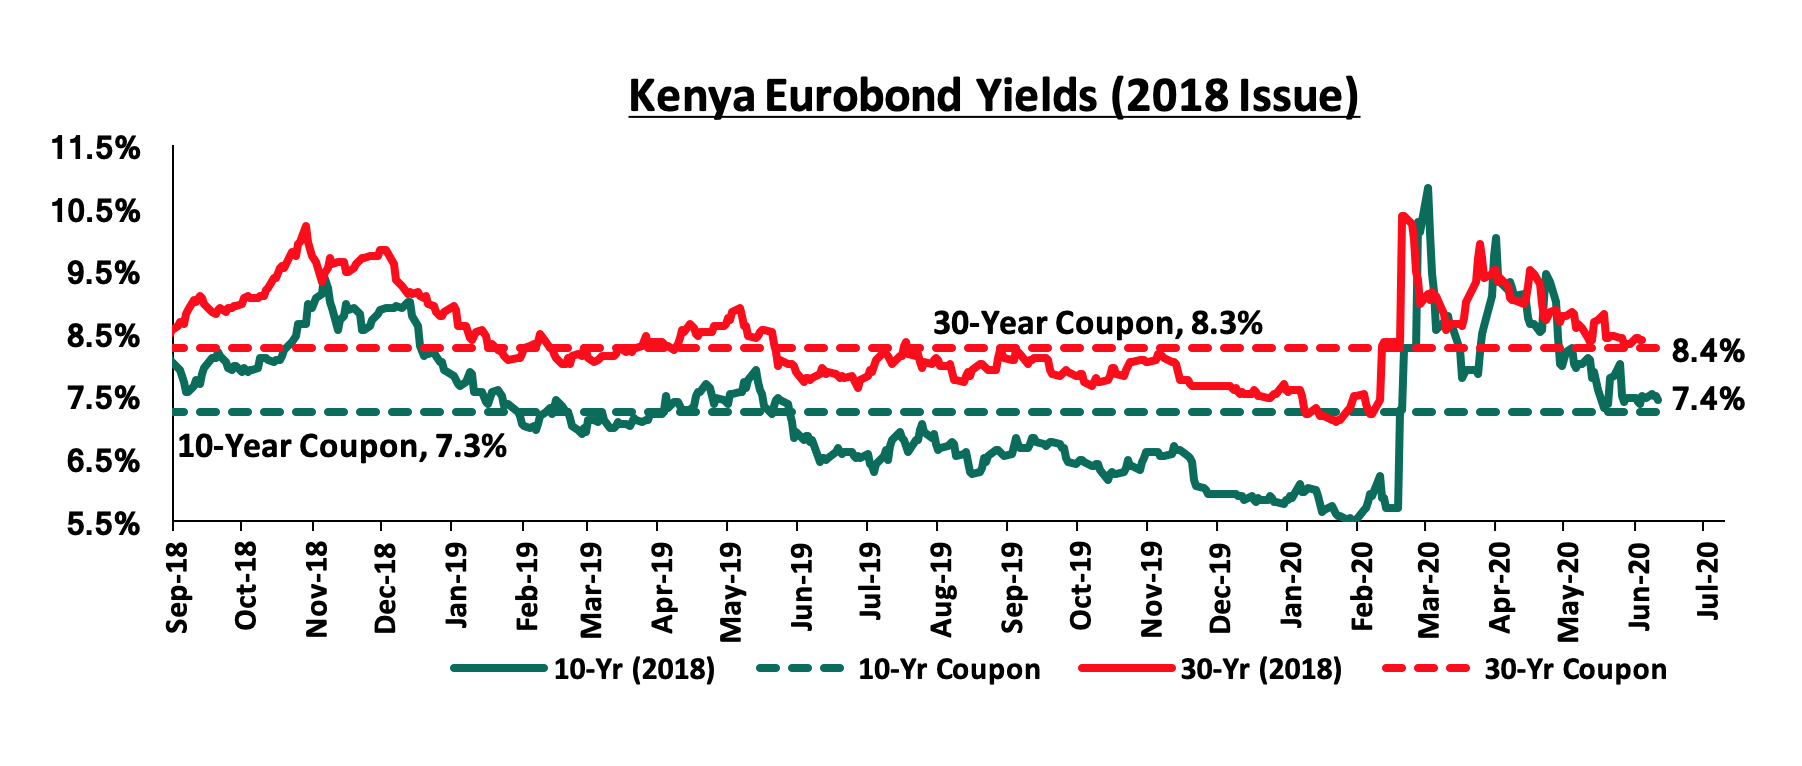
During H1’2020, the yield on the 10-year Eurobond issued in 2018 increased by 1.6% points to close at 7.5% from 5.9% in December 2019. The yield on the 30-year Eurobonds, issued in 2018, remained unchanged at 8.4% similar to what was recorded in December 2019. These bonds have a 7.7-years and 27.7-years to maturity for the 10-year and 30-year, respectively. During the week, the yield on the 30-year Eurobond issued in 2018 remained unchanged at 8.4% while, the yield on the 10-year Eurobonds decreased by 0.1% points to 7.4%, from 7.5% recorded previous week.
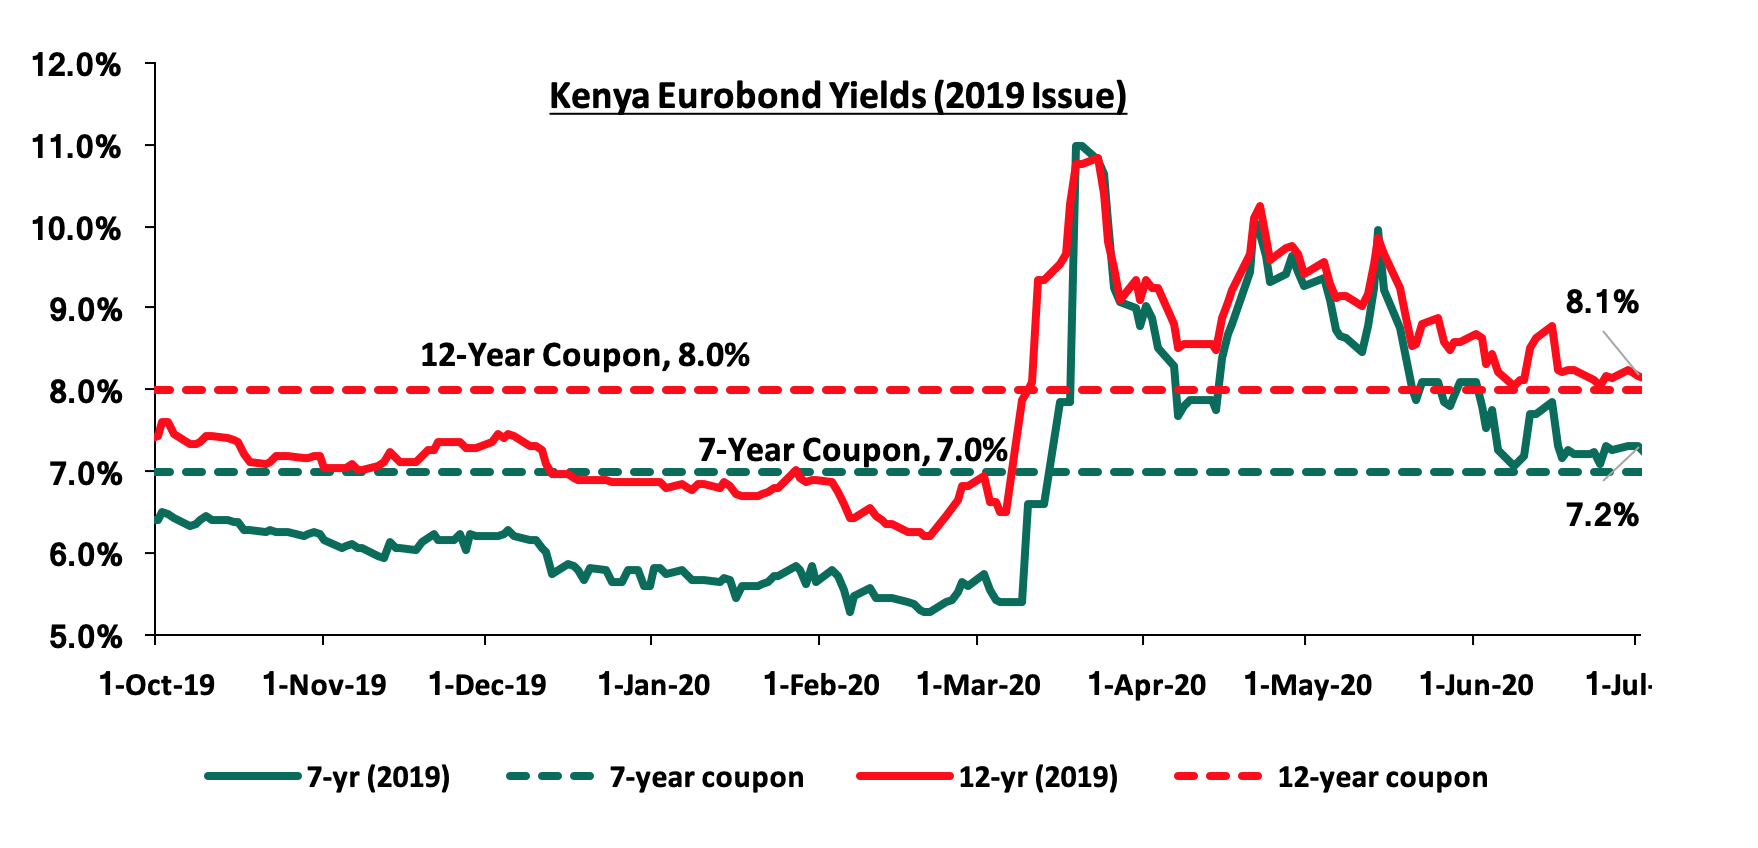
During H1’2020, the yields on the 7-year and 12-year Eurobonds issued in 2019 increased by 1.7% points and 1.3% points, to close at 7.3% and 8.2% from 5.6% and 6.9% recorded at the close of Q4’2019, respectively. Key to note is that these bonds have 6.9-years and 11.9-years to maturity respectively. During the week, the yield on the 7-year Eurobond issued in 2019 declined by 0.1% points, to 7.2%, from 7.3% recorded the previous week while the yields on the 12-year Eurobond issued in 2019 remaining unchanged at 8.1% similar to what was recorded the previous week.
Rates in the fixed income market have remained relatively stable as the government rejects expensive bids. We believe that the uncertainty affecting the global financial markets brought about by the novel Coronavirus will make it harder for the government to access foreign debt, and might result in investors attaching a high-risk premium on the country. As a result of depressed revenue collection with the revenue target for FY’2020/2021 at Kshs 1.9 tn, we expect a higher budget deficit, which the Treasury estimates at 7.5% of GDP, creating uncertainty in the interest rate environment as additional borrowing from the domestic market will be required to plug in the deficit. Owing to this uncertain environment, our view is that investors should be biased towards short-term fixed income securities to reduce duration risk.
Markets Performance
In H1’2020, the equities market was on a downward trend, with NASI, NSE 20 and NSE 25 declining by 17.3%, 26.8% and 21.5%, respectively. The equities market performance during the first half was driven by losses recorded by large caps such as:
|
No |
Company |
Loss In Percentage |
|
1 |
Bamburi |
65.0% |
|
2 |
BAT |
36.5% |
|
3 |
Equity Group |
35.1% |
|
4 |
DTBK |
35.1% |
|
5 |
KCB |
32.7% |
|
6 |
NCBA |
28.0% |
|
7 |
Co-operative bank |
25.7% |
|
8 |
ABSA |
25.1% |
During the week, the equities market recorded mixed performances, with NASI and NSE 20 recording gains of 1.3% and 0.4%, respectively, while NSE 25 declined by 0.4%, taking their YTD performance to losses of 16.1%, 26.7%, and 21.5%, for NASI, NSE 20 and NSE 25, respectively. The NASI performance was driven by gains recorded by large-cap stocks such as Safaricom, Bamburi and SCBK, which gained by 4.0%, 2.8% and 1.3%, respectively. The gain was however weighed down by losses recorded by other large-cap stocks such as Equity Bank, EABL, KCB, BAT and Co-operative bank of 6.3%, 4.4%, 3.7%, 3.1% and 2.4%, respectively. For the last twelve months (LTM), NASI, NSE 25 and NSE 20 have declined by 8.0%, 10.3% and 26.2%, respectively.
In H1’2020, equities turnover increased by 5.0% to USD 808.8 mn from USD 770.2 mn in H1’2019. Foreign investors turned net sellers in H1’2020 with a net selling position of USD 216.5 mn from a net buying position of USD 23.3 mn in H1’2019. During the week, equities turnover declined by 44.8% to USD 14.4 mn, from USD 26.1 mn recorded the previous week, taking the YTD turnover to USD 816.0 mn. Foreign investors remained net sellers during the week, with a net selling position of USD 4.3 mn, from a net selling position of USD 12.3 mn recorded the previous week, taking the YTD net selling position to USD 218.1 mn.
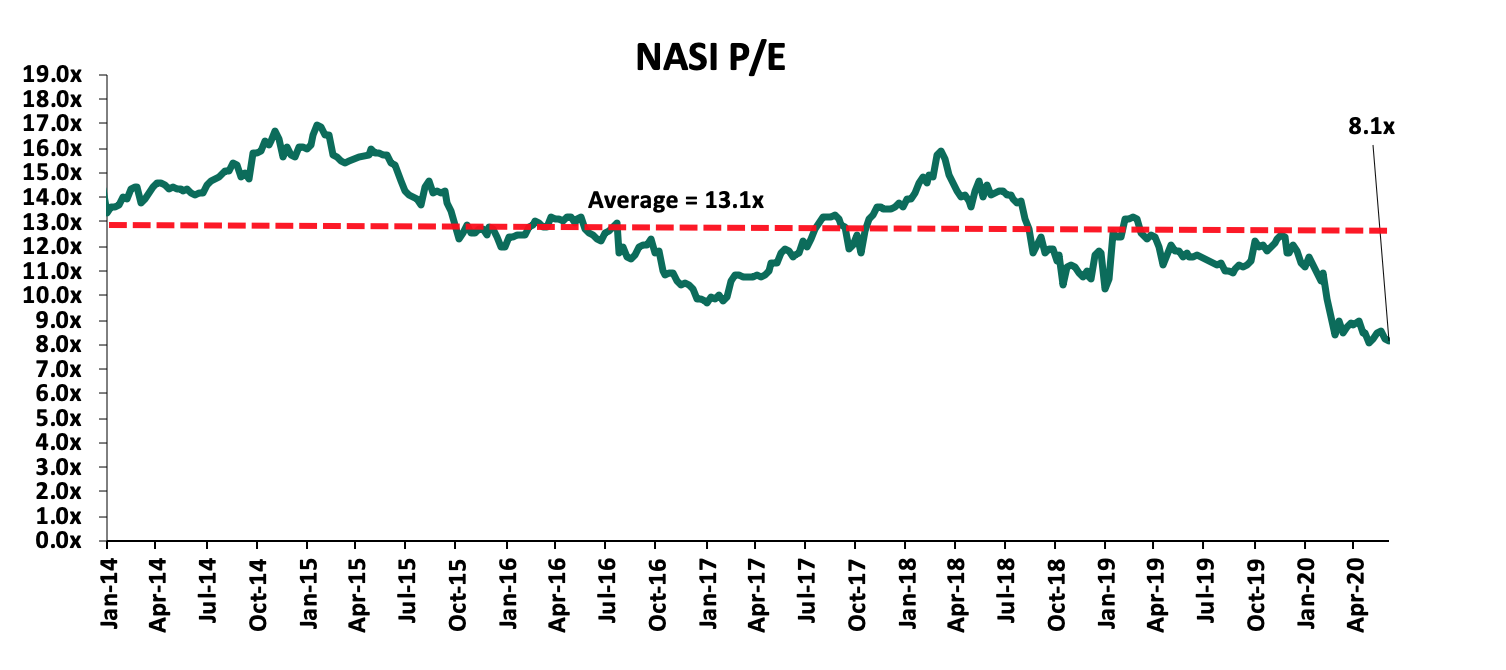
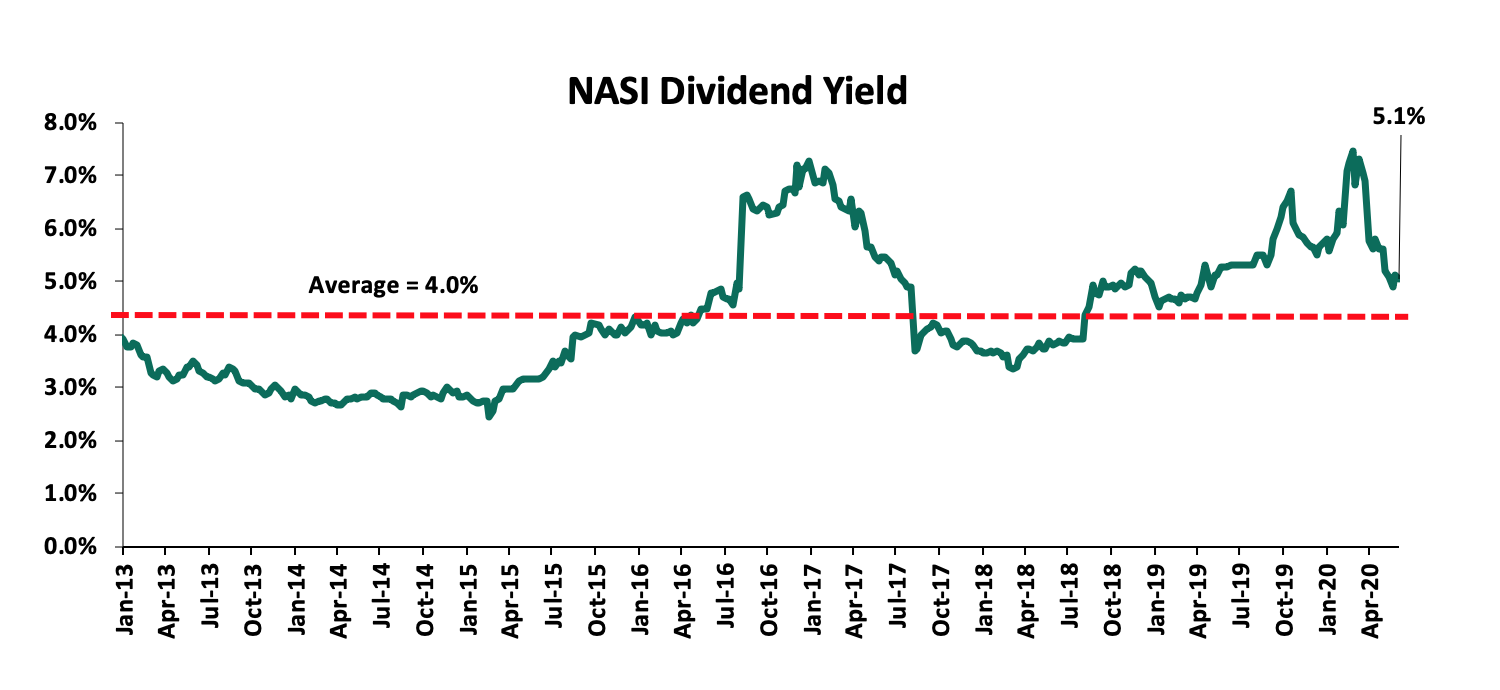
The market is currently trading at a price to earnings ratio (P/E) of 8.1x, 37.9% below the historical average of 13.1x. The average dividend yield is currently at 5.1%, unchanged from the previous week, and 1.1% points above the historical average of 4.0%. With the market trading at valuations below the historical average, we believe there are pockets of value in the market for investors with higher risk tolerance and are willing to wait out the pandemic. The current P/E valuation of 8.1x is 1.1% above the most recent valuation trough of 8.0x
During the first half of 2020, banks released their FY’2019 and Q1’2020 results, recording earnings growth and loss of 8.9% and (7.4%) in their core EPS in FY’2019 and Q1’2020, respectively.
Listed Banks Q1’2020 Highlights:
Kenyan listed banks released their Q1’2020 results, recording a 7.4% average decline in core Earnings per Share (EPS) compared to a growth of 12.2% in Q1’2019. The performance for Kenyan listed banks in Q1’2020 is summarized below:
|
Bank |
Core EPS Growth |
Interest Income Growth |
Interest Expense Growth |
Net Interest Income Growth |
Net Interest Margin |
Non-Funded Income Growth |
NFI to Total Operating Income |
Growth in Total Fees & Commissions |
Deposit Growth |
Growth in Government Securities |
Loan to Deposit Ratio |
Loan Growth |
Return on Average Equity |
|
ABSA |
17.0% |
2.8% |
(1.9%) |
4.5% |
7.4% |
9.1% |
15.8% |
(0.2%) |
6.6% |
7.2% |
85.0% |
12.4% |
17.0% |
|
KCB |
8.4% |
20.4% |
26.6% |
18.5% |
8.1% |
30.5% |
34.4% |
33.6% |
34.1% |
52.0% |
74.8% |
19.3% |
20.0% |
|
DTBK |
3.7% |
(2.4%) |
(9.0%) |
2.9% |
5.7% |
3.4% |
25.4% |
9.6% |
(0.9%) |
1.9% |
73.8% |
6.7% |
12.6% |
|
COOP |
(0.3%) |
4.5% |
(4.4%) |
8.5% |
8.2% |
19.0% |
39.9 % |
28.3% |
6.9% |
11.5% |
81.3% |
9.8% |
18.5% |
|
Equity |
(14.1%) |
14.3% |
26.7% |
10.6% |
8.2% |
15.8% |
41.9% |
12.5% |
16.5% |
14.2% |
75.9% |
24.1% |
20.7% |
|
SCBK |
(16.6%) |
(4.3%) |
(1.3%) |
(5.1%) |
7.2% |
(6.5%) |
32.1% |
(5.2%) |
4.6% |
(13.7%) |
51.5% |
6.8% |
15.8% |
|
NCBA *** |
(26.8%) |
6.8% |
8.3% |
5.5% |
3.3% |
25.9% |
49.7% |
49.7% |
9.9% |
66.2% |
63.0% |
2.2% |
10.7% |
|
I&M |
(29.7%) |
5.7% |
7.1% |
4.6% |
5.8% |
7.4% |
38.8% |
12.9% |
8.8% |
(2.6%) |
76.0% |
8.3% |
17.5% |
|
Stanbic |
(33.5%) |
(7.1%) |
0.5% |
(11.0%) |
5.5% |
(29.2%) |
43.2% |
(37.6%) |
6.4% |
(19.9%) |
79.8% |
11.8% |
14.1% |
|
HF |
N/A |
(7.8%) |
(20.9%) |
13.7% |
4.5% |
(2.0%) |
30.4% |
(3.7%) |
11.8% |
39.3% |
101.1% |
(8.5%) |
0.5% |
|
Q1’2020 Mkt Weighted Average* |
(7.4%) |
8.2% |
11.4% |
7.4% |
7.2% |
15.9% |
22.7% |
24.5% |
14.3% |
14.9% |
74.1% |
14.1% |
17.2% |
|
Q1’2019 Mkt Weighted Average** |
12.2% |
3.6% |
2.5% |
4.5% |
8.0% |
10.7% |
36.0% |
11.2% |
11.0% |
16.1% |
74.0% |
7.7% |
19.2% |
|
*Market cap-weighted as at 02/06/2020 |
|||||||||||||
|
**Market cap weighted as at 31/05/2019 ***The financial statements of the bank have been prepared on a prospective basis (assuming a continuation of CBA), representing Q1’2020 results of NCBA bank (merged bank) with prior year comparatives (Q1’2019) being those of CBA bank. Hence, the results are not comparable on a like for like basis. As such, we have used proforma-combined financials for the two entities. |
|||||||||||||
Key take-outs from the above table include:
- Listed Kenyan banks recorded a 7.4% average decline in core Earnings per Share (EPS) compared to a growth of 12.2% in Q1’2019, the depressed earnings recorded in the listed banking sector is partly attributed to the tough operating environment occasioned by the ongoing Coronavirus pandemic, which saw total operating expenses increase by 25.6%, outpacing the 10.3% increase recorded on total operating income,
- Listed Banks recorded a deposit growth of 14.3%, faster than the 11.0% growth recorded in Q1’2019. Interest expenses, on the other hand, rose by 11.4%, faster than 2.5%, recorded in Q1’2019. The cost of funds, however, declined coming in at a weighted average of 3.1% in Q1’2020 down from 3.5% in Q1’2019 owing to the faster 12.2% growth average interest-bearing liabilities indicating that the listed banks were able to mobilize cheaper deposits,
- Average loan growth came in at 14.1%, which was faster than the 7.7% recorded in Q1’2019, with the growth in loans being accelerated following the repeal of interest rate cap in November 2019, coupled with increased demand in funding, as businesses demand working capital to operate in the tough operating environment as a result of the pandemic,
- Interest income rose by 8.2%, compared to a growth of 3.6% recorded in Q1’2019. The faster growth in interest income may be attributable to the 14.1% growth in loans and increased allocation to government securities. The net interest income increased by 7.4% slower than the 10.7% rise in average interest-earning assets. Consequently, the Net Interest Margin (NIM) declined to 7.2%, compared to the 8.0% recorded in Q1’2019 for the whole listed banking sector, and,
- Non-Funded Income grew by 15.9% y/y, faster than 10.7% recorded in Q1’2019. The growth in NFI was supported by the 24.5% average increase in total fee and commission income, which was faster than the 11.2% growth recorded in Q1’2019. For more information, please see our Q1’2020 Listed Banks Report.
Half-Year Highlights:
During the first half of 2020:
- The Central Bank of Kenya gave a go-ahead to Nigerian lender, Access Bank PLC to acquire a 100% stake in Transnational Bank PLC for an undisclosed amount, with Access Bank PLC targeting to enhance its corporate and retail banking business in Kenya through the acquisition. For more information see our Cytonn Weekly #03/2020,
- Barclays Bank of Kenya officially commenced trading on the Nairobi Securities Exchange (NSE) as ABSA Bank Kenya Plc, after the bourse temporarily suspended the trading of the lender’s shares to allow the settlement of outstanding obligations as well as a change of its trading ticker code, as the lender finalized its brand transition. For more information see our Cytonn Weekly #07/2020,
- The Central Bank of Kenya (CBK) announced the acquisition of a 51.0% stake in Mayfair Bank Limited by Egyptian lender, Commercial International Bank (CIB), effective 1stMay 2020 for an undisclosed amount following CBK’s approval on 7th April 2020. For more information, please see Cytonn Weekly #17/2020,
- NCBA Group, the third-largest bank by assets in Kenya, with an asset base of Kshs 509.6 bn as at March 2020, announced it would withhold the final dividend payment of Kshs 1.5 per share, to shareholders totalling to Kshs 2.2 bn for FY’2019. For more information, please see Cytonn Weekly #17/2020,
- Global rating agency Moody’s changed the outlook for KCB, Equity and Co-operative Bank to “Negative” from “Stable” but affirmed all three banks’ local currency deposit ratings at B2, citing the link between their rating and that of the state due to the top banks’ large exposure to government securities, which poses a risk to their credit profile. For more information, please see Cytonn Weekly #20/2020
- Equity Group announced it had mutually agreed with Atlas Mara to call off plans to acquire banking assets in four countries in exchange for shares in Equity Group. For more information, please see Cytonn Weekly #26/2020,
- Jamii Bora Bank (JBB), disclosed Co-operative bank had offered an initial Kshs 1.0 bn for a 90.0% stake in Jamii Bora Bank, effectively valuing Jamii Bora Bank at Kshs 1.1 bn. For more information, please see Cytonn Weekly #26/2020, and,
- The Board of Directors for Equity Group withdrew their recommendation to pay a first and final dividend of Kshs 2.50 per share for FY’2019 and instead recommended to shareholders that no dividend be paid for FY2019. For more information, please see Cytonn Monthly- May 2020.
Universe of Coverage:
|
Company |
Price at 26/06/2020 |
Price at 03/07/2020 |
w/w change |
q/q change |
YTD Change |
Year Open |
Target Price* |
Dividend Yield |
Upside/ Downside** |
P/TBv Multiple |
Recommendation |
|
Diamond Trust Bank*** |
70.0 |
70.0 |
0.0% |
(19.6%) |
(35.8%) |
109.0 |
175.0 |
3.9% |
153.9% |
0.4x |
Buy |
|
Kenya Reinsurance |
2.2 |
2.2 |
0.0% |
(9.3%) |
(26.7%) |
3.0 |
4.6 |
5.0% |
112.2% |
0.2x |
Buy |
|
KCB Group*** |
36.4 |
35.1 |
(3.7%) |
3.9% |
(35.1%) |
54.0 |
56.2 |
10.0% |
70.3% |
0.9x |
Buy |
|
I&M Holdings*** |
50.0 |
49.4 |
(1.3%) |
(1.5%) |
(8.6%) |
54.0 |
76.3 |
5.2% |
59.8% |
0.8x |
Buy |
|
Co-op Bank*** |
12.5 |
12.2 |
(2.4%) |
(5.4%) |
(25.4%) |
16.4 |
18.0 |
8.2% |
55.7% |
1.0x |
Buy |
|
Equity Group*** |
35.1 |
32.9 |
(6.3%) |
2.2% |
(38.6%) |
53.5 |
50.7 |
0.0% |
54.3% |
1.2x |
Buy |
|
Stanbic Holdings |
82.0 |
80.3 |
(2.1%) |
(8.4%) |
(26.5%) |
109.3 |
111.2 |
8.8% |
47.4% |
1.0x |
Buy |
|
ABSA Bank*** |
10.1 |
10.1 |
(0.5%) |
(1.0%) |
(24.7%) |
13.4 |
13.2 |
10.9% |
42.3% |
1.3x |
Buy |
|
Jubilee Holdings |
250.0 |
250.0 |
0.0% |
(9.3%) |
(28.8%) |
351.0 |
334.8 |
3.6% |
37.5% |
0.9x |
Buy |
|
NCBA*** |
27.1 |
26.5 |
(2.0%) |
(6.5%) |
(28.1%) |
36.9 |
35.6 |
0.9% |
35.3% |
0.8x |
Buy |
|
Sanlam |
13.7 |
13.7 |
0.0% |
(10.0%) |
(20.6%) |
17.2 |
18.4 |
0.0% |
34.8% |
1.3x |
Buy |
|
Standard Chartered*** |
167.0 |
169.3 |
1.3% |
(4.6%) |
(16.4%) |
202.5 |
202.7 |
7.4% |
27.1% |
1.5x |
Buy |
|
Liberty Holdings |
7.2 |
8.0 |
11.4% |
(5.0%) |
(22.3%) |
10.4 |
9.8 |
0.0% |
22.3% |
0.7x |
Buy |
|
Britam |
7.8 |
7.6 |
(2.6%) |
17.2% |
(15.6%) |
9.0 |
7.6 |
3.3% |
3.3% |
0.7x |
Lighten |
|
CIC Group |
2.3 |
2.3 |
(1.7%) |
4.1% |
(15.7%) |
2.7 |
2.1 |
0.0% |
(7.1%) |
0.8x |
Sell |
|
HF Group |
4.5 |
4.5 |
0.2% |
5.5% |
(29.7%) |
6.5 |
4.0 |
0.0% |
(11.9%) |
0.2x |
Sell |
|
*Target Prices as per Cytonn Analyst estimates **Upside/ (Downside) is adjusted for Dividend Yield ***Companies in which Cytonn and/or its affiliates are invested in |
|||||||||||
We are “Neutral” on equities for investors because, despite the sustained price declines, which have seen the market P/E decline to below its historical average presenting investors with attractive valuations in the market, the economic outlook remains grim.
According to the KNBS Quarterly GDP Report Q1'2020, the real estate sector grew by 4.3% in Q1’2020, 0.5% points lower than Q1’2019, attributable to a decline in activity amidst a tough financial environment. The value of buildings approved in the first two months of the year according to KNBS Leading Economic Indicators May 2020 was Kshs 96.9 bn, an increase of 174.4% compared to the same period last year, which in our view was from the clearing of the backlog created in 2019 due to delays with the Nairobi City County technical planning committee. Going forward, we expect the following challenges to persist (i) constrained financing to developers as financiers such as banks aim to limit exposure amidst increasing loan deferrals and defaults, (ii) supply chain constraints as the import of supplies required by builders and developers are interrupted, and (iii) reduced revenue due to slow market uptake and downward pressure on prices and rents.
Despite the above limitations, we expect the growing need for low-cost housing, increased infrastructural improvements and the scaling down in new supply, to continue boosting the sector’s performance beyond the ongoing crisis. Over the long term, real estate will remain an attractive asset class as it continues to offer good risk-adjusted returns that are less correlated to other asset classes.
Sectorial Market Performance:
I. Residential Sector
The residential market continued to hold up fairly well despite the ongoing crisis with the detached units’ market recording an average annual price appreciation of 0.3%. This is in comparison to the apartment market’s average of (0.2%) and attributable to less supply of standalone units coupled with growing demand by homebuyers. The apartment market has continued to expand in supply, which is largely due to the high land costs, especially in Nairobi County.
|
Residential Performance Summary H1’2020 |
|||||||||
|
Segment |
Average Rental Yield H1'2020 |
Average Y/Y Price Appreciation H1'2020 |
Average Total Returns H1'2020 |
Average Rental Yield FY'19 |
Average Y/Y Price Appreciation FY'19 |
Average Total Returns FY'19 |
Change in Rental Yield (% Points) |
Change in Price Appreciation (% Points) |
Change in Total Returns (% Points) |
|
Detached Units |
|||||||||
|
High End |
4.2% |
0.0% |
4.2% |
3.7% |
0.1% |
3.8% |
0.5% |
(0.1%) |
0.4% |
|
Upper Mid-End |
4.9% |
1.4% |
6.2% |
4.1% |
0.1% |
4.2% |
0.8% |
1.3% |
2.0% |
|
Satellite Towns |
4.8% |
(0.4%) |
4.4% |
3.9% |
0.4% |
4.3% |
0.9% |
(0.8%) |
0.1% |
|
Average |
4.6% |
0.3% |
5.0% |
3.9% |
0.2% |
4.1% |
0.7% |
0.1% |
0.9% |
|
Apartments |
|||||||||
|
Upper Mid-End |
5.4% |
(0.7%) |
4.6% |
5.0% |
0.4% |
5.3% |
0.4% |
(1.1%) |
(0.7%) |
|
Lower Mid-End: Suburbs |
5.7% |
0.3% |
6.1% |
4.8% |
0.4% |
5.3% |
0.9% |
(0.1%) |
0.8% |
|
Lower Mid-End: Satellite Towns |
5.4% |
(0.1%) |
5.3% |
4.5% |
0.6% |
5.1% |
0.9% |
(0.7%) |
0.2% |
|
Average |
5.5% |
(0.2%) |
5.3% |
4.8% |
0.5% |
5.2% |
0.7% |
(0.6%) |
0.1% |
|
· In H1’2020, the residential sector remained relatively stable with select sectors softening in performance, albeit marginally. The apartment market recorded declines in price appreciation across all segments while the upper mid-end market for detached units recorded a positive change of 1.3% as asking prices continued to increase in markets such as Lavington and Ridgeways, due to their appeal to the growing middle class · On average, total returns came in at 5.0% and 5.3% for detached units and apartments, respectively, an increase of 0.9% and 0.1% from FY’2019. This was a result of growth in rental yields which grew by 0.7% on average |
|||||||||
Source: Cytonn Research
a) .Detached Units
The detached units market showed resilience as annual price appreciation averaged at 0.3%. The market, however, recorded a slight drop in uptake and average occupancy rates which came in at 84.7% and 18.0%, respectively compared to 85.0% and 18.8% in Q1’2020. Asking price per SQM for detached units dropped by 1.1% in the second quarter averaging at Kshs 135,042 from Kshs 136,599 in Q1’2020. Ridgeways and Lavington recorded the highest price growth at 3.0% and 1.6%, respectively attributable to the areas’ appeal to the growing middle-class pre-COVID. The lower mid-end and upper mid-end markets recorded average rental yields of 4.8% and 4.9%, respectively compared to high-end markets’ average of 4.2% as they continued to record relatively higher occupancy rates.
(All Values in Kshs Unless Stated Otherwise)
|
Detached Units Performance H1’2020 |
|||||||||||
|
Area |
Average Price per SQM |
Average Rent per SQM |
Average Occupancy |
Average Annual Uptake |
Average Rental Yield |
Average Annual Price Appreciation |
Annual Total Returns |
||||
|
High-End |
|||||||||||
|
Runda |
206,185 |
836 |
89.1% |
17.6% |
4.3% |
0.7% |
5.0% |
||||
|
Rosslyn |
172,556 |
830 |
85.7% |
14.0% |
4.7% |
(0.1%) |
4.7% |
||||
|
Karen |
192,070 |
756 |
83.7% |
17.2% |
4.1% |
0.3% |
4.4% |
||||
|
Kitisuru |
213,247 |
751 |
85.4% |
18.2% |
4.4% |
0.0% |
4.4% |
||||
|
Lower Kabete |
140,159 |
508 |
67.3% |
15.6% |
3.7% |
(1.2%) |
2.5% |
||||
|
Average |
184,843 |
736 |
82.3% |
16.5% |
4.2% |
0.0% |
4.2% |
||||
|
Upper Mid-End |
|||||||||||
|
Ridgeways |
143,915 |
682 |
90.0% |
17.8% |
5.5% |
3.0% |
8.5% |
||||
|
South B/C |
120,061 |
556 |
94.9% |
18.6% |
5.2% |
0.6% |
5.8% |
||||
|
Langata |
144,991 |
659 |
87.4% |
17.8% |
4.9% |
0.9% |
5.8% |
||||
|
Lavington |
179,656 |
720 |
80.2% |
18.8% |
4.0% |
1.6% |
5.6% |
||||
|
Runda Mumwe |
153,811 |
716 |
85.5% |
24.1% |
4.8% |
0.7% |
5.5% |
||||
|
Average |
148,487 |
667 |
87.6% |
19.4% |
4.9% |
1.4% |
6.2% |
||||
|
Lower Mid-End |
|||||||||||
|
Ruiru |
86,159.8 |
392 |
67.3% |
20.6% |
5.5% |
0.3% |
5.8% |
||||
|
Kitengela |
67,719.5 |
318 |
88.3% |
17.7% |
5.2% |
0.0% |
5.2% |
||||
|
Juja |
52,155.5 |
248 |
90.1% |
17.1% |
3.8% |
0.0% |
3.8% |
||||
|
Syokimau |
70,826.5 |
276 |
79.8% |
16.7% |
4.8% |
(1.1%) |
3.7% |
||||
|
Athi River |
82,117.8 |
334 |
94.5% |
18.2% |
4.7% |
(1.2%) |
3.5% |
||||
|
Average |
71,796 |
313 |
84.0% |
18.1% |
4.8% |
(0.4%) |
4.4% |
||||
Source: Cytonn Research
b). Apartments
The apartment market performance was characterized by a marginal drop in annual price appreciation averaging (0.2%). This was attributable to price discounts offered by various developers in a bid to sell off old stock. Average price per SQM came in at Kshs 96,543 in comparison to Kshs 98,352 in Q1’2020. However, the apartment rental market remained relatively strong with rental yields averaging 5.5% compared to 4.9% in H1’2019, attributable to an increase in occupancy rates which averaged at 86.7% compared to 84.3% in the same period in 2019.
The upper mid-end markets recorded a negative price appreciation of (0.7%) attributable to decline in asking prices in markets such as Kileleshwa and Kilimani which are experiencing a price correction whereas Westlands’ annual price appreciation averaged 1.6% attributable to growing investor demand due to the growing market for short-stay luxury apartments boosted by the area’s appeal to expatriates due to good location in relation to other commercial nodes, presence of amenities as well as infrastructure.
In the lower mid-end market, markets such as Dagoretti and Thindigua recorded a price appreciation of 3.1% and 1.2%, respectively, driven by demand from Nairobi’s working populations.
Overall, rental yields in the apartment market remained attractive averaging 5.5% compared to detached markets average of 4.6%.
(All Values in Kshs Unless Stated Otherwise)
|
Apartments Performance H1’2020 |
|||||||
|
Area |
Average Price Per SQM |
Average Rent per SQM |
Average Occupancy |
Average Annual Uptake |
Average Rental Yield |
Average Annual Price Appreciation |
Annual Total Returns |
|
Upper Mid-End |
|||||||
|
Westlands |
129,667 |
688 |
89.6% |
23.9% |
5.2% |
1.6% |
6.8% |
|
Parklands |
114,031 |
611 |
95.7% |
17.1% |
5.8% |
0.3% |
6.1% |
|
Loresho |
113,336 |
550 |
90.8% |
13.9% |
5.2% |
0.0% |
5.2% |
|
Kilimani |
112,523 |
623 |
88.3% |
20.0% |
5.8% |
(2.7%) |
3.1% |
|
Kileleshwa |
110,909 |
578 |
75.3% |
17.6% |
5.0% |
(3.0%) |
2.0% |
|
Average |
116,093 |
610 |
87.9% |
18.5% |
5.4% |
(0.7%) |
6.0% |
|
Lower Mid-End: Suburbs |
|||||||
|
Dagoretti |
101,335 |
500 |
85.0% |
21.9% |
5.8% |
3.1% |
8.8% |
|
South C |
110,644 |
589 |
96.9% |
22.7% |
6.0% |
0.1% |
6.1% |
|
Langata |
98,863 |
515 |
94.5% |
21.3% |
5.6% |
0.5% |
6.1% |
|
Ngong Road |
96,546 |
568 |
76.2% |
18.0% |
5.3% |
(0.6%) |
4.7% |
|
Kahawa West |
69,885 |
403 |
85.6% |
13.3% |
5.9% |
(1.4%) |
4.5% |
|
Average |
95,454 |
515 |
87.7% |
19.4% |
5.7% |
0.3% |
6.1% |
|
Lower Mid-End: Satellite Towns |
|||||||
|
Thindigua |
111,444 |
555 |
88.2% |
22.0% |
5.9% |
1.2% |
7.1% |
|
Athi River |
58,444 |
332 |
87.4% |
16.6% |
6.1% |
0.0% |
6.1% |
|
Ruaka |
101,279 |
520 |
89.5% |
22.6% |
5.5% |
0.1% |
5.6% |
|
Kikuyu |
82,376 |
400 |
83.3% |
18.2% |
5.0% |
(1.7%) |
3.3% |
|
Ruiru |
88,674 |
475 |
74.5% |
19.7% |
4.6% |
0.0% |
4.6% |
|
Average |
88,444 |
456 |
84.6% |
19.8% |
5.4% |
0.1% |
5.5% |
Source: Cytonn Research
The following are the key highlights during Q2’2020 (See the Q1’2020 highlights):
- Ever Forgarden Company Limited, a local developer, announced plans to develop 900 apartments hosted within four 15-storey blocks along Kindaruma Road in Kilimani, Nairobi. For more, see Cytonn Weekly #26/2020,
- Unity Homes, a local residential developer, rolled out its first batch of low-cost residential housing apartments in Tatu City, comprising of 48 two-bedroom apartments each with a plinth area of 58 SQM and selling at Kshs 4.25mn, which translates to Kshs 73,310 per SQM. For more, see Cytonn Weekly #25/2020,
- Six lending institutions, namely, Equity Bank, Kenya Commercial Bank (KCB), NCBA, Stanbic Bank, Absa, and, Housing Finance, committed Kshs 335 bn in mortgages to fund the Affordable Housing Programme. According to the Ministry of Housing Principal Secretary, Charles Hinga, the banks will finance potential homeowners to purchase both government-built houses and units delivered by private developers registered on the Boma Yangu portal. For more, see Cytonn Weekly #24/2020,
- In the FY’2020/21 Budget, the affordable housing sector was allocated Kshs 6.9 bn, a 34.3% reduction from the Kshs 10.5 bn allocated in 2019/2020. For more, see Cytonn Weekly #24/2020, and
- The Kitui County Government rolled out an affordable housing program aimed at developing approximately 1,980 modern houses for its residents. For more, seeCytonn Weekly #20/2020.
A more cautious lending environment, record unemployment rates, and financial market volatility are likely to lead to a continued decline in sales activity and the sector’s overall performance in the near term. However, the growing demand for affordable housing and rapid population growth are expected to continue sustaining the sector in the long-run.
II.Commercial Office Sector
The commercial office sector recorded a 0.2% and 0.3% points decline in average rental yields and occupancy rates, to 7.3% and 80.0% in H1’2020, from 7.5% and 80.3%, respectively in FY’2019, attributable to the ongoing COVID-19 pandemic which has led to reduced demand for office spaces as firms have put on hold expansion plans as they adopt a wait and see approach while others opt to scale down operations amidst declining revenues. Asking rents decreased by 0.8% to an average of Kshs 95.3 per SQFT in H1’2020, from Kshs 96.0 per SQFT in FY’2019, while asking prices also decreased by 1.0% to Kshs 12,516 in H1’2020 from Kshs 12,638 in FY’2019, due to a surplus of office space that stood at 5.6 mn SQFT as at 2019, which has created a bargaining chip for tenants forcing developers to reduce or maintain prices and rents in order to remain competitive and attract occupants to their office spaces.
The table below highlights the performance of the Nairobi Metropolitan Area (NMA) Commercial Office sector over time:
(All values in Kshs unless stated otherwise)
|
Nairobi Metropolitan Area (NMA) Commercial Office Returns Over Time |
||||||
|
Year |
Q1' 2019 |
H1' 2019 |
Q3' 2019 |
FY' 2019 |
H1' 2020 |
∆ |
|
Occupancy % |
82.4% |
81.0% |
80.5% |
80.3% |
80.0% |
(0.3%) |
|
Asking Rents |
100.3 |
96.6 |
96.0 |
96.0 |
95.1 |
(0.9%) |
|
Average Prices |
12,574 |
12,637 |
12,638 |
12,638 |
12,516 |
(1.0%) |
|
Average |
8.0% |
7.8% |
7.7% |
7.5% |
7.3% |
(0.2% points) |
|
• All metrics recorded declines mainly attributed to reduced demand, as most firms grapple with reduced revenues due to the economic downturn caused by the ongoing COVID-19 pandemic, this has also been compounded by the current glut in office supply that stood at 5.6 mn SQFT as at 2019 |
||||||
Source: Cytonn Research 2020
Gigiri, Karen and Westlands were the best performing submarkets in Q1’2020 recording rental yields of 8.9%, 8.3%, and, 8.2%, respectively due to their superior locations and availability of top-quality offices, enabling them to charge a premium on rentals.
Whereas most nodes recorded declines in occupancy rates, Gigiri recorded a 4.5% increase of the same, buoyed by the current undersupply of office space in the area which ensured sustained uptake of office space even as the market faces reduced demand.
Mombasa Road recorded a 1.4% increase in asking rents to Kshs 74.0 from Kshs 73.0 in FY’2019, an indication of the previous bottoming out of rental prices in the area which had seen the average rent in the area fall 24.0% below the market average, recording Kshs 73 against a market average of Kshs 96 in FY’2019.
Areas affected by traffic snarl-ups, low-quality office space and are not necessarily primary business nodes such as Mombasa Rd, Thika Rd and Nairobi CBD had the lowest returns with average rental yields of 4.7%, 6.2%, and, 6.8%, respectively. Nairobi CBD has the highest percentage of its offices being Grade B at 84.6% and no Grade A office space, while Mombasa Road has the highest percentage of its offices being Grade C at 50% according to our Nairobi Metropolitan Area Commercial Office Report 2019.
The table below shows the Nairobi Metropolitan Area (NMA) sub-market performance:
|
Nairobi Commercial Office Submarket Performance H1'2020 |
|||||||||||
|
Location |
Price Kshs/ SQFT H1'2020 |
Rent Kshs/SQFT H1'2020 |
Occupancy H1'2020(%) |
Rental Yield (%) H1'2020 |
Price Kshs/ SQFT FY 2019 |
Rent Kshs/SQFT FY 2019 |
Occupancy FY 2019(%) |
Rental Yield (%) FY 2019 |
∆ in Rent |
∆ in Occupancy (% points) |
∆ in Rental Yields (% points) |
|
Gigiri |
13,500 |
117.6 |
84.9% |
8.9% |
13,833 |
117.0 |
80.4% |
9.2% |
0.5% |
4.5% |
(0.3%) |
|
Karen |
13,688 |
111.0 |
85.9% |
8.3% |
13,665 |
111.0 |
85.3% |
8.3% |
0.0% |
0.6% |
0.0% |
|
Westlands |
12,328 |
105.4 |
79.7% |
8.2% |
12,370 |
104.0 |
80.3% |
8.3% |
1.3% |
(0.6%) |
(0.1%) |
|
Parklands |
11,808 |
94.4 |
82.7% |
7.9% |
12,369 |
97.0 |
83.1% |
8.2% |
(2.8%) |
(0.4%) |
(0.3%) |
|
UpperHill |
12,625 |
97.4 |
78.8% |
7.4% |
12,397 |
98.0 |
80.0% |
7.5% |
(0.6%) |
(1.2%) |
(0.1%) |
|
Kilimani |
12,521 |
91.0 |
79.6% |
7.0% |
12,680 |
91.0 |
80.9% |
7.1% |
0.0% |
(1.3%) |
(0.1%) |
|
Nairobi CBD |
12,273 |
83.1 |
84.2% |
6.8% |
12,425 |
89.0 |
85.6% |
7.1% |
(7.1%) |
(1.4%) |
(0.3%) |
|
Thika Road |
12,529 |
82.1 |
77.9% |
6.2% |
12,600 |
84.0 |
80.4% |
6.3% |
(2.3%) |
(2.5%) |
(0.1%) |
|
Msa Road |
11,375 |
74.0 |
65.9% |
4.7% |
11,400 |
73.0 |
66.5% |
5.5% |
1.4% |
(0.6%) |
(0.8%) |
|
Average |
12,516 |
95.1 |
80.0% |
7.3% |
12,638 |
96.0 |
80.3% |
7.5% |
(0.9%) |
(0.3%) |
(0.2%) |
Source: Cytonn Research 2020
Notable highlights during half 1 include;
- Fusion Capital, a local real estate developer, announced that it would offer a 3-month 30.0% rent relief to tenants in its Flamingo Towers development in Upper-Hill in the wake of the Coronavirus pandemic.
We retain a negative outlook for the commercial office sector with rental prices expected to decline over the short term. Landlords will continue to adopt various strategies to attract and retain tenants such as the downwards revision of rents. In the long term, we expect to see a slight reduction in demand with some firms having downsized due to financial constraints resulting from the current pandemic as several others experience working from home and may make it a permanent measure. However, we expect the sector’s performance to gradually recover once the economy picks up.
III.Retail Sector
The retail sector performance softened recording a 0.4% points decline in rental yield to 7.4% in H1’ 2020 from 7.8% in FY’ 2019. Average occupancies dropped by 1.8% points from 75.9% in FY’ 2019 to 74.0% in H1’ 2020 and average monthly rents declined by 3.4% to Kshs 170.3 per SQFT from Kshs 175.6 per SQFT in FY’2019. The decline in the overall performance of the sector is mainly attributable to;
- Declining occupancy rates in major retail centres as most retailers are shutting down their operations to cushion themselves against the impact of the Coronavirus pandemic,
- Constrained spending power among consumers resulting from a tough financial environment, and,
- An oversupply of retail space in certain locations which has resulted in pressure on landlords to provide concessions and other incentives to attract new clientele or retain existing tenants.
The performance of the retail sector in Nairobi over time is as shown below:
(All values in Kshs unless stated otherwise)
|
Summary of Retail Sector Performance Over Time |
|||||||
|
Item |
Q1' 2019 |
H1' 2019 |
Q3' 2019 |
FY' 2019 |
H1' 2020 |
∆ Y/Y |
∆ H1’2020 |
|
Average Asking Rents (Kshs/SQFT) |
174.3 |
170.0 |
167.0 |
175.6 |
170.3 |
(0.2%) |
(3.1%) |
|
Average Occupancy (%) |
76.8% |
75.6% |
74.5% |
75.9% |
74.0% |
(1.6%) points |
(1.8%) points |
|
Average Rental Yields |
8.5% |
8.2% |
8.0% |
7.8% |
7.4% |
(0.8%) points |
(0.4%) points |
|
· The retail sector performance softened recording a decline in average rents of 3.1% to Kshs 170.3 per SQFT in H1'2020 from Kshs 175.6 per SQFT in FY’2019 · Average occupancy rates decreased by 1.8% points to 74.0% from 75.9% recorded in FY’2019 |
|||||||
Source: Cytonn Research 2020
Westlands and Karen were the best performing retail nodes with average rental yields of 9.8% and 9.2%. This is attributed to the premiums charged on rents in these nodes, as they are affluent neighbourhoods hosting middle to high-end income earners with high consumer purchasing power.
Satellite towns recorded the lowest rental yields at 5.4%. The poor performance is attributable to low rental charges of Kshs 127.5 per SQFT as a result of competition from informal retail space in Satellite towns.
The table below shows the submarket performance in the Nairobi Metropolitan Area (NMA):
(All values in Kshs unless stated otherwise)
|
Nairobi Retail Submarket Performance H1'2020 |
|||||||||
|
Location |
Rent Kshs/SQFT H1’ 2020 |
Occupancy H1’ 2020 |
Rental Yield H1' 2020 |
Rent Kshs/SQFT FY’ 2019 |
Occupancy FY’ 2019 |
Rental Yield FY’ 2019 |
H1’ 2020 ∆ in Rental Rates |
H1’ 2020 ∆ in Occupancy (% points) |
H1’ 2020 ∆ in Rental Yield (% points) |
|
Westlands |
206.7 |
81.2% |
9.8% |
215.0 |
82.8% |
10.3% |
(4.0%) |
(1.7%) |
(0.5%) |
|
Karen |
218.5 |
75.0% |
9.2% |
222.0 |
80.0% |
9.5% |
(1.6%) |
(5.0%) |
(0.3%) |
|
Kilimani |
172.5 |
83.1% |
8.7% |
167.0 |
87.4% |
8.8% |
3.2% |
(4.3%) |
(0.1%) |
|
Ngong Road |
182.5 |
80.1% |
8.3% |
181.0 |
80.5% |
8.3% |
0.8% |
(0.4%) |
0.0% |
|
Kiambu Road |
174.6 |
67.1% |
6.9% |
180.0 |
67.6% |
7.2% |
(3.1%) |
(0.5%) |
(0.3%) |
|
Thika road |
163.8 |
69.3% |
6.5% |
173.0 |
72.8% |
7.1% |
(5.6%) |
(3.5%) |
(0.6%) |
|
Mombasa Road |
143.7 |
69.6% |
6.0% |
156.0 |
66.8% |
6.3% |
(8.6%) |
2.8% |
(0.3%) |
|
Eastlands |
142.8 |
69.6% |
5.9% |
150.0 |
71.7% |
6.8% |
(5.1%) |
(2.1%) |
(0.9%) |
|
Satellite Towns |
127.5 |
71.4% |
5.4% |
136.0 |
73.3% |
5.9% |
(6.7%) |
(1.9%) |
(0.5%) |
|
Average |
170.3 |
74.0% |
7.4% |
175.6 |
75.9% |
7.8% |
(3.4%) |
(1.8%) |
(0.4%) |
Source: Cytonn Research 2020
Notable highlights during H1’2020 included:
- Crossroads Limited and Karen Waterfront Phase Two Limited, owners of The Waterfront Mall in Karen, went to court to demand the payment of Kshs 520 mn in anticipated lost rent from the South African-based Shoprite Holdings, after the retailer terminated its 10-year lease contract at the Waterfront Mall in April 2020, barely six months after having started operations in September 2019. The retailer cited strained revenues due to reduced footfall as people follow the government’s stay at home directive coupled with constrained spending power among consumers as well as competition from Game Supermarket, another continental retailer located in the same mall. The move leaves the retailer, whose strategy was to open seven stores locally, with three branches, two in Nairobi and one in Mombasa. The premature termination of the lease by Shoprite Holdings allegedly makes the obligations under the lease agreement immediately due and owing, thereby exposing them to accelerated payments, and a legal suit by the landlord seeking to recover damages for breach of the agreement. However, the retailer has been reviewing its business operations in the East African market, having exited Tanzania in 2014. The move follows the recent exit by Botswana-based Choppies, Tuskys closure of three of its branches and the closure of Nakumatt’s remaining branch in Highridge, an indicator of the struggles facing the Kenyan retail sector, which are largely due to (i) fierce competition among retailers trying to gain market share, (ii) increased mall oversupply especially in Nairobi, and (iii) competition from the dominant informal retail sector. The challenges have also been aggravated by the ongoing COVID-19 pandemic which has seen footfall and revenues fall drastically across retail developments,
- Tuskys announced the temporary closure of three of its branches in Nairobi, Kitale, and Mombasa. The affected branches include Tuskys Tom Mboya branch, Tuskys Kitale Mega Branch, and Tuskys Digo Branch. For more information, see Cytonn Weekly #17/2020,
- Quickmart Supermarket, a local retailer, opened its first store in Nairobi’s Central Business District (CBD), along Tom Mboya Street, taking up space previously occupied by Botswana-based Choppies. The retailer also opened an outlet in Kilimani, along Kilimani Road, For more information, see Cytonn Weekly #20/2020 and Cytonn Weekly #26/2020, and,
- Carrefour Supermarket, an international retailer, opened a new store along Uhuru Highway in Nairobi, taking up 40,000 SQFT of space previously occupied by Nakumatt Mega. For more, see Cytonn Weekly #24/2020.
We expect occupancy rates of major retail centres to drop during this period as most retailers are shutting down their operations to cushion themselves against the impact of the Coronavirus pandemic. However, we expect the sector to be cushioned by the continued expansion of local and international retailers such as Carrefour and Quickmart.
IV. Hospitality Sector
In H1’ 2020, 2 industry reports related to the hospitality sector were released. The take-outs were as stated below:
|
Report |
Key Take-outs |
|
· International visitor arrivals increased slightly by 0.4 per cent from 2.03 mn in 2018 to 2.04 mn in 2019 supported by; heightened security, recognition of Kenya as a regional hub, relaxation of travel advisories by governments of key tourism markets and political stability that prevailed in the country · For 2020, we note that the number of tourist arrivals during the first half of the year has been significantly affected by the current COVID-19 pandemic which has led to the cancelling of meetings, conferences and events, the banning of all international flights and reduced local direct flights. For more information, see Cytonn Monthly April 2020 |
|
|
· W Hospitality Group, an African tourism investment advisor, ranked Kenya 7th in Africa with 3,588 rooms in the pipeline, within 23 hotels under brands such as; Radisson Hotel Group, Accor Hotels, Swiss International, and, Marriott International · The report affirms the attractiveness of Kenya’s hospitality sector to investors and this we attribute to; (i) Nairobi’s recognition as East and Central Africa’s leading business and investment hub leading to an increase in conference tourism, and, (ii) increased foreign investor confidence in the Kenyan hospitality industry supported by an existing demand for hospitality facilities and services. For more information, see Cytonn Weekly#26/2020.
|
In terms of key development activities during the period under review, see the Q1’2020 highlights, and;
i. Chaudhary Group, a Nepalese multinational conglomerate acquired majority ownership of The Fairmont the Norfolk and Fairmont Mara Safari Club from Kingdom Hotel Investment, an international hotel and resort real estate investment company that is focused on emerging markets. Despite the negative effects of Coronavirus on the hospitality sector, this affirms Kenya’s attractiveness particularly to high-net-worth global investors keen on tapping into the vibrant sector of top-notch hospitality facilities. For more information, see Cytonn Weekly #23/2020.
In addition to the above developments, during the first half of the year, the hospitality sector recorded a slowdown in operations following the COVID-19 pandemic, with several adjustments being made by the government and key players in the sector to contain the spread of the virus. These include;
- The government implemented a ban on all international flights effective Wednesday 25thMarch 2020, except for cargo flights,
- Temporary closure of some major hotels in Kenya, such as Tribe Hotel and Ole Sereni in Nairobi County; Grand Royal Swiss and Sovereign Hotel in Kisumu County; the Maasai Mara Game Reserve in Narok County; Sarova Hotels’ four local hotels and lodges, and Villa Rosa Kempinski Hotel limited its business to room service only in March; and Fairmont Hotels and Resorts announced the closure of its local hotels in May. For more analysis, see our Cytonn Monthly May 2020, and
- The Kenyan Government implemented a ban on movement in and out of the Nairobi Metropolitan Area effective Monday 6thApril 2020, with an exception of cargo and in line with this, local airline carriers, Jambojet and Safarilink announced a temporary suspension of their local flight. For more analysis, see Cytonn Weekly #15/2020.
Despite the adverse effects of the pandemic on the sector, several strategies have since been adopted to aid its gradual recovery;
- In April, the Ministry of Health Cabinet Secretary, Mutahi Kagwe, announced that hotels and restaurants in major towns would be allowed to resume operations albeit under strict terms. For more information, see Cytonn Monthly April 2020,
- In June, top tier hotels such as Villa Rosa Kempinski, Sarova Stanley, Ole Sereni, Hemingways Watamu, Radisson Blu Arboretum and Trademark Hotel, resumed their restaurant activities including dine-in and deliveries. For more information, see Cytonn Weekly #23/2020,
- In June, through the 2020/2021 budget statement, funds were allocated to the tourism sector under the 8-point stimulus programme. The funds amounting to Kshs 8.3 bn will be used to support the post-COVID-19 tourism marketing and providing support for hotel refurbishment through soft loans. For more information, see Cytonn Weekly#24/2020,
- Tourism Finance Corporation(TFC), a financial institution with the mandate of facilitating and providing affordable development funding and advisory services to the Kenyan tourism industry, restructured Kshs 634 mn loans to hospitality facilities affected by the Covid-19 pandemic. For more information, see Cytonn Weekly #24/2020,
- In June, Swiss-owned Plan Hotel Hospitality Group announced that it was offering holiday bonds, where prospective guests would be required to pay half the cost to reserve a room, for two years for its three properties in Malindi. For more, see Cytonn Weekly #26/2020, and The hospitality sector has been the hardest hit by the COVID-19 pandemic due to its reliance on tourism, and this is evidenced by the cessation of operations by key hospitality facilities due to reduced demand for the same. Nevertheless, the sector has in the short term witnessed the reopening of some the facilities, and we, therefore, expect the sector’s recovery to commence in the near term on the back of government policies aimed at cushioning the sector such as the government’s directive to re-open hotels and restaurants in major towns, the Ministry of Tourism’s post-corona recovery strategy funds, the government’s stimulus package which, among others, seeks to offer soft loans to hotels and related establishments through the TFC thus stimulating the hospitality sector, and, the tourism sector’s plan to repackage their products to appeal to a wider scope of domestic tourists.
V. Land Sector
During H1’2020, the land sector recorded an overall annualized capital appreciation of 1.4%, with asking land prices in low rise residential areas recording a 3.8% annualized capital appreciation, attributed to people’s preference of living in these areas, as land is relatively affordable at Kshs 84.2 mn per acre as compared to the high-rise areas, selling at Kshs 115.6 mn per acre on average. Additionally, people are attracted to these areas as they are sparsely populated, thus offering exclusivity and privacy. Un-serviced land in satellite towns such as Ruaka and Ngong recording an annualized capital appreciation at 3.4%, attributable to the growing demand for land in these areas fueled by the affordability with an asking price of approximately Kshs 25.1 mn per acre compared to suburbs with relatively high asking prices of up to Kshs 419.2 mn per acre.
The table below shows the performance of the sector during the quarter:
(All values in Kshs unless stated otherwise)
|
Nairobi Metropolitan Area(NMA) Land Performance H1'2020 |
||||
|
Node |
Price per Acre H1'2019 |
Price per Acre H1'2020 |
Annualized Capital Appreciation H1'2020 |
|
|
Low Rise Residential Areas |
80.9m |
84.2m |
3.8% |
|
|
Satellite Towns- Un-serviced Land |
24.1m |
25.1m |
3.4% |
|
|
Satellite Towns- Site and service schemes |
15.0m |
15.2m |
0.4% |
|
|
High Rise Residential Areas |
116.7m |
115.6m |
0.0% |
|
|
Commercial Zones |
463.3m |
419.2m |
(0.7%) |
|
|
Average |
1.4% |
|||
|
· The land sector recorded an overall annualized capital appreciation of 1.4%, with land in low rise residential areas recording a 3.8% annualized capital appreciation, attributed to people’s preference of living in these areas, as land is relatively affordable at Kshs 84.2 mn per acre as compared to the high-rise node, selling at Kshs 115.6 mn per acre on average, in addition to offering privacy for family units. |
||||
Source: Cytonn Research
The performance per node:
a. Low Rise Residential Areas
(All values in Kshs unless stated otherwise)
|
Low Rise Residential Areas |
|||
|
Location |
Price per Acre H1'2019 |
Price per Acre H1'2020 |
Annualized Capital Appreciation H1'2020 |
|
Karen |
53.4m |
56.4m |
5.6% |
|
Spring Valley |
148.1m |
156.1m |
5.4% |
|
Runda |
67.9m |
70.2m |
3.3% |
|
Kitisuru |
70.5m |
72.7m |
3.0% |
|
Ridgeways |
64.7m |
65.9m |
1.8% |
|
Average |
80.9m |
84.2m |
3.8% |
|
· Low-rise residential areas such as Karen and Runda recorded an average annualized capital appreciation of 3.8%. This is attributed to people’s preference of living in these areas, as land is relatively affordable at approximately Kshs 84.2mn per acre as compared to the high-rise node, selling at Kshs 115.6 mn per acre on average. Additionally, people are attracted to these areas as they are sparsely populated, thus offering exclusivity and privacy · Karen was the best performing sub-market with a capital appreciation of 5.6%, due to the relatively low asking land prices at Kshs 56.4 mn as compared to the market average of 84.2 mn per acre, while in Ridgeways, asking land prices recorded a marginal appreciation of 1.8%, attributed to a slowdown in demand given the ongoing densification of sections of the submarket with relaxed of zoning regulations |
|||
Source: Cytonn Research
b. Satellite Towns: Un-serviced Land
(All values in Kshs unless stated otherwise)
|
Satellite Towns |
|||
|
Location |
Price per Acre H1'2019 |
Price per Acre H1'2020 |
Annualized Capital Appreciation H1'2020 |
|
Ruaka |
80.3m |
84.4m |
5.2% |
|
Utawala |
11.6m |
12.0m |
4.1% |
|
Juja |
9.7m |
10.0m |
3.4% |
|
Athi River |
4.2m |
4.3m |
3.4% |
|
Limuru |
20.4m |
21.0m |
2.9% |
|
Ongata Rongai |
18.3m |
18.6m |
1.6% |
|
Average |
24.1m |
25.1m |
3.4% |
|
· Asking land prices of un-serviced land in satellite towns such as Limuru and Utawala, recorded an annualized capital appreciation of 3.4%, supported by the high demand for development land fuelled by; i) affordability in comparison to Nairobi’s suburbs, and ii) improving infrastructure such as sewerage systems and roads in areas such as Ruaka · Ruaka area recorded the highest annualized capital appreciation at 5.2%, attributed to the growing demand for land within the area as it acts as a key dormitory for Nairobi’s working population, supported by proximity to amenities and improving infrastructure i.e. the incoming Western By-Pass which on completion will link Ruaka to the Nairobi-Nakuru Highway at Gitaru · Land asking prices in Ongata Rongai recorded the lowest appreciation at 1.6%, attributed to the reduced demand as developers focus shift to towns such as Ruaka and Utawala which are undergoing increased real estate and infrastructural development |
|||
Source: Cytonn Research
c. Satellite Towns- Site and Service Schemes
(All values in Kshs unless stated otherwise)
|
Satellite Towns-Site and Service Schemes |
|||
|
Location |
Price per Acre H1'2019 |
Price per Acre H1'2020 |
Annualized Capital Appreciation H1'2020 |
|
Ruiru |
22.7m |
24.0m |
5.8% |
|
Athi River |
12.0m |
12.4m |
3.5% |
|
Ruai |
13.8m |
14.0m |
1.0% |
|
Thika |
10.1m |
10.1m |
(0.3%) |
|
Ongata Rongai |
19.2m |
18.4m |
(3.8%) |
|
Syokimau-Mlolongo |
12.5m |
12.0m |
(3.8%) |
|
Average |
15.0m |
15.2m |
0.4% |
|
· Site and service schemes recorded a 0.4% annualized capital appreciation, 1.0% points lower than the market average of 1.4%, and 3.0% points lower than un-serviced land in the same location. This capital appreciation is attributed to increased demand due to the relatively affordable land at approximately Kshs 15.2 mn asking land price per acre and provision of infrastructure by the developers. Compared to un-serviced land, the asking price of serviced land recorded a slower appreciation due to decreased demand as buyers are not willing to pay a premium for the services provided, thus opt for un-serviced land · Ruiru recorded the highest appreciation rate at 5.8% attributable to the increased demand for land in the area from developers looking to cater for the mid-income and student population housing as a result of the push for individuals to move to satellite towns where housing is relatively affordable, in addition to the mushrooming tertiary institutions · Ongata Rongai and Syokimau recorded a 3.8% price correction each attributable to decreased demand as investors focus on areas witnessing more real estate activities |
|||
Source: Cytonn Research
d. Nairobi Suburbs- High Rise Residential Areas
(All values in Kshs unless stated otherwise)
|
Nairobi Suburbs-High Rise Residential Areas |
|||
|
Location |
Price per Acre H1'2019 |
Price per Acre H1'2020 |
Annualized Capital Appreciation H1'2020 |
|
Kasarani |
61.4m |
64.8m |
5.7% |
|
Dagoretti |
100.3m |
102.8m |
2.5% |
|
Githurai |
45.1m |
44.4m |
(1.4%) |
|
Kileleshwa |
311.1m |
303.1m |
(2.6%) |
|
Embakasi |
65.7m |
62.8m |
(4.4%) |
|
Average |
116.7m |
115.6m |
0.0% |
|
· Asking land prices in high-rise residential areas stagnated, attributed to reduced demand for development land given the reduced development activities given the relatively high land prices averaging at approximately Kshs 115.6 mn per acre, compared to low rise areas and satellite towns average of Kshs 84.2 mn and Kshs 25.1 mn, respectively, in the wake of an economic slowdown in addition to the existing oversupply of residential units in the high-end market segment · Nevertheless, Kasarani recorded an annualized capital appreciation at 5.7%, attributed to increased demand for land fuelled by affordability with the asking land prices averaging at Kshs 64.8 mn compared to the node’s average of Kshs 115.6 mn, in addition to developers looking to cater for the expanding middle-income population. Embakasi recorded a correction of 4.4%, attributable to reduced demand for land given the high densification of the area making it unattractive to investors |
|||
Source: Cytonn Research
e. Nairobi Suburbs- Commercial Zones
(All values in Kshs unless stated otherwise)
|
Nairobi Suburbs- Commercial Zones |
|||
|
Location |
Price per Acre H1'2019 |
Price per Acre H1'2020 |
Annualized Capital Appreciation H1'2020 |
|
Upper Hill |
487.8m |
506.1m |
3.8% |
|
Kilimani |
403.3m |
398.5m |
(1.2%) |
|
Westlands |
429.6m |
421.3m |
(1.9%) |
|
Riverside |
363.0m |
350.9m |
(3.3%) |
|
Average |
420.9m |
419.2m |
(0.7%) |
|
· Commercial zones recorded a 0.7% correction in asking land prices. We attribute this to the decreased demand for development land in the sub-markets given the relatively high asking land prices of Kshs 419.2 mn per acre on average thus developers are not able to achieve favourable returns from the investments, in addition to the existing oversupply of commercial office and retail spaces which stand at 5.2 mn SQFT and 2.8 mn SQFT, respectively, as at 2019 · Despite the overall correction in asking land prices, Upperhill recorded a 3.8% annualized capital appreciation with an average asking land price of Kshs 506.1 mn per acre, attributed the continued demand for land in the area by developers looking to venture into differentiated concepts such as serviced apartments and offices, which thrive in the area given that it hosts expatriates, coupled by the ease of accessibility in and out of the area · Riverside recorded a price correction of 3.3% attributed to reduced demand for development land due to the reduced development activities on the commercial space front |
|||
Source: Cytonn Research
The investment opportunity in the land sector lies in sub-markets such as Karen, Spring Valley and Kasarani which recorded relatively high annualized capital appreciation of 5.6%, 5.4% and 5.7%, respectively, and satellite towns such as Ruaka for un-serviced land, and Ruiru for site and service schemes which were the best performing sub-markets with average annualized capital appreciation of 5.2%, and 5.8%, respectively.
Despite the current slowdown in real estate development activities due to the COVID-19 pandemic, we expect the performance of the land sector to be cushioned by; (i) the growing demand for development land especially in the satellite towns as developers strive to drive the government’s Big Four government agenda on the provision of affordable housing, (ii) improving infrastructure, and (iii) increased demand for development land by the growing middle-income population.
VI. Infrastructure
During the period,
- Transport Secretary, James Macharia, announced that Kenya was set to open its first annuity road this year under the Annuity programme where contractors design, finance, construct and maintain roads based on agreed periodical payments by the government. The 91km road project in Kajiado County comprises of a 48km section through Ngong, Kiserian and Isinya townships, and will join the 43km Kajiado-Imaroro road. For more, see Cytonn Weekly #25/2020,
- The FY’2020/21 Budget was read by CS National Treasury, Ukur Yatani, where infrastructure sector was allocated Kshs 172.4 bn, 60.4% lower than the 435.1 bn allocated in the 2019/2020 budget, the lowest allocation in the last 10 financial years. The reduced allocation towards infrastructure is attributed to the constrained budgetary room that the government finds itself in as it grapples with economic effects of the COVID-19 pandemic. For more, see Cytonn Weekly #24/2020,
- State Department of Infrastructure revealed plans to put up a 0.6km bridge at the Likoni Channel in Mombasa, For more see, Cytonn Weekly #23/2020.
- Water and sanitation Cabinet Secretary, Sicily Kariuki unveiled a Kshs 1.3 bn Kiambu-Ruaka water supply and sewerage project. The project will be implemented by the Athi Water Works Development Agency through funding by the African Development Bank (AfDB). We expect this to enhance the appeal of areas such as Ruaka and Kiambu, subsequently supporting the areas’ continued real estate growth and performance. For more, see Cytonn Weekly #21/2020.
Despite the slowdown in infrastructure expenditure, infrastructural development remains a top priority and we expect the Kenyan government to remain committed in infrastructure improvements and completing ongoing projects.
VII. Statutory Review
The first half of the year saw a significant amount of policy reforms, key among them being:
- The president assented the Finance Bill 2020 into law on June 30th. Notably, the Act repealed section 22C of the Income Tax Act which was provision for Registered Home Ownership Savings Plans in Kenya, a scheme introduced in 1996 to encourage savings towards homeownership by offering tax rebates of up to Kshs 8,000 per month to contributors and tax relief on interest earned up to Kshs 3.0 mn. In abolishing the scheme, the committee cited low uptake of HOSP, which in our view is due to lack of public knowledge. However, while the repeal contradicts the government’s goal of improving the housing finance system, we expect that it will encourage potential homebuyers to subscribe to the government’s National Housing Development Fund (NHDF) and other available home financing solutions such as mortgages especially now that the Kenya Mortgage Refinancing Company, whose main objective is to enhance mortgage affordability, is ready to commence operations,
- The Ministry of Transport, Infrastructure, Housing, and Urban Development published the National Housing Development Fund Regulations 2020. The regulations are aimed at guiding the operationalization of the National Housing Development Fund (NHDF), which was established in 2018 in line with the government’s affordable housing initiative and under the mandate of the National Housing Corporation (NHC), to help bridge the affordable housing gap in Kenya. For more information, see Cytonn Weekly #21/2020,
- The National Treasury Cabinet Secretary, Ukur Yatani published regulations aimed at guiding the new amendment to Section 38 of the Retirement Benefits Act which was amended through the Tax Act 2020, allowing pensioners to use a portion of their pension savings to purchase a residential home. As per the regulations, pensioners will be allowed to use the lower of 40.0% of their pension savings or a maximum of Kshs 7.0 mn towards purchasing a home, in addition to the using 60.0% of their accumulated pension savings as mortgage collateral. For more information, see Cytonn Weekly #19/2020,
- The Ministry Of Lands and Physical Planning invited the public for participation in the regulatory impact statement for the proposed Land Transactions (Electronic) Regulations 2020. The proposed regulations seek to affect the development and implementation of a National Land Information System and the maintenance of a land register, to enable Kenyans to access land-related information electronically through the use of online portals and carry out all registry transactions under the Act through the electronic registry system. For more information, see Cytonn Weekly #20/2020.
- The Ministry of Transport, Infrastructure, Housing, Urban Development, and Public Works gazetted the National Construction Authority (Defects Liability) Regulations 2020, which introduced various changes to the defects liability period with regards to commercial buildings. Amongst the changes introduced, was a latent defects liability period for commercial buildings which shall be a minimum period of six years from completion of the regular defects liability period (which will now be referred to as the patent defects liability period). For more information, see Cytonn Weekly #21/2020.
VIII. Listed Real Estate
During H1’2020, the I-REIT continued to perform poorly trading at Kshs 8.0 on average, 61.4% lower than its initial price of Kshs 20.75 as at November 2015. The former translates to a dividend yield of 9.4%, compared to the commercial real estate market average of 7.4% (retail -7.4% and commercial office - 7.3%) in H1’2020. During the period, the I-REIT recorded its lowest trading price of Kshs 5.5 attributable to the market uncertainties brought about by the ongoing pandemic. The instrument’s price per share reduced by 38.5% YTD closing at Kshs 5.9 per share from Kshs 9.6 at the beginning of the year, as shown below:
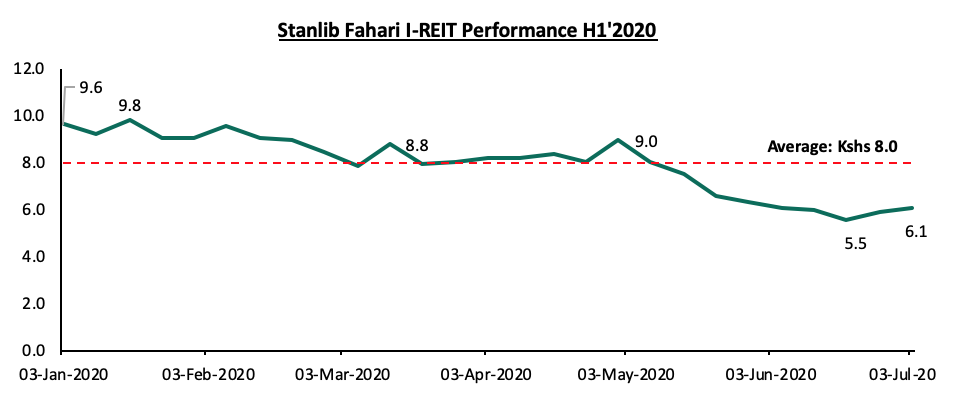
Other notable activities on the listed real estate in H1’2020 include:
- Acorn Holdings Limited, a local property developer, announced that it was structuring a Development Real Estate Investment Trust (D-REIT), to facilitate the sale of its stake in branded hostels Qwetu and Qejani’s development pipeline to institutional investors and high net-worth individuals. For more information see Cytonn weekly #10/2020,
- In April, Stanlib Kenya Limited released the Fahari I-REIT- Audited Results FY’2019, according to which, the earning per unit recorded a 9.4% decline to 0.97 from 1.07, attributed to a 9.0% decline in net profits, to Kshs 175.2 mn from Kshs 193.5 mn mainly due to the reduction in fair value gain on revaluation of investment property compared to prior year on the back of a sluggish real estate sector with continued downward pressure on rental income especially in the retail sector. Please see the Fahari I-REIT FY’2019 Earnings Note for the analysis,
- In May, Fund manager, ICEA Lion Asset Management (ILAM) announced that it had completed a transaction with Stanlib Kenya Limited (SKL) that will see it acquire the latter’s role of managing property fund Stanlib Fahari I-REIT, from South Africa based Liberty Holdings Ltd. ILAM will now acquire all rights, obligations, and benefits of SKL in connection with SKL’s role as promoter and REIT manager. For more information, see Cytonn Weekly #21/2020, and
- In June, the Cabinet Secretary for the National Treasury and Planning, Ukur Yatani, drafted rules under the Income Tax (Real Estate Investment Trusts) Rules, 2020 that will require Real Estate Investment Trusts (REITs) to apply for tax exemptions from Kenya Revenue Authority (KRA) during registration. The proposed rules seek to assure investors of the tax exemptions and seal any possible loopholes in tax collection. For more information, please see Cytonn Weekly #24/2020.
Our outlook for listed real estate is negative, attributed to continued lack of investor interest for the instruments and the continued subdued performance of the real estate sector as it continues to grapple with the effects of the COVID-19 pandemic. However, we expect continued engagement of investors, fund managers, developers and regulators to help unlock capital as investors take advantage of tax benefits.
Real Estate Performance Summary and Outlook
Below is a summary of the sectorial performance in H1’2020 and investment opportunities:
|
Theme |
Thematic Performance and Outlook H1’2020 |
Outlook |
|
Residential |
The detached units’ market recorded an average annual price appreciation of 0.3% compared to the apartment market’s (0.2%) attributable to less supply of standalone units coupled by growing demand from homebuyers. |
Neutral |
|
We expect uptake to remain suppressed in 2020 as cash flows for investors and homebuyers come under pressure in light of the ongoing pandemic. As such, the opportunity is in low-cost housing in Satellite Towns such as Thindigua and Ruaka which continue to exhibit high demand attributable to their proximity the key commercial nodes, and suburbs such as Westlands and South C for investors seeking attractive rental yields. |
||
|
Office |
The sector recorded a 0.2% and 0.3% points decline in average rental yields and occupancy rates, to 7.3% and 80.0% in H1’2020, from 7.5% and 80.3%, respectively in FY’2019, attributable to the ongoing COVID-19 pandemic which has led to reduced demand for office spaces as firms have put on hold expansion plans as they adopt a wait and see approach while others opt to scale down operations amidst declining revenues. |
Negative |
|
Our outlook for the commercial office sector is negative owing to the current market oversupply and the impact of COVID-19 on economic activities. We expect asking rental prices to continue dropping due to increased vacancy rates and downward pressure arising from the existing oversupply in the market. The investment opportunity is in differentiated concepts such as serviced offices that attract yields of up to 12.3%. |
||
|
Retail |
Performance softened recording a 0.4% points decline in rental yield to 7.4% in H1’ 2020 from 7.8% in FY’ 2019 owing to an increase in vacancy rates in malls and constrained purchasing power. |
Neutral |
|
The investment opportunity is in mixed-use concepts in areas such as Westlands and Karen, with attractive yields of 9.8% and 9.2%, respectively, as well as prime located retail developments which can attract footfall |
||
|
Hospitality |
The hospitality sector was significantly affected by the COVID- 19 pandemic which led to a slowdown of operations following the cancelling of meetings, conferences and events, the banning of all international flights and reduced local direct flights. However, we expect the sector’s recovery to commence in the near term on the back of government policies such as the budget allocation towards tourism marketing and support for hotel refurbishment through soft loans. |
Neutral |
|
The sector has pockets of value in the serviced apartments in areas such as Westlands & Parklands, and Kilimani markets with rental yields of above 10.8% and 9.5%, respectively |
||
|
Land |
The land sector recorded an overall annualized capital appreciation of 1.4%, with asking land prices in low rise residential areas recording the highest annualized capital appreciation at 3.8%. |
Positive |
|
The investment opportunity lies in sub-markets such as Karen, Spring Valley and Kasarani which recorded relatively high annualized capital appreciation of 5.6%, 5.4% and 5.7%, respectively, and satellite towns such as Ruaka for un-serviced land, and Ruiru for site and service schemes, with average annualized capital appreciation of 5.2%, and 5.8%, respectively. |
||
|
Listed Real Estate |
The I-REIT continued to perform poorly during the period with the price per share dropping to lows of Kshs 5.5, the lowest since the I-REIT’s inception in 2015. |
Negative |
|
We expect listed real estate to continue performing poorly attributed to continued lack of investor interest for the instruments and the continued subdued performance of the real estate sector as it continues to grapple with the effects of the COVID-19 pandemic. |
Of the six sectors, our outlook is positive for one – land; neutral for three – residential, retail and hospitality; and negative for two – office and listed real estate. Thus, our outlook for the real estate sector remains neutral. Going forward, we expect the industrial sector, residential, land, and select office markets to continue holding up well in terms of performance, while retail and hospitality remain the most affected. We expect the real estate sector's performance to improve significantly towards the end of 2020 once economic activity regains momentum.
Disclaimer: The views expressed in this publication are those of the writers where particulars are not warranted. This publication is meant for general information only and is not a warranty, representation, advice, or solicitation of any nature. Readers are advised in all circumstances to seek the advice of a registered investment advisor.

- Talk to us
- Kenya
- P.O Box 20695 - 00200, Nairobi, Kenya
- Cell +254709101200
- Tel +254709101200
- WhatsApp +254741676635
- United States
- +254709101200
- DOWNLOAD OUR APP
-


- Kenya
- 8th Floor, Pinetree Plaza, Kaburu Drive, Ngong Road, Nairobi, Kenya
- USA
- Suite 1150, 1775 Eye Street NW, USA, Washington DC 20006, USA
- Investments
- High Yield
- Private Equity
- Real Estate
- Real Estate
- RiverRun Estates
- Cytonn Towers
- The Ridge
- Taraji Heights
- The Alma