Understanding Joint Venture Agreements (JVs) in Real Estate, & Cytonn Weekly #23.2025
By Cytonn Research, Jun 8, 2025
Executive Summary
Fixed Income
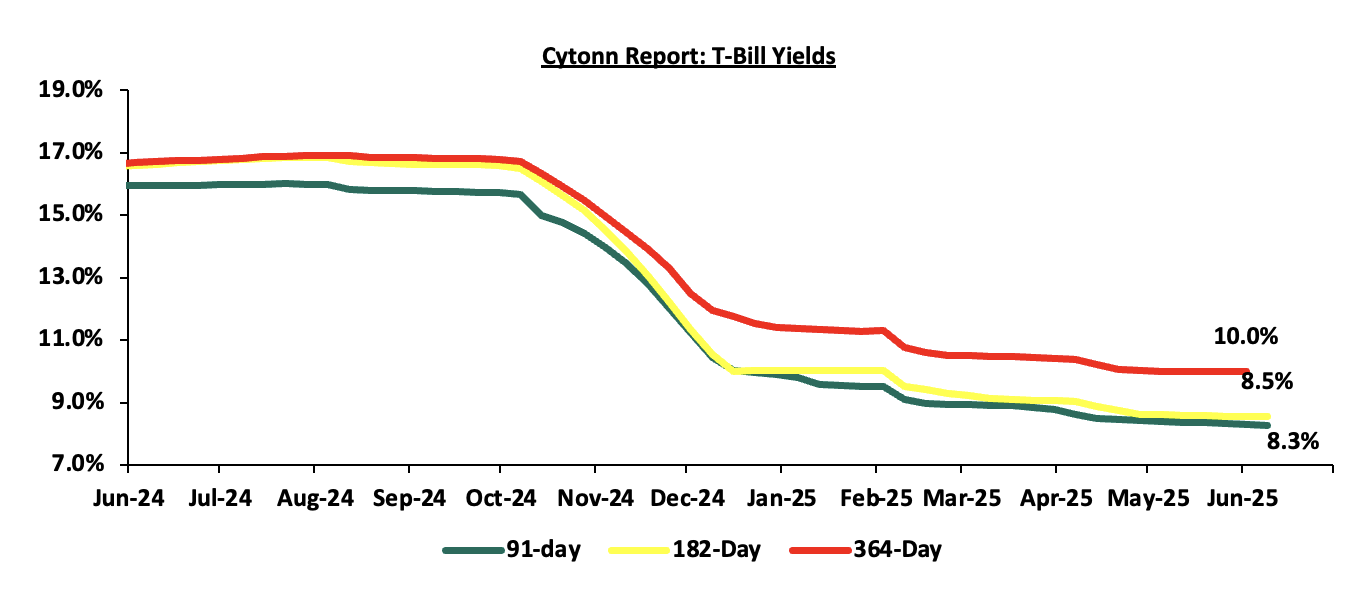
This week, T-bills were oversubscribed for the fifth consecutive week, with the overall subscription rate coming in at 255.9%, higher than the subscription rate of 229.6% recorded the previous week. Investors’ preference for the shorter 91-day paper persisted, with the paper receiving bids worth Kshs 7.9 bn against the offered Kshs 4.0 bn, translating to a subscription rate of 197.9%, significantly lower than the oversubscription rate of 480.0%, recorded the previous week. The subscription rates for the 182-day increased to 104.9% from the 97.7% recorded the previous week, while the 364-day papers increased to 430.0% from the 261.3% respectively recorded the previous week. The government accepted a total of Kshs 57.4 bn worth of bids out of Kshs 61.4 bn bids received, translating to an acceptance rate of 93.5%. The yields on the government papers were on a downward trajectory with the yields on the 182-day paper decreasing the most by 2.1 bps to 8.54% from the 8.56% recorded the previous week, while the yields on the 91-day and 364-day papers decreased by 1.1 bps and 0.2 bps to 8.28% and 10.00%, from the 8.29% and 10.00% recorded the previous week
During the week, Stanbic Bank released its monthly Purchasing Manager's Index (PMI) highlighting that the index for the month of May 2025 deteriorated to negative territory, coming in at 49.6, down from 52.0 in March 2025, signaling worsening in business conditions, mainly attributable to decreased output and new orders. This marked the first time in eight months the index fell below the 50.0 neutral mark.
In Q1’2025, Kenya’s Unit Trust Funds (UTFs) industry recorded strong growth, with Assets Under Management (AUM) increasing by 27.5% quarter-on-quarter to Kshs 496.2 bn, up from Kshs 389.2 bn in Q4’2024, and representing a 120.2% year-on-year growth. This growth was driven by low investment minimums, rising investor awareness, fintech adoption, and competitive returns, particularly from Money Market Funds (MMFs), which comprised 64.4% of the industry’s AUM. Sanlam Money Market Fund surpassed CIC Money Market Fund to become the largest unit trust by AUM in Kenya with an 18.2% market share, signaling a shift in investor preference and competitive positioning within the industry. For more read our Q1’2025 Unit Trust Fund Performance note
We are projecting that the MPC will maintain the Central Bank Rate (CBR) at 10.00% to allow more time for recent policy measures to take effect. While global economies are easing or holding rates steady, the MPC is likely to adopt a cautious stance to allow the Central Bank of Kenya (CBK) to monitor economic developments of its monetary policy measures before making further adjustments, supported by the stability of the Kenyan Shilling and strong foreign reserves. For more read our Monetary Policy Committee (MPC) Meeting note
Equities
During the week, the equities market was on an upward trajectory, with NSE 10 gaining the most by 1.7% while NSE 25, NSE 20 and NASI gained by 1.4%, 1.3% and 0.9% respectively, taking the YTD performance to gains of 8.1%, 7.5%, 3.7% and 3.3% for NASI, NSE 20, NSE 25 and NSE 10. The equities market performance was driven by gains recorded by large-cap stocks such as Equity, KCB and Safaricom of 4.4%, 3.0% and 2.2%, respectively. The performance was however weighed down by losses recorded by large cap stock such as Absa of 0.8%;
Additionally, in the regional equities market, the East African Exchanges 20 (EAE 20) share index lost by 0.5% to 100.1 from 100.6 recorded the previous week, attributable to losses recorded by large cap stocks such as the Tanga Cement Company, Airtel Uganda and Absa Bank Kenya of 6.6%, 5.2% and 1.1% respectively. The performance was however supported by gains recorded by large cap stocks such as Bank of Equity Group, KCB Group and NMB Bank of 2.3%, 2.1% and 2.0% respectively;
Real Estate
During the week, Kenya’s Affordable Housing Levy, introduced to fund low-cost housing and address the country’s housing deficit, is at the center of controversy following revelations that the government plans to redirect these funds to construct schools, markets, police posts, and hospitals. This shift, outlined in proposed regulations, has sparked concerns about transparency and the potential misuse of funds intended for affordable housing, raising questions about the government’s commitment to its original promise to Kenyan workers.
On the Unquoted Securities Platform, Acorn D-REIT and I-REIT traded at Kshs 26.7 and Kshs 22.9 per unit, respectively, as per the last updated data on 23rd May 2025. The performance represented a 33.4% and 14.5% gain for the D-REIT and I-REIT, respectively, from the Kshs 20.0 inception price. Additionally, ILAM Fahari I-REIT traded at Kshs 11.0 per share as of 23rd May 2025, representing a 45.0% loss from the Kshs 20.0 inception price. The volume traded to date came in at 1.2 mn shares for the I-REIT, with a turnover of Kshs 1.5 mn since inception in November 2015.
Focus of the Week
Kenya’s vibrant economy, strategic position as East Africa’s economic hub, and investor-friendly policies make it an attractive destination for businesses seeking growth through collaboration. Joint ventures (JVs) have emerged as a powerful strategy for local and international companies to pool resources, share risks, and tap into new markets. Whether in real estate, infrastructure, technology, or manufacturing, JVs enable businesses to leverage complementary strengths while navigating Kenya’s dynamic business landscape. This article provides an in-depth exploration of joint ventures in Kenya, covering their types, legal frameworks, benefits, risks, recent developments, and best practices for success;
Investment Updates:
- Weekly Rates: Cytonn Money Market Fund closed the week at a yield of 13.6 % p.a. To invest, dial *809# or download the Cytonn App from Google Play store here or from the Appstore here;
- We continue to offer Wealth Management Training every Tuesday, from 7:00 pm to 8:00 pm. The training aims to grow financial literacy among the general public. To register for any of our Wealth Management Trainings, click here;
- If interested in our Private Wealth Management Training for your employees or investment group, please get in touch with us through wmt@cytonn.com;
- Cytonn Insurance Agency acts as an intermediary for those looking to secure their assets and loved ones’ future through insurance namely; Motor, Medical, Life, Property, WIBA, Credit and Fire and Burglary insurance covers. For assistance, get in touch with us through insuranceagency@cytonn.com;
- Cytonn Asset Managers Limited (CAML) continues to offer pension products to meet the needs of both individual clients who want to save for their retirement during their working years and Institutional clients that want to contribute on behalf of their employees to help them build their retirement pot. To more about our pension schemes, kindly get in touch with us through pensions@cytonn.com;
Hospitality Updates:
- We currently have promotions for Staycations. Visit cysuites.com/offers for details or email us at sales@cysuites.com;
Money Markets, T-Bills Primary Auction:
This week, T-bills were oversubscribed for the fifth consecutive week, with the overall subscription rate coming in at 255.9%, higher than the subscription rate of 229.6% recorded the previous week. Investors’ preference for the shorter 91-day paper persisted, with the paper receiving bids worth Kshs 7.9 bn against the offered Kshs 4.0 bn, translating to a subscription rate of 197.9%, significantly lower than the oversubscription rate of 480.0%, recorded the previous week. The subscription rates for the 182-day increased to 104.9% from the 97.7% recorded the previous week, while the 364-day papers increased to 430.0% from the 261.3% respectively recorded the previous week. The government accepted a total of Kshs 57.4 bn worth of bids out of Kshs 61.4 bn bids received, translating to an acceptance rate of 93.5%. The yields on the government papers were on a downward trajectory with the yields on the 182-day paper decreasing the most by 2.1 bps to 8.54% from the 8.56% recorded the previous week, while the yields on the 91-day and 364-day papers decreased by 1.1 bps and 0.2 bps to 8.28% and 10.00%, from the 8.29% and 10.00% recorded the previous week.
The chart below shows the yield performance of the 91-day, 182-day and 364-day papers from June 2024 to June 2025:
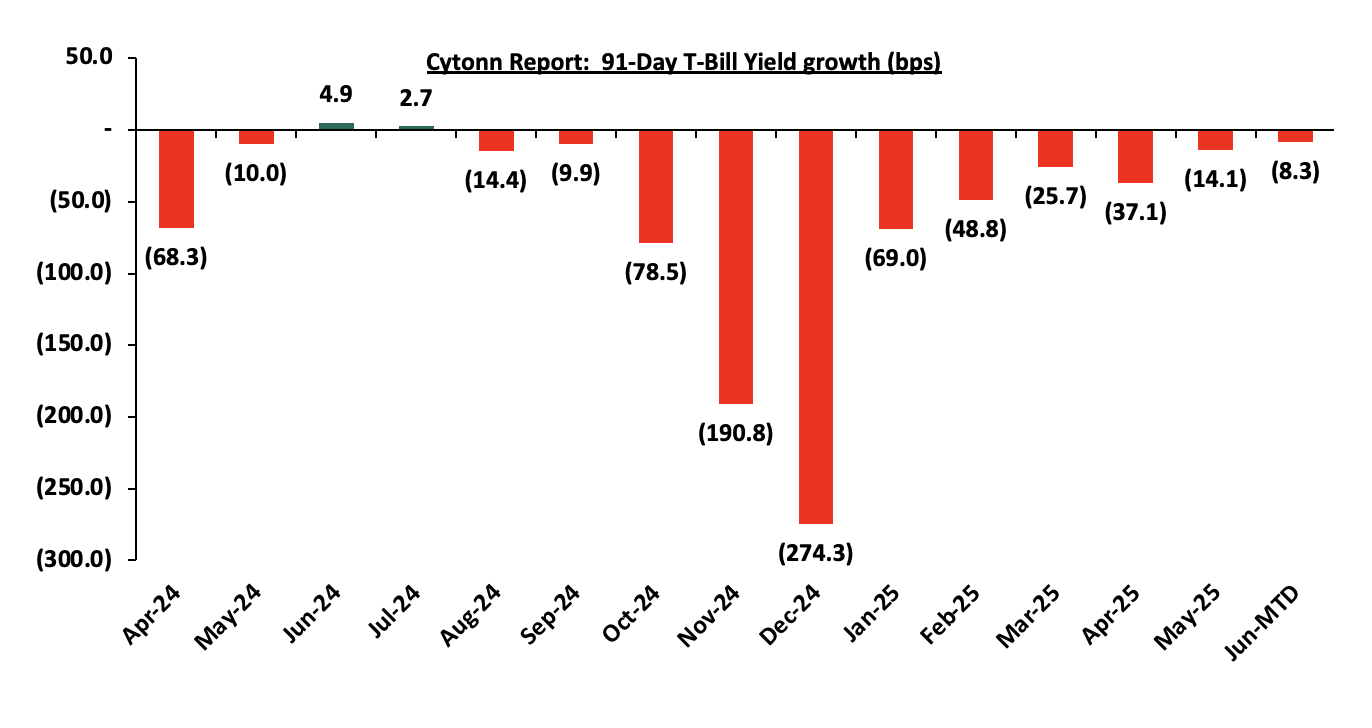
The chart below shows the yield growth for the 91-day T-bill:
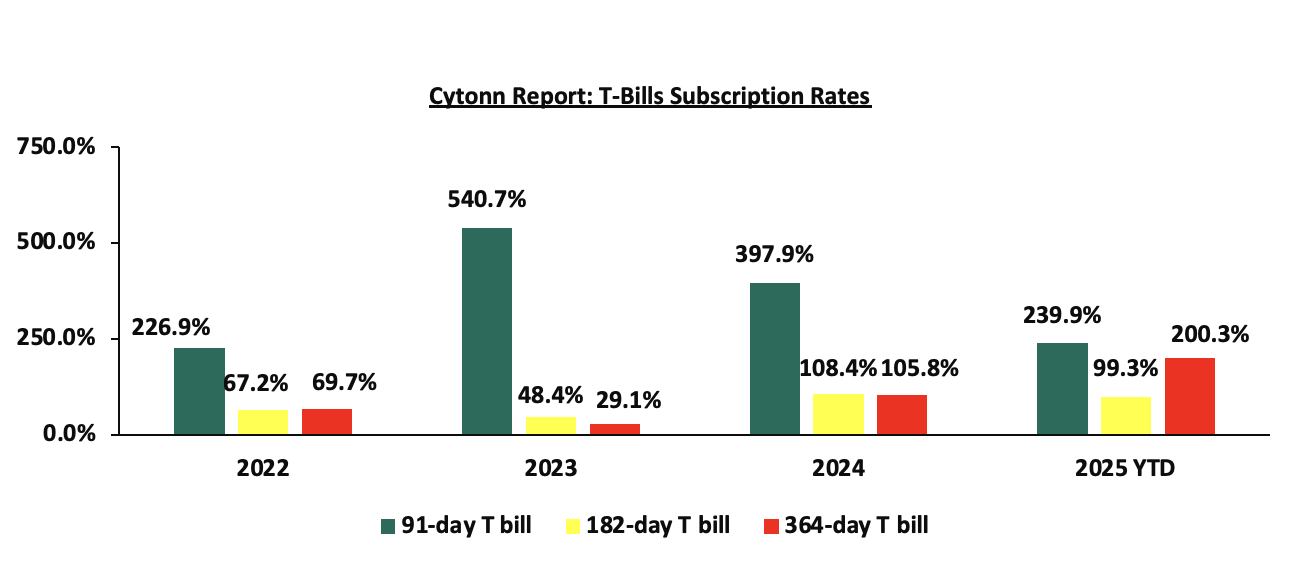
The chart below compares the overall average T-bill subscription rates obtained in 2022,2023, 2024 and 2025 Year-to-date (YTD):
Money Market Performance:
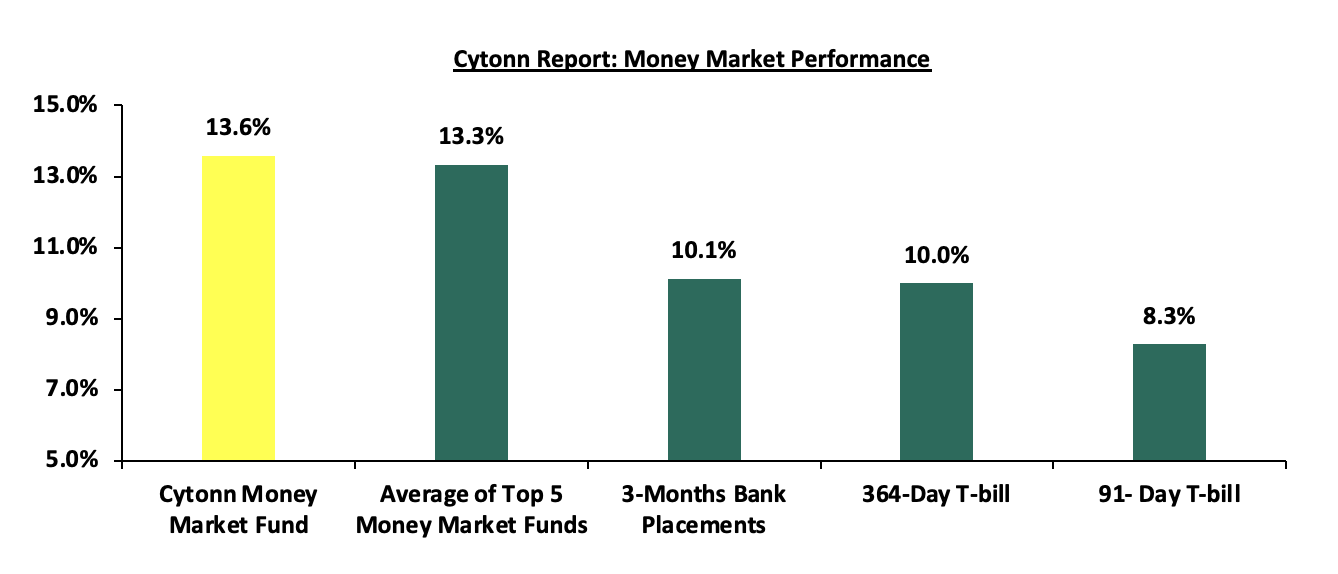
In the money markets, 3-month bank placements ended the week at 10.1% (based on what we have been offered by various banks) and the yields on the government papers were on a downward trajectory with the yields on 91-day paper decreasing by 1.1bps to 8.28% from 8.29% recorded the previous week while the yields for the 364-day papers decreased by 0.2 bps to remain relatively unchanged from the 10.0% recorded the previous week. The yield on the Cytonn Money Market Fund decreased by 1.0 bps to remain relatively unchanged from the 13.6% recorded the previous week, while the average yields on the Top 5 Money Market Funds decreased by 6.8 bps to close the week at 13.3%, from the 13.4% recorded the previous week.
The table below shows the Money Market Fund Yields for Kenyan Fund Managers as published 6th June 2025:
|
Cytonn Report: Money Market Fund Yield for Fund Managers as published on 6thJune 2025 |
||
|
Rank |
Fund Manager |
Effective Annual Rate |
|
1 |
Gulfcap Money Market Fund |
13.9% |
|
2 |
Cytonn Money Market Fund ( Dial *809# or download Cytonn App) |
13.6% |
|
3 |
GenAfrica Money Market Fund |
13.1% |
|
4 |
Ndovu Money Market Fund |
13.1% |
|
5 |
Kuza Money Market fund |
13.0% |
|
6 |
Etica Money Market Fund |
12.8% |
|
7 |
Lofty-Corban Money Market Fund |
12.8% |
|
8 |
Arvocap Money Market Fund |
12.7% |
|
9 |
Orient Kasha Money Market Fund |
12.5% |
|
10 |
Enwealth Money Market Fund |
12.0% |
|
11 |
Old Mutual Money Market Fund |
11.6% |
|
12 |
Jubilee Money Market Fund |
11.5% |
|
13 |
Nabo Africa Money Market Fund |
11.4% |
|
14 |
Madison Money Market Fund |
11.3% |
|
15 |
British-American Money Market Fund |
11.3% |
|
16 |
Dry Associates Money Market Fund |
10.8% |
|
17 |
Sanlam Money Market Fund |
10.7% |
|
18 |
Faulu Money Market Fund |
10.7% |
|
19 |
Apollo Money Market Fund |
10.5% |
|
20 |
Genghis Money Market Fund |
10.4% |
|
21 |
KCB Money Market Fund |
10.2% |
|
22 |
Absa Shilling Money Market Fund |
10.1% |
|
23 |
Co-op Money Market Fund |
10.0% |
|
24 |
CIC Money Market Fund |
9.9% |
|
25 |
ICEA Lion Money Market Fund |
9.9% |
|
26 |
Mali Money Market Fund |
9.6% |
|
27 |
Mayfair Money Market Fund |
8.6% |
|
28 |
AA Kenya Shillings Fund |
7.9% |
|
29 |
Stanbic Money Market Fund |
7.2% |
|
30 |
Ziidi Money Market Fund |
7.1% |
|
31 |
Equity Money Market Fund |
5.4% |
Source: Business Daily
Liquidity:
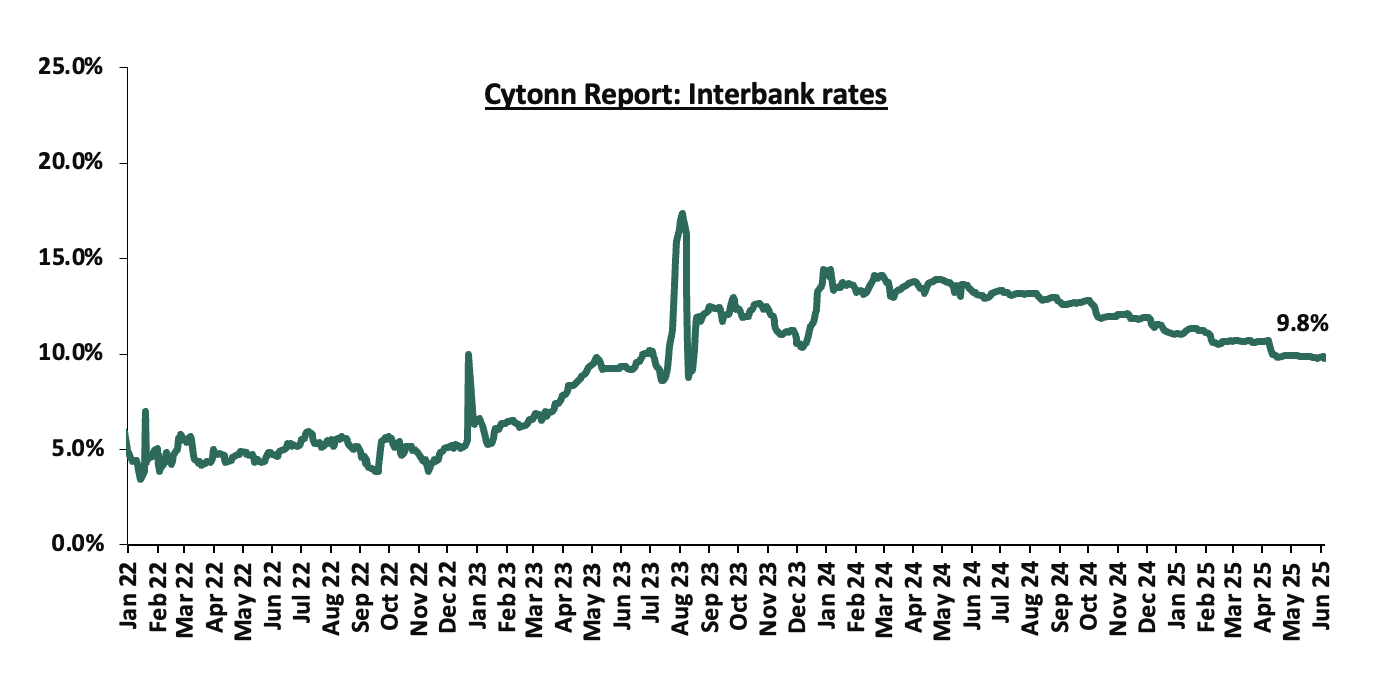
During the week, liquidity in the money markets marginally tightened, with the average interbank rate increasing by 0.1 bps, to remain relatively unchanged from the 9.8% recorded the previous week, partly attributable to government payments that were offset by tax remittances. The average interbank volumes traded increased by 22.2% to Kshs 7.9 bn from Kshs 6.5 bn recorded the previous week. The chart below shows the interbank rates in the market over the years:
Kenya Eurobonds:
During the week, the yields on Kenya’s Eurobonds were on a downward trajectory with the yield on the 7-year Eurobond issued in 2024 decreasing the most by 47.8 bps to 9.4% from the 9.9% recorded the previous. The table below shows the summary performance of the Kenyan Eurobonds as of 5th June 2025;
|
Cytonn Report: Kenya Eurobond Performance |
|||||||
|
|
2018 |
2019 |
2021 |
2024 |
2025 |
||
|
Tenor |
10-year issue |
30-year issue |
7-year issue |
12-year issue |
13-year issue |
7-year issue |
11-year issue |
|
Amount Issued (USD) |
1.0 bn |
1.0 bn |
0.9 bn |
1.2 bn |
1.0 bn |
1.5 bn |
1.5 bn |
|
Years to Maturity |
3.0 |
23.0 |
2.2 |
7.2 |
9.3 |
6.0 |
11.0 |
|
Yields at Issue |
7.3% |
8.3% |
7.0% |
7.9% |
6.2% |
10.4% |
9.9% |
|
02-Jan-25 |
9.1% |
10.3% |
8.5% |
10.1% |
10.1% |
10.1% |
|
|
01-May-25 |
10.1% |
11.4% |
8.4% |
11.1% |
10.9% |
11.2% |
|
|
29-May-25 |
8.7% |
10.8% |
7.7% |
10.0% |
10.0% |
9.9% |
|
|
30-May-25 |
8.7% |
10.8% |
- |
10.0% |
10.1% |
9.9% |
|
|
02-Jun-25 |
8.7% |
10.8% |
- |
10.0% |
10.1% |
9.9% |
|
|
03-Jun-25 |
8.5% |
10.7% |
- |
9.8% |
9.9% |
9.7% |
|
|
04-Jun-25 |
8.3% |
10.5% |
- |
9.6% |
9.7% |
9.4% |
|
|
05-Jun-25 |
8.3% |
10.5% |
- |
9.6% |
9.7% |
9.4% |
|
|
Weekly Change |
(0.4%) |
(0.3%) |
- |
(0.4%) |
(0.3%) |
(0.5%) |
- |
|
MTD Change |
(1.8%) |
(0.9%) |
- |
(1.5%) |
(1.2%) |
(1.8%) |
- |
|
YTD Change |
(0.8%) |
0.2% |
- |
(0.5%) |
(0.4%) |
(0.7%) |
- |
Source: Central Bank of Kenya (CBK) and National Treasury
Kenya Shilling:
During the week, the Kenyan Shilling appreciated marginally against the US Dollar by 1.4 bps, to remain relatively unchanged from the Kshs 129.2 recorded the previous week. On a year-to-date basis, the shilling has appreciated by 6.4 bps against the dollar, compared to the 17.4% appreciation recorded in 2024.
We expect the shilling to be supported by:
- Diaspora remittances standing at a cumulative USD 4,997.2 mn in the twelve months to April 2025, 12.1% higher than the USD 4,457.5 mn recorded over the same period in 2024. These has continued to cushion the shilling against further depreciation. In the April 2025 diaspora remittances figures, North America remained the largest source of remittances to Kenya accounting for 59.6% in the period,
- The tourism inflow receipts which came in at Kshs 452.2 bn in 2024, a 19.8% increase from Kshs 377.5 bn inflow receipts recorded in 2023, and owing to tourist arrivals that improved by 8.0% to 2,303,028 in the 12 months to February 2025 from 2,133,612 in the 12 months to February 2024 and,
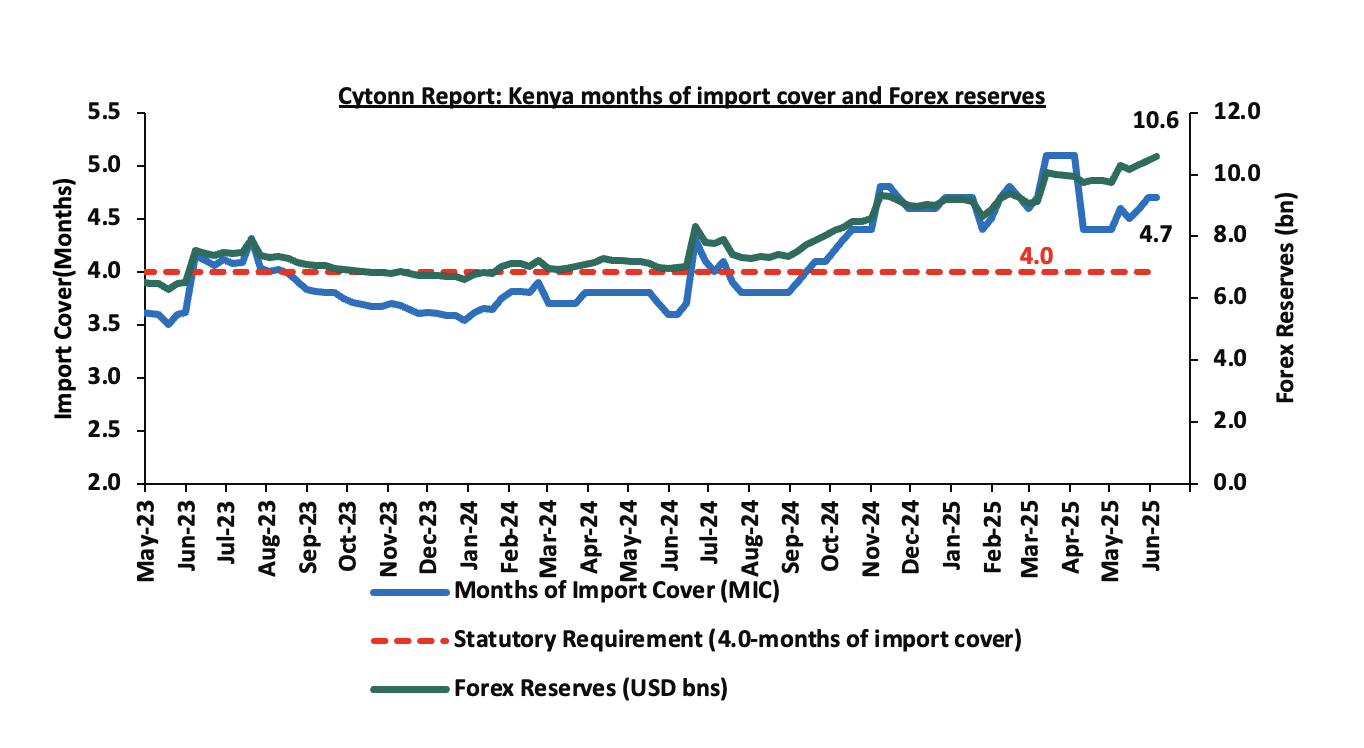
- Improved forex reserves currently at USD 10.6 bn (equivalent to 4.7-months of import cover), which is above the statutory requirement of maintaining at least 4.0-months of import cover and above the EAC region’s convergence criteria of 4.5-months of import cover.
The shilling is however expected to remain under pressure in 2025 as a result of:
- An ever-present current account deficit which came at 3.1% of GDP in the twelve months to February 2025, and,
- The need for government debt servicing, continues to put pressure on forex reserves given that 62.0% of Kenya’s external debt is US Dollar-denominated as of December 2024.
Key to note, Kenya’s forex reserves increased by 1.2% during the week, to USD 10.6 bn from USD 10.5 bn recorded in the previous week, equivalent to 4.7 months of import cover), and above the statutory requirement of maintaining at least 4.0-months of import cover.
The chart below summarizes the evolution of Kenya's months of import cover over the years:
Weekly Highlights
- Stanbic Bank’s May 2025 Purchasing Manager’s Index (PMI)
During the week, Stanbic Bank released its monthly Purchasing Manager's Index (PMI) highlighting that the index for the month of May 2025 deteriorated to negative territory, coming in at 49.6, down from 52.0 in March 2025, signaling worsening in business conditions, mainly attributable to decreased output and new orders. This marked the first time in eight months the index fell below the 50.0 neutral mark. On a year-to-year basis, the index recorded 4.2% points decrease from the 51.8 recorded in May 2024. The downturn was mainly attributed to a fall in new orders and output amid rising prices and weakening demand. Input prices rose at the fastest rate in four months, mainly due to increased purchase prices and higher taxation, while output charges rose at their slowest pace since October 2024 as firms tried to limit price hikes to support demand.
In May, business output contracted at the fastest rate in ten months, although the decline was mild overall. Around 33.0% of firms reported falling output, mainly in construction, retail, and services, while agriculture and manufacturing saw growth. New orders fell for the first time since September 2024, attributed to weaker customer demand and rising prices, though some businesses reported gains from new marketing and client acquisition efforts. Despite the downturn, inventory stockpiling and some sectoral resilience helped soften the impact.
Employment levels continued to rise marginally for the fourth straight month in May, supported by short-term hiring to fulfill existing orders. The employment index remained above the 50.0 mark, suggesting ongoing efforts by businesses to maintain capacity despite reduced output. Meanwhile, the Backlogs of Work Index hovered around the neutral point, implying steady levels of unfinished work and no major accumulation of operational pressure.
Purchasing activity dipped slightly, marking one of the sharpest declines in ten months, as firms scaled back orders in response to softening demand. Despite this, inventories grew for the fifth month running, with some firms preparing for anticipated future orders or hedging against possible input shortages. Supplier delivery times continued to improve modestly, with vendors more responsive in securing payments and maintaining faster delivery cycles.
Input prices rose at the fastest pace in four months, largely due to higher material costs, taxes, and customs fees. The purchase price index also accelerated, with manufacturers particularly affected. Staff costs increased marginally, reaching the highest level since October 2024. However, with demand under pressure, most firms avoided aggressive pricing, resulting in a modest and slowing increase in output prices, the weakest pace in seven months.
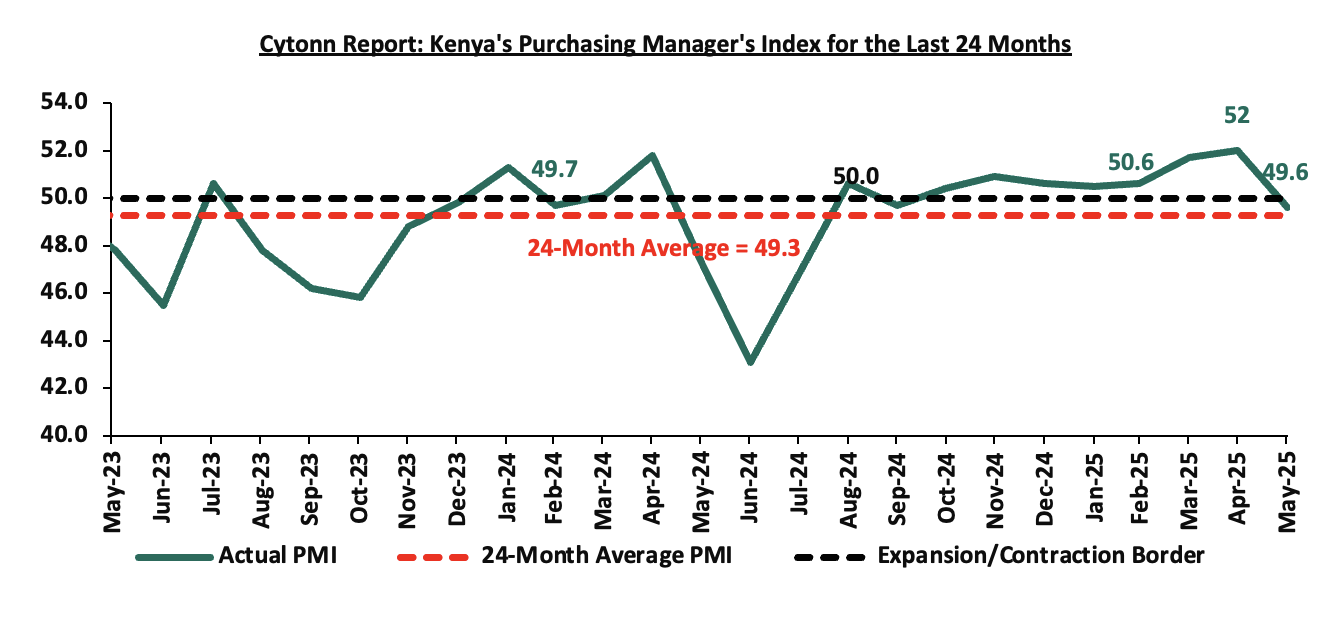
Going forward, we anticipate that the business environment will improve in the short to medium term as a result of the improving economic environment driven by lower interest rates following the easing monetary policy with the CBR decreasing by 75.0 bps to 10.00% in April 2025 from 10.75%, the stability of the Kenyan Shilling against the USD, the low inflation rates currently at 3.8% and stable fuel prices. However, we expect businesses to be weighed down by the high cost of living coupled with the high taxation, which are set to increase input costs. Overall the private sector is expected to continue with the recovery albeit with potential headwinds in the coming months.
Rates in the Fixed Income market have been on a downward trend due to high liquidity in the money market which allowed the government to front load most of its borrowing. The government is 74.3% ahead of its prorated net domestic borrowing target of Kshs 562.7 bn, and 64.2% ahead of the total FY’2024/25 net domestic borrowing target of Kshs 597.2 bn, having a net borrowing position of Kshs 980.7 bn (inclusive of T-bills). However, we expect a stabilization of the yield curve in the short and medium term, with the government looking to increase its external borrowing to maintain the fiscal surplus, hence alleviating pressure in the domestic market. As such, we expect the yield curve to stabilize in the short to medium-term and hence investors are expected to shift towards the long-term papers to lock in the high returns
Market Performance
During the week, the equities market was on a upward trajectory, with NSE 10 gaining the most by 1.7% while NSE 25, NSE 20 and NASI gained by 1.4%, 1.3% and 0.9% respectively, taking the YTD performance to gains of 8.1%, 7.5%, 3.7% and 3.3% for NASI, NSE 20, NSE 25 and NSE 10. The equities market performance was driven by gains recorded by large-cap stocks such as Equity, KCB and Safaricom of 4.4%, 3.0% and 2.2%, respectively. The performance was however weighed down by losses recorded by large cap stock such as Absa of 0.8%.
Additionally, in the regional equities market, the East African Exchanges 20 (EAE 20) share index lost by 0.5% to 100.1 from 100.6 recorded the previous week, attributable to losses recorded by large cap stocks such as the Tanga Cement Company, Airtel Uganda and Absa Bank Kenya of 6.6%, 5.2% and 1.1% respectively. The performance was however supported by gains recorded by large cap stocks such as Bank of Equity Group, KCB Group and NMB Bank of 2.3%, 2.1% and 2.0% respectively.
During the week, equities turnover decreased by 29.2% to USD 10.2 mn, from USD 14.5 mn recorded the previous week, taking the YTD total turnover to USD 340.1 mn. Foreign investors remained net sellers for the third consecutive week, with a net selling position of USD 0.5 mn, from a net selling position of USD 2.7 mn recorded the previous week, taking the YTD foreign net selling position to USD 33.3 mn, compared to a net selling position of USD 16.9 mn in 2024.
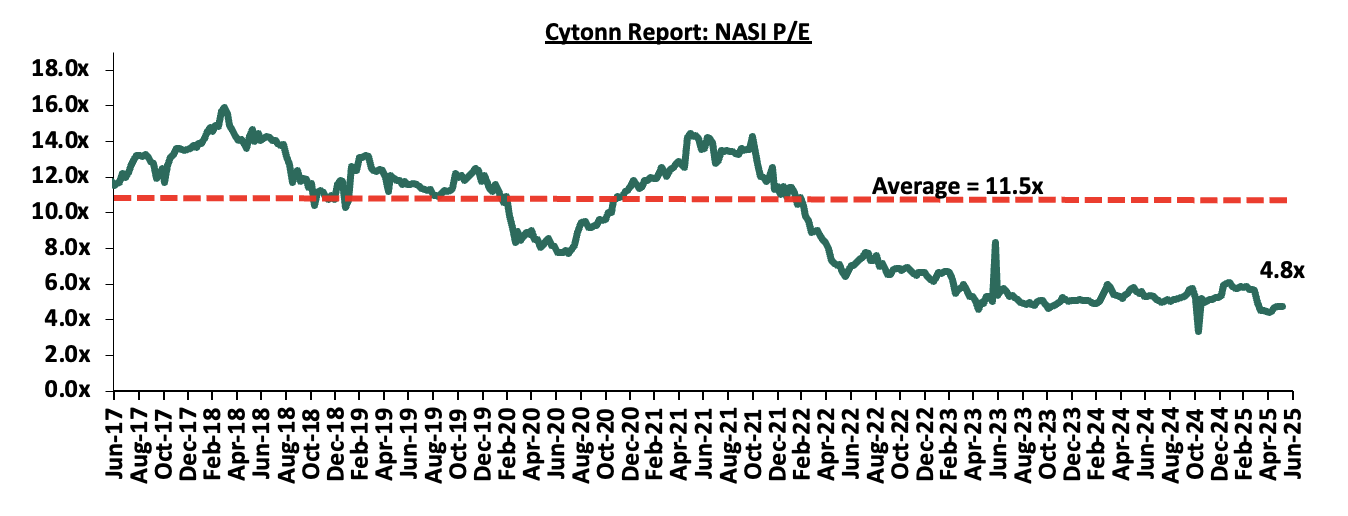
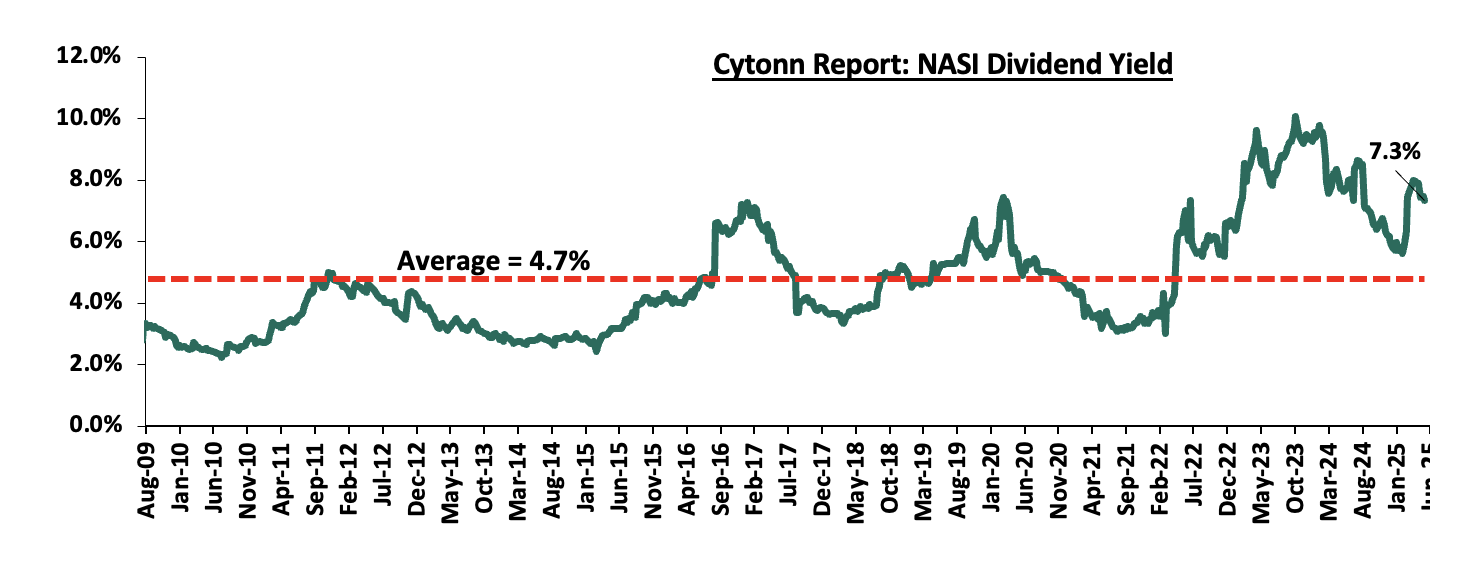
The market is currently trading at a price-to-earnings ratio (P/E) of 4.8x, 58.4% below the historical average of 11.5x. The dividend yield stands at 7.3%, 2.6% points above the historical average of 4.7%. Key to note, NASI’s PEG ratio currently stands at 0.6x, an indication that the market is undervalued relative to its future growth. A PEG ratio greater than 1.0x indicates the market is overvalued while a PEG ratio less than 1.0x indicates that the market is undervalued. The charts below indicate the historical P/E and dividend yields of the market;
Universe of Coverage:
|
Cytonn Report: Equities Universe of Coverage |
||||||||||
|
Company |
Price as at 30/05/2025 |
Price as at 05/06/2025 |
w/w change |
YTD Change |
Year Open 2025 |
Target Price* |
Dividend Yield |
Upside/ Downside** |
P/TBv Multiple |
Recommendation |
|
Standard Chartered Bank |
268.5 |
269.0 |
0.2% |
(5.7%) |
285.3 |
328.8 |
16.7% |
39.0% |
1.5x |
Buy |
|
Stanbic Holdings |
152.8 |
153.0 |
0.2% |
9.5% |
139.8 |
185.3 |
13.6% |
34.7% |
0.9x |
Buy |
|
Diamond Trust Bank |
72.0 |
72.0 |
0.0% |
7.9% |
66.8 |
87.1 |
9.7% |
30.7% |
0.3x |
Buy |
|
Co-op Bank |
15.5 |
15.5 |
0.0% |
(11.2%) |
17.5 |
18.6 |
9.7% |
29.8% |
0.5x |
Buy |
|
Equity Group |
43.1 |
45.0 |
4.4% |
(6.4%) |
48.0 |
52.8 |
9.5% |
26.9% |
0.8x |
Buy |
|
ABSA Bank |
18.3 |
18.2 |
(0.8%) |
(3.7%) |
18.9 |
21.0 |
9.6% |
25.3% |
1.2x |
Buy |
|
KCB Group |
42.1 |
43.4 |
3.0% |
2.2% |
42.4 |
50.7 |
6.9% |
23.9% |
0.5x |
Buy |
|
Jubilee Holdings |
227.0 |
225.0 |
(0.9%) |
28.8% |
174.8 |
260.7 |
6.0% |
21.8% |
0.3x |
Buy |
|
NCBA |
54.5 |
54.8 |
0.5% |
7.4% |
51.0 |
60.2 |
10.0% |
20.0% |
0.9x |
Buy |
|
CIC Group |
2.7 |
2.7 |
0.7% |
27.6% |
2.1 |
3.1 |
4.8% |
18.3% |
0.7x |
Accumulate |
|
I&M Group |
34.0 |
34.0 |
(0.1%) |
(5.7%) |
36.0 |
36.8 |
8.8% |
17.2% |
0.6x |
Accumulate |
|
Britam |
6.7 |
7.0 |
3.9% |
19.6% |
5.8 |
7.5 |
0.0% |
7.8% |
0.7x |
Hold |
|
*Target Price as per Cytonn Analyst estimates **Upside/ (Downside) is adjusted for Dividend Yield ***Dividend Yield is calculated using FY’2024 Dividends |
||||||||||
We are “Bullish” on the Equities markets in the short term due to current cheap valuations, lower yields on short-term government papers and expected global and local economic recovery, and, “Neutral” in the long term due to persistent foreign investor outflows. With the market currently trading at a discount to its future growth (PEG Ratio at 0.6x), we believe that investors should reposition towards value stocks with strong earnings growth and that are trading at discounts to their intrinsic value. We expect the current high foreign investors sell-offs to continue weighing down the economic outlook in the short term.
- Residential Sector
- Government proposal to redirect the affordable housing levy to construct schools and markets
During the week, Kenya’s Affordable Housing Levy, introduced to fund low-cost housing and address the country’s housing deficit, is at the center of controversy following revelations that the government plans to redirect these funds to construct schools, markets, police posts, and hospitals. This shift, outlined in proposed regulations, has sparked concerns about transparency and the potential misuse of funds intended for affordable housing, raising questions about the government’s commitment to its original promise to Kenyan workers.
The Affordable Housing Act, 2024, mandates a 1.5% deduction from employees’ gross salaries, matched by employers, to finance housing projects and associated infrastructure like roads and utilities. The Kenya Revenue Authority (KRA) collects these funds, which are managed by the Affordable Housing Board. However, President William Ruto recently disclosed that the levy is also being used to complete markets, some initiated during the Mwai Kibaki era, and to build student hostels. The government aims to raise Kshs 500 bn over the next decade to construct 363,860 homes, including units for civil servants and security personnel, alongside social infrastructure. Of this, Kshs 142.4 bn is earmarked for non-housing projects like schools and health centers, which critics argue deviates from the levy’s core purpose.
The Central Organisation of Trade Unions (COTU), has fiercely criticized the plan, warning that it creates loopholes for misappropriation. COTU emphasized that Kenyan workers, who contribute nearly 90% of the funds, were not consulted during the drafting of these regulations, violating constitutional requirements for public participation. COTU demands that the process be halted and redrafted to ensure funds are used solely for housing. Real estate experts have noted a legal ambiguity allowing funds to be diverted to “associated infrastructure” outside housing projects, exacerbated by the slow absorption of collected funds, with only Kshs 16.7 bn of Kshs 64.8 bn spent in the last financial year.
This redirection has drawn public outcry, with many viewing it as a betrayal of trust, given the levy’s impact on salaries amid rising living costs. The Auditor-General and Controller of Budget have raised concerns about low fund absorption and project credibility, while legal challenges loom over the Act’s constitutionality. The government defends the plan, arguing that markets and schools enhance housing projects’ viability, but without transparent public engagement, the initiative risks losing credibility and public support.
- Real Estate Investments Trusts (REITs)
On the Unquoted Securities Platform, Acorn D-REIT and I-REIT traded at Kshs 26.7 and Kshs 22.9 per unit, respectively, as per the last updated data on 23rd May 2025. The performance represented a 33.4% and 14.5% gain for the D-REIT and I-REIT, respectively, from the Kshs 20.0 inception price. The volumes traded for the D-REIT and I-REIT came in at Kshs 12.8 mn and Kshs 36.1 mn shares, respectively, with a turnover of Kshs 323.5 mn and Kshs 791.5 mn, respectively, since inception in February 2021. Additionally, ILAM Fahari I-REIT traded at Kshs 11.0 per share as of 23rd May 2025, representing a 45.0% loss from the Kshs 20.0 inception price. The volume traded to date came in at 1.2 mn shares for the I-REIT, with a turnover of Kshs 1.5 mn since inception in November 2015.
REITs offer various benefits, such as tax exemptions, diversified portfolios, and stable long-term profits. However, the ongoing decline in the performance of Kenyan REITs and the restructuring of their business portfolios are hindering significant previous investments. Additional general challenges include:
- Insufficient understanding of the investment instrument among investors leading to a slower uptake of REIT products,
- Lengthy approval processes for REIT creation,
- High minimum capital requirements of Kshs 100.0 mn for REIT trustees compared to Kshs 10.0 mn for pension funds Trustees, essentially limiting the licensed REIT Trustee to banks only
- The rigidity of choice between either a D-REIT or and I-REIT forces managers to form two REITs, rather than having one Hybrid REIT that can allocate between development and income earning properties
- Limiting the type of legal entity that can form a REIT to only a trust company, as opposed to allowing other entities such as partnerships, and companies,
- We need to give time before REITS are required to list – they would be allowed to stay private for a few years before the requirement to list given that not all companies maybe comfortable with listing on day one, and,
- Minimum subscription amounts or offer parcels set at Kshs 0.1 mn for D-REITs and Kshs 5.0 mn for restricted I-REITs. The significant capital requirements still make REITs relatively inaccessible to smaller retail investors compared to other investment vehicles like unit trusts or government bonds, all of which continue to limit the performance of Kenyan REITs.
We expect the performance of Kenya’s Real Estate sector to remain resilient supported by several factors: i) heightened activities from both private and government sectors, ii) an expanding population driving the need for housing, iii) government efforts under the Affordable Housing Program and the incentives advanced to developers aligned with the program, iv) an increase in deals in the commercial office sector likely to boost occupancy, v) increased investment by international and local investors in the retail sector, and vi) increased international arrivals in the country boosting the hospitality and tourism sector. However, challenges such as rising construction costs, an oversupply in select Real Estate classes, strain on infrastructure development, and high capital demands in REITs sector will continue to impede the real estate sector’s optimal performance by restricting developments and investments.
Kenya’s vibrant economy, strategic position as East Africa’s economic hub, and investor-friendly policies make it an attractive destination for businesses seeking growth through collaboration. Joint ventures (JVs) have emerged as a powerful strategy for local and international companies to pool resources, share risks, and tap into new markets. Whether in real estate, infrastructure, technology, or manufacturing, JVs enable businesses to leverage complementary strengths while navigating Kenya’s dynamic business landscape. This article provides an in-depth exploration of joint ventures in Kenya, covering their types, legal frameworks, benefits, risks, recent developments, and best practices for success.
A joint venture is a strategic business arrangement where two or more parties—individuals, companies, or government entities—collaborate to achieve a specific goal while maintaining their independent identities. Unlike mergers or acquisitions, JVs allow each party to retain autonomy while pooling resources such as capital, expertise, technology, or market access. In Kenya, JVs are commonly used for large-scale projects, market expansion, or innovation-driven initiatives, particularly in sectors like infrastructure, real estate, energy, and technology.
JVs can take various forms, including:
- Contractual Joint Ventures: These are based on a contractual agreement outlining roles, responsibilities, and profit-sharing without creating a separate legal entity. They are ideal for short-term or project-specific collaborations.
- Equity Joint Ventures: Parties form a new legal entity, such as a limited liability company (LLC), with each contributing capital and sharing ownership based on agreed proportions. This structure is common for long-term ventures.
- Partnerships: Governed by Kenya’s Partnerships Act, 2012, these involve collaboration under a partnership framework, often used by small and medium enterprises (SMEs) or professional services.
- Public-Private Partnerships (PPPs): These involve collaboration between government entities and private firms to deliver public infrastructure or services, governed by the Public Private Partnership Act.
In 2024 we published a report titled introduction to Joint Venture Agreements (JVs) in Real Estate where we introduced the concept of Joint Ventures in Kenya. We covered the process of establishing a JV, Issues to consider when constituting a JV and the Benefits of the joint ventures. For detailed information please access the report here. This week, we shall focus on joint venture regulations in Real Estate. We shall discuss the following;
- Legal frameworks governing joint ventures in Kenya
- Risks and challenges of Joint Ventures in Kenya
- Best practices for successful Joint Ventures in Kenya
- Examples of successful JV partnerships in Real Estate in Kenya
- Conclusion
Section I. Legal Frameworks Governing Joint Ventures in Kenya
Joint ventures (JVs) in Kenya operate within a robust, multifaceted legal and regulatory framework designed to ensure compliance, transparency, fair competition, and protection of stakeholders’ interests. This framework governs various aspects of JVs, from formation and governance to sector-specific requirements and international obligations. Below is a detailed examination of the key laws, regulations, and considerations that shape JVs in Kenya:
- The Companies Act, 2015
The Companies Act, 2015, serves as the cornerstone for incorporated JVs, particularly equity-based ventures where partners establish a new corporate entity. This comprehensive legislation outlines the legal requirements for company formation, registration, governance, and ongoing compliance. For instance, JVs structured as private or public companies must adhere to provisions on shareholding structures, directorships, and financial reporting. A critical requirement under the act is the mandatory filing of beneficial ownership registers with the Registrar of Companies, which promotes transparency by identifying the ultimate owners of the company. Additionally, the act mandates annual returns, shareholder meetings, and adherence to corporate governance principles, ensuring accountability and proper management of JVs. Non-compliance may result in penalties, including fines or deregistration, making it essential for JV partners to maintain diligent record-keeping and statutory compliance.
- The Partnerships Act, 2012
The Partnerships Act, 2012, governs JVs structured as partnerships, offering flexibility for businesses that do not require a separate legal entity. The act recognizes two primary partnership models: general partnerships (GPs) and limited liability partnerships (LLPs). In general partnerships, partners share unlimited liability, meaning personal assets may be at risk in the event of business debts or legal claims. Conversely, LLPs provide limited liability protection, shielding partners’ personal assets from business liabilities, which is particularly attractive for professional or contractual JVs. The act defines a partnership as “the relationship which exists between persons who carry on business in common with a view to making a profit,” emphasizing the collaborative nature of such ventures. For contractual JVs, where parties collaborate on a specific project without forming a new entity, the Partnerships Act provides clarity on profit-sharing, decision-making, and liability allocation to prevent disputes or unintended legal consequences. Partners are advised to draft comprehensive partnership agreements to outline roles, responsibilities, and exit strategies, ensuring alignment and minimizing risks.
- The Competition Act, 2010
The Competition Act, 2010, enforced by the Competition Authority of Kenya (CAK), plays a pivotal role in regulating JVs to safeguard fair competition and prevent anti-competitive practices. The act prohibits agreements or arrangements that restrict market competition, such as price-fixing, market allocation, or limiting production, which could arise in JVs involving competitors. JVs that meet specific merger control thresholds—based on turnover, assets, or market share—require prior notification and approval from the CAK. The authority assesses whether the JV could lead to market dominance, reduced consumer choice, or collusion. To provide clarity, the CAK has issued detailed Joint Venture Guidelines, outlining compliance requirements and evaluation criteria. For example, a JV between two major telecommunications firms may be scrutinized to ensure it does not stifle innovation or harm consumers. Non-compliance with the act can lead to significant penalties, including fines of up to 10% of a company’s annual turnover, underscoring the importance of conducting thorough competition law due diligence during JV formation.
- The Public Private Partnership Act-
For JVs involving collaboration between private entities and government bodies, the Public Private Partnership (PPP) Act provides a structured framework, particularly for large-scale infrastructure projects such as roads, airports, power plants, or water supply systems. The act establishes clear procedures for tendering, project structuring, risk allocation, and dispute resolution to ensure transparency and efficiency. PPPs are often used in sectors requiring significant capital investment, such as renewable energy or transportation, where private expertise complements public resources. For instance, a JV to develop a solar power plant would follow the PPP Act’s guidelines on feasibility studies, procurement processes, and performance monitoring. The act also emphasizes equitable risk-sharing, ensuring that neither party bears disproportionate financial or operational burdens. Dispute resolution mechanisms, including arbitration and mediation, are outlined to address conflicts efficiently, fostering investor confidence in Kenya’s PPP framework.
- Industry-Specific Regulations
JVs in regulated sectors such as energy, telecommunications, banking, and real estate must comply with additional industry-specific laws and oversight by relevant authorities. For example, in the telecommunications sector, the Communications Authority of Kenya mandates that information and communication technology (ICT) companies maintain at least 30% local Kenyan ownership, impacting the structuring of JVs with foreign partners. In the energy sector, the Energy and Petroleum Regulatory Authority (EPRA) imposes licensing and compliance requirements for JVs involved in power generation or distribution. Similarly, real estate JVs must navigate land ownership laws, including restrictions on foreign ownership of agricultural land under the Land Act, 2012, and environmental compliance under the Environmental Management and Coordination Act (EMCA). The EMCA requires Environmental Impact Assessments (EIAs) for projects with potential environmental effects, such as large-scale real estate developments or mining operations. Failure to comply with these regulations can result in project delays, fines, or legal challenges, making sector-specific due diligence critical for JV success.
- International Treaties and Agreements
International JVs (IJVs) involving foreign partners are subject to regional and international treaties that promote cross-border trade and investment. Kenya’s membership in the Common Market for Eastern and Southern Africa (COMESA) subjects IJVs to the COMESA Competition Regulations, which aim to harmonize competition and consumer protection laws across member states. These regulations are particularly relevant for JVs operating in multiple jurisdictions, ensuring compliance with cross-border merger control and anti-competitive behavior rules. Additionally, bilateral investment treaties (BITs) between Kenya and other countries provide protections for foreign investors, such as guarantees against expropriation and access to international arbitration. For example, a JV between a Kenyan and a European company may benefit from the Kenya-EU Economic Partnership Agreement, which facilitates trade and investment. Understanding these treaties is essential for structuring IJVs to maximize benefits and mitigate risks.
- Intellectual Property Laws
JVs in technology, innovation, or branding-intensive sectors must comply with Kenya’s intellectual property (IP) framework, which includes the Industrial Property Act, the Trademarks Act, and the Copyright Act. These laws protect patents, trademarks, and copyrights, ensuring that proprietary technology, brand identities, or creative works used in a JV are safeguarded. For instance, a JV developing software or renewable energy technology must register patents with the Kenya Industrial Property Institute (KIPI) to prevent unauthorized use. The proposed establishment of the Intellectual Property Office of Kenya (IPOK) aims to streamline IP registration, enforcement, and dispute resolution, enhancing Kenya’s attractiveness for technology-driven JVs. Partners should include clear IP ownership and licensing clauses in JV agreements to avoid disputes over proprietary assets, particularly in industries where IP is a core value driver.
- Data Protection Regulations
The Data Protection Act, 2019, regulates the collection, storage, processing, and transfer of personal data, a critical consideration for JVs in technology, e-commerce, or data-driven sectors such as fintech or health-tech. The act mandates that data controllers and processors implement safeguards to protect personal data, particularly for cross-border data transfers, which are common in IJVs. For example, a JV operating a cloud-based platform must comply with data localization requirements and obtain consent for data processing. The Office of the Data Protection Commissioner oversees compliance, with penalties for violations including fines of up to Kshs 5.0 mn or imprisonment. JVs must conduct data protection impact assessments (DPIAs) and appoint data protection officers where necessary to ensure adherence to the act, especially in sectors handling sensitive customer information.
To successfully navigate Kenya’s legal and regulatory landscape, JV partners should undertake thorough due diligence, engage legal and financial advisors, and draft comprehensive agreements addressing governance, profit-sharing, dispute resolution, and exit mechanisms. Cultural and operational alignment between partners, particularly in IJVs, is also critical to mitigate misunderstandings and ensure long-term success. Regular compliance audits and engagement with regulatory bodies such as the CAK, EPRA, or KIPI can help JVs stay ahead of evolving requirements.
By adhering to this robust framework, JVs in Kenya can operate effectively, contribute to economic growth, and leverage opportunities in one of East Africa’s most dynamic markets. For further details on specific regulations or compliance, stakeholders are encouraged to consult relevant authorities or legal experts to ensure full adherence to Kenya’s legal standards.
Section II. Risks and Challenges of Joint Ventures in Kenya
While JVs offer significant benefits, they also come with challenges that require careful management:
- Cultural and management differences: Divergent corporate cultures or management styles can lead to misaligned expectations and poor cooperation. For instance, international partners may face challenges adapting to Kenyan business practices.
- Regulatory complexity: Navigating Kenya’s legal and industry-specific regulations requires thorough due diligence and legal expertise to avoid non-compliance penalties.
- Unequal Contributions: Imbalanced resource or decision-making contributions can create tensions, threatening the venture’s success.
- Exit strategy risks: Without clear exit mechanisms, dissolving a JV can lead to disputes, legal battles, or financial losses. Common exit strategies include selling the JV, spinning off operations, or employee ownership.
- Competition law risks: JVs between competitors may raise concerns about collusion or market dominance, requiring careful structuring to comply with the Competition Act.
- Due diligence failures: Inadequate vetting of partners’ financial stability, reputation, or legal history can lead to unreliable collaborations.
- Data and IP risks: Mismanagement of intellectual property or data can lead to disputes or regulatory penalties, particularly in tech-driven JVs.
Section III. Best Practices for Successful Joint Ventures in Kenya
Real estate joint ventures (JVs) in Kenya offer significant opportunities to pool resources, share risks, and capitalize on the country’s growing property market, which includes residential, commercial, and mixed-use developments. However, the complexity of real estate projects, coupled with Kenya’s robust legal and regulatory framework, requires careful planning and execution. To maximize the potential of real estate JVs while minimizing risks, developers, investors, and partners should adopt the following best practices tailored to the sector:
- Conduct Thorough Due Diligence- In real estate JVs, thorough due diligence is critical to ensuring the reliability and suitability of partners and the viability of the project. Partners should rigorously assess each other’s financial health, including liquidity, credit history, and funding capacity, to confirm their ability to contribute capital or secure financing for the project. For example, a developer partnering with a foreign investor for a high-rise residential project in Nairobi should verify the investor’s financial stability and track record in similar ventures. Additionally, due diligence should include a comprehensive review of the partner’s reputation, past real estate projects, and any legal disputes, particularly those related to land ownership or zoning violations. Land due diligence is equally vital—partners must verify land titles, confirm ownership through the National Land Commission, and ensure compliance with zoning regulations and land use policies under the Physical and Land Use Planning Act, 2019. Engaging a reputable surveyor and conducting Environmental Impact Assessments (EIAs) as required by the Environmental Management and Coordination Act (EMCA) can prevent costly legal or environmental disputes later. Failure to conduct thorough due diligence can lead to project delays, financial losses, or litigation, particularly in a market where land fraud and title disputes are prevalent.
- Align Objectives and Cultures- Successful real estate JVs depend on partners sharing clear, aligned objectives and compatible organizational cultures. In the context of real estate, this means agreeing on the project’s scope, target market, timeline, and financial goals—whether it’s developing affordable housing, luxury apartments, or commercial office spaces. For instance, a JV between a local developer and an international real estate fund must align on whether the project prioritizes rapid returns through quick sales or long-term revenue via rental income. Cultural alignment is equally important, as differences in management styles or decision-making approaches can derail projects. A Kenyan developer accustomed to flexible timelines may clash with a foreign partner expecting strict adherence to schedules. To foster collaboration, partners should hold pre-JV workshops to define shared values, establish project milestones, and agree on risk tolerance. For example, a JV developing a mixed-use estate in Kiambu County should align on sustainability goals, such as incorporating green building standards, to ensure both parties are committed to the same vision. Clear alignment reduces misunderstandings and enhances project efficiency.
- Engage Legal Expertise-Real estate JVs in Kenya operate within a complex legal framework, including the Companies Act, 2015, the Land Act, 2012, and the Environmental Management and Coordination Act (EMCA). Engaging experienced legal firms, is essential to draft robust Joint Venture Agreements (JVAs) that comply with Kenyan laws and protect all parties. Legal experts can ensure the JVA addresses critical real estate-specific issues, such as land acquisition, permitting, and compliance with the 30% local ownership requirement for certain sectors (e.g., if the JV includes a telecommunications component for smart buildings). For example, a JVA for a commercial real estate JV in Mombasa should include clauses on profit-sharing, land lease terms, and dispute resolution mechanisms tailored to coastal land laws. Lawyers can also navigate the regulatory requirements of the National Construction Authority (NCA) and county governments, ensuring permits for construction, water, and electricity are secured. By investing in legal expertise upfront, partners can avoid costly oversights, such as failing to register the JV entity with the Registrar of Companies or neglecting to file beneficial ownership details.
- Establish Clear Governance-Clear governance structures are vital to prevent conflicts and ensure smooth decision-making in real estate JVs. The JVA should define roles, responsibilities, and decision-making processes, particularly for critical areas such as project financing, contractor selection, and marketing strategies. For instance, in a JV developing a gated community in Karen, one partner may oversee construction while the other handles sales and marketing, with clear protocols for approving budgets or design changes. Governance frameworks should also include mechanisms for resolving deadlocks, such as appointing an independent mediator or using weighted voting based on equity contributions. Regular board or committee meetings should be scheduled to monitor project progress, ensure compliance with timelines, and address issues like delays in material procurement or labor disputes. In real estate, where projects often span several years, transparent governance ensures accountability and keeps the JV on track to meet milestones, such as completing a retail complex before the peak leasing season.
- Plan for Exit- Real estate JVs must include well-defined exit strategies in the JVA to manage dissolution, restructuring, or partner withdrawal without disrupting the project. Exit clauses should address scenarios such as a partner’s failure to meet funding obligations, changes in market conditions, or completion of the project. For example, a JV developing a shopping mall in Eldoret might include buyout provisions, allowing one partner to purchase the other’s stake at a pre-agreed valuation if the partnership dissolves. Alternatively, the JVA could stipulate that the completed property be sold, with profits distributed based on equity contributions. In cases where one partner wishes to exit mid-project, the agreement should outline processes for transferring shares or responsibilities to avoid delays in construction or financing. Including dispute resolution mechanisms, such as arbitration under the Arbitration Act, 1995, can ensure smooth exits. Planning for exit strategies upfront provides clarity and protects partners’ interests, particularly in volatile real estate markets where economic or regulatory shifts can impact project viability.
- Monitor Regulatory Compliance- The real estate sector in Kenya is subject to a dynamic regulatory environment, requiring JVs to stay vigilant about compliance with national and county-level laws. Key regulations include the Land Registration Act, 2012, for title transfers; the National Construction Authority Act for contractor licensing; and the EMCA for environmental compliance. For instance, a JV developing a high-rise in Westlands must secure an EIA license and comply with Nairobi County’s zoning regulations to avoid penalties or project suspension. Additionally, real estate JVs handling customer data, such as tenant or buyer information for a residential estate, must comply with the Data Protection Act, 2019, to safeguard personal data and avoid fines of up to Kshs 5 mn. Partners should appoint a compliance officer to monitor changes in laws, such as amendments to the Public Benefit Organizations (PBO) Act, which may affect JVs with non-profit components, or updates to county property taxes. Regular audits and engagement with regulatory bodies like the National Environment Management Authority (NEMA) or the Kenya Revenue Authority (KRA) ensure the JV remains compliant throughout the project lifecycle.
- Foster Open Communication-Effective communication is the backbone of successful real estate JVs, particularly given the long timelines and multiple stakeholders involved in property development. Partners should establish regular check-ins, such as monthly progress meetings or site visits, to review construction milestones, budget adherence, and market trends. For example, a JV developing a commercial park in Thika should maintain transparent dialogue about contractor performance, material costs, and leasing progress to address issues like supply chain delays or cost overruns early. Digital tools, such as project management software, can facilitate real-time updates and document sharing, ensuring all partners are aligned. In international JVs, where cultural or time zone differences may arise, clear communication protocols—such as agreed response times or designated points of contact—are essential. Transparent dialogue fosters trust, mitigates misunderstandings, and ensures the JV can adapt to challenges, such as shifts in demand for office spaces due to remote working trends.
Section IV. Examples of successful JV partnerships in Real Estate in Kenya
Kenya’s real estate sector has seen a surge in joint ventures, driven by high demand for housing and commercial properties, coupled with rising land prices and capital constraints. Below are some of the prominent JV partnership projects delivered in the Kenyan Real Estate sector.
- The Amara Ridge residential project in Karen, Nairobi, developed by Cytonn Real Estate, the development arm of Cytonn Investments, is a standout example of a successful joint venture (JV) in Kenya’s real estate sector. This luxurious gated community, completed and handed over to homeowners, showcases how JVs can leverage partnerships to deliver high-end residential developments. The project was a collaboration between Cytonn Investments, and a landowner, combining local market expertise and land assets, to create a premium product.
- The Suraya Housing Project along Kiambu Road in Nairobi. This JV between Suraya Property Group and a landowner leveraged the developer’s expertise and financing to transform prime land into a mixed-use development featuring residential apartments and commercial spaces. The project’s success lies in its strategic location, robust governance structure, and clear profit-sharing agreement, delivering high returns through sales and rentals while addressing Nairobi’s housing deficit.
- Another notable JV is the Everest Park development in Athi River, a partnership between a local landowner and Acorn Holdings, a developer focused on affordable housing. This collaboration utilized the landowner’s strategically located parcel and Acorn’s financing and development expertise to create a gated community with affordable units. The project benefited from government incentives, such as a 15% corporate tax relief for developers building over 100 low-cost units, and achieved strong sales due to its proximity to industrial zones and infrastructure like the Nairobi-Mombasa Highway.
- The Snow Drop Project in Upper Hill, Nairobi, exemplifies a high-end commercial JV. A landowner partnered with a developer and equity investors to construct a modern office complex catering to multinational corporations. The project’s success stemmed from thorough due diligence, ensuring a clean land title, and a well-drafted JV agreement that outlined decision-making and exit strategies, minimizing conflicts. The development capitalized on Upper Hill’s status as a business hub, yielding significant rental income.
- Additionally, the Mavoko Affordable Housing Project under the government’s Big Four Agenda showcases a public-private partnership (PPP). The State collaborated with 35 private developers, including local firms like Jabavu Village, to build low-cost housing units. This JV leveraged government-provided land and private sector financing, with developers benefiting from tax incentives and streamlined approvals, delivering thousands of units to address urban housing needs.
Section V. Conclusion
Joint ventures (JVs) in Kenya’s real estate sector present a dynamic opportunity for local and international partners to collaborate, leveraging the country’s vibrant economy, strategic position, and investor-friendly policies to drive growth and innovation. By pooling resources, sharing risks, and combining expertise, real estate JVs enable stakeholders to deliver impactful projects, from affordable housing to commercial complexes, that contribute to Kenya’s urban development and economic progress. However, success hinges on navigating the robust legal and regulatory framework, including the Companies Act, 2015, the Partnerships Act, 2012, and industry-specific regulations like the Land Act, 2012, and the Environmental Management and Coordination Act (EMCA).
The risks and challenges—ranging from cultural misalignments and regulatory complexities to land disputes and data protection concerns—require careful management through thorough due diligence, clear governance, and strategic planning. By adopting best practices such as aligning objectives, engaging legal expertise, and fostering open communication, JV partners can mitigate these risks and build resilient collaborations. Case studies, such as successful real estate developments in Nairobi and Mombasa, demonstrate the transformative potential of well-structured JVs when executed with precision and foresight.
Ultimately, real estate JVs in Kenya offer a pathway to capitalize on one of East Africa’s most promising markets. By adhering to legal requirements, prioritizing transparency, and fostering strong partnerships, stakeholders can unlock sustainable value, address market demands, and contribute to Kenya’s vision of inclusive economic growth. For those embarking on this journey, consulting with legal, financial, and real estate experts is essential to ensure compliance, optimize outcomes, and position JVs for long-term success in Kenya’s dynamic real estate landscape.
Disclaimer: The views expressed in this publication are those of the writers where particulars are not warranted. This publication, which is in compliance with Section 2 of the Capital Markets Authority Act Cap 485A, is meant for general information only and is not a warranty, representation, advice, or solicitation of any nature. Readers are advised in all circumstances to seek the advice of a registered investment advisor.

- Talk to us
- Kenya
- P.O Box 20695 - 00200, Nairobi, Kenya
- Cell +254709101200
- Tel +254709101200
- WhatsApp +254741676635
- United States
- +254709101200
- DOWNLOAD OUR APP
-


- Kenya
- 8th Floor, Pinetree Plaza, Kaburu Drive, Ngong Road, Nairobi, Kenya
- USA
- Suite 1150, 1775 Eye Street NW, USA, Washington DC 20006, USA
- Investments
- High Yield
- Private Equity
- Real Estate
- Real Estate
- RiverRun Estates
- Cytonn Towers
- The Ridge
- Taraji Heights
- The Alma