Understanding Retirement Benefits Schemes in Kenya & Cytonn Weekly #19/2019
By Cytonn Research Team, May 12, 2019
Executive Summary
Fixed Income
T-bills remained undersubscribed during the week, with the overall subscription rate increasing to 57.9% from 49.0%, recorded the previous week. The under-subscription is attributable to tight liquidity in the market partly due to tax payments, coupled with the close of the 5-year and 15-year primary bond sale during the week. The yields on the 91-day, 182-day and 364-day papers declined by 5.4 bps, 6.1 bps and 0.4 bps to 7.2%, 7.9% and 9.3%, respectively. The newly issued bonds for the month of May, issue numbers (FXD 2/2019/5) and (FXD 2/2019/15) with 5-years and 15-years tenors were oversubscribed, with the performance rate coming in at 141.7%. The accepted yields for the 5-year and 15-year bonds came in at 10.9% and 12.7% in line with our expectations of 10.8% - 11.0% and 12.5% - 12.7% for the 5-year and 15-year bonds, respectively. According to Stanbic Bank’s monthly PMI report released during the week, Kenya’s business conditions deteriorated for the first time since November 2017, recording a decline to 49.3 in April from 51.0 recorded in March. Readings above 50.0 signal an improvement in business conditions, while readings below 50.0 show a deterioration;
Equities
During the week, the equities market was on a downward trend with NASI, NSE 20 and NSE 25 declining by 4.3%, 1.5% and 4.1%, respectively, taking their YTD performance to gains of 9.0%, (2.7%) and 6.4%, for NASI, NSE 20 and NSE 25, respectively. Equity Group released their Q1’2019 results with core earnings per share growing by 4.9% to Kshs 1.64 from Kshs 1.56 in Q1’2018. Stanbic Bank released their Q1’2019 financial results with profit after tax rising by 19.3% to Kshs 2.3 bn from Kshs 1.9 bn in Q1’2018;
Private Equity
International Finance Corporation (IFC) announced plans to invest USD 50.0 mn (Kshs 5.1 bn) in private equity firm, Helios Investment Partners, with the funds to be directed towards Helios investments across Africa, with each transaction estimated to have a ticket size ranging between USD 30.0 mn (Kshs 3.0 bn) and USD 200.0 mn (Kshs 20.2 bn). I&M Burbidge, in their recently released report, East Africa Financial Review, highlighted the deal activity in the East African region for Q1 2019. According to the report, there were a total of 22 deals in this period, with 10 of these being private equity investments, 3 private equity exits, 2 joint ventures and 7 mergers and acquisitions, an improvement from a similar period in 2018, where there were only 16 deals reported;
Real Estate
During the week, Shelter Afrique, a Pan-African Development Finance Institution owned by 44 African governments and African Development Bank, announced plans to invest Kshs 200.0 mn into Kenya’s Mortgage Refinancing Company, KMRC, signalling continued momentum for the liquidity facility’s operationalization. This follows World Bank’s approval for Kshs 25.0 bn geared towards Kenya Affordable Housing Financing Project (KAHFP) in the previous week – the funding includes an unspecified allocation to KMRC, and Cooperative Bank’s pledge in 2018 to inject Kshs 200.0 mn into the Company;
Focus of the Week
The role of Retirement Benefits Schemes in the economy is the provision of retirement income and serves as a means of replacing an individual’s regular income during his working life in the retirement years. It provides regular income to the retired worker or his beneficiaries in the event of death. In this report, we will look at the general background and the drivers of change in the Retirement Benefits Industry in Kenya. We shall also delve deeper into the Kenya Retirement Benefits Sector, as well as give our view on the updates and trends and their expected impact on the sector, and how the sector can be further improved going forward.
- Ian Kagiri – Investments Analyst at Cytonn was on CNBC to discuss corporate governance in companies listed at the NSE. Watch the interview here
- On 9th May 2019, Cytonn Asset Managers Limited (CAML), the regulated affiliate of Cytonn Investments Management Plc, held a Sacco’s Training at their offices at The Chancery. The training aimed at educating Sacco officials on ways that they could maximize returns for their members. Read Event Note here
- Cytonn Investments hosted its Independent and Tied Real Estate Financial Advisors (REFAs) to an Award Ceremony to celebrate milestones achieved by the team in Q1’2019. The quarterly event, which seeks to recognize REFAs who have demonstrated exemplary performance, saw winners awarded in 6 categories. Read Event Note here
- Following the recent approval by Retirement Benefits Authority (RBA), for Cytonn Asset Managers to manage pension funds, we are looking for business development consultants and agents with networks in the pensions industry to build our pensions business at very attractive commissions. If interested in being an agent or know someone who can be an agent, kindly contact us at pensions@cytonn.com;
- Following the completion and handover of Amara Ridge in Karen, we have now launched our next Karen project, dubbed Applewood, a Kshs 2.5 bn residential development located in Miotoni, Karen. This signature development shall comprise luxury homes, each sitting on 1/2 acre. We invite you to the exhibition of Applewood which is ongoing at the Amara Ridge Clubhouse (Location pin: https://goo.gl/maps/B3GVnu8pHyn) or at the Applewood Sales Centre on Miotoni Road (Location pin: https://goo.gl/maps/ZfABuGjFo1z) from 9:00 am to 5:00 pm daily. Call 0709 101 000 or email resales@cytonn.com to reserve a villa! See Video here;
- We continue to hold weekly workshops and site visits on how to build wealth through real estate investments. The weekly workshops and site visits target both investors looking to invest in real estate directly and those interested in high yield investment products to familiarize themselves with how we support our high yields. Watch progress videos and pictures of The Alma, Amara Ridge, and The Ridge;
- We continue to see very strong interest in our weekly Private Wealth Management Training (largely covering financial planning and structured products). The training is at no cost and is open only to pre-screened participants. We also continue to see institutions and investment groups interested in the training for their teams. Cytonn Foundation, under its financial literacy pillar, runs the Wealth Management Training. If interested in our Private Wealth Management Training for your employees or investment group, please get in touch with us through wmt@cytonn.com. To view the Wealth Management Training topics, click here;
- For recent news about the company, see our news section here;
- We have 10 investment-ready projects, offering attractive development and buyer targeted returns. See further details here: Summary of Investment-Ready Projects;
T-Bills & T-Bonds Primary Auction:
T-bills remained undersubscribed during the week, with the overall subscription rate increasing to 57.9% from 49.0%, recorded the previous week. The under-subscription is attributable to tight liquidity in the market partly due to tax payments, coupled with the close of the 5-year and 15-year primary bond sale during the week. The yields on the 91-day, 182-day and 364-day papers declined by 5.4 bps, 6.1 bps and 0.4 bps to 7.2%, 7.9% and 9.3%, respectively. The acceptance rate declined slightly to 99.9% from 100.0% recorded the previous week, with the government accepting Kshs 13.88 bn of the Kshs 13.89 bn worth of bids received.
The newly issued bonds for the month of May, issue numbers (FXD 2/2019/5) and (FXD 2/2019/15) with 5-year and 15-year tenors were oversubscribed, with the performance rate coming in at 141.7%. The market maintained a bias towards the 5-year bond that generated total bids of Kshs 39.2 bn as investors continue to avoid the longer-tenor bond driven by the perception that risks may not be adequately priced on the longer end of the yield curve, which is relatively flat due to saturation of long-term bonds, coupled with the duration risk associated with longer-term papers. The accepted yields for the 5-year and 15-year bonds came in at 10.9% and 12.7% in line with our expectations of 10.8% - 11.0% and 12.5% - 12.7% for the 5-year and 15-year bonds, respectively.
Liquidity:
During the week, the average interbank rate rose to 6.4%, from 6.0% the previous week, pointing to tightened liquidity conditions in the money market as banks were mobilizing funds to pay for tax remittances with PAYE due on 9th of May. The average volumes traded in the interbank market also rose by 4.2% to Kshs 13.6 bn, from Kshs 13.0 bn the previous week.
Kenya Eurobonds:
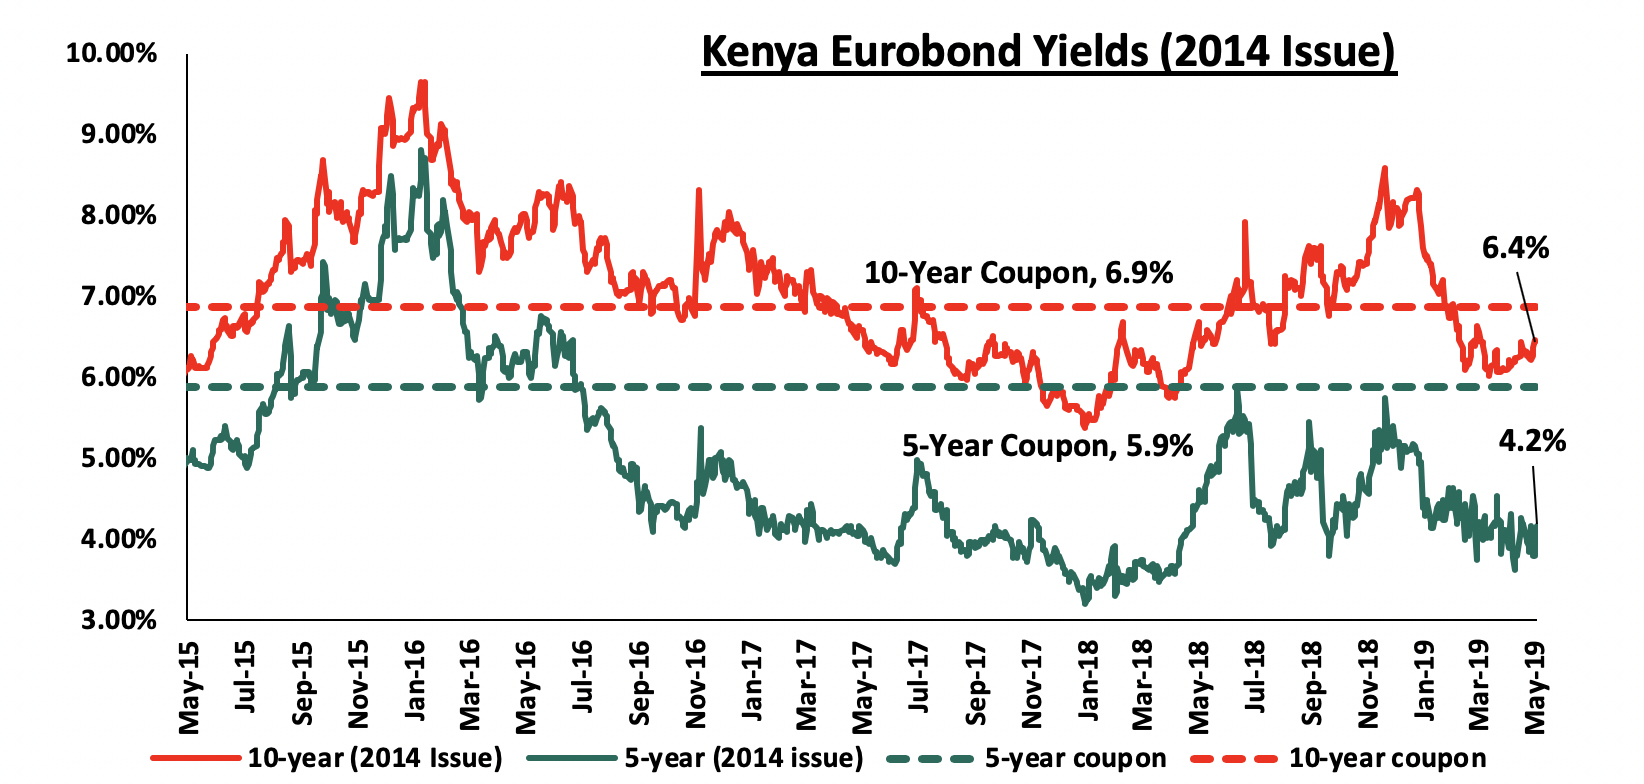
According to Bloomberg, the yield on the 10-year Eurobond issued in 2014 rose by 0.2% points to 6.4% from 6.2% the previous week, while that of the 5-year remained unchanged at 4.2%. The continued rise is partly attributable to increased risk perception due to the downgrading of Kenya’s 2019 growth prospects. Key to note is that these bonds have 1.4 months and 5.1-years to maturity for the 5-year and 10-year, respectively.
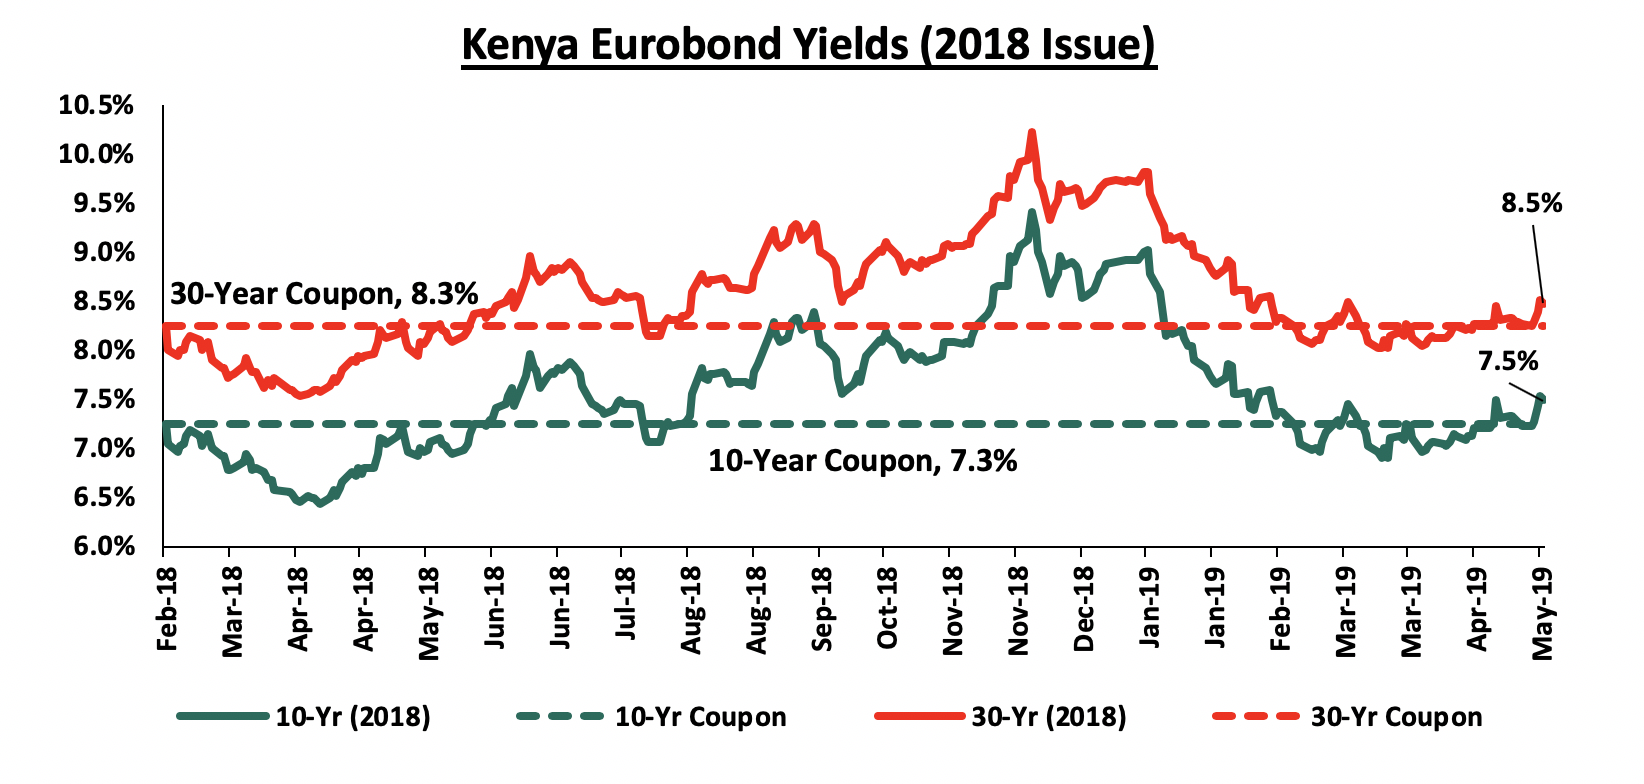
For the February 2018 Eurobond issue, yields on the 10-year Eurobond rose by 0.2% points to 7.5% from 7.3%, recorded the previous week while the yield on the 30-year Eurobond rose by 0.3% points to 8.5% from 8.2%, recorded the previous week. Since the issue date, the yields on both the 10-year Eurobond and 30-year Eurobond have increased by 0.2% points.
The Kenya Shilling:
During the week, the Kenya Shilling remained stable against the US Dollar to close at Kshs 101.1, unchanged from the previous week, supported by inflows from investors buying government securities that matched dollar demand from merchandise importers. The Kenya Shilling has appreciated by 0.7% year to date in addition to 1.3% in 2018, and in our view, the shilling should remain relatively stable to the dollar in the short term, supported by:
- The narrowing of the current account deficit with preliminary data on balance of payments indicating continued narrowing to 4.5% of GDP in the 12 months to March 2019, from 5.5% in the 12 months to March 2018. The decline has been supported by resilient horticultural exports, strong diaspora remittances and improved transport service receipts,
- Improving diaspora remittances, which increased cumulatively by 3.8% in the first 3 months of 2019 to USD 665.6 mn from USD 641.5 mn recorded in a similar period of review in 2018. The rise is due to:
- Increased uptake of financial products by the diaspora due to financial services firms, particularly banks, targeting the diaspora, and,
- New partnerships between international money remittance providers and local commercial banks making the process more convenient,
- CBK’s supportive activities in the money market, such as repurchase agreements and selling of dollars, and,
- High levels of forex reserves, currently at USD 8.1 bn (equivalent to 5.2-months of import cover), above the statutory requirement of maintaining at least 4-months of import cover, and the EAC region’s convergence criteria of 4.5-months of import cover.
Highlight of the Week:
According to Stanbic Bank’s monthly PMI report released during the week, Kenya’s business conditions deteriorated for the first time since November 2017 recording a decline to 49.3 in April from 51.0 recorded in March. Readings above 50.0 signal an improvement in business conditions, while readings below 50.0 show a deterioration. The deterioration was driven by the poor weather conditions following the late onset of the traditional long rains season coupled with intensifying cash flow issues as cited by many firms partly due to arrears owed to the private sector by the Government. Private sector sales remained broadly unchanged despite a decline in local orders as this was mitigated by a rise in new export orders. Input prices rose during the month as a consequence of the delayed long rains, which inflated commodity prices. Despite the rise in input costs, output charges recorded a decline as firms looked for new customers to address the slowdown in sales growth. Going forward, we expect business activity to remain in contraction in the short term given the delay in the long rains that has seen commodity and food prices rise as evidenced by the rise in April’s inflation to 6.6% from 4.4% recorded in March, coupled with the rise in fuel prices. The delayed rains have also adversely affected the performance of the country’s key exports with the value of tea exported recording a decline as the reduced production was not accompanied by a proportionate rise in prices as the supply has substantially increased globally. With the start of the long rains however, we expect the conditions to gradually improve in the medium term as the year progresses.
Rates in the fixed income market have remained relatively stable as the government rejects expensive bids as they are currently 26.6% ahead of its domestic borrowing target for the current financial year, having borrowed Kshs 347.4 bn against a pro-rated target of Kshs 274.3 bn. A budget deficit is likely to result from depressed revenue collection, creating uncertainty in the interest rate environment as additional borrowing from the domestic market goes to plug the deficit. Despite this, we do not expect upward pressure on interest rates due to increased demand for government securities, driven by improved liquidity in the market owing to the relatively high debt maturities. Our view is that investors should be biased towards medium-term fixed income instruments to reduce duration risk associated with long-term debt, coupled with the relatively flat yield curve on the long-end due to saturation of long-term bonds.
Market Performance:
During the week, the equities market was on a downward trend with NASI, NSE 20 and NSE 25 declining by 4.3%, 1.5% and 4.1%, respectively, taking their YTD performance to gains of 9.0%, (2.7%) and 6.4%, for NASI, NSE 20 and NSE 25, respectively. The performance in NASI was driven by declines in large cap stocks such as Equity Group, NIC Group, EABL and Safaricom, which declined by 6.8%, 6.7%, 4.5%, and 4.5%, respectively. The declines over the last two weeks were largely due to several counters having their book closures and thus begun trading ex-dividend.
Equities turnover declined by 18.3% during the week to USD 18.4 mn, from USD 22.5 mn the previous week, taking the YTD turnover to USD 572.3 mn. Foreign investors turned net sellers for the week, with a net selling position of USD 0.5 mn, from a net buying position of USD 1.9 mn.
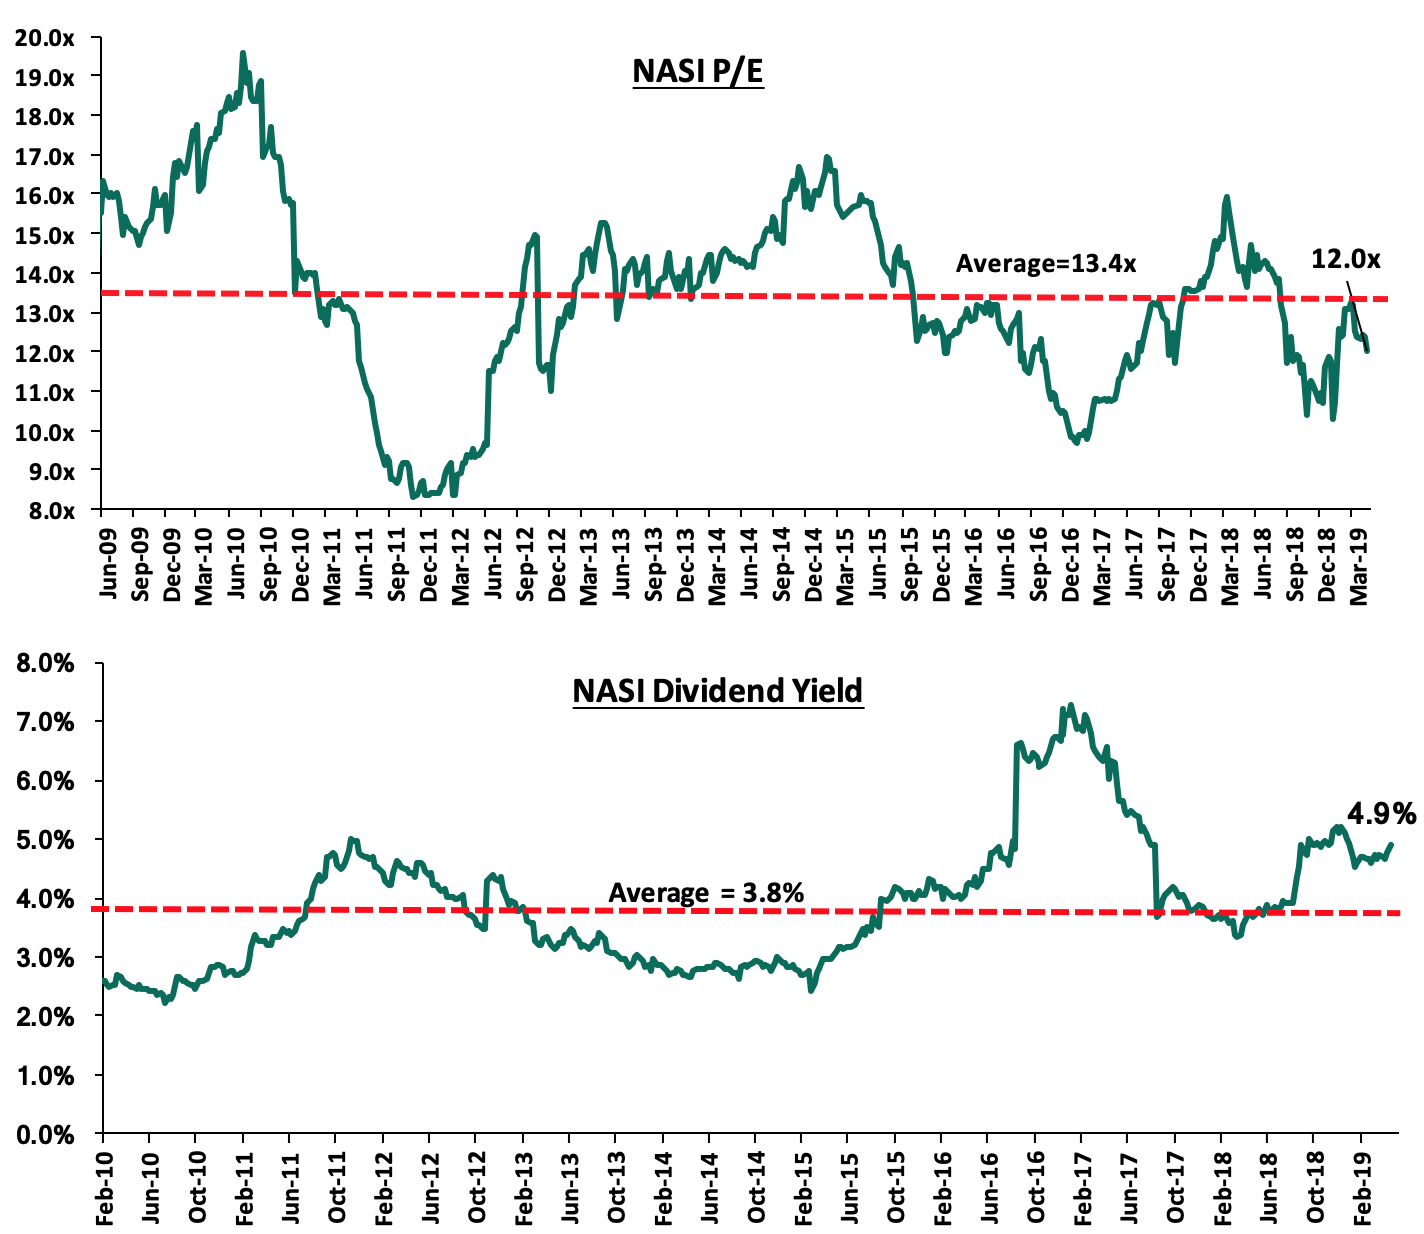
The market is currently trading at a price to earnings ratio (P/E) of 12.0x, 10.3% below the historical average of 13.4x, and a dividend yield of 4.9%, above the historical average of 3.8%. With the market trading at valuations below the historical average, we believe there is value in the market. The current P/E valuation of 12.0x is 23.6% above the most recent trough valuation of 9.7x experienced in the first week of February 2017, and 44.5% above the previous trough valuation of 8.3x experienced in December 2011. The charts below indicate the historical P/E and dividend yields of the market.
Earnings Releases
Equity Group released its Q1’2019 financial results:
Equity Group released its financial results with core earnings per share increasing by 4.9% to Kshs 1.64, from Kshs 1.56 in Q1’2018, faster than our projections of a 0.7% increase to Kshs 1.58. The performance was driven by a 6.6% increase in total operating income, despite a faster 7.0% increase in total operating expenses. The variance in core earnings per share growth against our expectations was largely due to a slower 7.0% rise in total operating expenses to Kshs 8.8 bn, from Kshs 8.2 bn in Q1’2018, which was not in line with our expectation of a 13.2% increase to Kshs 9.3 bn. Highlights of the performance from Q1’2018 to Q1’2019 include:
- Total operating income increased by 6.6% to Kshs 17.6 bn, from Kshs 16.5 bn in Q1’2018. This was driven by a 6.3% increase in Net Interest Income (NII) to Kshs 10.4 bn, from Kshs 9.8 bn in Q1’2018, coupled with a 6.9% increase in Non-Funded Income (NFI) to Kshs 7.2 bn, from Kshs 6.7 bn in Q1’2018,
- Interest income increased by 6.5% to Kshs 13.5 bn from Kshs 12.7 bn in Q1’2018. This was driven by an 11.9% growth in interest income from government securities to Kshs 4.1 bn, from Kshs 3.7 bn in Q1’2018, coupled with a 3.5% increase in interest income from loans to Kshs 9.1 bn from Kshs 8.8 bn in Q1’2018, and the 47.0% increase in interest income from placement assets to Kshs 0.3 bn from Kshs 0.2 bn in Q1’2018. The yield on interest-earning assets however declined to 11.1%, from 11.3% in Q1’2018, attributed to a decline in yields on government securities as well as a decline in lending rates due to the two Central Bank Rate (CBR) cuts in 2018,
- Interest expense rose by 7.4% to Kshs 3.1 bn, from Kshs 2.9 bn in Q1’2018, largely due to the 6.7% increase in the interest expense on customer deposits to Kshs 2.5 bn from Kshs 2.4 bn in Q1’2018, coupled with a 112.8% increase in interest expense on placements to Kshs 0.2 bn from Kshs 0.1 bn in Q1’2018. However, other interest expenses declined by 8.1% to Kshs 0.38 bn from Kshs 0.41 bn in Q1’2018. The cost of funds, however, declined to 2.6%, from 2.7% in Q1’2018, owing to a faster increase in interest bearing liabilities that rose by 12.0% to Kshs 483.2 bn from Kshs 431.4 bn in Q1’2018. Consequently, the Net Interest Margin (NIM) declined to 8.6%, from 8.8% in Q1’2018,
- Non-Funded Income rose by 6.9% to Kshs 7.2 bn from Kshs 6.7 bn in Q1’2018. The increase was mainly driven by the 7.9% increase in other fees and commissions to Kshs 3.4 bn, from Kshs 3.2 bn in Q1’2018, which management attributed to the monetization of the firm’s alternative transaction channels. The improvement in NFI was also supported by the 21.7% growth in forex trading income to Kshs 0.8 bn, from Kshs 0.7 bn in Q1’2018, with management noting that this income segment benefitted from increased remittances from the diaspora and a 12.2% growth in other income to Kshs 1.6 bn from Kshs 1.4 bn in Q1’2018. The growth in NFI was however weighed down by the 6.8% decline in fees and commissions on loans to Kshs 1.4 bn from Kshs 1.5 bn in Q1’2018, which may be attributed to the implementation of the Effective Interest Rate (EIR) model under IFRS 9, which requires banks to amortize the fees and commissions on loans throughout the tenor of a loan. The revenue mix remained at 59:41 owing to the comparable increases in both NII and NFI,
- Total operating expenses rose by 7.0% to Kshs 8.8 bn, from Kshs 8.2 bn in Q1’2018, largely driven by a 14.3% increase in Loan Loss Provisions (LLP) to Kshs 0.41 bn from Kshs 0.36 bn in Q1’2018, coupled with a 9.6% increase in other operating expenses to Kshs 5.7 bn from Kshs 5.2 bn in Q1’2018. Staff costs rose marginally by 0.8% to Kshs 2.63 bn in Q1’2019 from Kshs 2.61 bn in Q1’2018,
- The Cost to Income Ratio (CIR) deteriorated marginally to 49.8%, from 49.6% in Q1’2018. Without LLP, the cost to income ratio remained flat at 47.5%,
- Profit before tax increased by 6.1% to Kshs 8.8 bn, up from Kshs 8.3 bn in Q1’2018. Profit after tax grew by 4.9% to Kshs 6.2 bn in Q1’2019, from Kshs 5.9 bn in Q1’2018, with the difference in growth attributable to the marginal increase in the effective tax rate to 29.4% from 29.1% in Q1’2018,
- The balance sheet recorded an expansion as total assets increased by 14.8% to Kshs 605.7 bn, from Kshs 527.8 bn in Q1’2018. Growth was supported by a 12.7% increase in the loan book to Kshs 305.5 bn, from Kshs 271.1 bn, coupled with a 13.0% increase in government securities to Kshs 169.7 bn from Kshs 150.2 bn in Q1’2018,
- Total liabilities rose by 14.5% to Kshs 510.2 bn from Kshs 445.7 bn in Q1’2018, driven by a 12.1% increase in customer deposits to Kshs 428.5 bn from Kshs 382.4 bn in Q1’2018. Deposits per branch increased by 12.1% to Kshs 1.5 bn from Kshs 1.4 bn in Q1’2018, as the number of branches remained unchanged,
- Borrowings rose by 12.5% to Kshs 51.0 bn from Kshs 45.3 bn in Q1’2018,
- The faster growth in loans as compared to the growth in deposits led to an increase in the loan to deposit ratio to 71.3% from 70.9% in Q1’2018,
- Gross Non-Performing Loans (NPLs) increased by 62.3% to Kshs 29.4 bn in Q1’2019, from Kshs 18.1 bn in Q1’2018. The NPL ratio thus deteriorated to 9.2% in Q1’2019 from 6.5% in Q1’2018. The deterioration in asset quality was largely attributed to various segments such as large enterprises, Small and Medium Enterprises (SMEs) and Agriculture, which had NPLs of 10.9%, 10.8% and 5.5%, respectively. The group’s Tanzania subsidiary contributed 31.6% of the NPLs, with South Sudan and Kenya contributing 12.6% and 8.5%, respectively. General Loan Loss Provisions increased by 60.6% to Kshs 10.0 bn, from Kshs 6.2 bn in Q1’2018. Thus, the NPL coverage deteriorated to 73.7% in Q1’2019 from 105.1% in Q1’2018,
- Shareholders’ funds increased by 15.1% to Kshs 94.5 bn in Q1’2019 from Kshs 82.1 bn in Q1’2018, supported by a 19.7% increase in retained earnings to Kshs 83.6 bn from Kshs 69.9 bn,
- Equity Group remains sufficiently capitalized with a core capital to risk-weighted assets ratio of 17.4%, 6.9% points above the statutory requirement. In addition, the total capital to risk-weighted assets ratio came in at 19.3%, exceeding the statutory requirement by 4.8% points. Adjusting for IFRS 9, the core capital to risk-weighted assets stood at 18.7%, while total capital to risk-weighted assets came in at 20.6%, and,
- The bank currently has a Return on Average Assets (ROaA) of 3.8%, and a Return on Average Equity (ROaE) of 22.8%.
Key Take-Outs:
- The bank’s geographical diversification strategy has continued to emerge as a net positive, with the bank’s various subsidiaries in Uganda, DRC, Rwanda, Tanzania, and South Sudan cumulatively contributing 18.0% of the bank’s total profitability and 26.0% of the group’s total asset base. Equity Group has entered into an agreement with Atlas Mara to acquire subsidiaries in Tanzania, Rwanda, Mozambique, and Zambia. If successful, the transaction should see the bank significantly increase its size to a proforma asset base of Kshs 724.0 bn, placing the bank in a position to leverage on economies of scale in the rollout of its digital platforms in the region. This is in line with the group’s strategy to attain a Kshs 1.0 tn asset base, and a maximum contribution of 30.0% of the total profitability by a single subsidiary,
- Increased innovation and digitization have seen 97.0% of all transactions of the bank being done on alternative channels, with mobile transactions taking up 77.0% of all transactions, and agency banking contributing 12.0% of all transactions. However, in terms of value of transactions, branches contributed 50.0% of the value of all transactions, with agency banking and mobile contributing 18.0% and 16.0% respectively. This highlights the transformation of branches to handle high value transactions. This transformation aids the bank in offering its ecosystem banking products to corporate and SME clients,
- The bank’s Non-Funded Income bucked its declining trend, growing by 6.9% y/y, largely aided by a recovery in transactional income, as management indicated that the bank was now monetizing its transactional channels. However, fees and commissions on loans segment continued its declining trend, which may be attributed to the implementation of the EIR model under IFRS 9. With the banks’ NFI contribution to total income currently at 38.5%, it is still way above the current industry average of 33.2%, and,
- The bank’s asset quality deteriorated, with the NPL ratio deteriorating to 9.2% from 6.5% in Q1’2018. The main sectors that contributed to the NPLs are large enterprises and SMEs. In terms of the regional view, the regions with the highest NPLs were Tanzania at 31.6% of their loan book, followed by South Sudan at 12.6% of their loan book. With the interest rate cap set to remain in place in Kenya, the bank has ramped up its loan disbursement to its customers in the region and will have to improve on its credit assessment in these markets in order to bring down the high NPL ratios in some of its regional subsidiaries.
See the Equity Group Q1'2019 Earnings note.
Stanbic Bank released its Q1’2019 financial results
Stanbic Bank released its Q1’2019 financial results with profit after tax increasing by 19.3% to Kshs 2.3 bn in Q1’2019, from Kshs 1.9 bn in Q1’2018. The performance was largely driven by an 18.5% increase in total operating income despite the 24.4% increase in the total operating expenses. Highlights of the performance from Q1’2018 to Q1’2019 include:
- Total operating income increased by 18.5% to Kshs 6.7 bn, from Kshs 5.7 bn in Q1’2018, driven by a 19.3% increase in Net Interest Income (NII) to Kshs 3.4 bn in Q1’2019, from Kshs 2.9 bn in Q1'2018, coupled with a 17.7% increase in Non-Funded Income to Kshs 3.3 bn, from Kshs 2.8 bn in Q1’2018,
- Interest income rose by 12.9% to Kshs 5.2 bn in Q1’2019, from Kshs 4.6 bn in Q1’2018. This was largely due to the 18.3% increase in interest income on loans and advances to Kshs 3.9 bn from Kshs 3.3 bn in Q1’ 2018, which outpaced the 9.1% decline in interest income on government securities to Kshs 1.1 bn from Kshs 1.2 bn in Q1’2018. The yield on interest-earning assets declined to 7.7% from 7.9% in Q1’2018, affected by the decline in yields on loans owing to the 100 bps reduction in the Central Bank Rate (CBR), and the decline in yields on government securities,
- Interest expense increased by 2.2% to Kshs 1.73 bn from Kshs 1.69 bn in Q1’2018, following a 10.9% increase in the interest expense on customer deposits to Kshs 1.2 bn from Kshs 1.1 bn in Q1’2018, as well as a 40.6% increase in other interest expense to Kshs 0.2 bn from Kshs 0.1 bn in Q1’2018. The increase in interest expenses was however mitigated by the 29.8% decline in interest expense on placement liabilities to Kshs 0.3 bn from Kshs 0.5 bn in Q1’2018. Cost of funds declined to 3.2%, from 3.3% in Q1’2018 owing to the faster 14.4% growth in an interest-bearing liabilities to Kshs 237.9 bn from Kshs 207.8 bn in Q1’2018. Consequently, the Net Interest Margin (NIM) declined to 4.9%, from 7.0% in Q1’2018,
- Non-Funded Income (NFI) increased by 17.7% to Kshs 3.3 bn from Kshs 2.8 bn in Q1’2018. The growth in NFI was driven by a 61.5% increase in total fees and commission income to Kshs 1.7 bn from Kshs 1.0 bn in Q1’2018, and an 85.2% increase in foreign exchange trading income to Kshs 1.5 bn in Q1’2019 from Kshs 0.8 bn in Q1’2018. The growth in NFI was however weighed down by the 87.0% decline in other income to Kshs 0.1 bn from Kshs 0.9 bn in Q1’2018. The revenue mix remained unchanged at 51:49 funded to non-funded income, owing to comparable increments in the bank’s NII and NFI,
- Total operating expenses rose by 24.4% to Kshs 3.5 bn from Kshs 2.9 bn in Q1’2018, largely driven by an 895.5% increase in the Loan Loss Provision (LLP) to Kshs 0.6 bn from Kshs 63.4 mn in Q1’2018, as the bank increased its provisioning owing to the 61.1% increase in Non-Performing Loans (NPLs). Other interest expenses rose by 16.0% to Kshs 1.5 bn from Kshs 1.3 bn in Q1’2018. The growth in expenses was however mitigated by the 5.3% decline in staff costs to Kshs 1.4 bn from Kshs 1.5 bn in Q1’2018,
- The Cost to Income Ratio (CIR) with LLP deteriorated to 53.0% in Q1’2019 from 50.5% in Q1’2018. Without LLP, the cost to income ratio improved to 43.6% in Q1’2019 from 49.4% in Q1’2018,
- Profit before tax and exceptional items increased by 12.6% and stood at Kshs 3.1 bn, up from Kshs 2.8 bn in Q1’2018. Profit after tax increased by 19.3% to Kshs 2.3 bn in Q1’2019 from Kshs 1.9 bn in Q1’2018,
- The balance sheet recorded an expansion as total assets increased by 14.4% to Kshs 284.9 bn, from Kshs 249.0 bn in Q1’2018. This growth was largely driven by a 12.6% increase in the loan book to Kshs 144.7 bn from Kshs 128.5 bn, and balances due from the Central Bank, which increased by 130.6% to stand at Kshs 15.0 bn from Kshs 6.5 bn in Q1’2018,
- Government securities recorded an 8.8% decline to Kshs 40.3 bn from 44.2 bn in Q1’2018,
- Total liabilities rose by 14.9% to Kshs 248.0 bn from Kshs 215.9 bn in Q1’2018, largely driven by a 29.0% increase in deposits to Kshs 190.6 bn, from Kshs 147.8 bn in Q1’2018, coupled with the 13.2% increase in other liabilities to Kshs 8.2 bn, from Kshs 7.2 bn in Q1’2018. The growth in liabilities was however weighed down by the 3.3% and 43.3% decline in borrowings and placement liabilities to Kshs 11.7 bn and Kshs 13.8 bn in Q1’2019 from Kshs 12.0 bn and Kshs 24.3 bn in Q1’2018, respectively,
- The faster increase in deposits as compared to the loans lead to the decrease in the loan to deposit ratio to 75.9% in Q1’2019 from 87.0% in Q1’2018. Government securities to deposits declined to 21.2% from 29.9 % in Q1'2018, Deposits per branch grew by 29.0% to Kshs 7.3 bn from Kshs 5.7 bn in Q1’2018,
- Gross non-performing loans increased by 61.1% to Kshs 16.7 bn from Kshs 10.4 bn in Q1’2018. Consequently, the NPL ratio deteriorated to 10.9% from 7.8% in Q1’2018. General Loan Loss Provisions (LLPs) increased by 88.2% to Kshs 6.2 bn from Kshs 3.3 bn in Q1’2018, and consequently the NPL coverage increased to 56.4% from 50.3% in Q1’2018,
- Shareholders’ funds increased by 11.5% to Kshs 36.8 bn in Q1’2019 from Kshs 33.0 bn in Q1’2018, largely due to the 12.7% increase in retained earnings to Kshs 28.4 bn from Kshs 25.2 bn in Q1’2018,
- Stanbic Bank is currently sufficiently capitalized with a core capital to risk weighted assets ratio of 15.5%, 5.0% points above the statutory requirement. In addition, the total capital to risk weighted assets ratio was 18.4%, exceeding the statutory requirement by 3.9% points. Adjusting for IFRS 9, core capital to risk weighted assets ratio was at 15.5% while total capital to risk weighted assets was 19.1%, indicating that the bank’s total capital relative to its risk-weighted assets declined by 0.7% points due to the implementation of IFRS 9.
Key take-outs
- The bank continued to record an improved performance, as the bank registered improvements across all its revenue lines. NII was largely aided by the increased interest income from loans and advances, as the bank begins to reap the benefits of an aggressive lending period when most lenders were shunning lending. NFI was also largely aided by the increased lending, which rung in additional fee income, and the forex trading income. The positive performance was however impacted by the increase in expenses, largely due to the rise in impairment expenses. With increased lending the bank, however, increased its exposure to credit risk, and the bank’s asset quality deteriorated. The bank may need to try and mitigate any further impairments, so as to contain the associated expenses.
See the Stanbic Bank Kenya Earnings note Q1'2019.
Weekly Highlights
During the week, Equity Group highlighted its plan to roll out lending focused especially on Micro, Small and Medium Enterprises (MSMEs), which operate in the agricultural, manufacturing and health sectors. The bank highlighted the plan to lend approximately Kshs 150.0 bn, with a majority of the funds expected to be sourced from the maturing investments in government securities. The move by Equity may be attributed to the reduction in yields on government securities, which compresses the bank’s net interest margin. Thus in a bid to mitigate the re-investment risk at lower yields, the bank opts to focus on MSME lending, allowed by the relatively wider margins after the removal of the requirement to pay 70.0% of the Central Bank Rate (CBR) as interest in deposits. We expect the bank’s recent partnership with Safaricom to likely aid the bank in obtaining a larger market, and consequently enable the bank in keeping a lid on costs incurred on disbursing the loans, leveraging on the digital distribution channels that have a wider reach. We, however, note that Equity Group’s asset quality has been deteriorating, and as such a de-risking of the bank’s loan portfolio is necessary, and therefore the adoption of robust credit scoring and assessment methods will be necessary, especially on new disbursement to avoid further deteriorations. We, however, expect the bank to benefit from increased lending by earning relatively higher interest income, and also additional fee and commission income.
Universe of Coverage
Below is a summary of our SSA universe of coverage:
|
Banks |
Price as at 3/05/2019 |
Price as at 10/05/2019 |
w/w change |
YTD Change |
Target Price* |
Dividend Yield |
Upside/Downside** |
P/TBv Multiple |
Recommendation |
|||||||||
|
Diamond Trust Bank |
121.5 |
122.0 |
0.4% |
(22.0%) |
241.5 |
2.1% |
100.1% |
0.6x |
Buy |
|||||||||
|
Zenith Bank |
21.0 |
20.0 |
(4.8%) |
(13.2%) |
33.3 |
13.5% |
80.1% |
0.9x |
Buy |
|||||||||
|
GCB Bank |
4.0 |
4.5 |
12.5% |
(2.2%) |
7.7 |
8.4% |
80.0% |
0.9x |
Buy |
|||||||||
|
UBA Bank |
6.7 |
6.5 |
(3.0%) |
(15.6%) |
10.7 |
13.1% |
77.7% |
0.4x |
Buy |
|||||||||
|
CRDB |
130.0 |
125.0 |
(3.8%) |
(16.7%) |
207.7 |
0.0% |
66.2% |
0.4x |
Buy |
|||||||||
|
NIC Group |
32.7 |
30.5 |
(6.7%) |
9.7% |
48.8 |
3.3% |
63.3% |
0.9x |
Buy |
|||||||||
|
CAL Bank |
0.9 |
0.9 |
(1.1%) |
(11.2%) |
1.4 |
0.0% |
60.9% |
0.7x |
Buy |
|||||||||
|
Ecobank |
6.7 |
6.7 |
0.0% |
(10.4%) |
10.7 |
0.0% |
59.7% |
1.5x |
Buy |
|||||||||
|
Co-operative Bank |
12.6 |
12.4 |
(1.2%) |
(13.3%) |
18.5 |
8.1% |
57.3% |
1.1x |
Buy |
|||||||||
|
KCB Group*** |
41.3 |
40.5 |
(1.9%) |
8.1% |
60.0 |
8.6% |
56.8% |
1.3x |
Buy |
|||||||||
|
Equity Group |
41.8 |
39.0 |
(6.8%) |
11.8% |
58.1 |
5.1% |
54.3% |
1.8x |
Buy |
|||||||||
|
I&M Holdings |
123.3 |
119.0 |
(3.4%) |
40.0% |
167.7 |
2.9% |
43.9% |
1.2x |
Buy |
|||||||||
|
Access Bank |
6.9 |
7.1 |
2.9% |
4.4% |
9.5 |
5.6% |
39.4% |
0.4x |
Buy |
|||||||||
|
Barclays Bank |
10.6 |
10.7 |
0.9% |
(2.7%) |
13.1 |
10.3% |
33.3% |
1.4x |
Buy |
|||||||||
|
Stanbic Bank Uganda |
29.0 |
30.0 |
3.4% |
(3.2%) |
36.3 |
3.9% |
24.8% |
2.1x |
Buy |
|||||||||
|
Guaranty Trust Bank |
33.5 |
32.0 |
(4.3%) |
(7.1%) |
37.1 |
7.5% |
23.4% |
2.1x |
Buy |
|||||||||
|
National Bank |
4.8 |
4.4 |
(9.6%) |
(18.2%) |
5.2 |
0.0% |
19.5% |
0.4x |
Accumulate |
|||||||||
|
Stanbic Holdings |
101.8 |
103.0 |
1.2% |
13.5% |
115.6 |
5.7% |
17.9% |
1.0x |
Accumulate |
|||||||||
|
SBM Holdings |
5.9 |
5.9 |
0.0% |
(1.3%) |
6.6 |
5.1% |
16.7% |
0.8x |
Accumulate |
|||||||||
|
Union Bank Plc |
7.1 |
7.0 |
(1.4%) |
25.0% |
8.2 |
0.0% |
16.4% |
0.7x |
Accumulate |
|||||||||
|
Bank of Kigali |
274.0 |
274.0 |
0.0% |
(8.7%) |
299.9 |
5.1% |
14.5% |
1.5x |
Accumulate |
|||||||||
|
Standard Chartered |
199.0 |
193.0 |
(3.0%) |
(0.8%) |
203.8 |
6.5% |
12.1% |
1.6x |
Accumulate |
|||||||||
|
Bank of Baroda |
129.0 |
129.0 |
0.0% |
(7.9%) |
130.6 |
1.9% |
3.2% |
1.1x |
Lighten |
|||||||||
|
Standard Chartered |
19.0 |
19.0 |
0.0% |
(9.5%) |
19.5 |
0.0% |
2.4% |
2.4x |
Lighten |
|||||||||
|
FBN Holdings |
7.4 |
7.3 |
(2.0%) |
(8.8%) |
6.6 |
3.4% |
(5.1%) |
0.4x |
Sell |
|||||||||
|
Ecobank Transnational |
10.8 |
10.3 |
(4.6%) |
(39.4%) |
9.3 |
0.0% |
(9.9%) |
0.4x |
Sell |
|||||||||
|
Stanbic IBTC Holdings |
43.5 |
46.0 |
5.7% |
(4.1%) |
37.0 |
1.3% |
(18.3%) |
2.2x |
Sell |
|||||||||
|
HF Group |
4.0 |
4.4 |
10.0% |
(20.6%) |
2.9 |
8.0% |
(26.1%) |
0.2x |
Sell |
|||||||||
|
*Target Price as per Cytonn Analyst estimates **Upside / (Downside) is adjusted for Dividend Yield ***Banks in which Cytonn and/or its affiliates holds a stake. ****Stock prices indicated in respective country currencies |
||||||||||||||||||
We are “Positive” on equities for investors as the sustained price declines have seen the market P/E decline to below its historical average. We expect increased market activity, and possibly increased inflows from foreign investors, as they take advantage of the attractive valuations, to support the positive performance.
During the week, International Finance Corporation (IFC) announced plans to invest USD 50.0 mn (Kshs 5.1 bn) in private equity firm, Helios Investment Partners, with the funds to be directed towards Helios investments across Africa. Each transaction is estimated to have a ticket size ranging between USD 30.0 mn (Kshs 3.0 bn) and USD 200.0 mn (Kshs 20.2 bn). This investment by IFC forms part of the USD 1.25 bn (Kshs 126.3 bn) that Helios is looking to raise in its fourth fund, Helios Investors IV L.P., which is set to close in September 2019, and is an extension of IFC’s continued partnership with Helios, with IFC having participated in various investments by Helios, with the previous being a Kshs 4.0 bn investment in a Kshs 7.4 bn deal by Helios and Acorn Group to build student housing in Nairobi. IFC had also invested USD 25.0 mn (Kshs 2.6 bn) in Helios Investors III L.P., USD 60.0 mn (Kshs 6.1 bn) in Helios Investors II L.P and USD 20.0 mn (Kshs 2.0 bn) in Helios Investors L.P.
Helios has made a number of transactions in Sub Saharan Africa, with their major focus being on acquiring and scaling businesses in key economic sectors in the countries where these businesses operate. One of the most notable investments from their previous USD 1.1 bn (Kshs 111.2 bn) fund, Helios Investors III L.P., was an undisclosed stake in ARM Pensions, a Nigerian fund manager with over USD 2.2 bn (Kshs 222.4 bn) in assets under management. We continue to see increased fundraising activity in Sub-Saharan Africa in the private equity sector, owing to the increasing investor interest which has in turn increased deal flow, with private equity firms looking to tap into opportunities in the region. We expect this trend to continue in 2019, given the drivers supporting private equity investments, such as (i) economic growth, with Sub-Saharan economic growth expected to come in at 3.4% in 2019, higher than 2.7% in 2018 according to World Bank, (ii) attractive valuations in Sub Saharan Africa’s private markets compared to its public markets, and (iii) attractive valuations in Sub-Saharan Africa’s markets compared to global markets.
I&M Burbidge, the Corporate finance advisory of I&M Bank Limited, in their recently released report, East Africa Financial Review, highlighted the deal activity in the East African region, for Q1 2019. According to the report, there were a total of 22 deals in this period, with 10 of these being private equity investments, 3 private equity exits, 2 joint ventures and 7 mergers and acquisitions. This was an improvement from a similar period in 2018, where there were only 16 deals reported. The major increase came on the private equity side, where there was a total of 13 reported deals in Q1 2019, compared to the 7 witnessed in Q1 2018, as shown in the chart below.
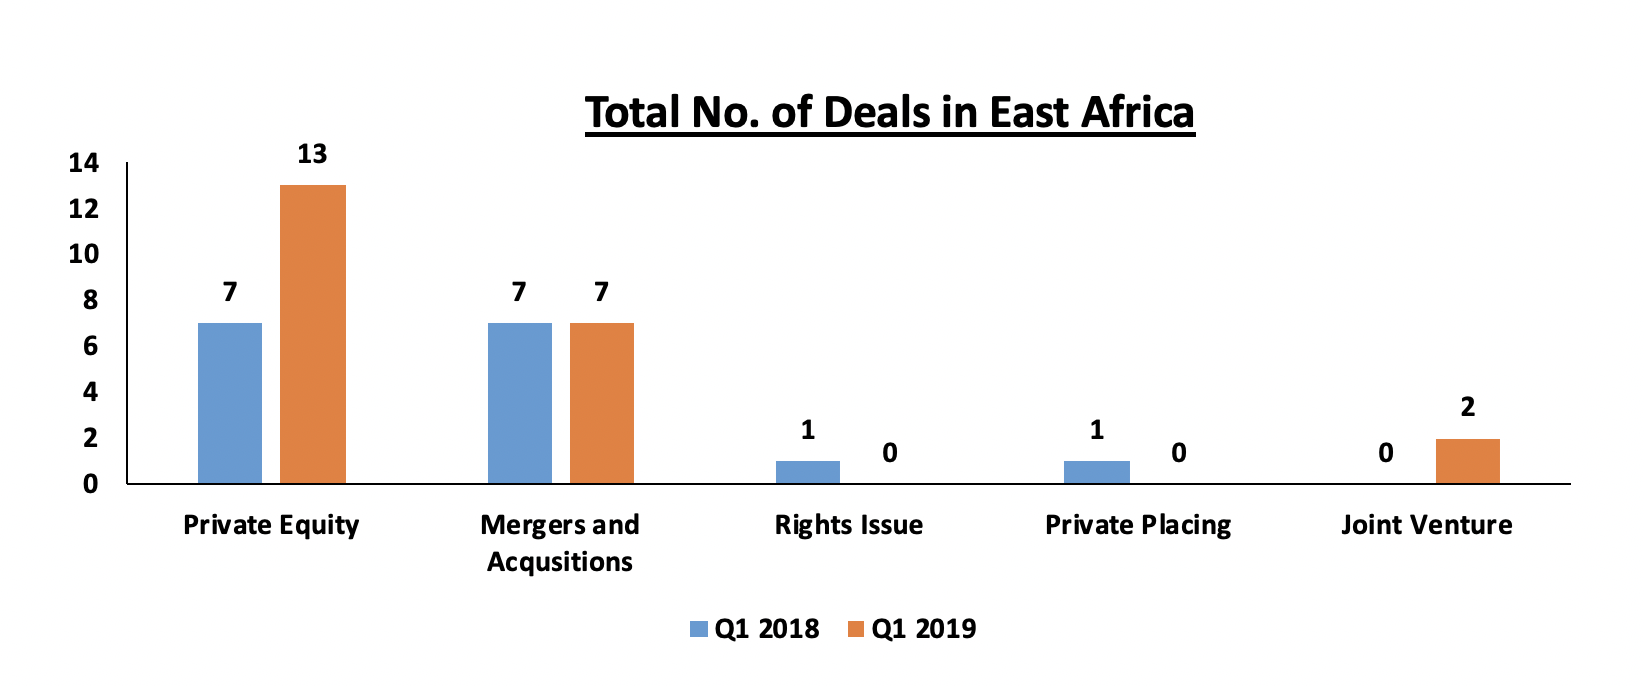
Source: I&M Burbidge East Africa Financial Review
Of the reported private equity deals in Q1 2019, ICT led in terms of sector, with 4 deals in total, followed by financial services sector with 3 reported deals. The energy and retail sectors trailed, with 2 and 1 deals, respectively. In terms of deal value of PE investments, financial services was the leading sector, boasting 60% of the total USD 110.9 mn (Kshs 11.2 bn) witnessed within the quarter, translating to an estimated USD 66.5mn (Kshs 67.2 bn). There was an increase in total deal value by more than 809.0%, from the USD 12.2 mn (Kshs 1.2 bn) witnessed in Q1 2018. This huge leap can mainly be attributed to the big ticket investments, such as the USD 50.0 mn (Kshs 5.1 bn) acquisition of Prime Bank by AfricInvest in January 2019.
In terms of fundraising, there were 4 reported deals by firms with an East African investment mandate. The total amount raised was USD 1.2 bn (Kshs 118.5 bn), which was raised mainly from European development banks such as KfW, FMO, BIO as well as European insurers and pension funds.
In summary, the report highlights recovery on the private equity sector in East Africa, and the larger Sub-Saharan Africa region, which had slowed down in 2018. It also highlights the growing investor interest in financial services and ICT sectors, with these sectors having an increase to 3 and 4 deals in Q1 2019 from 1 and 2 deals, in Q1 2018, respectively. Growth in the financial services sector has been supported by (i) the increasing demand for credit, (ii) the growing financial services inclusion in the region through alternative banking channels, (iii) increased innovation and new product development within the financial services sector, and, (iv) need for consolidation in the sector, which has already picked up pace.
We maintain a positive outlook on private equity investments in Africa as evidenced by the increasing investor interest, which is attributed to; (i) economic growth, which is projected to improve in Africa’s most developed PE markets, (ii) attractive valuations in Sub Saharan Africa’s private markets compared to its public markets, and (iii) attractive valuations in Sub Saharan Africa’s markets compared to global markets. Going forward, the increasing investor interest, stable macro-economic and political environment will continue to boost deal flow into African markets.
- Residential Sector
During the week, Shelter Afrique, a Pan-African Development Finance Institution owned by 44 African governments and Africa Development Bank (AfDB), invested Kshs 200.0 mn geared towards establishment of Kenya Mortgage Refinancing Company (KMRC). This follows the previous week’s World Bank approval of a Kshs 25.0 bn loan facility towards Kenya Affordable Housing Financing Project (KAHFP), which also includes an undisclosed amount for supporting KMRC’s establishment and operationalization The Pan-African institution which typically provides lines of credit to African Financial Institutions and specialized housing institutions for on-lending to end-buyers, also has equity investments in other mortgage refinancing companies across Africa such as Tanzania’s Mortgage Refinancing Company (TMRC), and Togo’s Caisse Regional de Refinancement Hipothecaire (CRRH) for 11.1% and 10.0% stake, respectively.
In addition to the National Treasury’s investment, the increasing financial support from development finance institutions and the private sector, which were billed to be the key shareholders of KMRC since its incorporation in April 2018, is a step in the right direction towards the successful operationalization of the facility whose commencement has been, among others factors, delayed by stakeholder’s delayed capital. The mortgage refinancing company is set to be 80.0% owned by the private sector (Banks, SACCOs and Development Finance Institutions), while the Government of Kenya will have a 20.0% stake.
The World Bank and the National Treasury’s seed capital of Kshs 15.1 bn and Kshs 1.5 bn, respectively, is expected to serve as starting capital for refinancing affordable housing loans while also mobilizing capital from the private sector and the capital market. According to the National Treasury, twenty-one institutions had confirmed interest in the Company as at 2018, with Cooperative Bank also having pledged a capital injection worth Kshs 200.0 mn into the company. Therefore, we expect the recent developments to attract other stakeholders to commit their expected contributions to the mortgage refinancing company. As stated in our recent KMRC topical, the facility is expected to (i) make mortgages in Kenya more affordable by providing long-term liquidity for primary lending institutions, enabling them to advance long-term mortgages to borrowers, especially those from the lower mid-end and low end income groups, and (ii) deepen the capital market by becoming a regular bonds issuer. Other organizations that are set to invest in KMRC include International Finance Corporation (IFC) and African Development Bank (AfDB).
- Hospitality Sector
Autograph Collection Hotels, Marriott International’s brand of luxury hotels, added Nairobi’s Sankara Hotel located in Westlands to its portfolio, as a franchise. The move increases Marriott’s local portfolio to three hotel facilities, after Four Points by Sheraton Nairobi Airport, opened in October 2017, and Four Points by Sheraton Hurlingham, which was converted in April 2017. Sankara Hotel which had 168 keys was renovated to suit the Autograph Collection’s brand and got an addition of 11 suites bringing the total number of keys to 179. Westlands’ location has continued to attract top notch hotel brands including Park Inn by Radisson, Movenpick, and Villa Rosa Kempinski, among others. In addition to its thriving office market hosting multinational organizations, factors contributing to Westlands’ attractiveness as a hospitality node include: its close proximity to the Central Business District and other commercial nodes hosting expatriates such as Gigiri, easy access to the Jomo Kenyatta International Airport and Wilson Airport, as well as availability of amenities such as shopping malls and entertainment spots. Other renowned hoteliers planning to increase their footprint in the country including Radisson group, Hyatt Hotels, Hilton, among others. Notably, Marriott also plans to launch other hotel facilities under its Protea and JW Marriott brands with 250 and 365 keys, respectively, by 2021. The increased interest is sparked by a vibrant tourism sector with tourism earnings, which have been on a steady rise since 2015 and recording a 31.3% growth to Kshs 157.4 bn in 2018 from Kshs 119.9 bn in 2017, according to KNBS Economic Survey 2019.
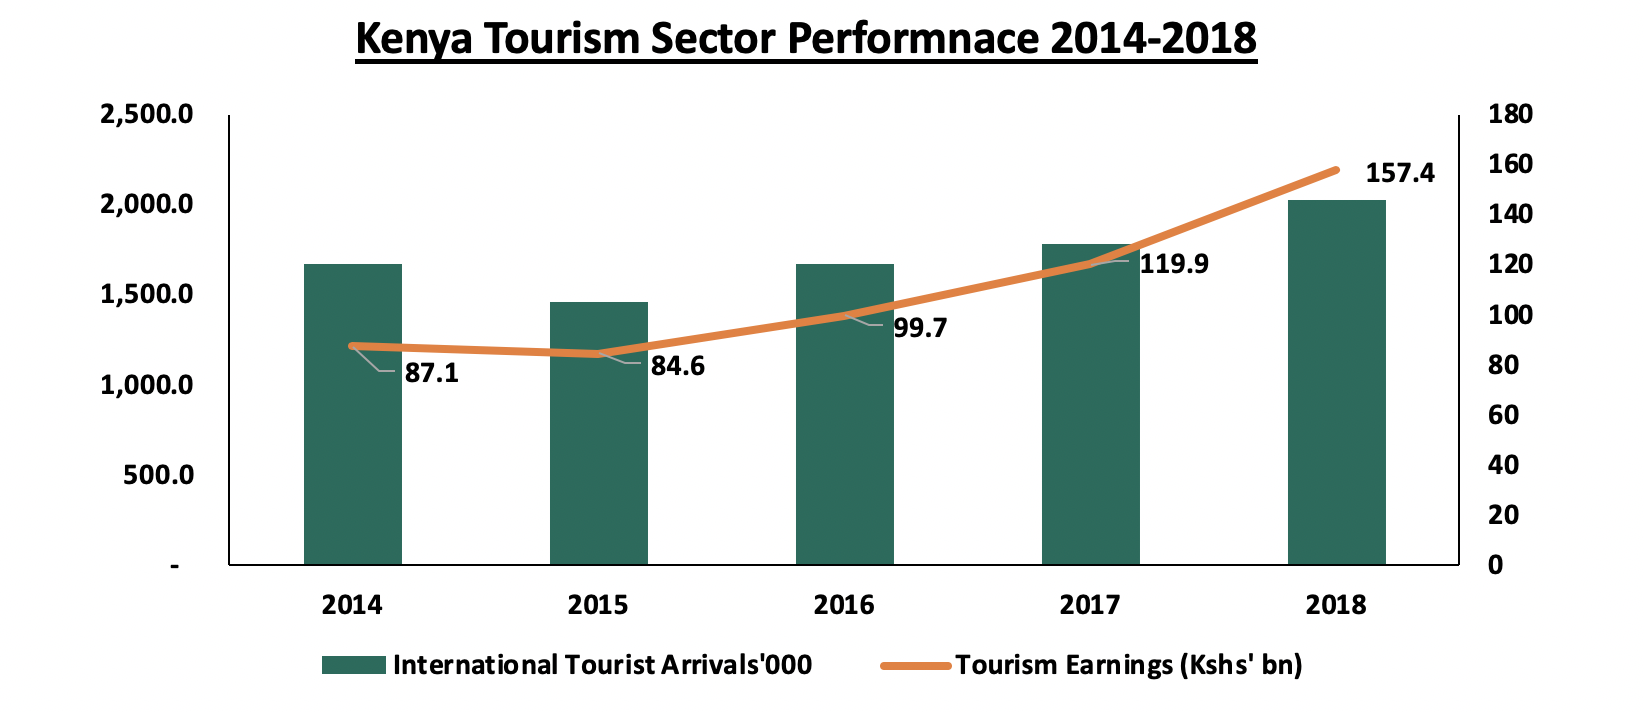
Source: KNBS
Additionally, hotels recorded an increase in bed-night occupancy by 20.1% attributable to a growth in domestic tourism and international conferences which also recorded a growth of 6.8% in 2018.
Other Highlights:
- In a bid to strengthen its presence in Africa, Japanese multinational firm, Toshiba, launched its first office in Nairobi, at Regus Office Park Westlands, as its second branch in Africa, after South Africa. The move affirms Kenya’s position as a powerful regional hub, a factor that has been attracting multinational firms keen on accessing the Eastern and Central Africa regions. The increased entry of foreign players, which is attributable to Kenya’s stable macroeconomic growth as marked by a 6.3% GDP growth rate in 2018 and improved infrastructure, creates demand for high-end residential homes, retail sector as well as Grade A offices
- Kenya Airways announced plans to resume its Malindi flights operation. The national airline cited increase in international tourist arrivals within the region, which we attribute to increased security and reduced travel bans/advisories, thus, boosting tourist confidence. According to KNBS Economic Survey 2019, the number of international arrivals increased by 14.0% to 2.0 mn in 2018 from 1.8 mn in 2017.
On the affordable housing front, with the KMRC having been registered and the CBK regulations set to be gazette by May 2019, we expect the Company to commence operations of refinancing home loans for uptake of the ongoing affordable housing projects, within the year. Overall, we expect a resurgent real estate sector in 2019 on the back of (i) stable macroeconomic environment, (ii) vibrant tourism sector, (iii) continued entry of foreign multinational firms and improvement in infrastructure.
The Retirement Benefits Industry plays a huge role in the economy. According to the Organization for Economic Co-operation and Development (OECD) in 2017, assets in Retirement Benefits Schemes totaled 50.7% of GDP in the OECD countries and 19.7% of total GDP in the non-OECD jurisdictions. It is clear that most non-OECD countries still have a long way to go in the growth of the sector. In Kenya, the Retirement Benefits Assets as a percentage of GDP stood at 13.4%, compared to more developed markets like the USA at 84.1% and the UK at 105.3%. Over the last decades, we have seen reforms and education initiatives by the Retirement Benefits Authority (RBA) to educate people on the importance of saving for retirement. The industry has registered great growth from both member contribution and good performances leading to the assets under management growing to Kshs 1,166.6 bn in 2018, from Kshs 287.7 bn 10-years ago, translating to a compound annual growth rate of 14.3% over the last 10-years.
We cannot emphasize enough on the importance of saving for retirement, as everyone will have needs at retirement. These needs may vary greatly for different people, but everyone will have basic needs and expenses such as home maintenance or rent, transportation, medical care etc. In order to enjoy your retirement years, one needs a stable source of income, and the primary way to achieve this is through disciplined saving, and investing these funds to grow by gaining interest and returns. This can be achieved by signing up to a registered Retirement Benefits Scheme and contribute to it during your working years, therefore, pension systems and retirement benefits schemes are necessary for developing countries like Kenya.
In this week’s note, we focus on understanding the Retirement Benefits Schemes in Kenya, and as such we shall cover the following;
- General Background and Governance of the Retirement Benefits Industry
- The Kenya Retirement Benefits System
- Types of Retirement Benefits Schemes
- Investments and Returns of Retirement Benefits Schemes
- Drivers of Change in the Retirement Benefits Industry
- Conclusion
Section I. General Background and Governance of the Retirement Benefits Industry
The Retirement Benefits Industry in Kenya has undergone major changes in the last few years which has led to a pension coverage of about 20% of the current working population. This is a significant improvement in comparison to the years leading up to 1997 where the industry was generally unregulated and thus characterized by lack of protection of the interests of the members in management of scheme affairs. In the absence of a clear regulatory framework, some of the challenges that faced the Retirement Benefits Industry, which led to the enactment of the Retirement Benefits Act in 1997 include;
- Arbitrary investment of funds without autonomous professional advice,
- Mismanagement and embezzlement of scheme funds by Trustees,
- Schemes not being satisfactorily funded thus unable to fulfill their promises to retirees in spite of members making their contributions, and,
- Records not being well kept.
The Retirement Benefits Act in 1997 created the Retirement Benefits Authority (RBA) whose mandate is to oversee and regulate the industry’s management as well as to develop and promote the Retirement Benefits sector. Since the enactment of the Retirement Benefits Act, the industry has experienced remarkable growth in terms of assets under management, which stood at Kshs 1.2 trillion in June 2018. The Retirement Benefits Authority has been keen in promoting good governance by continously updating the regulations and enforcing the same in the schemes. The regulations requires each scheme to have the following service providers;
- A Board of Trustees or a corporate Trustee who are the owners of the Scheme and are responsible for the running of the scheme affairs,
- An Administrator whose duties are to deal with the day to day accounting of the Scheme,
- Fund Manager who executes the Trustees’ Investment Policy Statement, and,
- A Custodian who holds all assets of the Scheme.
Administrators, Fund Managers, and Custodians must be registered by the RBA.
Section II: The Kenyan Retirement Benefits System
The Retirement Benefits System predominantly covers the working population in both the public and private sector. The system has three pillars;
- The Zero Pillar – it comprises the state funded pension for citizens over the age of 65 and provides a basic income. This is managed by the Ministry in charge of social protection,
- The First Pillar – is contributory and mandatory to all workers. The mandatory contribution is by both employer and employees and it targets workers in both the formal and informal sectors. This is where the National Social Security Fund (NSSF) comes in, and ,
- The Second Pillar – is mainly employer based and contributory except for the Civil Service Pension Scheme and County Schemes as are currently constituted.
Section III. Types of Retirement Benefits Schemes
Retirement Benefits Schemes allow their members to make regular contributions during their working life and once a member retires either after attaining the retirement age or earlier due to other factors, mainly ill-health, these contributions plus accrued interest are utilized to provide retirement income to the member. Retirement Benefits Schemes in the Kenyan market are broadly categorized into two, and the main difference between the two is the mode of payment at retirement. These categories are;
- Pension Schemes
At retirement, the contributions from both the employee and employer plus accrued interest are utilized to purchase a pension annuity from an insurance company/Approved Issuer with the provision that a member may take a maximum of one third of the amount as a Lump Sum and the balance is utilized to purchase an annuity. An annuity is an arrangement whereby a life office/insurance company, in exchange for purchase price/money, enters into a contract to pay a set amount of money every year while the annuitant (the person on whose life the contract depends) is still alive, and
- Provident Funds
At retirement, a member of a provident fund receives their contribution and contributions made on their behalf by the employer plus accrued interest as a lump sum. The member may decide to purchase an annuity with or use the money as he deems fit.
Retirement Benefit Schemes can also be classified based on modes of contribution and investment of the contributions:
- Mode of contribution
- Umbrella Retirement Benefits Schemes: These are schemes that pool the contributions of multiple employers and their employees thereby reducing the average cost per member and enhancing the overall returns and benefits to the members.
- Individual Retirement Benefits Schemes: These are schemes where individuals can contribute directly into the scheme towards saving for their retirement. The contributions are flexible in order to accomodate an individuals financial circumstances.
- Mode of investment of the contributions
- Segregated Funds: In these schemes, members’ contributions are invested directly by the Trustees via an appointed Fund Manager. The Trustees establish an appropriate Investment Policy which is then implemented by the Fund Manager. The scheme directly holds the investments and the returns are fully accrued to the scheme for the benefit of members
- Guaranteed Funds: This is a scheme offered by insurance companies where the members’ contributions are pooled together. The insurance company guarantees a minimum rate of return (the maximum by law being 4%) and should the actual return surpass the minimum guaranteed rate, the insurance company tops up the minimum rate with a bonus rate of return
Based on the risk profile of the Board of Trustees, a scheme could choose to either be in a Guaranteed Fund for the conservative schemes who are risk averse or a segregated fund for the more aggressive scheme who are seeking higher returns and are willing to take more risks. For individuals; the choice of whether to invest in an Umbrella Retirement Benefits Scheme or an Individual Retirement Benefits Scheme largely depends on your nature of employment and whether or not your employer offers this benefit as is in the case with Umbrella schemes because the employer will have to make contributions on behalf of their employees while and Individual determines and makes contributions on their own behalf.
Section IV. Investments and Returns of Retirement Benefits Schemes
Every Retirement Benefits Scheme must formulate an Investments Policy Statement (IPS) for the scheme that should be followed when investing the scheme's funds. The IPS outlines the process for a Retirement Benefits Schemes’ investment related decision making as well a the investment limits per each asset class for the schemes funds. The IPS should however not conflict with the limits dictated by the RBA Investment Guidelines (Table G) as highlighted below.
|
Retirement Benefits Authority Investment Guidelines |
|
|
Asset Classes |
RBA Max Limit |
|
East African Government Securities |
90% |
|
Fixed & Time Deposits |
30% |
|
Commercial Paper, Non-listed bonds and other debt instruments issued by private companies |
30% |
|
Corporate Bonds, Mortgage Bonds and Loan Stock |
20% |
|
Listed Equities |
70% |
|
Unlisted Equities |
5% |
|
Private Equity and Venture Capital |
10% |
|
Offshore |
15% |
|
Property |
30% |
|
Real Estate Investment Trusts |
30% |
|
All exchange-traded derivative contracts |
5% |
|
Cash & Cash Equivalents |
5% |
|
Any other assets |
10% |
Allocation of Retirement Benefits Schemes Assets
Returns for pension schemes have been plummeting over the years owing to the fact that traditional fund managers have been shy of the alternative investments, which offer higher returns. This is attributable to lack of expertise in the area and the unwillingness to get out of their comfort zone. Some of the general factors affecting returns include the size of the scheme, the asset class allocation strategy adopted by the Trustees as per the investment policy adopted and the prevailing economic environment in addition to the efficiency of the fund manager.
The Table below details the Investment allocation by schemes in the various asset classes in Kenya.
|
OVERALL INDUSTRY INVESTMENT VS STATUTORY MAXIMUM |
|||||
|
No |
Assets Category |
Jun-16 |
Jun-17 |
Jun-18 |
Statutory Maximum |
|
1 |
Government Securities |
25.5% |
36.7% |
36.3% |
90.0% |
|
2 |
Quoted Equities |
15.6% |
18.7% |
20.7% |
70.0% |
|
3 |
Immovable Property |
15.2% |
21.2% |
19.7% |
30.0% |
|
4 |
Guaranteed Funds |
12.2% |
10.8% |
13.7% |
100.0% |
|
5 |
Listed Corporate Bonds |
4.7% |
4.9% |
3.6% |
20.0% |
|
6 |
Fixed Deposits |
3.4% |
4.7% |
2.7% |
30.0% |
|
7 |
Offshore |
0.6% |
1.0% |
1.3% |
15.0% |
|
8 |
Cash |
1.0% |
1.4% |
1.6% |
5.0% |
|
9 |
Unquoted Equities |
7.5% |
0.4% |
0.3% |
5.0% |
|
10 |
Private Equity |
0.0% |
0.0% |
0.0% |
10.0% |
|
11 |
Real Estate Investment Trusts (REITS) |
0.0% |
0.1% |
0.1% |
30.0% |
|
12 |
Commercial paper by private companies |
0.0% |
0.0% |
0.0% |
30.0% |
|
13 |
Unclassified/Others |
14.1% |
0.0% |
0.0% |
10.0% |
|
|
TOTAL |
100.0% |
100.0% |
100.0% |
|
According to Organization for Economic Co-operation and Development (OECD), Retirement Benefits Schemes assets are mainly invested in fixed income securities and equities in over 80% of OECD reporting jurisdictions. On average Equities represented 26.1% of the investments of Retirement Benefits Scheme assets in OECD jurisdictions, and an average of 21.2% in non-OECD jurisdictions. This is in contrast to Kenya where representation in Equities accounts for 19.8% as shown in the chart below. Regulation may also require pension funds to hold a minimum proportion of pension assets in some instruments (e.g. in Poland, pension funds must hold at least 15% in equities in 2017 while investments in treasury bonds are banned). This is a clear indication that non-OECD countries have a bias towards allocating to government bonds.
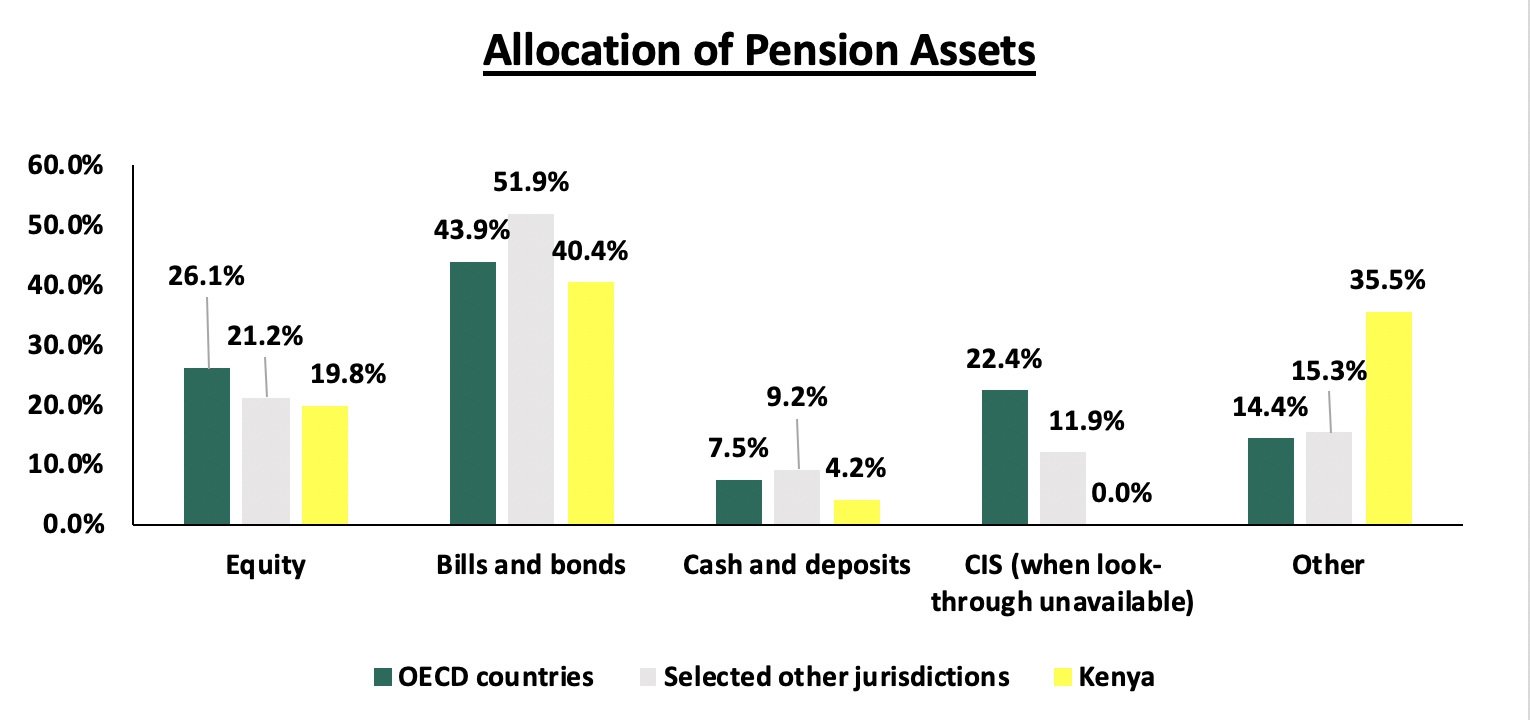
As capital markets have grown and regulators have advanced, the Allocation of pension funds invested into equities has increased. According to IFC, South African Retirement Benefits Schemes whose combined Assets Under Management amount to USD 500.0 bn take up roughly 40% of the assets on the Johannesburg Stock Exchange. In Kenya, local currency bill and bonds prevail, this is despite the regulation allowing for a 10% and 30% allocation to Private Equity and REITs respectively. As at June 2018, the total Retirement Benefits Assets Allocated to Private Equity and REITs stand at 0.04% and 0.09% respectively. The asset allocation to Government Securities and Quoted Equities on the other hand stand at 36.3% and 20.7% respectively in the same period.
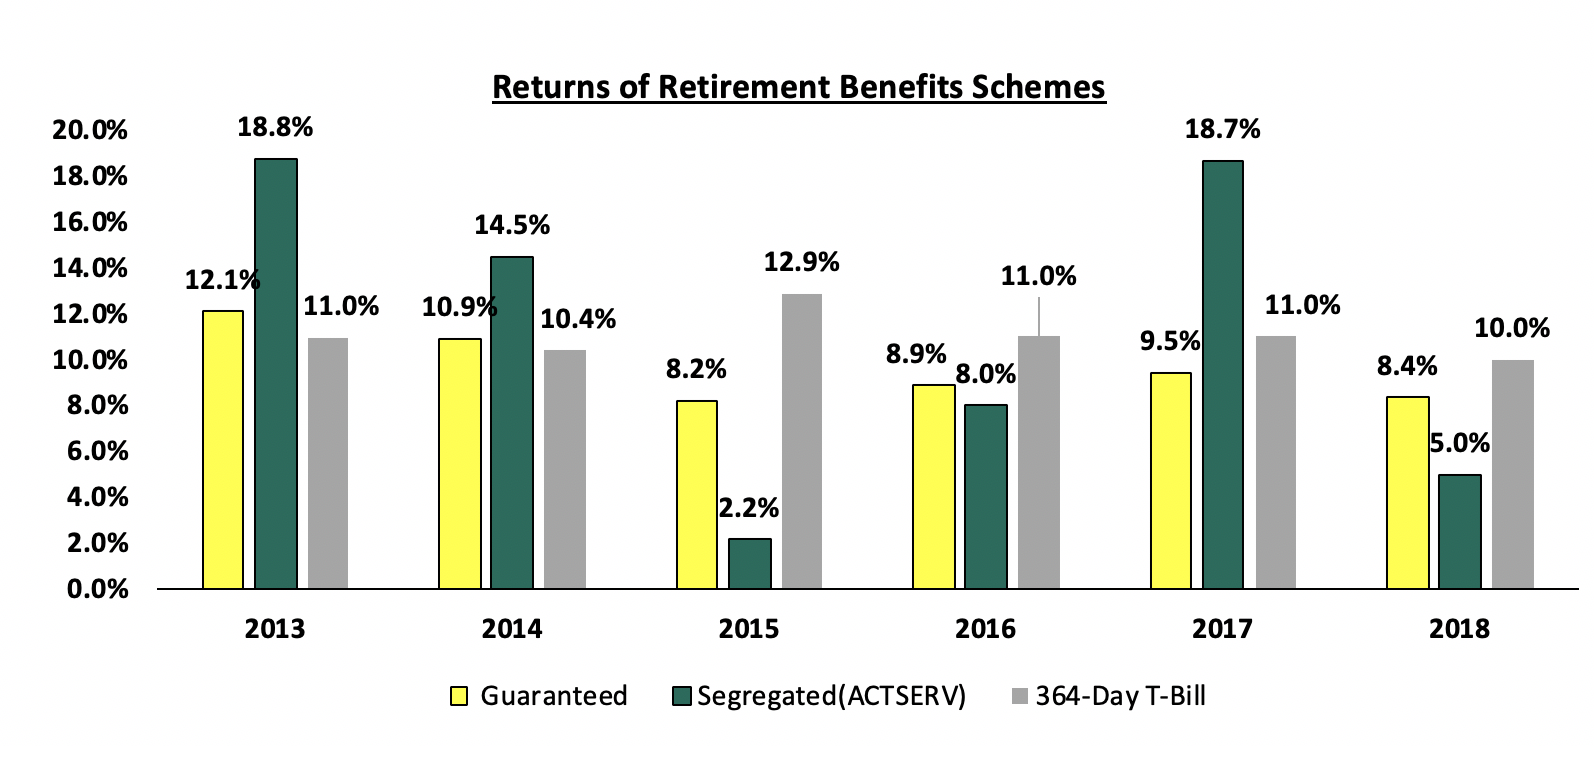
Returns of Retirement Benefits Schemes
Segregated funds have mostly offered above market average returns, with the average yearly rate standing well above other instruments in the market. Below is a chart summarizing the returns offered by Guaranteed Funds and Segregated Funds over the last six years, compared to returns of a 364-Day treasury bill:
Below is a table of the effective annual rate of return per annum for the same period.
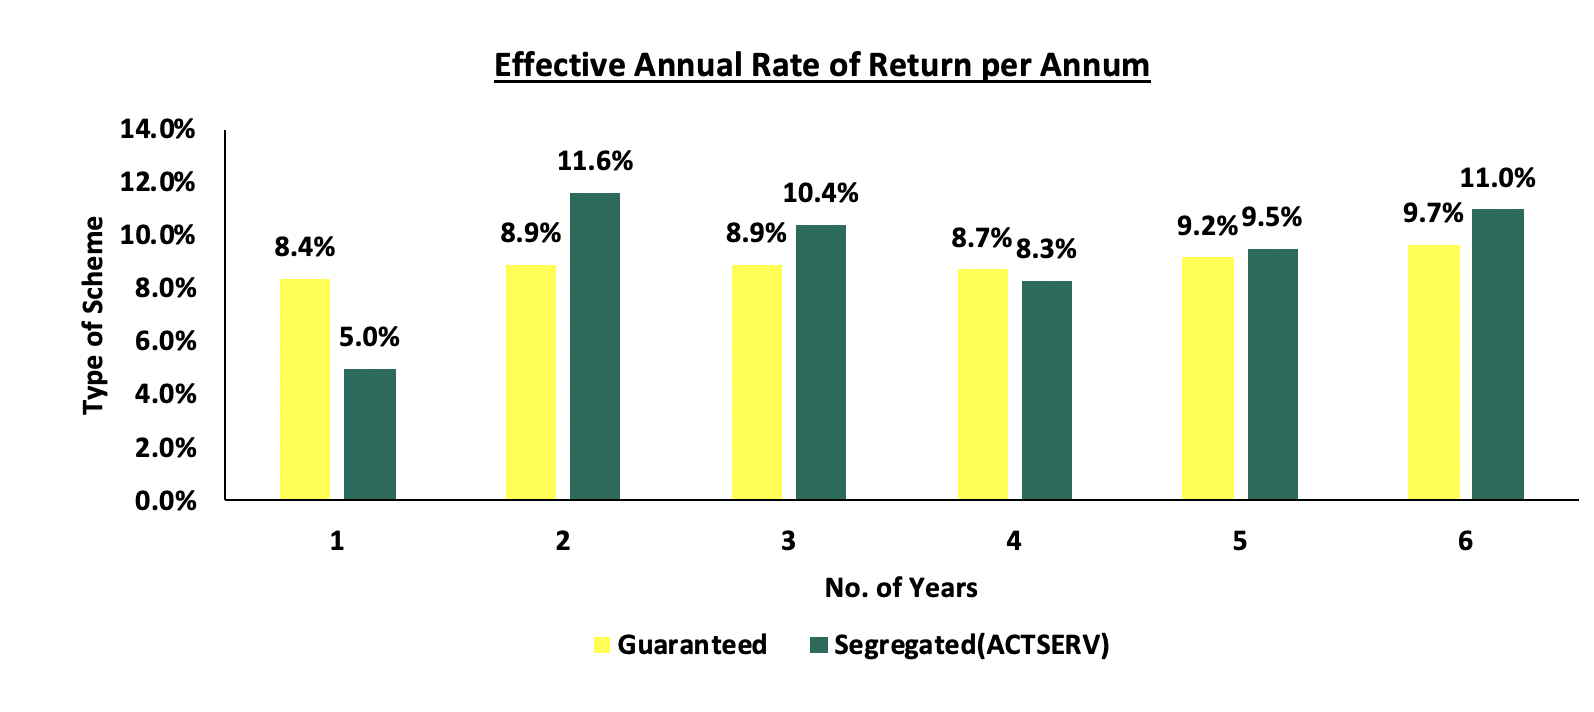
From the above chart, it is clear that if one invested in a segregated fund, the cumulative rate of return over the 6-year period would be more (i.e. 11.0%) than if invested in a Guaranteed Fund in the same period (9.7%). This is despite the low performance of segregated funds in 2015 and in 2018.
Section V. Factors Driving Growth of the Retirement Benefits Industry
Given that the Retirement Benefits Industry continues to evolve and there is increased knowledge of investments, the sector has and is expected to do well owing to the following factors:
- Demographic Factors. Due to a young, rapidly growing population, the Assets Under Management (AUM) of Retirement Benefits Schemes continue to increase steadily with the overall AUM standing at KShs 1.2 tn as at June 2018, from KShs 287.7 bn in 2008 as more people are joining the workforce and saving for retirement;
- Macroeconomics. Kenya has a compelling growth story which the Retirement Benefits Industry is set to enjoy. The country’s economic growth has continued to grow with Kenya recording a GDP growth of 6.3% in 2018 and a 5 year average growth of 5.4%. This brings about a conducive business environment with better returns. Furthermore, low-interest rates in the market as evidenced by the 2018 returns for the 182-day T-Bill and the 364-Day T-Bill at 9.0% and 10.0% respectively, fuel search for yield. This pushes more schemes to shift from the more traditional forms of investments to alternative investments, as evidenced by the growth in asset allocation in immovable property to 21.0% as at December 2017 from 18.5% as at December 2015;
- Social Change. As it is with the African Culture, the need to save for old age was deemed to be a foreign concept owing to the fact that your dependants are/were supposed to cater to your needs in the old age. However, with globalization taking the centre stage, parents are now relieving their children of the burden of having to take care of them in old age. This is in addition to the fact that more and more people are leaving the workforce much later than their predecessors did and are more aware of the need to actively save for retirement;
- Legislation. The legislation around Pension funds has been beneficial to the industry driving growth of the overall assets under management in the industry;
- Financial Awareness and Inclusion. Access to information has improved in the last decade, allowing for people to access information required via the use of technology enabling faster responses to queries and grievances. In addition to this, there are various training and education initiatives most notably, the Retirement Benefits Authority has created initiatives to increase pension penetration, by educating the public on the importance of saving for retirement, and,
- Trustees Certification programs Trustees of Retirement Benefits Schemes have to be certified Trustees through the Trustee Development Program Kenya(TPDK)
Updates and Trends in the Retirement Benefits Industry
There are various trends that have affected the Retirement Benefits Industry in Kenya and have forced the industry to change in order to cope with these trends. These include;
- Social insurance programs. Some countries have responded by introducing social insurance programs that do not require citizens during their working years to pay into them. These “social pensions”, also called universal minimum pensions, are entitlements financed entirely out of the government’s general revenue paid out to certain categories of individuals, In Kenya the ”inua jamii“ initiative under the Ministry of Labour and Social Protection, citizens over the age of 65 receive a monthly stipend of Kshs. 2000 payable bi-monthly and are also covered under the National Health Insurance Fund(NHIF);
- Changing nature of work. The changing nature of work is upending traditional employment and the gig economy, part-time jobs, contracts and other diverse and fluid forms of employment are growing. Most social protection systems are based on mandatory contributions and payroll (labour) taxes on formal wage employment but as the formal employment numbers continue to decline, the state of future social insurance requires more thought in terms of its framework and execution. Recently, the Retirement Benefits Authority has partnered with the Micro and Small Enterprise Retirement Benefits Authority to increase its membership and assets held by pension schemes by targeting small-scale enterprises in the informal sector (e.g. artisans, vegetable vendors, mechanics and other small entrepreneurs). Recent studies indicate that most jobs in Kenya are now found in the informal sector, where for long there was no defined pension arrangement;
- Technology. Technology in recent years has transformed from a luxury item to a necessary evil and is now a way of life. This has assisted in the improvement of delivery systems for social protection programs and is currently being used to facilitate tax collection by increasing the number of registered taxpayers and social security contributions. This is in addition to Mobile money which ensures that the ‘common mwananchi’ has a means of making regular payments to their pension scheme at their convenience;
- Regulatory Environment. Some of the regulatory changes that we have seen in the recent years include;
- The NSSF Act 2013 was passed into law on the 24th December 2014 with an effective date of 1st June 2015. The Law is however not in force due to an impending court ruling. Once the new Law is in force, NSSF contributions will go up to 12% of one’s pensionable salary shared between the employee and employer equally. Currently, the payments by each employee is 5% of their basic salary or Kshs. 200 whichever is less. The employer also currently matches the Employee contributions.
- Changes in investment asset classes. Pension schemes are expected to venture into investing in alternative assets classes, given the broadening of the allowable investment categories. Recently real estate investment trusts (development and income), private equity and venture capital, derivatives and exchange-traded funds were introduced as new products. The Retirement Benefits Authority undertakes regular reviews of investment asset classes to align them with market developments, enhance portfolio diversification, manage risks and boost returns. The Retirement Benefits Authority has proposed to the government that it allow for the 15th Investment Asset Class for debt financing of public-private partnership (PPP) projects approved under the PPP Act for infrastructure or housing to be utilized by schemes. This is expected to further diversify investment opportunities for pension schemes.
- Medical Fund. As part of resolving this growing challenge, in 2016 the government through the National Treasury introduced provisions in the retirement benefits regulations to facilitate savings for medical benefits in retirement;
- Mortgages Members of Registered Retirement Benefits Schemes can use their accumulated benefits (up to 60%) as collateral to secure a mortgage loan to own a home while at the same time saving towards a secured retirement. The Scheme Trustees’ only issue a guarantee to the Lending Institution as a secondary security and as such no funds are transferred from the scheme.
Section VI. Conclusion
In order to enjoy your retirement years, one needs a stable source of income and given that formal employment is no longer an option, it is important to sign up to a registered Benefits Scheme and make regular contributions in your employed years. Aside from reducing poverty in old age, some of the benefits of saving through a retirement benefits scheme include (i) Provision of regular income to replace earnings in retirement, (ii) Provision of lump sum benefit income for surviving dependants in the event of your passing, (iii) It serves as one of the most secure forms of savings, (iv) Retirement Benefits Schemes separate members’ retirement benefits assets from the Company’s assets and, (v) Retirement Benefits Schemes offers Tax reliefs which include; income tax relief on employee contributions as well as the fact that Retirement Benefits Schemes do not pay income or capital gains tax on investment returns. In addition to this, part of retirement benefits may be paid as a tax-free cash sum.
Disclaimer: The views expressed in this publication are those of the writers where particulars are not warranted. This publication, which is in compliance with Section 2 of the Capital Markets Authority Act Cap 485A, is meant for general information only and is not a warranty, representation, advice or solicitation of any nature. Readers are advised in all circumstances to seek the advice of a registered investment advisor.

- Talk to us
- Kenya
- P.O Box 20695 - 00200, Nairobi, Kenya
- Cell +254709101200
- Tel +254709101200
- WhatsApp +254741676635
- United States
- +254709101200
- DOWNLOAD OUR APP
-


- Kenya
- 8th Floor, Pinetree Plaza, Kaburu Drive, Ngong Road, Nairobi, Kenya
- USA
- Suite 1150, 1775 Eye Street NW, USA, Washington DC 20006, USA
- Investments
- High Yield
- Private Equity
- Real Estate
- Real Estate
- RiverRun Estates
- Cytonn Towers
- The Ridge
- Taraji Heights
- The Alma