Unit Trust Fund Performance FY’2020, & Cytonn Weekly #18/2021
By Research Team, May 9, 2021
Executive Summary
Fixed Income
During the week, T-bills were oversubscribed, with the overall subscription rate coming in at 131.0%, up from 125.0% recorded the previous week. The demand for the 364-day paper persisted, as it recorded the highest bids worth Kshs 25.3 bn against the offered amount of Kshs 10.0 bn, translating to a subscription rate of 253.2%, an increase from 245.4% recorded the previous week. In the Primary Bond Market, the two bonds reopened by the government for the month of May recorded an overall subscription rate of 142.0%. Investors preferred the longer dated paper, FXD1/2021/25, with a tenor of 25 years which received subscriptions of Kshs 31.0 bn, compared to the Kshs 11.6 bn received for FXD2/2019/15.
During the week, the Purchasing Managers’ Index (PMI) for the month of April, 2021 declined to 41.5 from the 50.6 recorded in March, attributable to the partial lockdown and increased curfew hours which led to a negative impact on movement and demand for goods and services.
The Kenya Revenue Authority (KRA) surpassed the revenue target collection for the month of April 2021 collecting Kshs 176.7 bn against a target of Kshs 170.2 bn. Also, the Cabinet Secretary for National Treasury tabled the Finance Bill 2021 before parliament for consideration as part of the Fiscal year 2021/22 budget cycle to be accented to law by 30th June 2021. Additionally, on 29th April 2021, the National Treasury presented its Budget Estimates for the next fiscal year, FY’2021/22. It is important to note that this is the biggest budget the country has had, a 5.6% increase to Kshs 3.1 tn in FY2021/22, from last year’s Kshs 2.9 tn;
Equities
During the week, the equities market recorded mixed performance, with NASI and NSE 25 gaining by 1.1% and 1.4% respectively, while NSE 20 declined by 0.2%, taking their YTD performance to gains of 12.5% and 9.3% for NASI and NSE 25 respectively, and a loss of 0.5% for NSE 20. The equities market performance was driven by gains recorded by large-cap stocks such as KCB Group, Equity Group, Co-operative Bank and BAT of 4.2%, 4.1%, 3.3% and 3.0%, respectively. The Central Bank of Kenya (CBK), released the Commercial Banks’ Credit Survey Report for the quarter ended March 2021, highlighting that the banking sector’s loan book recorded a 6.8% y/y growth, with loans increasing to Kshs 3.04 tn in March 2021, from Kshs 2.85 tn in March 2020, and Kshs 3.00 tn in December 2020. Additionally, during the week, I&M Holdings PLC announced that it has completed the acquisition of 90.0% of Orient Bank Limited Uganda (OBL) share capital;
Real Estate
In the tabled budget, the Big 4 Agenda continued to gain support with Kshs 135.3 bn being set aside under the same. In the residential sector, Kenya Mortgage Refinance Company (KMRC) appointed three advisors namely; NCBA Investment Bank, Lion’s Head Global Partners and Mboya Wangong’u & Waiyaki Advocates, to guide it during its planned green bond issue targeted for July to September this year. Additionally, Acorn Holdings announced plans to restrict construction of its student hostels within a 3.0 km radius of targeted institutions in a move to increase preference by students and reduce transport costs. In the retail sector, Naivas supermarket, a local retail chain, announced plans to open 3 stores by mid-June 2021, in an expansion drive that will see it take up spaces previously occupied by Tuskys Supermarket in two outlets located along Muindi Mbingu Street in Nairobi’s Central Business District (CBD), and Simba Club Hall in Kisumu, while the other will be located at Githurai 44 on Kamiti Road;
Focus of the Week
Following the release of the Capital Markets Authority (CMA) Quarterly Statistical Bulletin – Q1’2021, we examine the performance of Unit Trust Funds, with a key focus on Money Market Funds, which remain the most popular Unit Trust Funds with a market share of 89.6% as at the end of FY’2020, a rise from 87.0% in FY’2019. During the period of review, Unit Trusts’ Assets Under Management (AUM) grew by 37.6% to Kshs 104.7 bn, from Kshs 76.1 bn as at FY’2019. Additionally, as at the end of FY’2020, there were 23 approved collective investment schemes making up 93 funds in total. Out of the 23, however, only 19 were currently active while 4 were inactive;
Investment Updates:
- Weekly Rates:
- Cytonn Money Market Fund closed the week at a yield of 10.53%. To invest, just dial *809#;
- Cytonn High Yield Fund closed the week at a yield of 14.44% p.a. To invest, email us at sales@cytonn.com and to withdraw the interest you just dial *809#;
- We continue to offer Wealth Management Training daily, from 9:00 am to 11:00 am, through our Cytonn Foundation. The training aims to grow financial literacy among the general public. To register for any of our Wealth Management Trainings, click here;
- If interested in our Private Wealth Management Training for your employees or investment group, please get in touch with us through wmt@cytonn.com;
- Cytonn Insurance Agency acts as an intermediary for those looking to secure their assets and loved ones’ future through insurance namely; Motor, Medical, Life, Property, WIBA, Credit and Fire and Burglary insurance covers. For assistance, please get in touch with us through insuranceagency@cytonn.com;
Real Estate Updates:
- For an exclusive tour of Cytonn’s real estate developments, visit: Sharp Investor's Tour, and for more information, email us at sales@cytonn.com;
- Phase 3 of The Alma by Cytonn is now ready for occupancy. To rent please email properties@cytonn.com;
- We have 10 investment-ready projects, offering attractive development and buyer targeted returns. See further details here: Summary of Investment-ready Projects;
Hospitality Updates:
- We currently have promotions for Daycations and Staycations, visit cysuites.com/offers for details or email us at sales@cysuites.com;
For recent news about the group, see our news section here.
Money Markets, T-Bills & T-Bonds Primary Auction:
During the week, T-bills were oversubscribed, with the overall subscription rate coming in at 131.0%, up from 125.0% recorded the previous week. The demand for the 364-day paper remained high, as it recorded the highest bids worth Kshs 25.3 bn against the offered Kshs 10.0 bn, translating to a subscription rate of 253.2%, an increase from the 245.4% recorded the previous week. The subscription rate for the 182-day paper increased to 42.6%, from 37.5% recorded the previous week, receiving bids worth Kshs 4.3 bn against Kshs 10.0 bn offered. The subscription rate for the 91-day paper also increased to 46.5%, from 42.7% recorded the previous week, with the paper receiving bids worth Kshs 1.9 bn against the intended Kshs 4.0 bn. The yields on the 91-day and 182-day papers increased to 7.2% and 8.0%, while the yields on the 364-day paper declined to 9.4%. The government continued to reject expensive bids, accepting 66.2% of the bids received, amounting to Kshs 20.8 bn, out of the Kshs 31.4 bn worth of bids received.
In the Primary Bond Market, the two bonds reopened by the government for the month of May recorded an overall subscription rate of 142.0%. Investors preferred the longer dated paper, FXD1/2021/25, with a tenor of 25 years, which received bids worth Kshs 31.0 bn, against the Kshs 30.0 bn offered amount which translated to a subscription rate of 103.4%. On the other hand, FXD2/2019/15 received bids worth Kshs 11.6 bn against the Kshs 30.0 bn offered, translating to a subscription rate of 38.6%. The average yields on the two bonds were 13.0% and 13.9% for FXD2/2019/15 and FXD1/2021/25, respectively. The government continued rejecting expensive bids by accepting Kshs 20.3 bn of the Kshs 42.5 bn worth of bids received, translating to an acceptance rate of 47.6%.
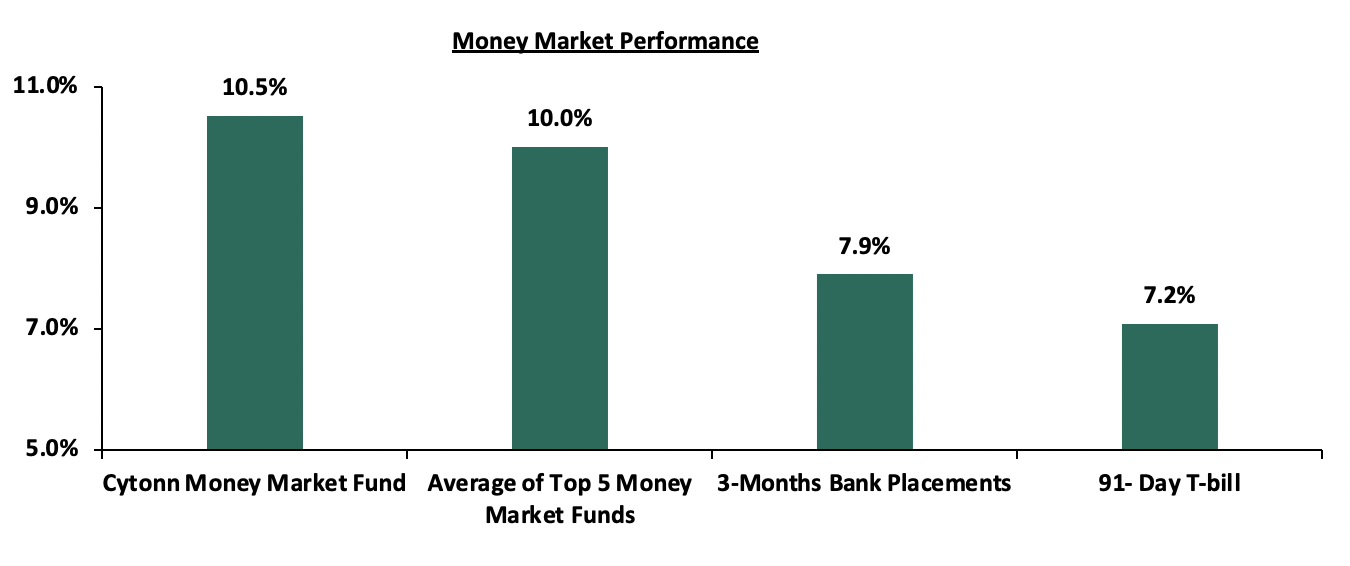
In the money markets, 3-month bank placements ended the week at 7.9% (based on what we have been offered by various banks), while the yield on the 91-day T-bill increased by 1.3 bps to 7.2%. The average yield of the Top 5 Money Market Funds remained unchanged at 10.0%. Similarly, the yield on the Cytonn Money Market Fund remained unchanged at 10.5%. The table below shows the Money Market Fund Yields for Kenyan fund managers as published on 7th May 2021:
|
Money Market Fund Yield for Fund Managers as published on 7th May 2021 |
|||
|
Rank |
Fund Manager |
Daily Yield |
Effective Annual Rate |
|
1 |
Cytonn Money Market Fund |
10.01% |
10.53% |
|
2 |
Nabo Africa Money Market Fund |
9.65% |
10.09% |
|
3 |
Zimele Money Market Fund |
9.56% |
9.91% |
|
4 |
Alphafrica Kaisha Money Market Fund |
9.41% |
9.82% |
|
5 |
GenCapHela Imara Money Market Fund |
9.16% |
9.59% |
|
6 |
Madison Money Market Fund |
9.13% |
9.55% |
|
7 |
CIC Money Market Fund |
8.97% |
9.29% |
|
8 |
Sanlam Money Market Fund |
8.98% |
9.22% |
|
9 |
Dry Associates Money Market Fund |
8.60% |
8.95% |
|
10 |
Co-op Money Market Fund |
8.31% |
8.66% |
|
11 |
British-American Money Market Fund |
8.29% |
8.61% |
|
12 |
Apollo Money Market Fund |
8.43% |
8.50% |
|
13 |
NCBA Money Market Fund |
8.04% |
8.36% |
|
14 |
ICEA Lion Money Market Fund |
8.02% |
8.35% |
|
15 |
Old Mutual Money Market Fund |
6.68% |
6.89% |
|
16 |
AA Kenya Shillings Fund |
5.53% |
5.67% |
Liquidity:
During the week, liquidity in the money market improved, with the average interbank rate declining to 4.6%, from 5.2% recorded the previous week, attributable to end-month government payments coupled with Kshs 33.4 bn worth of government securities maturities. The average interbank volumes increased by 25.0% to Kshs 8.0 bn, from Kshs 6.4 bn recorded the previous week. According to the Central Bank of Kenya’s weekly bulletin, released on 7th May 2021, commercial banks’ excess reserves came in at Kshs 12.3 bn in relation to the 4.25% Cash Reserve Ratio.
Kenya Eurobonds:
During the week, the yields on Eurobonds recorded mixed performance, with the yields on the 10-year Eurobond issued in June 2014, 10-year bond issued in 2018 and 7-year bond issued in 2019 remaining unchanged at 3.2%, 5.7% and 5.0%, respectively, while the yields on the 30-year bond issued in 2018 and the 12-year bond issued in 2019 declined to 7.6% and 6.6%, from 7.7% and 6.7%, respectively.
|
Kenya Eurobond Performance |
|||||
|
|
2014 |
2018 |
2019 |
||
|
Date |
10-year issue |
10-year issue |
30-year issue |
7-year issue |
12-year issue |
|
31-Dec-2020 |
3.9% |
5.2% |
7.0% |
4.9% |
5.9% |
|
30-April-2021 |
3.2% |
5.7% |
7.7% |
5.0% |
6.7% |
|
03-May-2021 |
3.2% |
5.8% |
7.7% |
5.0% |
6.7% |
|
04-May-2021 |
3.2% |
5.8% |
7.6% |
5.0% |
6.7% |
|
05-May-2021 |
3.3% |
5.8% |
7.6% |
5.0% |
6.7% |
|
06-May-2021 |
3.2% |
5.7% |
7.6% |
5.0% |
6.6% |
|
07-May-2021 |
3.2% |
5.7% |
7.6% |
5.0% |
6.6% |
|
Weekly Change |
0.0% |
0.0% |
(0.1%) |
0.0% |
(0.1%) |
|
MTD Change |
0.0% |
0.0% |
(0.1%) |
0.0% |
(0.1%) |
|
YTD Change |
(0.7%) |
0.5% |
0.6% |
0.1% |
0.7% |
Source: Reuters
Kenya Shilling:
During the week, the Kenyan shilling appreciated against the US dollar by 0.9% to Kshs 106.9, from Kshs 107.8 recorded the previous week, attributable to reduced dollar demand from general importers. On a YTD basis, the shilling has appreciated by 2.1% against the dollar, in comparison to the 7.7% depreciation recorded in 2020. We expect the shilling to remain under pressure in 2021 as a result of:
- Rising uncertainties in the global market due to the Coronavirus pandemic, which has seen investors continue to prefer holding their investments in dollars and other hard currencies and commodities, and,
- Continued strengthening of the US Dollar against major currencies as evidenced by a YTD gain of 0.9% in the ICE U.S. Dollar Index as compared to a 6.7% decline in 2020. The ICE U.S. Dollar Index is a benchmark index that measures the international value of the US Dollar where investors can monitor the value of the US Dollar relative to a basket of six other world currencies.
The shilling is however expected to be supported by:
- The Forex reserves, currently at USD 7.6 bn (equivalent to 4.6-months of import cover), which is above the statutory requirement of maintaining at least 4.0-months of import cover, and the EAC region’s convergence criteria of 4.5-months of import cover,
- The improving current account position which narrowed to 4.8% of GDP in the 12 months to December 2020 compared to 5.8% of GDP during a similar period in 2019, and,
- Improving diaspora remittances evidenced by a 27.1% y/y increase to USD 290.8 mn in March 2021, from USD 228.8 mn recorded over the same period in 2020, has cushioned the shilling against further depreciation.
Weekly Highlights:
- April Stanbic PMI Figures
The headline Purchasing Managers’ Index (PMI) for the month of April, 2021 declined to 41.5 from the 50.6 recorded in March 2021, attributable to a decline in new orders, which was mainly driven by the partial lockdown and increased curfew hours seen in major parts of the country. New business declined at a pace mirroring that seen during the initial COVID-19 lockdown in H1’2020, and as a result, firms cut employment numbers for the first time in seven months. See below a chart summarising the evolution of the PMI over the last 24 months:
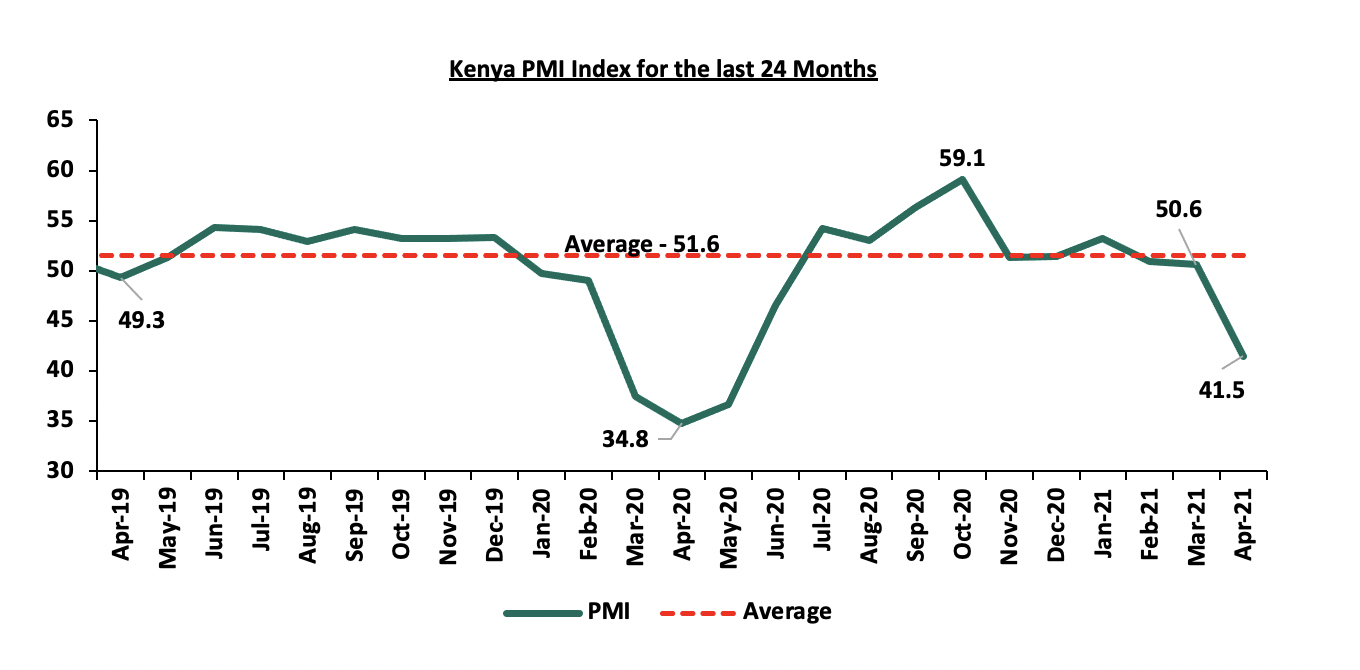
*** Key to note, a reading above 50.0 signals an improvement in business conditions, while readings below 50.0 indicate a deterioration
- April 2021 KRA Revenue Collection
The Kenya Revenue Authority (KRA) surpassed the revenue target collection for the month of April 2021 by recording a collection of Kshs 176.7 bn against a target of Kshs 170.2 bn, the collection was a 23.9% increase from the Kshs 144.1 bn collected in April 2020. Notably, this is the fifth month in a row that KRA has surpassed the revenue collection targets, mainly attributable to the enhanced Debt collection program adopted by KRA and the reversal of tax cut measures in January 2021 that had been put in place in April 2020 to cushion the economy from the impact of the COVID-19 pandemic. We expect revenue collection to continue surpassing the set monthly targets given the recent reopening of the economy which will improve the business environment.
Finance Bill 2021
The Cabinet Secretary for National Treasury tabled the Finance Bill 2021 before parliament for consideration as part of the Fiscal year 2021/22 budget cycle to be accented to law by 30th June 2021. The bill seeks to amend several Acts including:
- The Excise Duty Act which will include an introduction of a 20.0% betting tax which had been scrapped in the Finance Bill 2020. The bill will also remove the 20.0% excise duty charged on bank loans which will bring down the total cost of borrowing,
- Value Added Tax (VAT) Act which will see an inclusion of some medical suppliers in to the list of VAT exempt goods, as well as the granting of powers to the National Treasury Cabinet Secretary to alter the VAT Act without seeking the approval of parliament,
- The Capital Markets Act Cap 485A which establishes a Capital Markets tribunal, as well as amending the powers of the Capital Markets and the time the tribunal takes to hear and determine an appeal and,
- The Retirement Benefits Act No 2 of 1997, where the managers, administrators and custodians shall be required to be registered under this Act, as well as setting out the regulations for registration and deregistration of these services providers,
The amendments are meant to generate additional tax collection as well as widening the current tax base. We see the changes as part of enhancing and strengthening the capital markets and ensuring that investors’ interests are protected. The other amendments will also boost the revenue collection especially given the huge size of the FY’2021/22 budget, standing at Kshs 3.1 tn.
- FY’2021/22 Budget Estimates
On 29th April 2021, the National Treasury presented its Budget Estimates for the next fiscal year, FY’2021/22. The budget is projected to increase by 5.6% to Kshs 3.1 tn from last year’s Kshs 2.9 tn. Overall, the country’s budget has been growing at a 10 year CAGR of 11.3% to Kshs 2,774.7 bn in FY 2020/21 from Kshs 947.8 bn in FY’ 2011/12. The table below shows the budget numbers over the last 10 years;
|
Comparison of the Budget Numbers over the last 10 years |
||||||||||
|
Item |
FY'11/12 |
FY'12/13 |
FY'13/14 |
FY'14/15 |
FY'15/16 |
FY'16/17 |
FY'17/18 |
FY'18/19 |
FY'19/20 |
FY'20/21 |
|
Total revenue |
748.2 |
845.1 |
1,001.0 |
1,107.8 |
1,219.1 |
1,400.6 |
1,522.4 |
1,671.1 |
1,737.0 |
1,892.6 |
|
External grants |
15.3 |
20.9 |
27.0 |
28.1 |
29.6 |
26.3 |
26.5 |
19.7 |
19.8 |
40.9 |
|
Total revenue & Grants |
763.5 |
866.1 |
1,028.0 |
1,135.9 |
1,248.7 |
1,426.9 |
1548.9 |
1,690.8 |
1,756.8 |
1,933.5 |
|
Recurrent expenditure |
647.1 |
808.3 |
814.5 |
895.2 |
982.6 |
1,142.4 |
1,349.7 |
1,496.2 |
1,645.2 |
1,826.7 |
|
Development expenditure |
300.7 |
298.9 |
319.3 |
510.1 |
485.4 |
645.8 |
469.7 |
542.0 |
594.3 |
589.7 |
|
County Transfer |
0.0 |
9.8 |
193.4 |
234.7 |
478.5 |
320.8 |
327.3 |
367.7 |
325.3 |
358.3 |
|
Total expenditure |
947.8 |
1,117.0 |
1,327.2 |
1,640.0 |
1,946.4 |
2,109.0 |
2,146.7 |
2,405.9 |
2,564.8 |
2,774.7 |
|
Fiscal deficit |
(184.3) |
(251.0) |
(299.2) |
(504.1) |
(697.8) |
(708.4) |
(597.7) |
(715.2) |
(808.0) |
(841.2) |
|
Deficit as % of GDP |
5.7% |
5.6% |
5.9% |
8.7% |
10.7% |
9.2% |
7.0% |
7.5% |
7.9% |
7.5% |
|
Net foreign borrowing |
98.5 |
62.2 |
104.7 |
217.5 |
269.9 |
385.7 |
355.0 |
414.5 |
340.4 |
346.8 |
|
Net domestic borrowing |
73.2 |
168.9 |
203.0 |
254.0 |
204.6 |
311.5 |
276.3 |
306.5 |
450.4 |
494.3 |
|
Total borrowing |
171.7 |
231.1 |
307.7 |
471.5 |
474.6 |
697.3 |
631.3 |
721.1 |
790.8 |
841.1 |
|
GDP Estimate |
3,244.5 |
4,506.2 |
5,044.2 |
5,811.2 |
6,508.1 |
7,695.2 |
8,524.7 |
9,510.4 |
10,175.2 |
11,275.8 |
The resources have been aligned to priority programs under the Big Four Agenda, the Third Medium Term Plan (2018-2022) of the Vision 2030 blueprint, and various initiatives under the Post Covid-19 Economic Recovery Strategy.
Below is a summary of the major changes as per the 2021 Budget Estimates:
|
Comparison of 2020/21 and 2021/22 Fiscal Year Budgets as per The 2021 Budget Estimates |
|||||
|
FY'2020/21 Budget |
FY'2020/21 Supplementary Budget I (a) |
FY'2021/22 Budget Policy Statement |
FY'2021/22 Budget Estimates (b) |
% Y/Y Change (a, b) |
|
|
Total revenue |
1,892.6 |
1,848.0 |
2,033.9 |
2,038.6 |
10.3% |
|
External grants |
40.9 |
73.0 |
46.1 |
62.0 |
(15.1%) |
|
Total revenue & external grants |
1,933.5 |
1,921.0 |
2,080.0 |
2,100.6 |
9.3% |
|
Recurrent expenditure |
1,826.7 |
1,835.1 |
1,986.0 |
2,019.2 |
10.0% |
|
Development expenditure & Net Lending |
589.7 |
653.0 |
609.1 |
619.5 |
(5.1%) |
|
County governments + contingencies |
358.3 |
403.9 |
414.9 |
414.8 |
2.7% |
|
Total expenditure |
2,774.7 |
2,892.0 |
3,010.0 |
3,053.5 |
5.6% |
|
Fiscal deficit excluding grants |
(841.1) |
(970.9) |
(930.0) |
(952.9) |
(1.9%) |
|
Deficit as % of GDP |
7.5% |
8.7% |
7.5% |
7.7% |
(1.0) |
|
Net foreign borrowing |
346.8 |
427.0 |
267.2 |
290.1 |
(32.1%) |
|
Net domestic borrowing |
494.3 |
543.9 |
662.8 |
662.8 |
21.9% |
|
Total borrowing |
841.1 |
970.9 |
930.0 |
952.9 |
(1.9%) |
|
GDP Estimate |
11,275.8 |
11,168.5 |
12,393.1 |
12,393.1 |
11.0% |
Source: National Treasury, Amounts in Kshs bns
- The 2021 Budget estimates point to a 5.6% increase of the budget, to Kshs 3.1 tn from Kshs 2.9 tn in the FY’ 2020/21 supplementary budget,
- Recurrent expenditure is set to increase by 10.0% to Kshs 2.0 tn, from Kshs 1.8 tn as per the supplementary budget, while development expenditure is projected to decline by 5.1% to Kshs 619.5 bn from Kshs 653.0 bn as per the FY’2020/21 supplementary budget. Under recurrent expenditures, ministerial recurrent expenditures increased by 4.8% to Kshs 1,321.7 bn, from Kshs 1,261.0 bn, while interest payment and pension increased by 21.5% to Kshs 697.5 bn from Kshs 574.1 bn in the FY2020/21 supplementary budget,
- The budget deficit is projected to decline to Kshs 952.9 bn (7.7% of GDP) from the projected Kshs 970.9 bn (8.7% of GDP) in the FY’2020/21 supplementary budget; in line with the International Monetary Fund’s (IMF’s) recommendation, in a bid to reduce Kenya’s public debt requirements,
- Revenue is projected to increase by 10.3% to Kshs 2.0 tn, from Kshs 1.9 tn in the FY’2020/21 supplementary budget, with measures already in place to work towards increasing the amount of revenue collected in the next fiscal year,
- Total borrowing is expected to decline by 1.9% to Kshs 952.9 bn from Kshs 970.9 bn as per the FY’2020/21 supplementary budget, and,
- Debt financing of the 2021/22 budget is estimated to consist of 30.4% foreign debt and 69.6% domestic debt, from 28.7% foreign and 71.3% domestic as per the FY’2020/21 supplementary budget,
Similar to governments across the world, the FY'2021/2022 budget estimates point to an expansionary budget in a bid to steer the country out of the pandemic-driven economic downturn. The budget is however hinged on meeting the revenue collection targets, expected to be boosted by the relaxation of the tax cushions that had been implemented during the peak of the pandemic last year. This premise however ought to be a factor of economic recovery which is still uncertain given the uncertainty surrounding the persistence of the pandemic. The fiscal deficit is estimated to reduce to 7.7% of GDP, mainly as a result of an expected decline in recurrent expenditure and an improvement in revenues. The latter will be highly dependent on how well the government will be able to implement some of the measures put in place. Debt sustainability continues to be a key concern, with the country’s public debt-to-GDP ratio having increased considerably over the past five years to 69.6% as at December 2020, from 44.3% as at the end of 2013, with half of the debt being external. In our view, there are still concerns on how the government will be able to meet its revenue collection targets given that the country is still experiencing effects from the third wave of the pandemic. However, changes that touch on tax revenues in the current environment where there is heightened uncertainty may have unintended budgetary consequences. For more analysis please see our FY2021-22 Budget Estimates Note.
Rates in the fixed income market have remained relatively stable due to the high liquidity in the money markets, coupled with the discipline by the Central Bank as they reject expensive bids. The government is 0.1% behind its prorated borrowing target of Kshs 473.6 bn having borrowed Kshs 473.2 bn. In our view, due to the current subdued economic performance brought about by the effects of the COVID-19 pandemic, the government will record a shortfall in revenue collection with the target having been set at Kshs 1.9 tn for FY’2020/2021, thus leading to a larger budget deficit than the projected 7.5% of GDP. The high deficit and the lower credit rating from S&P Global to 'B' from 'B+' will mean that the government might be forced to borrow more from the domestic market which will ultimately create uncertainty in the interest rate environment. In our view, investors should be biased towards short-term fixed income securities to reduce duration risk.
Markets Performance
During the week, the equities market recorded mixed performance, with NASI and NSE 25 gaining by 1.1% and 1.4% respectively, while NSE 20 declined marginally by 0.2%, taking their YTD performance to gains of 12.5% and 9.3% for NASI and NSE 25, respectively, and a loss of 0.5% for NSE 20. The equities market performance was driven by gains recorded by large-cap stocks such as KCB Group, Equity Group, Co-operative Bank and BAT of 4.2%, 4.1%, 3.3% and 3.0%, respectively. The gains were however weighed down by losses recorded by stocks such as Bamburi, Standard Chartered Bank, Diamond Trust Bank (DTB-K) and NCBA Group which declined by 2.5%, 1.7%, 1.5% and 1.4%, respectively.
During the week, equities turnover increased by 9.9% to USD 24.9 mn, from USD 22.7 mn recorded the previous week, taking the YTD turnover to USD 404.9 mn. Foreign investors remained net buyers, with a net buying position of USD 6.8 mn, from a net buying position of USD 8.6 mn recorded the previous week, taking the YTD net selling position to USD 2.4 mn.
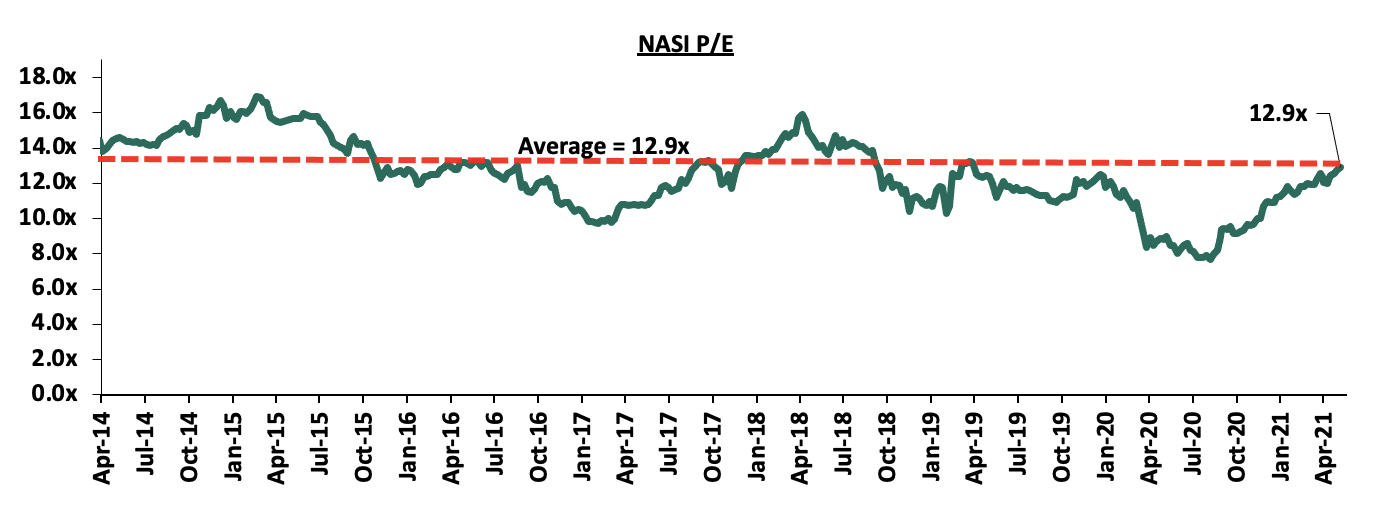
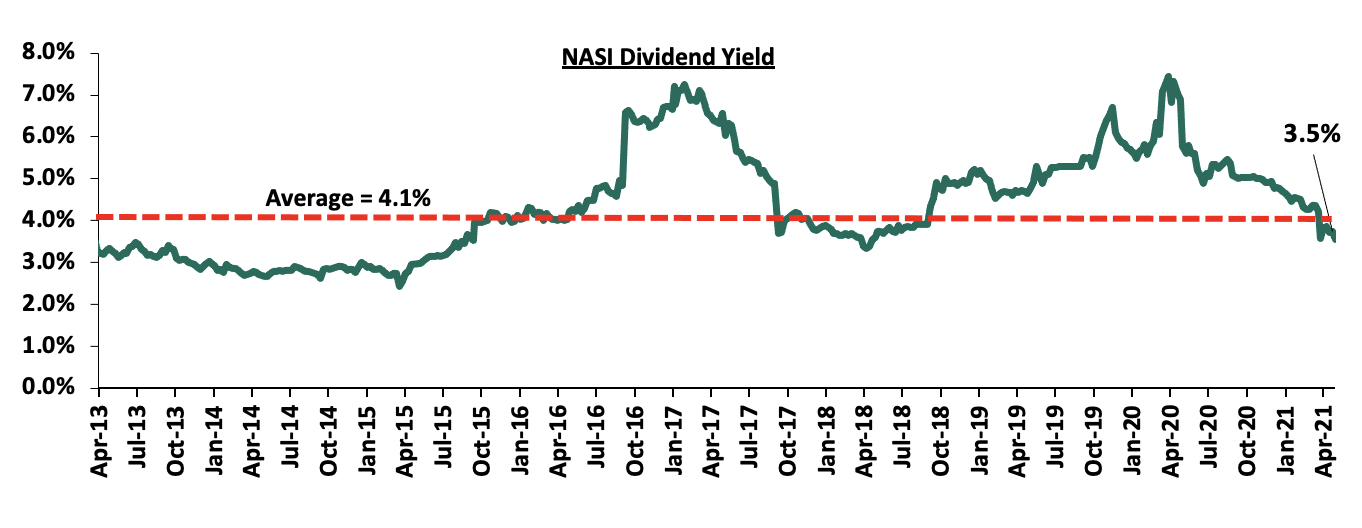
The market is currently trading at a price to earnings ratio (P/E) of 12.87x, 0.3% below the historical average of 12.91x, and a dividend yield of 3.5%, 0.6% points below the historical average of 4.1%. The current NASI P/E of 12.9x is the highest it has been since March 2019. Key to note, NASI’s PEG ratio currently stands at 1.4x, an indication that the market is trading at a premium to its future earnings growth. Basically, a PEG ratio greater than 1.0x indicates the market may be overvalued while a PEG ratio less than 1.0x indicates that the market is undervalued. The current P/E valuation of 12.9x is 67.1% above the most recent trough valuation of 7.7x experienced in the first week of August 2020. The charts below indicate the historical P/E and dividend yields of the market.
Weekly Highlight:
- CBK Credit Survey Report – Q1’2021
During the week, the Central Bank of Kenya (CBK), released the Commercial Banks’ Credit Survey Report for the quarter ended March 2021. The quarterly Credit Officer Survey is undertaken by the CBK to identify the potential drivers of credit risk in the banking sector. For the quarter ended 31st March 2021, 38 operating commercial banks and 1 mortgage finance company participated in the Commercial Banks Credit Officer Survey. The report highlights that Profit Before Tax (PBT) for the banking sector increased by 19.7% y/y to Kshs 45.9 bn in Q1’2021, from Kshs 38.3 bn in Q1’2020, attributable to the recovery of the economy as restrictions had since been eased, especially on travel and curfew times, leading to an improved business environment. Other key take-outs from the report include:
- The banking sector’s loan book recorded a 6.8% y/y growth, with gross loans increasing to Kshs 3.04 tn in March 2021, from Kshs 2.85 tn in March 2020. On a q/q basis, the loan book increased by 1.4% from Kshs 3.00 tn in December 2020,
- The aggregate balance sheet recorded a 10.5% increase y/y to Kshs 5.5 tn in Q1’2021, from Kshs 5.0 tn in Q1’2020, attributable to a 12.1% growth in deposits to Kshs 4.1 tn in Q1’2021, from Kshs 3.7 tn in Q1’2020, coupled with a 6.8% increase in gross loans to Kshs 3.0 tn in March 2021, from Kshs 2.8 tn in March 2020. Quarterly, the balance sheet grew by 2.0% to Kshs 5.5 tn in March 2021, from Kshs 5.4 tn in December 2020,
- Asset quality in the banking sector deteriorated, with the Gross NPL ratio increasing to 14.6% in Q1’2021, from 12.5% in Q1’2020 and 14.1% in Q4’2020. Some the key sectors adversely affected include Personal and Household, Real Estate, Transport and Communication, Tourism, and Trade,
- The capital adequacy remained okay with the ratio increasing to 18.9%, from 18.5% recorded in March 2020 and 19.2% in December 2020. During the quarter, the total capital increased by 1.0% and the total risk weighted assets increased by 2.7% bringing the capital adequacy ratio to18.9%, 4.4% points above the minimum statutory limit of 14.5%,
- IFRS 9 implementation had an adverse effect on the banking sector’s capital adequacy as a result of increased provisioning due to the challenging business environment. Commercial banks have therefore injected additional capital to accommodate the expected increase in credit losses. Direct capital injection increased by 7.0% in Q1’2021, and,
- Average liquidity in the banking sector increased to 56.3% in March 2021, from 51.5% in March 2020 and 54.6% in December 2020. This was 36.3% points above the minimum statutory ratio of 20.0%. The increased liquidity led to a 54.0% quarterly drop in interbank activity and was supported by a 47.0% increase in deposits, 24.0% in government securities maturities, 18.0% loan recovery and 7.0% direct capital injection.
Despite the CBK’s efforts to cushion the sector against any pandemic related shocks, credit risk remained elevated and with the lock-downs in April, the situation could have worsened. As per our FY’2020 Banking Sector Report, we expect the banking sector to continue over-provisioning albeit at a slower rate than in 2020. Additionally, we expect the sector will continue to remain resilient having implemented tightened credit standards on granting of new loans coupled with the expiry of the emergency measures on loan restructuring for borrowers, and the removal of the waiver of fees on bank transfers which will, in turn, increase the sector’s profitability.
- I&M Holdings PLC Acquisition of Oriental Bank Uganda
During the week, I&M Holdings PLC announced that it has completed the 90.0% acquisition of Orient Bank Limited Uganda (OBL) share capital, after receiving all the required regulatory approvals. As highlighted in our Cytonn Weekly #50/2020, I&M Holdings was set to pay Kshs 3.6 bn for the deal; which translated to a Price to Book Value (P/Bv) of 1.1x. The valuation of 1.1x P/Bv is 0.1x lower than the 7-year average which is at 1.2x P/Bv, but higher than the last one-year average, which is at 0.7x P/Bv and the average P/Bv in the listed banking stocks of 0.8x. Additionally, I&M Holdings will take over 14 branches from OBL, taking its total branches to 80, from 66 branches as at the end of 2020. Below is a table showing the combined pro-forma financials for the banks:
|
Combined Pro forma Balance Sheet (Kshs bn) |
|||
|
Balance Sheet |
I&M Holdings FY'2020 |
Orient Bank Ltd* |
Combined Entity |
|
Net Loans |
187.4 |
7.7 |
195.1 |
|
Total Assets |
358.1 |
23.0 |
381.1 |
|
Customer Deposits |
262.7 |
18.2 |
280.9 |
|
Number of Branches |
66 |
14 |
80 |
|
*Orient Bank Figures as at December 2019 apart from Loans and Deposits which are as reported on 3rd April 2021 |
|||
In our view, the diversification into the Ugandan market will see I&M Holdings reduce its reliance on the Kenyan Market. We believe that Uganda will continue to attract more Kenyan banks given its attractive interest rate spread which stood at 10.5% in 2018, higher than Tanzania’s 9.2% and Kenya’s 4.8% over the same period. Currently, banks such as KCB Group, Equity Group and DTB Group have ventured into the Ugandan market, making I&M Holdings the fourth Kenyan bank to tap into the market.
Below is a summary of the deals in the last 7-years that have either happened, been announced or expected to be concluded:
|
Acquirer |
Bank Acquired |
Book Value at Acquisition (Kshs bn) |
Transaction Stake |
Transaction Value (Kshs bn) |
P/Bv Multiple |
Date |
|
I&M Holdings PLC |
Orient Bank Limited Uganda |
3.3 |
90.0% |
3.6 |
1.1x |
April-21 |
|
KCB Group |
Banque Populaire du Rwanda |
5.2 |
62.1% |
5.7 |
1.1x |
Nov-20* |
|
KCB Group |
ABC Tanzania |
Unknown |
100.0% |
Undisclosed |
0.4x |
Nov-20* |
|
Co-operative Bank |
Jamii Bora Bank |
3.4 |
90.0% |
1 |
0.3x |
Aug-20 |
|
Commercial International Bank |
Mayfair Bank Limited |
1 |
51.0% |
Undisclosed |
N/D |
May-20* |
|
Access Bank PLC (Nigeria) |
Transnational Bank PLC. |
1.9 |
100.0% |
1.4 |
0.7x |
Feb-20* |
|
Equity Group ** |
Banque Commerciale Du Congo |
8.9 |
66.5% |
10.3 |
1.2x |
Nov-19* |
|
KCB Group |
National Bank of Kenya |
7 |
100.0% |
6.6 |
0.9x |
Sep-19 |
|
CBA Group |
NIC Group |
33.5 |
53%:47% |
23 |
0.7x |
Sep-19 |
|
Oiko Credit |
Credit Bank |
3 |
22.8% |
1 |
1.5x |
Aug-19 |
|
CBA Group** |
Jamii Bora Bank |
3.4 |
100.0% |
1.4 |
0.4x |
Jan-19 |
|
AfricInvest Azure |
Prime Bank |
21.2 |
24.2% |
5.1 |
1.0x |
Jan-18 |
|
KCB Group |
Imperial Bank |
Unknown |
Undisclosed |
Undisclosed |
N/A |
Dec-18 |
|
SBM Bank Kenya |
Chase Bank Ltd |
Unknown |
75.0% |
Undisclosed |
N/A |
Aug-18 |
|
DTBK |
Habib Bank Kenya |
2.4 |
100.0% |
1.8 |
0.8x |
Mar-17 |
|
SBM Holdings |
Fidelity Commercial Bank |
1.8 |
100.0% |
2.8 |
1.6x |
Nov-16 |
|
M Bank |
Oriental Commercial Bank |
1.8 |
51.0% |
1.3 |
1.4x |
Jun-16 |
|
I&M Holdings |
Giro Commercial Bank |
3 |
100.0% |
5 |
1.7x |
Jun-16 |
|
Mwalimu SACCO |
Equatorial Commercial Bank |
1.2 |
75.0% |
2.6 |
2.3x |
Mar-15 |
|
Centum |
K-Rep Bank |
2.1 |
66.0% |
2.5 |
1.8x |
Jul-14 |
|
GT Bank |
Fina Bank Group |
3.9 |
70.0% |
8.6 |
3.2x |
Nov-13 |
|
Average |
|
|
76.7% |
|
1.2x |
|
|
* Announcement Date ** Deals that were dropped |
||||||
Universe of Coverage
Below is a summary of our universe of coverage and the recommendations:
|
Company |
Price at 07/5/2021 |
w/w change |
YTD Change |
Target Price* |
Dividend Yield |
Upside/ Downside** |
P/TBv Multiple |
Recommendation |
|
I&M Holdings*** |
42.6 |
(3.3%) |
(5.0%) |
59.5 |
5.3% |
45.0% |
0.6x |
Buy |
|
Kenya Reinsurance |
2.4 |
(3.2%) |
3.5% |
3.3 |
4.2% |
42.3% |
0.3x |
Buy |
|
Standard Chartered*** |
131.8 |
(1.7%) |
(8.8%) |
164.4 |
8.0% |
32.8% |
0.9x |
Buy |
|
Diamond Trust Bank*** |
64.3 |
(1.5%) |
(16.3%) |
84.3 |
0.0% |
31.2% |
0.3x |
Buy |
|
Liberty Holdings |
7.6 |
2.7% |
(1.6%) |
9.8 |
0.0% |
29.3% |
0.6x |
Buy |
|
Stanbic Holdings |
81.0 |
(2.4%) |
(4.7%) |
99.4 |
4.7% |
27.4% |
0.8x |
Buy |
|
Britam |
7.0 |
3.9% |
0.0% |
8.6 |
0.0% |
22.9% |
1.3x |
Buy |
|
Sanlam |
11.5 |
0.0% |
(11.5%) |
14.0 |
0.0% |
21.7% |
1.0x |
Buy |
|
NCBA*** |
24.6 |
(1.4%) |
(7.5%) |
28.4 |
6.1% |
21.5% |
0.6x |
Buy |
|
Equity Group*** |
40.8 |
4.1% |
12.4% |
49.5 |
0.0% |
21.5% |
1.3x |
Buy |
|
KCB Group*** |
42.0 |
4.2% |
9.2% |
49.8 |
2.4% |
21.1% |
1.0x |
Buy |
|
ABSA Bank*** |
8.8 |
(0.2%) |
(8.0%) |
10.2 |
0.0% |
16.4% |
1.0x |
Accumulate |
|
Co-op Bank*** |
12.6 |
3.3% |
0.4% |
13.6 |
7.9% |
15.9% |
0.9x |
Accumulate |
|
Jubilee Holdings |
284.8 |
1.1% |
3.3% |
313.8 |
3.2% |
13.3% |
0.6x |
Accumulate |
|
HF Group |
3.7 |
(7.3%) |
17.2% |
3.8 |
0.0% |
3.3% |
0.2x |
Lighten |
|
CIC Group |
2.2 |
(0.5%) |
2.8% |
2.1 |
0.0% |
(3.2%) |
0.7x |
Sell |
We are “Neutral” on the Equities markets in the short term. With the market currently trading at a premium to its future growth (PEG Ratio at 1.4x), we believe that investors should reposition towards companies with a strong earnings growth and are trading at discounts to their intrinsic value. Additionally, we expect the recent discovery of new strains of COVID-19 coupled with the introduction of strict lockdown measures in major economies to continue dampening the economic outlook.
- Industry Reports
With the budget set to be read, some of the key beneficiaries in the real estate sector include:
- Roads received a total of Kshs 182.5 bn, with Kshs 92.3 bn allocated for construction of new roads and bridges while rehabilitation and maintenance works were allocated a total of Kshs 90.2 bn. The allocation for roads increased by 0.6% from Kshs 181.4 bn in FY’2020/21 to Kshs 182.5 bn in FY’2021/22 which is expected to make the real estate supply chain efficient and lower the transport costs for investors,
- Housing, Urban Development and Public Works received a total of Kshs 21.7 bn, a 33.9% increase from FY’2020/21 with Kenya Mortgage Refinance Company (KMRC) receiving Kshs 8.0 bn to fund affordable housing projects and Kshs 3.5 bn for operationalization with other key areas in the residential sector including construction of urban housing units and Kenya Informal Settlement Improvement Phase II receiving an allocation of Kshs 1.2 bn and Kshs 3.5 bn respectively. The affordable housing programs are expected to increase Kenyan home ownership percentages from the current 21.3% as at 2019 to level with its peers such as South Africa who had a 53.0% home ownership percentages at the same period, and,
- The tourism sector received a total allocation of Kshs 18.1 bn with the Tourism Promotion Fund (TPF) receiving Kshs 0.6 bn and Tourism Fund getting receiving Kshs 2.4 bn with other allocations going to improvements of supporting infrastructures. The allocation for the tourism sector decreased by 11.3% from Kshs 20.4 bn in FY’2020/21 to Kshs 18.1 bn in FY’2021/22 as the sector looks to bounce back gradually after being one the hardest hit sector by the COVID-19 pandemic.
The graph below shows comparison among road, tourism and housing budgetary estimate allocations in the last five fiscal years;
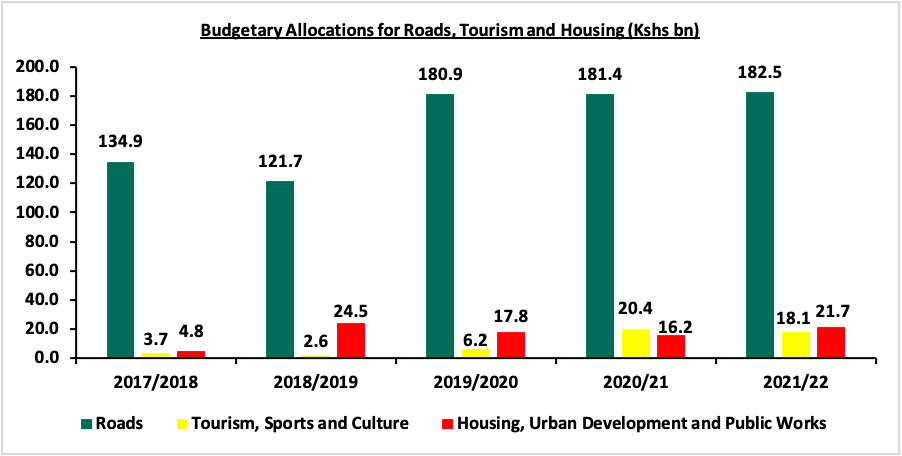
Source: National Treasury of Kenya
- Residential Sector
During the week, Kenya Mortgage Refinance Company (KMRC), a treasury backed lender, appointed three advisors namely; NCBA Investment Bank, Lion’s Head Global Partners and Mboya Wangong’u & Waiyaki Advocates, to guide it during its planned green bond issue targeted for July to September this year whose proceeds will be channelled to banks and SACCOs to offer affordable home loans. The advisors are considering a number of market factors before settling on the amount to be raised, such as the returns to be offered to investors and the repayment periods that will be favourable in promoting high subscription rates of the bond.The KMRC green bond will be the second of its kind after property developer Acorn Holdings issued the first green bond in January 2020, which raised Kshs 4.3 bn at a rate 12.3%. KMRC is expected to issue the bond at a rate of 5.0% enabling primary mortgage lenders (PMLs) mainly banks and SACCOs to offer mortgages at 7.0% which is 6.0% points lower than the market average of approximately 13.0%. The targeted rates are too low for the capital markets given that the government which is considered risk free raised a 25 year bond this month at a rate of 13.9%. To be able to get capital at those prices, the institution may have to consider partnering with development institutions like the World Bank. The move by KMRC is a step in the right direction towards facilitating home ownership by promoting easier access to mortgages in Kenya which has been considerably declining with the current mortgage to GDP ratio being 2.2% as at 2020, a 0.3% points decline from 2.5% in 2019, while other countries’ ratios such as Namibia and South Africa are at 25.4% and 19.6%, respectively. The initiative is also expected to increase mortgage uptake which has remained low with 27,993 mortgage loan accounts in the Kenyan market as at December 2019 out of an adult population of more than 24 million.
The graph below shows mortgage to GDP ratios of different countries compared to Kenya as of 2019;
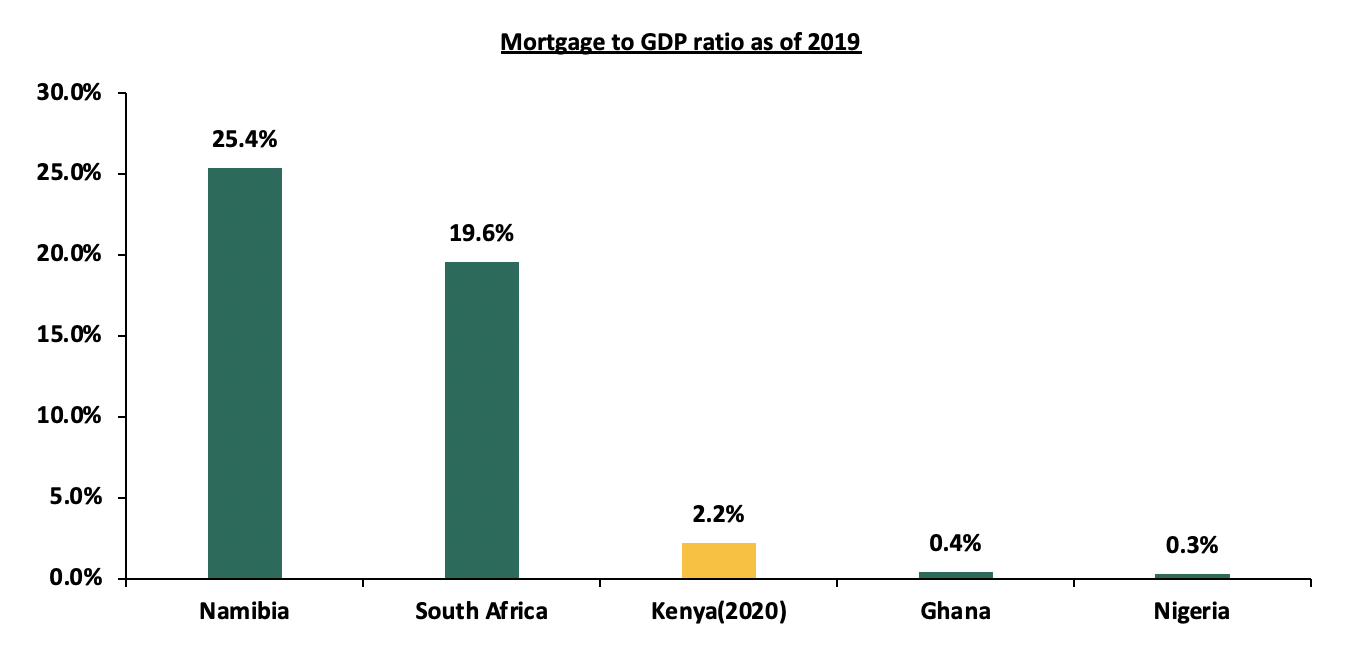
Source: Centre for Affordable Housing Finance in Africa
Also during the week, property developer Acorn Holdings announced plans to restrict construction of their student hostels to within a 3.0 km radius of targeted institutions in order to attract more students and to reduce students’ transport costs. The company has been making efforts to put purpose-built student accommodation hostels in various strategic locations such as Madaraka, Parklands and Jogoo Road with the latter being located as far as 7.0 km from the target institutions such as University of Nairobi making it difficult for students to commute to and from due to frequent traffic jams hence affecting the occupancy.
The company’s upcoming projects include the Kshs 810.0 mn Nairobi West Qwetu hostels targeting Strathmore University, the Kshs 880.0 mn Qwetu 3 and Kshs 740.0 mn Qwetu 4 developments targeting United States International University Africa (USIU Africa) set for completion by May 2021. Qwetu Hurlingham Phase I costing 990.0 mn is expected to be completed by May 2021 while the Kshs 970.0 mn Qwetu Chiromo Phase I will be completed by January 2022. Modern student housing continues to gain momentum, with investors looking to profit from the high returns on offer in the face of rising demand for student housing as a result of the increasing student population. According to the Kenya National Bureau of Statistics, the number of available student housing in 2020 were 300,000, compared to a university enrolment of 509,473 with the exclusion of technical colleges. This implies that there is a huge deficit of student accommodation which has been accelerated by i) High land rates, ii) Insufficient access to funding, and, iii) Inadequate expertise to build and manage student housing. Student accommodation has relatively high yields of 7.3% as per the Cytonn Student Housing Market Kenya Research compared to other real estate sectors like the residential and mixed-use developments which have an average rental yield of 4.7% and 7.1% respectively.
The graph below shows the performance of different real estate classes in 2020;
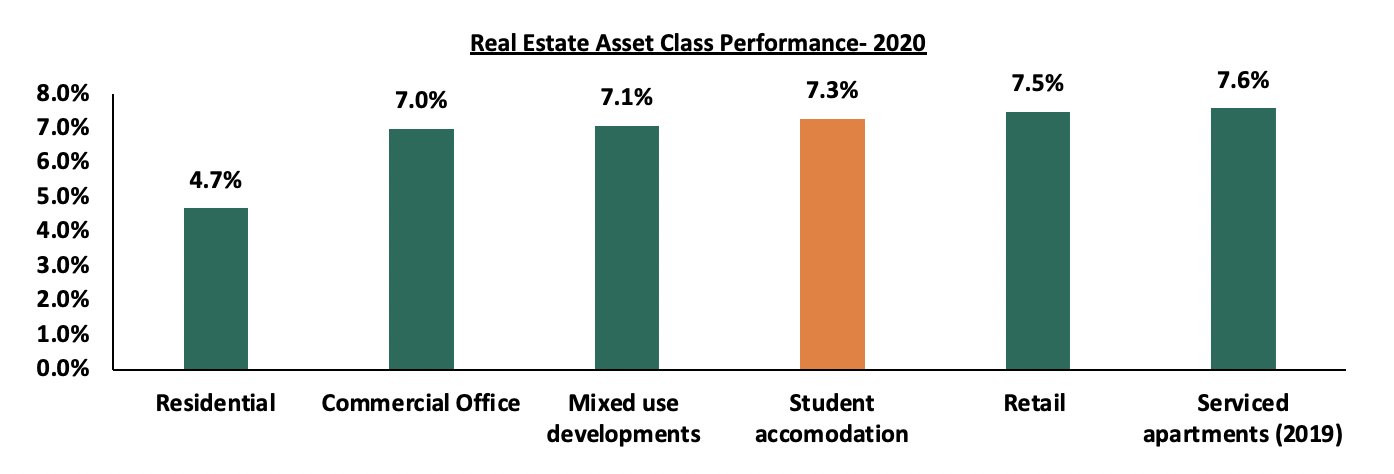 Source: Cytonn Research
We expect investment in student accommodation to continue gaining traction as it continues to attract high returns on their investment, with reopening of learning institutions expected to lead to higher occupancies and rental yields for the student housing sector.
- Retail Sector
During the week, Naivas supermarket, a local retail chain, announced plans to open 3 stores by mid-June 2021, in an expansion drive that will see it take up spaces previously occupied by Tuskys Supermarket, ie Muindi Mbingu Street in Nairobi’s Central Business District (CBD), and Simba Club Hall in Kisumu, and Githurai 44 on Kamiti Road. This will bring the retailer’s operational outlets to 74, having opened 2 outlets so far this year. The decision to open the stores is supported by; i) a rising middle class with increased disposable income, ii) the exit of local retailers such as Tuskys Supermarket leaving prime retail space to let, iii) stiff market share competition with closest rival QuickMart and Carrefour having a total of 40 and 13 branches respectively nationwide, and, iv) improved infrastructure such as roads creating easier and faster access to the retail outlets.
In terms of performance, according to our Kenya Retail Sector Report 2020, Nairobi recorded an average rental yield of 7.5% against the market average rental yield of 6.7% implying that Nairobi continues to offer an attractive investment opportunity for retail chains. Moreover, Naivas is leveraging on lower rental rates in Kisumu of Kshs 97.2 against the market average rental prices of Kshs 115.1 which offers attractive opportunity for space uptake by the retail chains due to affordability.
The table below shows the summary of the retail performance of key urban centres in Kenya;
|
Summary Performance of Key Urban Cities in Kenya |
||||
|
Region |
Rent/SQFT 2020 |
Occupancy% 2020 |
Rental Yield |
|
|
Mount Kenya |
125 |
78.0% |
7.7% |
|
|
Nairobi |
168.5 |
74.5% |
7.5% |
|
|
Mombasa |
114.4 |
76.3% |
6.6% |
|
|
Kisumu |
97.2 |
74.0% |
6.3% |
|
|
Eldoret |
130 |
80.2% |
5.9% |
|
|
Nakuru |
55.7 |
76.6% |
5.9% |
|
|
Average |
115.1 |
76.6% |
6.7% |
|
Source: Cytonn research
The table below shows the summary of the number of stores of the key local and international retail supermarket chains in Kenya;
|
Main Local and International Retail Supermarket Chains |
|||||||
|
Name of Retailer |
Category |
Highest number of branches that have ever existed as at FY’2018 |
Highest number of branches that have ever existed as at FY’2019 |
Highest number of branches that have ever existed as at FY’2020 |
Number of branches opened in 2021 |
Closed branches |
Current number of Branches |
|
Naivas |
Local |
46 |
61 |
69 |
2 |
0 |
71 |
|
Tuskys |
Local |
53 |
64 |
64 |
0 |
61 |
3 |
|
QuickMart |
Local |
10 |
29 |
37 |
3 |
0 |
40 |
|
Chandarana Foodplus |
Local |
14 |
19 |
20 |
0 |
0 |
20 |
|
Carrefour |
International |
6 |
7 |
9 |
4 |
0 |
13 |
|
Cleanshelf |
Local |
9 |
10 |
11 |
1 |
0 |
12 |
|
Uchumi |
Local |
37 |
37 |
37 |
0 |
35 |
2 |
|
Game Stores |
International |
2 |
2 |
3 |
0 |
0 |
3 |
|
Choppies |
International |
13 |
15 |
15 |
0 |
13 |
2 |
|
Shoprite |
International |
2 |
4 |
4 |
0 |
3 |
1 |
|
Nakumatt |
Local |
65 |
65 |
65 |
0 |
65 |
0 |
|
Total |
257 |
313 |
334 |
10 |
177 |
167 |
|
Source: Online Research
Additionally, Tuskys supermarket, announced plans to sell its non-essential assets including furniture, fixes and fittings in 19 of its branches. The sale of these assets is expected to generate Kshs 911.0 mn, which will be used to settle some of the creditor’s debts even as the firm continues to pursue external financing. The retailer continues to struggle to stay afloat having signed a deal with an undisclosed Mauritius based private-equity firm in August 2020 to raise Kshs 2.1 bn short-term debt for stabilizing its operations. However, Tuskys allegedly only received Kshs 500.0 mn and continues to be faced with financial woes and legal tussles arguing that its financial position remains redeemable and its business commercially viable. In our view, for Tuskys to survive, they need to i) ensure proper corporate governance independent of the owners, ii) partner with more private equity funds to help in offsetting debts and giving access to working capital, iii) diversify sales through e-commerce to increase revenues, and, iv) ensure proper supply chain management.
Kenya’s retail sector performance continues to be affected by the exit of troubled retailers such as Tuskys. However, we expect the sector to be cushioned by expansion of local and international retailers such as Naivas and Carrefour taking up space hence reduce the oversupply of approximately 2.0mn SQFT in the Kenyan retail market.
The real estate sector performance is expected to record increased activities following focus on affordable housing options through the KMRC and expansion of local and international retail chains taking up space left by troubled retailers.
Unit Trust Funds (UTFs) are collective investment schemes that pool funds from different investors and are managed by professional fund managers. The fund managers invest the pooled funds in a portfolio of securities with the aim of generating returns in line with the specific objectives of the fund. Following the release of the Capital Markets Authority (CMA) Quarterly Statistical Bulletin – Q1’2021, we examine the performance of Unit Trust Funds in Kenya with a key focus on the Money Market Fund as it has the largest market share of 89.6% as at December 2020. We shall analyze the following:
- Performance of the Unit Trust Funds Industry,
- Performance of Money Market Funds,
- Comparing Unit Trust Funds AUM Growth with Bank Deposits Growth, and,
- Conclusion
Section I: Performance of the Unit Trust Funds Industry
Unit Trust Funds are investment schemes that pool funds from investors and are managed by professional Fund Managers. The fund manager invests the pooled funds with the aim of generating returns in line with the specific objectives of the fund. The Unit Trust Funds earn returns in the form of dividends, interest income, rent and capital gains depending on the underlying security. The main types of Unit Trust Funds include:
- Money Market Fund – These are funds that invests in fixed income securities with high credit quality such as fixed deposits, treasury bills and bonds, commercial papers, etc. They are very liquid and have stable returns. They are suitable for risk averse investors,
- Equity Fund – These are funds which largely invests in listed securities and seek to offer superior returns over the medium to long-term by maximizing capital gains and dividend income. The funds invest in various sectors to reduce concentration of risk and maintain some portion of the fund’s cash in liquid fixed income investments to maintain liquidity,
- Balanced Fund – These are funds whose investments are diversified across the Equities and the Fixed Income market. The Balanced Fund offers investors long-term growth as well as reasonable levels of stability of income,
- Fixed Income Fund – This fund invests in interest-bearing securities, which include treasury bills, treasury bonds, preference shares, corporate bonds, loan stock, approved securities, notes and liquid assets consistent with the portfolio’s investment objective, and,
- Sector Specific Funds – These are funds that invest primarily in a particular sector or industry. The funds provide a greater measure of diversification within a given sector than may be otherwise possible for the other funds. They are specifically approved by the capital Markets Authority as they are not invested as per the set rules and regulations.
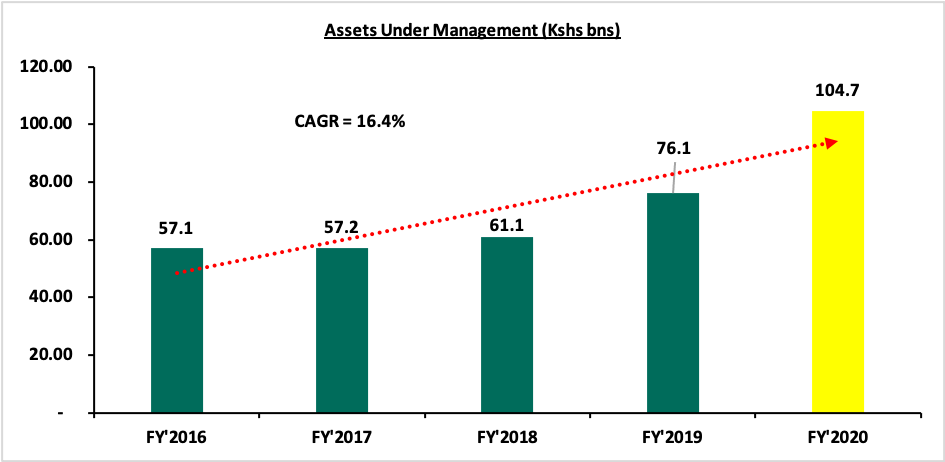
As per the Capital Markets Authority (CMA) Quarterly Statistical Bulletin – Q1’2021, the industry’s overall Assets Under Management (AUM) grew by 37.6% to Kshs 104.7 bn as at the end of FY’2020, from Kshs 76.1 bn as at the end of FY’2019. Assets Under Management of the Unit Trust Funds have grown at a 4-year CAGR of 16.4% to Kshs 104.7 bn in FY’2020, from Kshs 57.1 bn recorded in FY’2016.
This growth can be largely attributable to:
- Low Investments minimums: Unit Trust Funds have become more affordable to retail investors, with a majority of the Collective Investment Schemes’ (CIS) in the market requiring an initial investment ranging between Kshs 100.0 - Kshs 10,000.0,
- Investor Knowledge: There has been a drive towards investor education which has meant that people are more aware and are taking advantage of this,
- Diversified product offering: Unit Trust Funds are also advantageous in terms of offering investors the opportunity of diversifying their portfolios by providing them with access to a wider range of investment securities through pooling of funds, which would have not been accessible if they invested on their own,
- Efficiency and ease of access to cash/High Liquidity: Since they are invested as portfolios with different assets and the fund managers always maintain a cash buffer, they are relatively liquid and investors can get their cash on demand. Unit trusts are liquid, as it is easy to sell and buy units without depending on demand and supply at the time of investment or exit, and,
- Emergence of Fintech: the advent of digitization and automation within the industry has enhanced liquidity, enabling investors to receive their funds within 3 to 5 working days if they are withdrawing to their bank accounts, and immediate access to funds when withdrawing via M-PESA. This increases reliability making it possible for people to experiment on the investments.
According to the Capital Markets Authority, as at the end of FY’2020, there were 23 approved Collective Investment Schemes made up of 93 funds in Kenya. Out of the 23, however, only 19 were active while 4 were inactive. During the period under review, total Assets Under Management grew by 37.6% to Kshs 104.7 bn in FY’2020, from Kshs 76.1 bn as at FY’2019. The table below outlines the performance of the 23 Fund Managers of Unit Trust Funds in addition to Stanlib Kenya, which exited the market in June 2020, in terms of Assets under Management:
|
Assets Under Management (AUM) for the Approved and Active Collective Investment Schemes |
||||||
|
No. |
Fund Managers |
FY'2019 AUM (Kshs mns) |
FY'2019 Market Share |
FY'2020 AUM (Kshs mns) |
FY'2020 Market Share |
AUM Growth FY'2019 - FY'2020 |
|
1 |
CIC Asset Managers |
29,717.3 |
39.1% |
42,988.1 |
41.1% |
44.7% |
|
2 |
NCBA Unit Trust Scheme |
7,194.8 |
9.5% |
12,543.2 |
12.0% |
74.3% |
|
3 |
Britam |
9,780.4 |
12.9% |
12,304.8 |
11.8% |
25.8% |
|
4 |
ICEA Lion |
8,020.4 |
10.5% |
11,521.0 |
11.0% |
43.6% |
|
5 |
Sanlam Investments |
2,735.4 |
3.6% |
6,279.8 |
6.0% |
129.6% |
|
6 |
Old Mutual |
6,245.9 |
8.2% |
6,131.3 |
5.9% |
(1.8%) |
|
7 |
Dry Associates |
1,662.4 |
2.2% |
2,360.9 |
2.3% |
42.0% |
|
8 |
Madison Asset Managers |
1,594.6 |
2.1% |
1,928.6 |
1.8% |
20.9% |
|
9 |
African Alliance Kenya |
2,082.5 |
2.7% |
1,813.3 |
1.7% |
(12.9%) |
|
10 |
Nabo Capital (Centum) |
1,157.9 |
1.5% |
1,654.8 |
1.6% |
42.9% |
|
11 |
Zimele Asset Managers |
1,099.4 |
1.4% |
1,420.4 |
1.4% |
29.2% |
|
12 |
Co-op Trust Investment Services Limited |
5.3 |
0.0% |
1,007.1 |
1.0% |
19,051.8% |
|
13 |
Cytonn Asset Managers |
717.3 |
0.9% |
819.5 |
0.8% |
14.2% |
|
14 |
Genghis Capital |
466.0 |
0.6% |
700.0 |
0.7% |
50.2% |
|
15 |
Apollo Asset Managers |
523.1 |
0.7% |
587.3 |
0.6% |
12.3% |
|
16 |
Equity Investment Bank |
424.3 |
0.6% |
310.8 |
0.3% |
(26.8%) |
|
17 |
Alphafrica Asset Managers |
164.3 |
0.2% |
208.1 |
0.2% |
26.6% |
|
18 |
Amana Capital |
590.1 |
0.8% |
135.4 |
0.1% |
(77.1%) |
|
19 |
Wanafunzi Investments |
- |
0.0% |
0.5 |
0.0% |
- |
|
20 |
Stanlib Kenya |
1,917.1 |
2.5% |
- |
0.0% |
- |
|
21 |
Standard Investment Trust |
- |
- |
- |
- |
- |
|
22 |
Dyer and Blair Unit Trust Scheme |
- |
- |
- |
- |
- |
|
23 |
Diaspora Unit Trust Scheme |
- |
- |
- |
- |
- |
|
24 |
First Ethical Opportunities Fund |
- |
- |
- |
- |
- |
|
Total |
76,098.4 |
100.0% |
104,714.9 |
100.0% |
37.6% |
|
Source: Capital Markets Authority: Collective Investments Scheme Quarterly Report
Key to note from the above table:
- Assets Under Management: CIC Asset Managers remained the largest overall Unit Trust Fund Manager with an AUM of Kshs 43.0 bn in FY’2020, from an AUM of Kshs 29.7 bn as at FY’2019 translating to a 44.7% AUM growth,
- Market Share: CIC Asset Managers remained the largest overall Unit Trust with a market share of 41.1%, an increase from 39.1% in FY’2019. Key to note, NCBA Unit Trust Scheme recorded the highest increase in its market share with the market share increasing by 2.5% points to 12.0%, from 9.5% in FY’2019, and,
- Growth: In terms of AUM growth, Co-op Trust Investment Services Limited recorded the strongest growth of 19,051.8%, with its AUM increasing to Kshs 1,007.1 mn, from Kshs 5.3 mn in FY’2019 due to the low base effect. Cytonn Asset Managers recorded a growth of 14.2%, with its AUM increasing to Kshs 819.5 mn, from Kshs 717.3 mn in FY’2019. Amana Capital recorded the largest decline, with its AUM declining by 77.1% to Kshs 135.4 mn in FY’2020 from Kshs 590.1 mn in FY’2019.
Key to note, the decline in Stanlib’s AUM is mainly due to the Asset Manager’s exit in Kenya, which was effective June 2020. The fund manager attributed the exit to the significant operating losses incurred in both Kenya and Uganda. Standard Investment Trust, Dyer and Blair Unit Trust Scheme, Diaspora Unit Trust Scheme and First Ethical Opportunities Fund remained inactive as at the end of FY’2020.
Among unit trust products, Money Market Funds continued to be the most popular product in terms of market share, accounting for Kshs 93.9 bn, equivalent to 89.6% of all funds under management, an increase from 87.0% recorded in FY’2019 as shown in the table below;
|
Assets Under Management (AUM) by Type of Collective Investment Scheme (All values in Kshs mns unless stated otherwise) |
||||||
|
No. |
Product |
FY’2019 AUM |
FY’2020 AUM |
FY’2019 Market Share |
FY'2020 Market Share |
Variance (% Points) |
|
1 |
Money Market Funds |
66,193.0 |
93,858.9 |
87.0% |
89.6% |
2.6% |
|
2 |
Equity Fund |
4,485.2 |
3,560.3 |
5.9% |
3.4% |
(2.5%) |
|
3 |
Balanced Fund |
1,312.0 |
1,341.0 |
1.7% |
1.3% |
(0.4%) |
|
4 |
Others |
4,108.1 |
5,954.6 |
5.4% |
5.7% |
0.3% |
|
|
Total |
76,098.4 |
104,714.9 |
100.0% |
100.0% |
|
Source: Capital Markets Authority: Collective Investments Scheme Quarterly Report
Key take outs from the above table include:
- During the period under review, Money Market Funds recorded a 41.8% growth in the Assets Under Management, and consequently, their market share rose to 89.6% from 87.0% recorded in FY’2019, driven by local investors’ preference for capital preservation during the period of review,
- Equity funds recorded a 2.5% points market share decline to 3.4% from 5.9% in FY’2019, attributable to increased capital flight by investors from the fund as they sought for safe havens as well as the downward trend recorded in the equities market since the onset of the COVID-19 pandemic, which saw the Nairobi All Share Index (NASI) shed by 8.6% in FY’2020,
- Balanced Funds, on the other hand, ranked third in comparison to other products, with a market share of 1.3% in FY’2020 from 1.7% recorded in FY’2019, and,
- The Other Funds include Income Funds, Growth Funds, Wealth Funds, Diversified Funds, and Bond Funds.
Section II: Performance of Money Market Funds
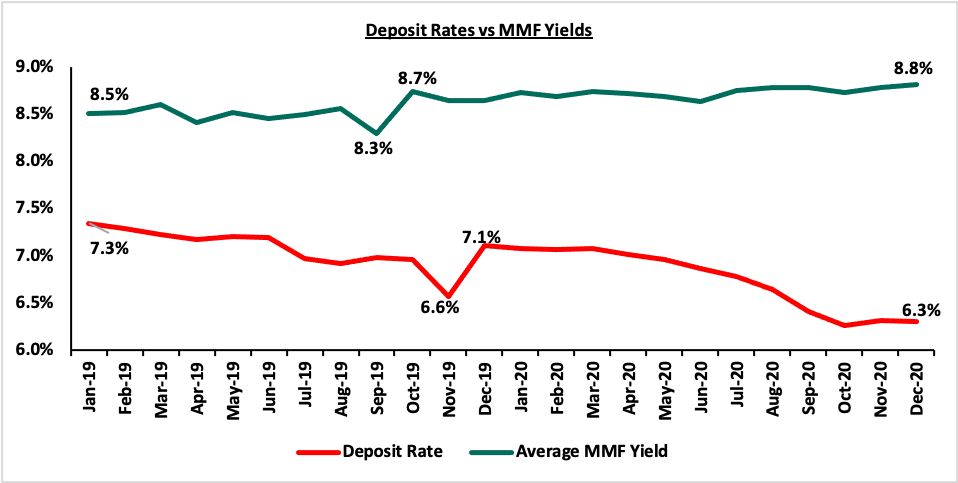
Money Market Funds (MMFs) in the recent past have gained popularity in Kenya, with one of the main reasons being the higher returns money market funds offer compared to the returns on bank deposits. This has been evidenced by Unit Trust Funds’ growth of 37.6% outpacing the listed banking sector’s deposit growth of 18.4% in FY’2020. According to the Central Bank of Kenya data, the average deposit rate during the year declined to 6.7%, from an average of 7.8% when the legislation on the deposit rate cap floor was in place.
As per regulations, funds in MMFs should be invested in liquid interest-bearing securities that have a weighted average maturity of less than 13 months. The asset allocation changes during the year is as shown below:
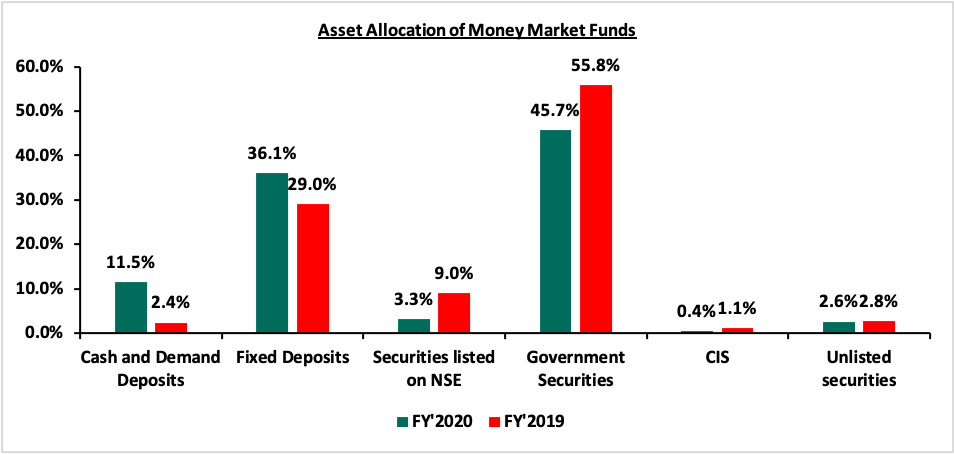
The allocation to cash and demand deposits and fixed deposits increased by 9.1% points and 7.1% points to 11.5% and 36.5% from 2.4% and 29.0% respectively while allocation to Securities listed on the NSE, Government Securities, Collective Investment Schemes (CIS) and unlisted securities declined by 5.7% points, 10.1% points, 0.7% points, and 0.2% points to 3.3%, 45.7%, 0.4% and 2.6% from 9.0%, 55.8%, 1.1% and 2.8%, respectively in FY’2020.
- Top Five (5) Money Market Funds by Assets Under Management
The total Assets Under Management in Money Market Funds grew by 41.8% to Kshs 93.9 bn in FY’2020, from Kshs 66.2 bn in FY’2019. The top five Money Market Funds control an AUM of Kshs 79.5 bn, which translates to 84.7% of the total AUM in Money Market Funds. The table below shows the top five Money Market Funds as at FY’2020:
|
Top 5 Money Market Funds by Assets Under Management |
||||||
|
No. |
Fund Managers |
FY’2019 Money Market Fund (Kshs Mns) |
FY’2020 Money Market Fund (Kshs Mns) |
FY’2019 Market Share |
FY’2020 Market Share |
Variance (% Points) |
|
1. |
CIC Money Market Fund |
29,016.0 |
42,435.6 |
44.0% |
45.2% |
1.2% |
|
2. |
NCBA Money Market Fund |
6,446.1 |
10,948.7 |
9.8% |
11.7% |
1.9% |
|
3. |
British-American Money Market Fund |
7,334.1 |
10,587.5 |
11.1% |
11.3% |
0.2% |
|
4. |
ICEA Lion Money Market Fund |
6,800.2 |
9,283.2 |
10.3% |
9.9% |
(0.4%) |
|
5. |
Sanlam Money Market Fund |
2,700.2 |
6,222.0 |
4.1% |
6.6% |
2.5% |
|
|
Total |
52,296.6 |
79,477.0 |
79.3% |
84.7% |
5.4% |
Source: Capital Markets Authority: Collective Investments Scheme Quarterly Report
- Top Five (5) Money Market Funds by Growth Rate
As at the end of FY’2020, Co-op Money Market Fund recorded the fastest growth in Assets under Management (AUM) coming in at 19,051.8% to Kshs 1,007.1 mn, from Kshs 5.3 mn recorded in FY’2019. The top five Money Market Funds in terms of growth rate recorded in FY’2020 is highlighted below:
|
Top 5 Money Market Funds by Growth Rate |
||||
|
No. |
Fund Manager |
FY'2019 AUM (Kshs Mns) |
FY'2020 (Kshs Mns) |
FY'2020 Growth Rate |
|
1 |
Co-op Money Market Fund |
5,258.5 |
1,007.1 |
19,051.8% |
|
2 |
Sanlam Money Market Fund |
2,700.2 |
6,222.0 |
130.4% |
|
3 |
NCBA Money Market Fund |
6,446.2 |
10,948.7 |
69.8% |
|
4 |
GenCapHela Imara Money Market Fund |
434.0 |
668.1 |
54.0% |
|
5 |
Alphafrica Kaisha Money Market Fund |
57.3 |
85.0 |
48.3% |
Source: Capital Markets Authority: Collective Investments Scheme Quarterly Report
- Top Five (5) Money Market Funds by Yields
During the period under review, the following Money Market Funds had the highest average effective annual yield declared, with the Cytonn Money Market Fund having the highest effective annual yield at 10.8% against the industrial average of 8.8%.
|
Top 5 Money Market Fund Yield in FY'2020 |
||
|
Rank |
Money Market Fund |
Effective Annual Rate (Average FY'2020) |
|
1 |
Cytonn Money Market Fund |
10.77% |
|
2 |
Zimele Money Market Fund |
9.91% |
|
3 |
Alphafrica Kaisha Money Market Fund |
9.81% |
|
4 |
Nabo Africa Money Market Fund |
9.73% |
|
5 |
CIC Money Market Fund |
9.47% |
|
|
Industrial Average |
8.80% |
Section III: Comparing Unit Trust Funds AUM Growth with Bank Deposits Growth
Unit Trust Funds assets recorded a y/y growth of 37.6% in FY’2020, while the listed bank deposits recorded a weighted y/y growth of 18.4% in FY’2020. The chart below highlights the Unit Trust Funds AUM growth vs bank deposits growth in 2020;
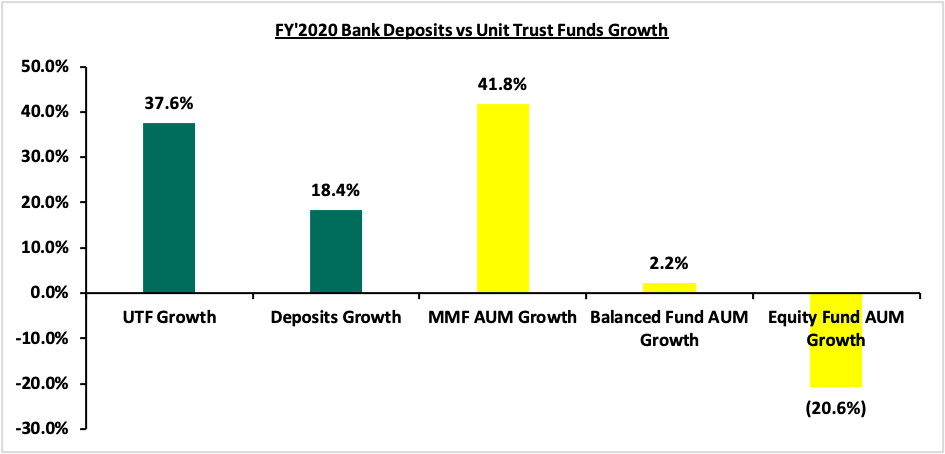
Key take outs from the graph above include:
- The Unit Trust Funds’ growth of 37.6% outpaced the listed banking sector’s deposit growth of 18.4% in FY’2020, an indication that there is increasing investor confidence in our capital markets, and,
- Money Market Funds grew at a rate of 41.8%, faster than the other UTFs, attributable to the fund’s affordability in its initial and additional investment requirements, its high liquidity ease of understanding by investors and lower volatility of return. While initial deposit and additional investments may vary depending on the fund, Money Market Funds present a low risk, affordable and high-yielding investment opportunity for investors and capital preservation.
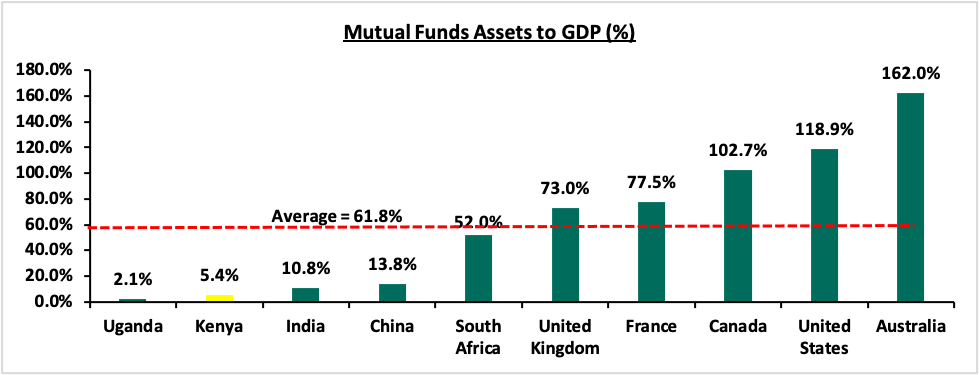
Despite Unit Trust Funds’ AUM growth outpacing that of listed banks, their AUM as at FY’2020 stood at 2.8% of the listed banking sector’s deposits. Kenya’s Mutual Funds/UTFs to GDP ratio at 5.4% is still very low compared to global average of 61.8%, showing that we still have room to improve and enhance our capital markets. The table below shows some countries’ mutual funds as a percentage of GDP:
Source: World Bank Data
In order to improve our Capital Markets and stimulate its growth, we recommend the following actions:
- Allow for sector funds: The current capital markets regulations require that funds must diversify. Consequently, one has to seek special dispensation in the form of sector funds such as a financial services fund, a technology fund or a real estate UTF fund. Regulations allowing unit holders to invest in sector funds would expand the scope of unit holders interested in investing,
- Reduce the minimum investments to reasonable amounts: Currently, the minimum investment for sector specific funds is Kshs 1.0 mn, while that for Development REITS is currently at Kshs 5.0 mn. With the national median income for employed people estimated at around Kshs 50,000, the high minimum initial and top up investments amounts are unreasonably high and therefore lock out a lot of potential investors. Additionally, as compared to the Yu’eBao investment fund in China where the minimum investment is Kshs 17.5 (USD 0.16), these high amounts discriminate against most retail investors giving them fewer investment choices,
- Eliminate conflicts of interest in the governance of capital markets: The capital markets regulations should enable a governance structure that is more responsive to market participants and market growth,
- Improve fund transparency to provide investors with more information: Each Unit Trust Fund should be required to publish their portfolio holdings on a quarterly basis to enhance transparency for investors. Given that this measure is among the new CIS guidelines which took effect on January 1st 2021, it is commendable that the CMA is enhancing transparency and uniformity in terms of reporting of results for UTFs, which will provide investors with more information and subsequently improve investor confidence, and,
- Create increased competition in the market by encouraging different players to set shop and offer different services such as the opening up of Trustees to non-financial institutions: Competition in capital markets will not only push Unit Trust Fund managers to provide higher returns for investors but will also eliminate conflicts of interest in markets and enhance the provision of innovative products and services.
Section IV: Conclusion
For continued growth of the capital markets, there is a need to leverage more on innovation and digitization in order to further propel the growth of UTFs in Kenya. For instance, China’s first online money market fund known as Yu’eBao had explosively grown into one of the world’s largest MMF, despite being launched in 2013. The use of technology as a distribution channel for mutual fund products opened up the fund manager to the retail segment, which is characterized by strong demand among retail clients for convenient and innovative products. Yu’eBao is however facing regulatory intervention, with the Chinese authorities setting a requirement for Yu’eBao to reduce its size citing the fund’s dominance and liquidity risk. This has seen the fund’s AUM decline by 18.6% to USD 148.4 bn as at March 2021 from USD 182.4 bn in December 2020. In our view, regulators should promote and facilitate growth of UTFs instead of impeding their expansion, which will enhance growth of capital markets and encourage entry of new players into the market.
Cytonn Asset Managers, which also leverages on technology such as USSD and digital platforms, experienced a growth of 14.2% to Kshs 819.5 mn in FY’2020, from Kshs 717.3 mn in FY’2019. The advent of digitization and automation within the industry has also enhanced liquidity. Cytonn Money Market Fund clients can issue withdrawal instructions and have funds remitted to their bank accounts within 2–4 working days while funds withdrawn through the USSD or digital platforms are remitted to their M-Pesa and Bank accounts within 5 minutes and 2 working days respectively; the Cytonn Money Market Fund is accessible through dialing *809#. As highlighted in our topical Potential Effects of COVID-19 on Money Market Funds, we believe that amidst the Coronavirus pandemic, returns for Money Market Funds will remain stable with a bias to a slight increase upwards should rates on government securities increase. They will also remain the most liquid of all mutual funds providing a short-term parking bay that earns higher income yields compared to deposits and savings accounts. UTFs provide a more convenient platform in terms of accessibility and liquidity with the additional benefit of higher returns for investors.

- Talk to us
- Kenya
- P.O Box 20695 - 00200, Nairobi, Kenya
- Cell +254709101200
- Tel +254709101200
- WhatsApp +254741676635
- United States
- +254709101200
- DOWNLOAD OUR APP
-


- Kenya
- 8th Floor, Pinetree Plaza, Kaburu Drive, Ngong Road, Nairobi, Kenya
- USA
- Suite 1150, 1775 Eye Street NW, USA, Washington DC 20006, USA
- Investments
- High Yield
- Private Equity
- Real Estate
- Real Estate
- RiverRun Estates
- Cytonn Towers
- The Ridge
- Taraji Heights
- The Alma