Student Housing Market in Kenya, & Cytonn Weekly #10/2020
By Research Team, Mar 8, 2020
Executive Summary
Fixed Income
During the week, T-bills remained oversubscribed, with the subscription rate coming in at 195.1%, down from 226.6% the previous week. The oversubscription is attributable to the continued favorable liquidity in the money market, evidenced by the average interbank rate having declined from 4.1% to 4.0%, as a result of government disbursements and local debt maturities. We note the continued pent up demand for the 364-day paper, having recorded the highest subscription rate of the three papers, which we attribute to the market having a bias to the shorter-dated papers to avoid duration risk. Given the scarcity of shorter-dated bonds in the primary market due to the government issuing medium-term and longer-dated papers in a bid to increase the debt maturity profile, this has seen most investors still keen on the primary fixed income market, finding the 364-day T-bill more attractive on a risk-adjusted return basis. According to Stanbic Bank’s Monthly Purchasing Manager’s Index (PMI), the Kenyan private sector economy suffered another difficult month with the February PMI declining to 49.0, from 49.7 in January 2020, pointing towards a decline in business conditions. A reading of above 50 indicates an improvement in the business environment, while a reading of below 50 indicates a worsening outlook. Weak cash flow in the economy has led to a drop in output in February, affecting business sales and operations with firms reducing their business activities;
Equities
During the week, the equities market was on an upward trajectory, with NASI, NSE 20 and NSE 25 gaining by 5.1%, 2.7%, and 5.8%, respectively, taking their YTD performance to losses of (6.2%), (9.6%), and (5.5%), for the NASI, NSE 20, and NSE 25, respectively. During the week, Stanbic Holdings released their FY’19 financial results, with core earnings per share increasing by 1.6% to Kshs 16.1, from Kshs 15.9 in FY’2018;
Real Estate
During the week, in the residential sector, Mizizi Africa Homes, a local property developer, launched its 18-unit development located along Kenyatta Road in Juja. In the Real Estate Investment Trust (REIT) sector, (i) Acorn Holdings Limited, a local property developer, announced that it was in the process of structuring a Development Real Estate Investment Trust (D-REIT) through which it will sell part of its ownership of its branded student hostels, and (ii) the Capital Markets Authority (CMA) and the Competition Authority of Kenya (CAK) approved the transfer of the Fahari I-REIT by Stanlib Kenya to ICEA Lion Asset Management;
Focus of the Week
This week our focus is on Student Housing, a highly fragmented market that has grown exponentially globally, recording an 11-year CAGR of 19.2% from a portfolio of USD 2.5 bn (Kshs 250.0 bn) in 2007 to USD 17.2 bn (Kshs 1.7 tn) in 2018, according to Knight Frank’s Global Student Property Report 2019. The sector has also consistently delivered higher returns compared to other real estate sectors and thus, gaining the attention of investors such as high net-worth individuals and institutional investors. The growth is on the backdrop of huge student housing deficits that are driven by the continued increase in student numbers, emphasis on higher education and thus, increase in tertiary institutions and a rapidly growing young population.
- Weekly Rates:
- Cytonn Money Market Fund closed the week at a yield of 11.0% p.a. To subscribe, just dial *809#;
- Cytonn High Yield Fund closed the week at a yield of 13.9% p.a. To subscribe, email us at sales@cytonn.com;
- Rodney Omukhulu, Assistant Investment Analyst, Cytonn Investments, was on CNBC where he discussed the plan to protect textile industries in the region as the government is considering to raise taxes on imported textiles between 30% and 35%. Watch Rodney here;
- David King’oo, Senior Risk and Compliance Associate, Cytonn Investments, was on K24 to talk about the impact of coronavirus on businesses across the globe. Watch David here;
- David Mwakitele, Head of Pensions, Cytonn Asset Managers, was on K24 to discuss planning for retirement at an early age. Watch David here;
- Having completed and handed over Phase 1 of The Alma, and on track to hand over Phase 2, we have now turned our attention towards construction of The Ridge in Ridgeways. The Ridge is Cytonn’s 800-unit residential mixed-use development on the Northern Bypass. For more information please email us at sales@cytonn.com. We are now running a promotion in Phase 1 of The Ridge: Buy a unit in Phase 1, and get a 5% discount with a 15% deposit in March;
- Phase 1 of The Alma is now 100% sold with early buyers having achieved up to 55% capital appreciation. We are now running a promotion in Phase 2: Buy a unit in Phase 2 with a 15-year payment plan and 0% deposit. For inquiries, please email us on clientservices@cytonn.com. The site is open between 8 am - 5 pm, 7-days a week for site visits;
- For an exclusive tour of Cytonn’s real estate developments, visit: Sharp Investor's Tour and for more information, email us at sales@cytonn.com;
- We continue to hold weekly workshops and site visits on how to build wealth through real estate investments. The weekly workshops and site visits target both investors looking to invest in real estate directly and those interested in high yield investment products to familiarize themselves with how we support our high yields. Watch progress videos and pictures of The Alma, Amara Ridge, and The Ridge;
- We continue to see very strong interest in our weekly Private Wealth Management Training (largely covering financial planning and structured products). The training is at no cost and is open only to pre-screened participants. We also continue to see institutions and investment groups interested in the training for their teams. Cytonn Foundation, under its financial literacy pillar, runs the Wealth Management Training. If interested in our Private Wealth Management Training for your employees or investment group, please get in touch with us through wmt@cytonn.com. To view the Wealth Management Training topics, click here;
- For recent news about the company, see our news section here;
- We have 10 investment-ready projects, offering attractive development and buyer targeted returns. See further details here: Summary of Investment-Ready Projects.
Money Markets, T-Bills & T-Bonds Primary Auction:
During the week, T-bills remained oversubscribed, with the subscription rate coming in at 195.1%, down from 226.6% the previous week. The oversubscription is attributable to the continued favorable liquidity in the money market, evidenced by the average interbank rate having declined from 4.1% to 4.0%, as a result of government disbursements and local debt maturities. We note the continued pent up demand for the 364-day paper, having recorded the highest subscription rate of the three papers, which we attribute to the market having a bias to the shorter-dated papers to avoid duration risk. The scarcity of shorter-dated bonds in the primary market due to the government issuing medium-term and longer-dated papers in a bid to increase the debt maturity profile, has seen most investors still keen on the primary fixed income market, finding the 364-day T-bill more attractive on a risk-adjusted return basis. The yield on the 91-day and 182-day papers remained unchanged at 7.3% and 8.2%, respectively, while the yield on the 364-day paper declined by 0.4% points to 9.3%, from the 9.7% recorded the previous week. This decline is mainly due to increased demand for the 364-day paper with the average subscription rate for the year 2020 coming in at 308.1% versus the 2019 average of 188.6%, coupled with increased liquidity in the money market as well as the government being ahead of its borrowing target giving it the leeway to reject expensive bids. The acceptance rate rose to 46.0%, from 27.6% recorded the previous week, with the government accepting Kshs 21.5 bn of the Kshs 46.8 bn bids received.
During the week, the National Treasury announced that it will reopen two bonds, namely FXD1/2018/20 and FXD1/2018/25, with effective tenors of 18.1-years and 23.3-years, respectively, with a total value of Kshs 50.0 bn, to raise capital for budgetary support. The period of sale is from 3rd March 2020 to 17th March 2020. Our recommended bidding ranges are 12.9% - 13.0% and 13.4% - 13.6%, for the FXD1/2018/20 and FXD1/2018/25, respectively, given that they are currently trading at 12.9% and 13.4%, respectively. We expect the bidding ranges to stay above the current yield to maturities mainly because of oversupply of long term bonds and lower demand for longer-dated bonds from investors trying to avoid duration risk.
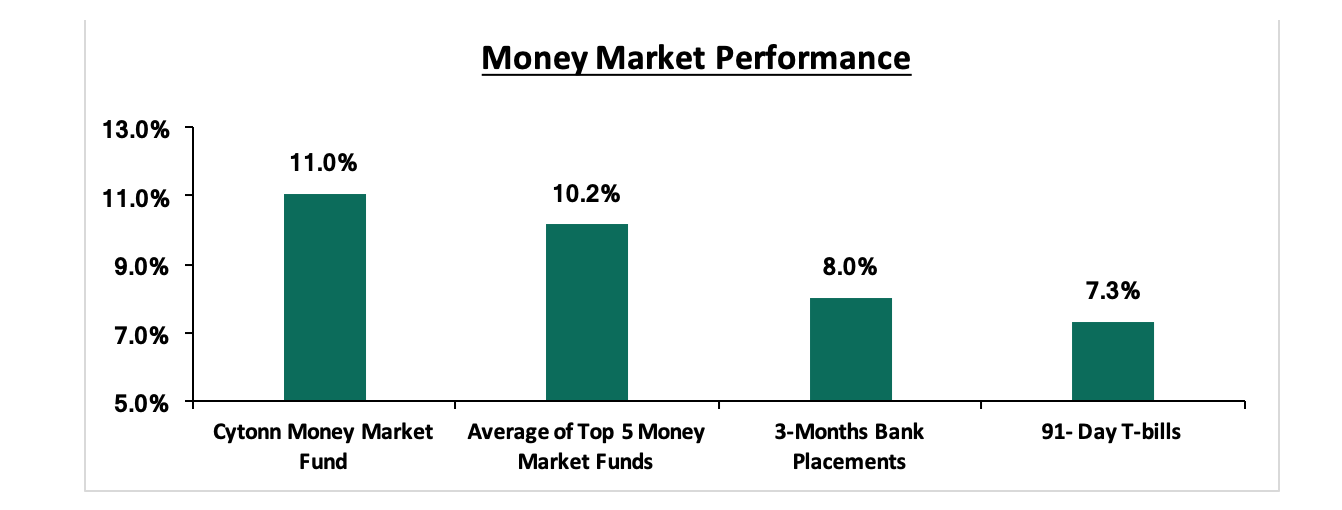
In the money markets, 3-month bank placements ended the week at 8.0% (based on what we have been offered by various banks), the 91-day T-bill came in at 7.3%, while the average of Top 5 Money Market Funds came in at 10.2%, up from 10.1% recorded the previous week. The yield on the Cytonn Money Market came in at 11.0%, unchanged from the previous week.
Liquidity:
During the week, the average interbank rate declined to 4.0%, from 4.1% recorded the previous week, pointing to increased liquidity in the money markets mainly as a result of government disbursements and local debt maturities. Commercial banks’ excess reserves came in at Kshs 20.9 bn, in relation to the 5.25% cash reserves requirement (CRR). The average interbank volumes declined by 63.7% to Kshs 5.7 bn, from Kshs 15.7 bn recorded the previous week.
Kenya Eurobonds:
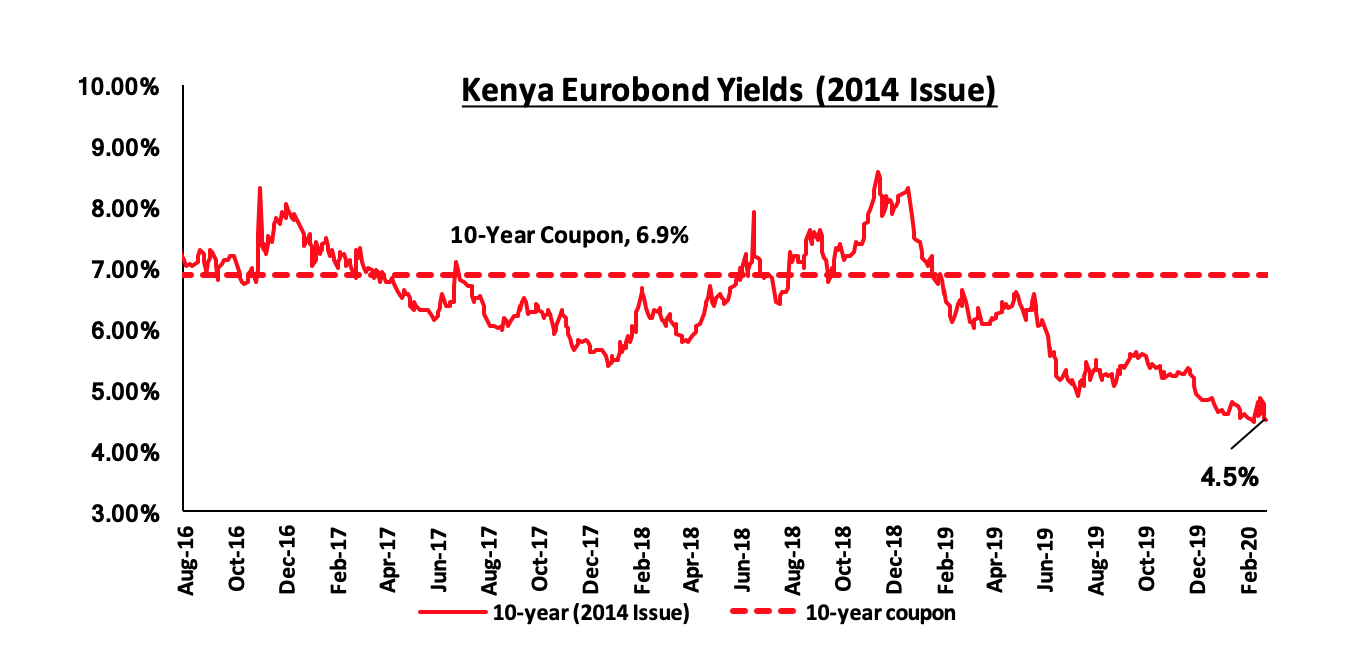
According to Reuters, the yield on the 10-year Eurobond issued in June 2014 declined marginally by 0.1% points to 4.5%, from 4.6% recorded the previous week. We attribute the decline across the Eurobonds to the adoption of a looser monetary policy regime in the Eurozone and the United States, thus leading to a decline in yields in advanced economies. As a result, there was increased investor interest in Africa’s debt market, which increased demand pushing the prices up and consequently the yield down.
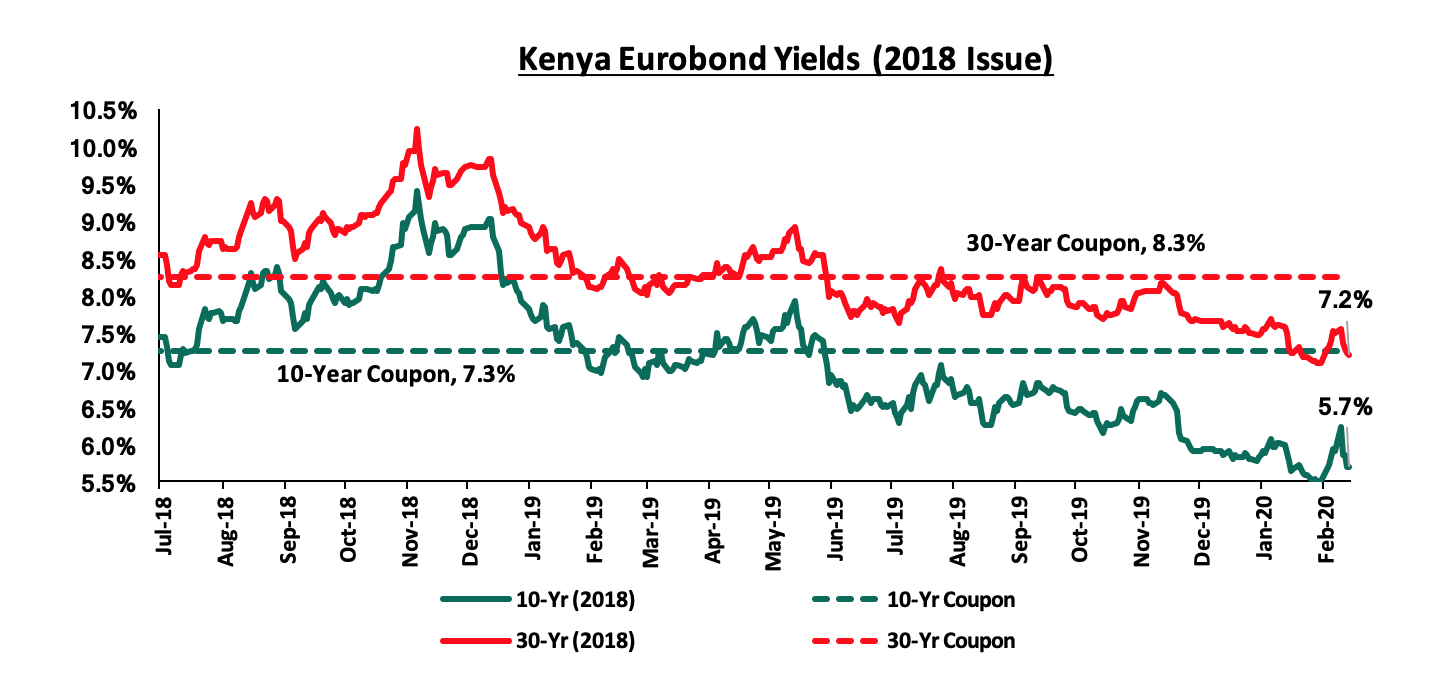
During the week, the yields on the 10-year and 30-year Eurobonds issued in 2018 declined by 0.2% points and 0.3% points to 5.7% and 7.2%, respectively, from 5.9% and 7.5% recorded the previous week.
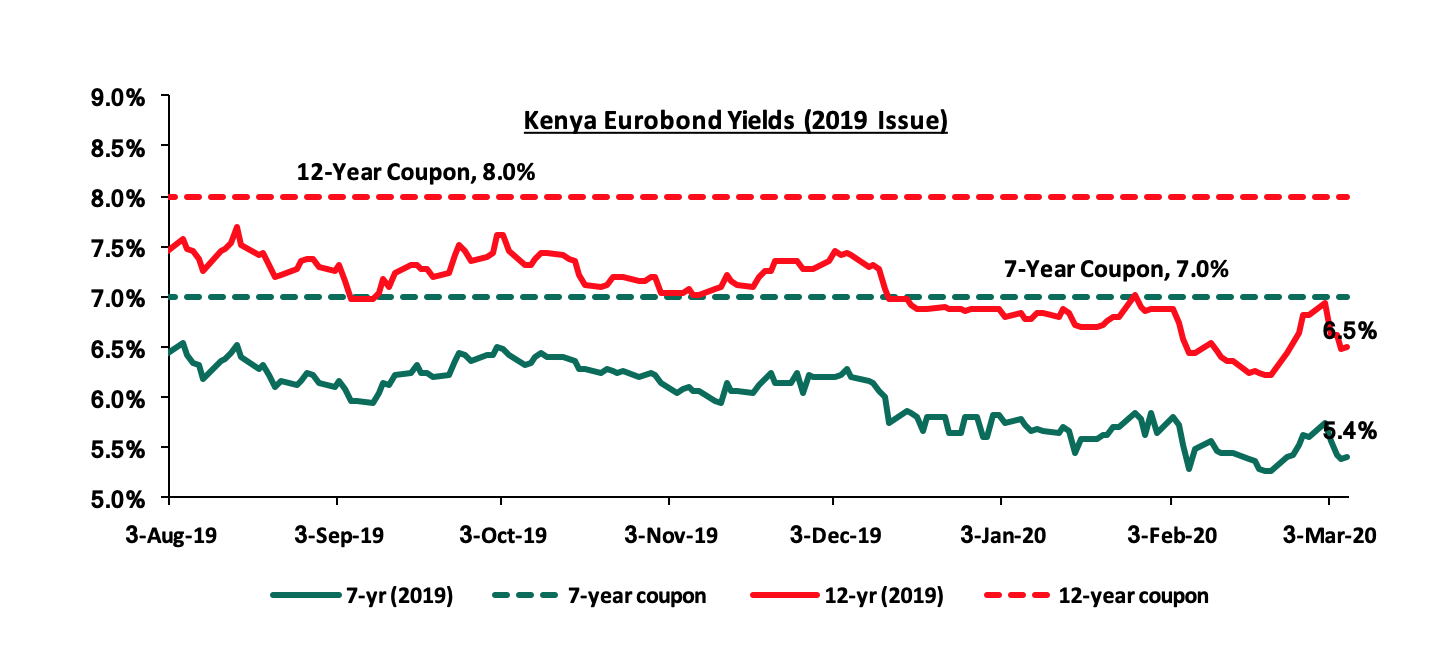
During the week, the yields on the 7-year and 12-year Eurobonds issued in 2019 declined by 0.2% points and 0.3% points, respectively, to 5.4% and 6.5%, from 5.6% and 6.8% recorded the previous week.
Kenya Shilling:
During the week the Central Bank of Kenya (CBK) publicly announced its intention to buy US Dollar (USD) worth Kshs 40.5 bn between March and June 2020 to increase its dollar reserves amid rising uncertainty on global markets due to the coronavirus outbreak. CBK, however, announced that it would buy the dollars at the prevailing market rate to ensure the purchase does not introduce volatility in the market. This was not the case, since during the week, the Kenya Shilling depreciated by 1.6% against the US Dollar to Kshs 102.6, from Kshs 101.0 recorded last week, due to increased demand for the dollar by the banks and importers who are looking to stockpile the dollar for a chance to sell to CBK. On a YTD basis, the shilling has depreciated by 1.2% against the dollar, in comparison to the 0.5% appreciation in 2019. In our view, the shilling should remain relatively stable against the dollar in the short term with a bias to a 2.4% depreciation by the end of 2020, on the back of:
- The narrowing of the current account deficit, with preliminary data indicating that Kenya’s current account deficit was equivalent to 4.6% of GDP in 2019, from 5.0% recorded in 2018. This was mainly driven by lower imports of SGR-related equipment, resilient diaspora remittances which stood at USD 0.3 bn in January 2020, a 5.9% increase from the USD 0.2 bn recorded in January 2019, and strong receipts from transport and tourism services with preliminary data indicating that the number of tourists landing in the country stood at 132,019 in December 2019, which was a 9.0% increase, compared to the 121,070 recorded in November 2019,
- High levels of forex reserves, currently at USD 8.4 bn (equivalent to 5.1-months of import cover), above the statutory requirement of maintaining at least 4.0-months of import cover, and the EAC region’s convergence criteria of 4.5-months of import cover,
- Foreign capital inflows, with investors looking to participate in the domestic equities market, and,
- CBK’s supportive activities in the money market, such as repurchase agreements and selling of dollars.
We, however, expect pressure on the shilling to arise from:
- Rising uncertainties in the global market due to the Coronavirus outbreak. The virus outbreak is likely to cause supply-side shortages which may result in inflationary pressure as prices readjust to the forces of demand and supply. The Central Bank of Kenya (CBK) is looking to purchase Kshs 40.5 bn from banks in the next four months, which will bolster the forex reserves that stood at Kshs 8.7 bn on 28th February 2020.
Weekly Highlight:
According to Stanbic Bank’s Monthly Purchasing Manager’s Index (PMI), the Kenyan private sector economy suffered another difficult month with the February PMI declining to 49.0, from 49.7 in January 2020, pointing towards a decline in business conditions. A reading of above 50 indicates an improvement in the business environment, while a reading of below 50 indicates a worsening outlook. Weak cash flow continued to cause a notable decline in consumer demand and consequently a solid drop in output in February, affecting business sales and operations with firms reducing their business activities. Confidence in a positive outlook for the market led to an increase in employment at Kenyan firms with the rate of growth being the strongest since November 2019. Cost pressures, however, accelerated to a six-month high driven by the prices of fuel and foodstuff coupled with a shortage of raw materials attributable to reduced imports from China due to the Coronavirus outbreak. Kenya has been increasingly dependent on imports from China with the country’s total imports from China standing at 21.1% in 2018, and 20.3% of total imports in the 11 months to November 2019. With a temporary closure of business to manage spread in China, we expect the prices of major imports such as electronics and heavy machinery to rise due to forces of demand and supply. The tourism sector, which is a major contributor to the country’s economy, is also likely to decline due to continued suspension of flights by major airlines as well as cruises.
Rates in the fixed income market have remained relatively stable as the government rejects expensive bids. The government is 46.2% ahead of its domestic borrowing target, having borrowed Kshs 312.3 bn against a pro-rated target of Kshs 213.7 bn. We expect an improvement in private sector credit growth considering the repeal of the interest rate cap. This will result in increased competition for bank funds from both the private and public sectors, resulting in upward pressure on interest rates. Owing to this, our view is that investors should be biased towards short-term fixed-income securities to reduce duration risk.
Market Performance
During the week, the equities market was on an upward trajectory, with NASI, NSE 20, and NSE 25 gaining by 5.1%, 2.7%, and 5.8%, respectively, taking their YTD performance to losses of (6.2%), (9.6%), and (5.5%), for the NASI, NSE 20, and NSE 25, respectively. The performance in NASI was driven by gains recorded by large-cap stocks such as KCB, Co-operative Bank, Equity, and EABL of 11.8%, 9.2%, 6.9%, and 6.9%, respectively. The gains in banking stocks are partly attributable to increased local buying as investors anticipate the release of full-year results.
Equities turnover increased by 47.3% during the week to USD 42.7 mn, from USD 29.0 mn recorded the previous week attributable to increased foreign trading on large caps, taking the YTD turnover to USD 286.2 mn. Foreign investors remained net sellers for the week, with a net selling position of USD 18.5 mn from a net selling position of USD 3.1 mn recorded the previous week.
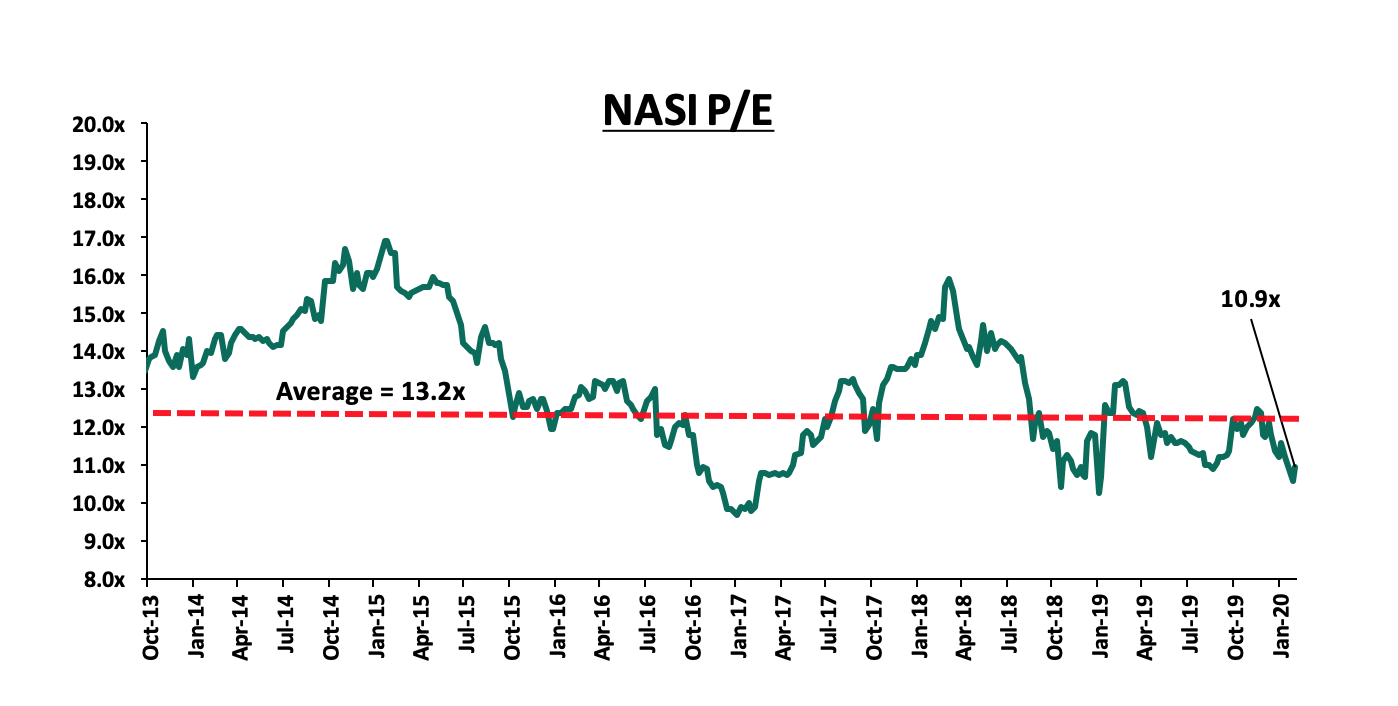
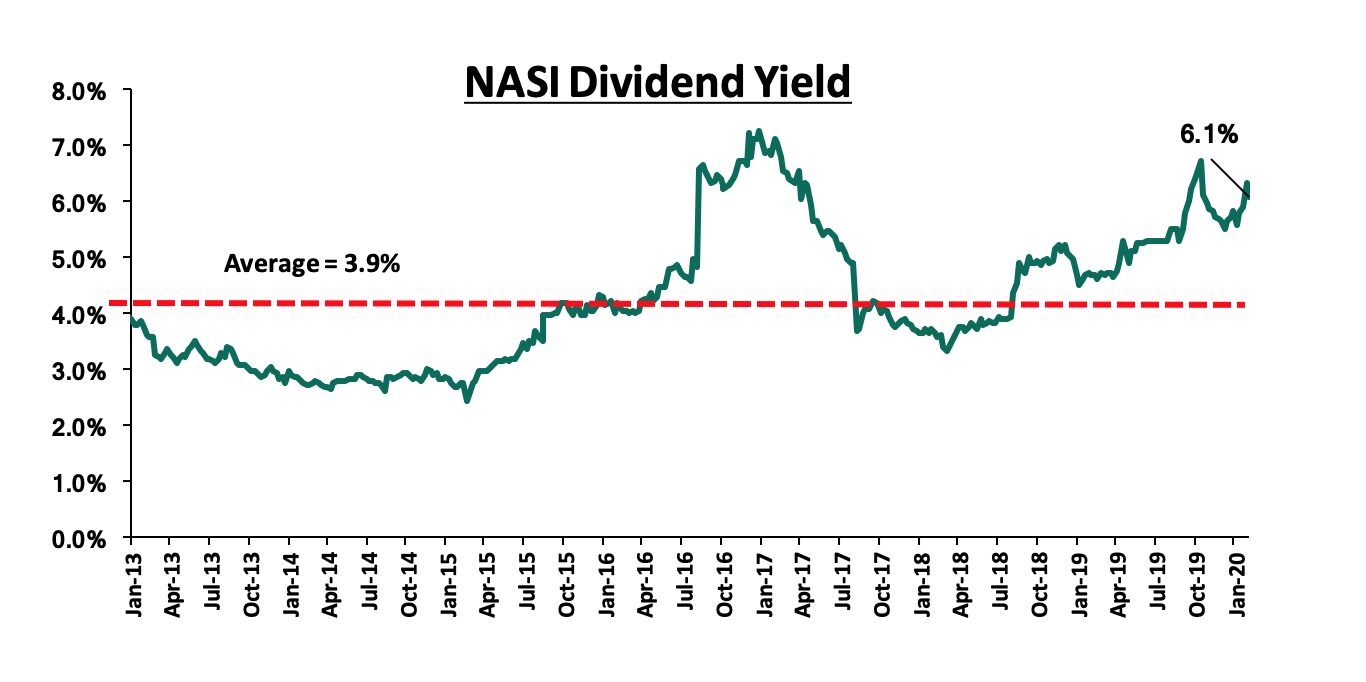
The market is currently trading at a price to earnings ratio (P/E) of 10.9x, 17.5% below the historical average of 13.2x, and a dividend yield of 6.1%, 2.2% points above the historical average of 3.9%. With the market trading at valuations below the historical average, we believe there is value in the market. The current P/E valuation of 10.9x is 12.7% above the most recent trough valuation of 9.7x experienced in the first week of February 2017, and 31.7% above the previous trough valuation of 8.3x experienced in December 2011. The charts below indicate the historical P/E and dividend yields of the market.
Earnings Note
During the week, Stanbic Holdings released their FY’19 financial results.
Income Statement:
- Core earnings per share increased by 1.6% to Kshs 16.1 from Kshs 15.9 in FY’2018, below our expectations of a 14.3% increase to Kshs 18.2. The variance was due to the 12.2% growth in total operating income to Kshs 24.8 bn in FY’2019 from Kshs 22.1 bn in FY’2018, which was slower than our projections of Kshs 26.7 bn. The growth was however mitigated by a 25.6% increase in total operating expenses to Kshs 13.9 bn, from Kshs 11.1 bn in FY’2018 which outpaced the growth in Total Operating Income,
- Total operating income rose by 12.2% to Kshs 24.8 bn, from Kshs 22.1 bn in FY’2018, driven by a 14.7% increase in Non-Funded Income to Kshs 11.4 bn in FY’2019, from Kshs 10.0 bn in FY’ 2018, coupled with a 10.0% increase in Net Interest Income to Kshs 13.4 bn, from Kshs 12.1 bn in FY’2018,
- Interest income from the bank unit rose by 8.1% to Kshs 20.4 bn in FY’2019, from Kshs 18.9 bn in FY’2018. This was largely driven by the interest income on loans and advances, which rose by 10.8% to Kshs 15.7 bn in FY’2019, from Kshs 14.2 bn in FY’2018. Interest income from government securities, however, declined by 6.0% to Kshs 4.1 bn, from Kshs 4.3 bn in FY’2018 The yield on interest-earning assets remained unchanged at 7.9% in FY’2019,
- Interest expense increased by 7.1% to Kshs 7.7 bn, from Kshs 7.2 bn in FY’2018, following a 16.6% increase in the interest expense on customer deposits to Kshs 5.3 bn, from Kshs 4.5 bn in FY’2018. The increase was, however, mitigated by the 27.7% decline in interest expense on deposits and placements from banking institutions, to Kshs 1.4 bn from Kshs 1.9 bn in FY’2018,
- Despite the rise in expenses, the cost of funds dropped to 3.3%, from 3.4% in FY’2018 as the average interest-bearing liabilities rose at a faster rate of 11.3% as compared to the interest expense, which rose by 6.9%. Net Interest Margin increased to 5.2%, from 5.0% in FY’2018 on the back of the faster 10.7% increase in Net Interest Income to Kshs 13.4 bn, from Kshs 12.1 bn in FY’ 2018, which outpaced the 3.6% growth in average interest-bearing assets,
- Non-Funded Income (NFI) rose by 14.0% to Kshs 11.4 bn in FY’2019 from Kshs 10.0 bn in FY’2018. The growth in NFI was driven by a 59.1% increase in foreign exchange trading income to Kshs 4.9 bn from Kshs 3.1 bn in FY’2018, and an 11.0% rise in other fees and commissions to Kshs 4.1 bn from Kshs 3.7 bn. Fees and commissions on loans and advances increased by 20.9% to Kshs 0.3 bn from Kshs 0.2 bn in FY’2018 The current revenue mix stands at 54:46 funded to non-funded income in FY’2019 from the 55:45 ratio recorded in FY’2018, owing to a faster increase in NFI,
- Total operating expenses increased by 25.6% to Kshs 13.9 bn in FY’2019 from Kshs 11.1 bn in FY’2018, largely driven by a 50.8% increase in the loan loss provision to Kshs 2.6 bn from Kshs 1.7bn in FY’2018. Other operating expenses recorded a 20.9% increase to Kshs 11.3 bn from Kshs 9.4bn in FY’2018. Consequently, Cost to income ratio with LLP deteriorated to 56.2% in FY’2019 from 50.2% in FY’2018. Without LLP, the Cost to income ratio also deteriorated to 45.6% in FY’2019 from 42.3% in FY’2018,
- Profit before tax declined by 13.8% to Kshs 7.7 bn from Kshs 9.0 bn in FY’2018, while profit after tax (PAT) increased by 12.5% to Kshs 9.5 bn, from Kshs 8.3 bn in FY’2018, owing to a decrease in the effective tax rate to 17.2% from 29.8% in FY’2018,
- The bank recommends a final dividend of Kshs 5.80 per share, having already paid an interim dividend of Kshs 1.25 per share, translating to a total dividend payout of Kshs 7.05 per share in 2019, a 21.6% increase from the Kshs 5.8 paid in 2018, which translates to a dividend yield of 6.4%.
Balance Sheet:
- The balance sheet recorded an expansion as total assets increased by 4.5% to Kshs 303.6 bn from Kshs 290.6 bn in FY’2018. This growth was largely driven by a 9.3% increase in the loan book to Kshs 191.2 bn from Kshs 175.0 bn, and other assets and prepayments, which increased by 69.3% to stand at Kshs 21.2 bn from Kshs 12.5 bn in FY’2018. The growth was however slowed down by a sharp decline in placements by 21.8% % to Kshs 2.3 bn from Kshs 2.2 bn in FY’2018,
- Total liabilities rose by 3.5% to Kshs 254.6 bn from Kshs 245.9 bn in FY’2018, largely driven by a 2.4% increase in customer deposits to Kshs 224.7 bn from Kshs 219.5 bn in FY’2018, and a 29.2% increase in borrowings to Kshs 9.1 bn in FY’2019 from Kshs 7.1 bn in FY’ 2018,
- The faster increase in loans as compared to the deposits lead to the increase in the loan to deposit ratio to 85.1% in FY’2019 from 79.7% in FY’2018,
- Gross non-performing loans increased by 16.2% to Kshs 19.3 bn from Kshs 16.6 bn in FY’2018. The NPL ratio thus deteriorated to 9.6% in FY’2019 from 9.1% in FY’2018, owing to the faster growth in non-performing loans that outpaced growth in the gross loans. General Loan Loss Provisions (LLPs) increased by 50.8% to Kshs 2.6 bn from Kshs 1.7 bn in FY’2018. Consequently, the NPL coverage increased to 57.1% in FY’2019 from 53.4% in FY’2018,
- Shareholders’ funds increased by 9.9% to Kshs 49.0 bn in FY’2019 from Kshs 44.6 bn in FY’2018, largely due to the 13.8% increase in the retained earnings to Kshs 30.0 bn from Kshs 26.4 bn in FY’2018,
- Stanbic Bank is currently sufficiently capitalized with a core capital to risk-weighted assets ratio of 15.2%, 4.7% points above the statutory requirement. In addition, the total capital to risk-weighted assets ratio was 18.3%, exceeding the statutory requirement by 3.8% points. Adjusting for IFRS 9, core capital to risk-weighted assets ratio was at 16.2% while total capital to risk-weighted assets was 18.1%,
- Stanbic Holdings currently has a return on average assets of 2.1% and a return on average equity of 13.6%.
Key Take-Outs:
- The bank recorded a relatively strong performance in both funded and NFI segments. The bank’s aggressive lending has led to increased interest income, as well as the associated fees and commissions. The increased lending, however, came at a cost as asset quality deteriorated, as shown by the rise in the NPL ratio to 9.6%, from 9.1% in FY’2018. The cost of risk rose to 10.6% from 7.8% in FY’2018, consequently, the coverage ratio rose to 57.1%, from 53.4% in FY’2018,
- Stanbic Holdings registered a strong performance on NFI, which grew by 14.7% to Kshs 11.4 bn from Kshs 10.0 bn in FY’ 2018, underpinning the importance of revenue diversification. The bank has been aggressive in generating non-funded income, which now accounts for 46.1% of its operating income.
For more analysis, please see our Stanbic Holdings FY’19 Earnings Note
The table below summarizes the performance of listed banks that have released their FY’19 results:
|
Bank |
Core EPS Growth |
Interest Income Growth |
Interest Expense Growth |
Net Interest Income Growth |
Net Interest Margin |
Non-Funded Income Growth |
NFI to Total Operating Income |
Growth in Total Fees & Commissions |
Deposit Growth |
Growth in Government Securities |
Loan to Deposit Ratio |
Loan Growth |
Return on Average Equity |
|
Stanbic Holdings |
1.6% |
8.1% |
7.1% |
10.7% |
5.2% |
14.0% |
46.1% |
11.7% |
2.4% |
(12.7%) |
85.1% |
9.3% |
13.6% |
|
FY'19 Mkt Weighted Average* |
1.6% |
8.1% |
7.1% |
10.7% |
5.2% |
14.0% |
46.1% |
11.7% |
2.4% |
(12.7%) |
85.1% |
9.3% |
13.6% |
|
FY'18 Mkt Weighted Average** |
13.8% |
6.5% |
10.6% |
2.6% |
7.9% |
3.8% |
33.2% |
(1.0%) |
10.3% |
9.1% |
75.5% |
4.3% |
19.0% |
|
*Market cap-weighted as at 06/03/2020 |
|||||||||||||
|
**Market cap-weighted as at 31/12/2018 |
|||||||||||||
Universe of Coverage
|
Banks |
Price at 28/02/2020 |
Price at 06/03/2020 |
w/w change |
YTD Change |
Year Open |
Target Price* |
Dividend Yield |
Upside/ Downside** |
P/TBv Multiple |
Recommendation |
|
Kenya Reinsurance |
2.8 |
2.7 |
(5.0%) |
(12.2%) |
3.0 |
4.8 |
16.9% |
97.4% |
0.3x |
Buy |
|
Diamond Trust Bank |
100.0 |
102.0 |
2.0% |
(6.4%) |
109.0 |
189.0 |
2.5% |
87.8% |
0.5x |
Buy |
|
I&M Holdings*** |
50.0 |
52.0 |
4.0% |
(3.7%) |
54.0 |
75.2 |
7.5% |
52.1% |
0.9x |
Buy |
|
Liberty Holdings |
9.1 |
7.5 |
(17.5%) |
(27.3%) |
10.4 |
10.1 |
6.6% |
40.5% |
0.6x |
Buy |
|
Jubilee Holdings |
338.0 |
335.5 |
(0.7%) |
(4.4%) |
351.0 |
453.4 |
2.7% |
37.8% |
1.1x |
Buy |
|
KCB Group*** |
45.0 |
50.3 |
11.8% |
(6.9%) |
54.0 |
64.2 |
7.0% |
34.7% |
1.4x |
Buy |
|
Co-op Bank*** |
13.6 |
14.8 |
9.2% |
(9.5%) |
16.4 |
18.1 |
6.8% |
29.1% |
1.3x |
Buy |
|
Sanlam |
17.0 |
17.0 |
0.0% |
(1.2%) |
17.2 |
21.7 |
0.0% |
27.6% |
0.7x |
Buy |
|
Equity Group*** |
45.3 |
49.1 |
8.4% |
(8.3%) |
53.5 |
56.7 |
4.1% |
19.7% |
1.8x |
Accumulate |
|
Standard Chartered |
200.5 |
200.3 |
(0.1%) |
(1.1%) |
202.5 |
211.6 |
9.5% |
15.2% |
1.5x |
Accumulate |
|
NCBA |
33.1 |
34.3 |
3.5% |
(7.1%) |
36.9 |
37.0 |
4.4% |
12.4% |
0.8x |
Accumulate |
|
CIC Group |
2.6 |
2.6 |
(3.0%) |
(4.9%) |
2.7 |
2.6 |
5.1% |
8.6% |
0.9x |
Hold |
|
ABSA Bank*** |
13.0 |
13.3 |
2.7% |
(0.4%) |
13.4 |
13.0 |
8.3% |
6.0% |
1.7x |
Hold |
|
Stanbic Holdings |
112.0 |
110.0 |
(1.8%) |
0.7% |
109.3 |
103.1 |
6.4% |
0.1% |
1.1x |
Lighten |
|
Britam |
7.3 |
7.4 |
0.5% |
(18.0%) |
9.0 |
6.8 |
0.0% |
(8.5%) |
0.7x |
Sell |
|
HF Group |
4.6 |
4.7 |
4.2% |
(26.6%) |
6.5 |
4.2 |
0.0% |
(11.4%) |
0.2x |
Sell |
|
*Target Price as per Cytonn Analyst estimates **Upside/ (Downside) is adjusted for Dividend Yield ***Banks in which Cytonn and/or its affiliates are invested in |
||||||||||
We are “Positive” on equities for investors as the sustained price declines have seen the market P/E decline to below its historical average. We expect increased market activity, and possibly increased inflows from foreign investors, as they take advantage of the attractive valuations, to support the positive performance.
- Residential Sector
During the week, Mizizi Africa Homes, a local property development company, launched its 18-unit off-plan development located along Kenyatta Road in Juja. The development dubbed ‘Heritage Estate’ will comprise of 118 SQM 3-bedroom bungalow units selling at Kshs 3.8 mn, which translates to Kshs 32,200 per SQM, compared to the Juja market average of Kshs 73,182 per SQM in 2019 as per the NMA Residential Report 2018/2019, attributed to more affordable development land.
Driven by the heightened demand for affordable housing, satellite towns such as Juja continue to attract real estate investors driven by (i) availability of development class land at Kshs 18.5 mn per acre, compared to Nairobi Metropolitan Area average of Kshs 139.4 per acre, (ii) infrastructural developments with the Thika Superhighway, enhancing ease of access to the area, (iii) a growing demand for residential units from the working class from commercial nodes such as Nairobi CBD and Thika Road, evidenced by the annual uptake averaging at 16.6%, and (iv) attractive returns recording average yields of 5.1%, 0.4% points higher than the residential market average of 4.7%.
The table below shows the satellite towns’ performance compared to other residential segments:
(All values in Kshs unless stated otherwise)
|
Residential Performance Summary 2018/2019 |
|||||||
|
Segment |
Average Price Per SQM |
Average Rent Per SQM |
Average Annual Uptake |
Average Occupancy |
Average Rental Yield |
Average Y/Y Price Appreciation |
Average Total Returns |
|
High End |
201,275 |
735 |
18.5% |
83.5% |
3.7% |
0.1% |
3.8% |
|
Upper-Mid End |
135,951 |
628 |
23.6% |
85.1% |
4.5% |
0.3% |
4.8% |
|
Lower Mid-End |
83,0634 |
404 |
19.3% |
79.6% |
4.4% |
0.4% |
4.8% |
|
Satellite Towns |
76,676 |
395 |
21.4% |
79.6% |
4.5% |
0.6% |
5.1% |
|
Residential Market Average |
119,330 |
532 |
20.9% |
82.1% |
4.3% |
0.3% |
4.7% |
|
· Satellite towns recorded average returns of 5.1%, 0.4% points higher than the residential market average of 4.7% during the 2018/2019 period |
|||||||
Cytonn Research 2019
We expect the residential sector in satellite areas to continue gaining popularity in Kenya, supported by (i) relatively high returns to investors, (ii) growing demand for affordable housing units, and (iii) infrastructure improvements, and thus attractive performance going forward.
- Real Estate Investment Trust (REIT)
During the week, Acorn Holdings Limited, a local property developer, announced that it was in the process of structuring a Development Real Estate Investment Trust (D-REIT) through which it will sell part of its ownership of its branded Qwetu and Qejani student hostels. A D-REIT is a type of REIT in which resources are pooled together for purposes of running development and construction projects. The D-REIT will be used to finance the construction of sustainable and climate-resilient student hostel units in Nairobi, as the firm targets to put up 50,000 units in Nairobi. So far, the company has completed four developments in Ruaraka, Madaraka Parklands, and along Jogoo Road, totalling 1,572 units. Despite the D-REITs structure and regulations coming into effect in 2012, we don’t have a single D-REIT in Kenya 8 years later. So far D-REITs in Kenya have failed with Fusion Capital D-REIT issuance in 2016 attaining a low subscription rate and the Cytonn D-REIT approval pending at the Capital Markets Authority (CMA). We ascribe the failure and lack of traction in the structure to three main reasons: (i) the high minimum amounts required for investments set at Kshs 5.0 mn, which is 100 times the Kenyan median income of Kshs 50,000, (ii) the high minimum capital requirement of Kshs 100 mn for a trustee, which is 10 times more compared to the requirement of Kshs 10 mn for a pension trustee, limiting the number of available trustees to just three banks, (iii) the lengthy approval processes that have no time limits. It has been 8 years since the regulations came into effect with nothing to show. Unless the structural market impediments are addressed, we are unlikely to see a D-REIT in the market anytime soon, making it hard to fund real estate initiatives such as the Affordable Housing initiative. We would suggest a candid and urgent review of the regulatory framework to understand why the structure has not worked so that we can make the necessary changes to make the framework relevant.
Also, during the week, the Capital Markets Authority (CMA) and the Competition Authority of Kenya (CAK) approved the transfer of the Fahari I- REIT by Stanlib Kenya to ICEA Lion Asset Management, a local Kenyan fund manager. The deal is part of an extensive review of Stanlib’s operations, which according to online sources, has been informed by low historical returns, capital requirements, and competition. According to Stanlib Fahari I- REIT Earnings update- H1’2019, the firm’s total assets comprised of investment property valued at Kshs 3.4 bn and cash reserves of Kshs 235 mn. The Fahari I- REIT performance has been on a decline since its listing in November 2015, trading at Kshs 7.8 per unit on 6th March 2020, 61.0% lower than its initial value of Kshs 20.0 per unit.
REITs in the Kenyan market, most notably the Stanlib Fahari I-REIT has traded in low volumes attributed to (i) opacity of the exact returns from the underlying assets, (ii) inadequate investor knowledge, and (iii) lack of institutional support for REITs. The REIT market in Kenya has the potential for growth if a supportive framework is provided. Some of the measures that may boost the REIT market include (i) teaming up with market players and regulators to offer constant training to the investing public, (ii) broadening the pool of trustees as currently, Kenya has only three institutions certified as REIT trustees. In countries with a successful REIT market such as the UK, a Chartered Accountant can register with the Financial Conduct Authority to be a trustee, and in South Africa, an insurance company can also be a trustee, and (iii) Continuous improvement on the regulation and government support for REITs. Currently, the average Kenyan investor is left to invest in informal, unregulated real estate schemes that have exposed them to risks. For more information, see our Real Estate Investment Trusts, REITs Note.
We expect the real estate sector to continue recording several activities fueled by; (i) the continued government focus on the affordable housing initiative, and, (ii) the existing housing demand within the low and middle segments of the residential market.
Student Housing, or purpose-built student accommodation (PBSA), refers to housing that has been designed specifically to meet the demands and requirements of the modern-day student. The concept has gained much traction globally and has become a mainstream investment class asset gaining more attention from institutional investors especially in developed European markets and the United States, driven by the huge student enrolment numbers and a failure on the institutions’ part to provide accommodation that is commensurate with the increase in student enrolment populations. For instance, the US market registered 19.8 mn students in 2019, of which 1.5 mn were international, against a student housing supply of 2.7 mn. Generally, the US, UK and Australia markets accounted for the largest share of international students in 2019 with 26.0%, 12.0%, and 8.0%, respectively. Other factors influencing the growth include high rental yields in comparison to other assets, and the sub-sector’s stability even in times of economic downturns. In Kenya, the concept is also gradually gaining traction as the demand-supply gap between student accommodation and student enrolment continues to widen every year. We recently saw Acorn listed a green bond that is targeted at funding student housing and has recently discussed the potential for a D-REIT, again targeted at student housing. This week, we turn our focus on student housing and as such, we shall cover the following:
- Global Overview of Student Housing,
- Student Housing in Kenya,
- Student Housing Demand in Kenya and Factors Affecting Supply,
- Market Performance Summary, and,
- Conclusion and Recommendation.
Section I. Global Overview of Student Housing
Broadly categorised as a residential multifamily class, student housing has become an attractive investment class in its own right. Globally, the market has grown from a portfolio of USD 2.5 bn (Kshs 250.0 bn) as at 2007 to USD 17.2 bn (Kshs 1.7 tn) as at 2018, an 11-year CAGR of 19.2%, according to Knight Frank’s Global Student Property Report 2019. The growth has been driven by a number of reasons:
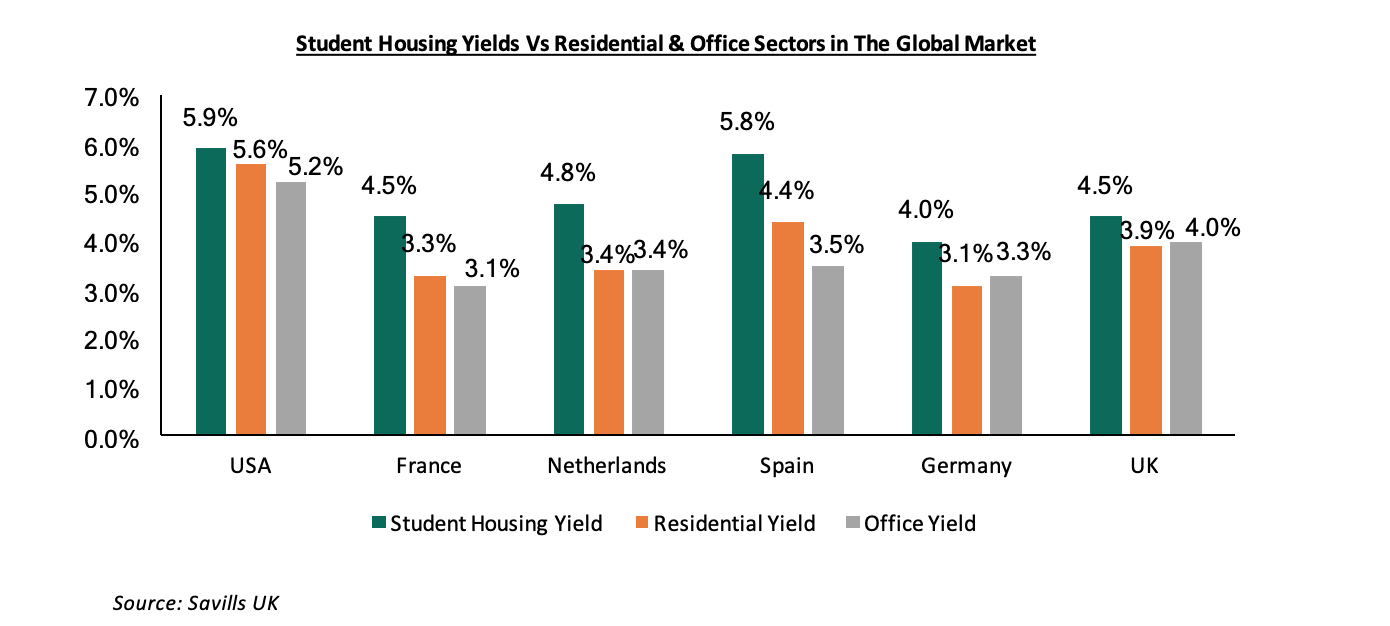
- Attractive Returns – Student housing continues to deliver relatively high returns and consistent rental income to investors in comparison to other asset classes, which tend to fluctuate with prevailing real estate cycles. According to Savills, a UK-based real estate services provider, student housing in the UK and the US delivered average rental yields of 4.5% and 5.9%, respectively, compared to their respective 10-year government bonds of 1.1% and 2.5%, respectively. As such, the sector continues to attract high net-worth investors seeking strong returns on their investment,
- Hedge Against Economic Headwinds – Student housing has proven to be resilient especially during economic downturns as well as the usual real estate cycles. This is as student enrolment increases every year despite the prevailing economic climate, and even tends to spike during economic downturns as more people seek to diversify their skillsets, and,
- Expanding Middle Class – According to World Economic Forum, every year, 140 mn households globally move into the middle-income class and another 20 mn move into the high-income bracket, increasing their expenditure on basics such as food and housing by 225.0% on average and on services such as healthcare and education by 350.0%. The growth in disposable incomes leads to student mobility as more people seek quality higher education, creating more markets for student housing.
The US and UK are the most mature student housing markets and continue to dominate global investment deals. The market is largely characterized by cross-border investments, i.e. investments in other countries, and as at 2018, these stood at 37.0% of all real estate investment, in comparison to offices and retail which accounted for 34.0% and 29.0%, respectively.
|
Notable Cross Border Student Housing Providers |
|||
|
Company |
Invested Countries |
Student Housing Brand |
Portfolio |
|
Global Student Accommodation Group(GSA) |
UK, Australia, Japan, UAE, Germany, Spain, Ireland, China |
The Student Housing Company, Uninest, Nexo |
>70,000 beds |
|
Greystar Student Living |
US, UK, Netherlands |
RESA, Chapter Living |
>100,000 beds |
|
International Campus |
Germany, Netherlands, Australia |
The Fizz |
3,500 rooms |
|
The Student Hotel |
Netherlands, France, Spain, Italy, Germany |
The Student Hotel(TSH) |
4,400 rooms |
Major institutional investors include sovereign wealth funds (SWF), pension funds, insurance funds, as well as large-scale real estate developers. The most common methods of investing include buying properties for earning rental income whereas others invest in Real Estate Investment Trusts (REITs) that own student accommodation. In terms of returns, the sub-sector registered relatively high returns surpassing other real estate classes such as conventional residential and commercial sectors.
Source: Savills UK
In the Sub-Saharan Africa region, most of the region’s private providers are based in South Africa as it has the highest student population in the region at 1.1 mn, with operators such as South Point, International Housing Solutions (IHS), and Respublica being some of the most prominent student housing providers. According to United Nations Education, Scientific and Cultural Organization (UNESCO) statistics, in Sub-Saharan Africa, South Africa currently has the highest inbound student mobility ratio (number of students from abroad studying in a given country, as a percentage of the total tertiary enrolment in that country) in Africa at 4.1 compared to countries like Kenya with 0.9. This translates to a relatively high number of international students in Africa at 45,334 whereas Kenya has 5,254. The largest Pan-African providers of private student housing are AfricanIcon and Shelter Afrique, with 44,218 and 30,000 beds, respectively, according to a 2016 JLL report.
Section II. Student Housing in Kenya
All universities in Kenya are experiencing an acute student housing shortage. The existing capacity is limited and new developments have ultimately not kept pace with the growth in enrolment. According to the Ministry of Education, available student housing in Kenya stands at 300,000 against a university enrolment of 520,900 as at 2018, excluding technical colleges. According to Cytonn Research, on average, the majority of higher institutions in Kenya, therefore, only cater to approximately 22.6% of their student population, having looked at various tertiary institutions, their on-campus hostels capacity against their student enrolment. Assuming that 10.0% live at home, this means private investors are left to cater for at least 67.4%, which translates to over 350,000-bed spaces.
Similar to affordable housing, the majority of the private student housing stock lacks in quality and amenities that are expected of student accommodation. There is a huge gap of institutional-grade student housing stock to warrant interest from willing international institutional investors seeking to deploy capital in regions with strong returns. At present, the minimal available investment grade portfolio is within Nairobi County with the key market players as shown below:
|
Purpose-Built Student Housing Investors in Kenya |
|||||
|
Key Players |
Type |
Brand |
Investment Areas |
Portfolio |
Incoming Supply |
|
Acorn/Helios |
Joint Venture |
Qwetu/Qejani |
Ruaraka, Madaraka, Parklands, Jogoo Road |
1,572 |
50,000 |
|
Questworks |
Developer |
Parallelfour |
Madaraka |
<200 |
800 |
|
Century Developments Ltd/Kuramo |
Joint Venture |
- |
Nairobi County |
- |
10,000 |
|
Defoca (Kenya Defense Forces Old Comrades Association) |
Owner |
Kafoca Studyville |
Madaraka |
500 |
- |
|
Total |
2,272 |
60,800 |
|||
Online sources
Century Developments and Kuramo’s partnership deal is set to deliver 10,000 Purpose-built units in the next five years, Parallelfour is currently under construction and is set for completion by 2021, while no timeline has been given for Acorn’s pipeline of 50,000 units.
Acorn Holdings, a joint venture between Acorn and UK-based Private Equity firm Helios, is currently the leading purpose-built student accommodation player in the Kenyan market having developed 1,572 rooms with 2,313 beds as at 2020. In November 2019, the firm issued the first Kenyan green bond on the international Securities Market of the London Stock Exchange (LSE) raising 85.0% of its Kshs 4.3 bn target, affirming that Kenya is indeed an attractive market for foreign investors. The medium-term note (MTN) program will be used to finance the construction of green-certified student properties, to create quality and affordable accommodation for 5,000 students in Nairobi. Currently, the firm has upcoming student housing projects on Thika Road, Athi River, Kilimani and Waiyaki Way.
Section III. Student Housing Demand in Kenya and Factors Affecting Supply
Unlike in the developed matured markets where the student population is expected to dip, Kenya’s market is still nascent. The demand for student housing is attributable to:
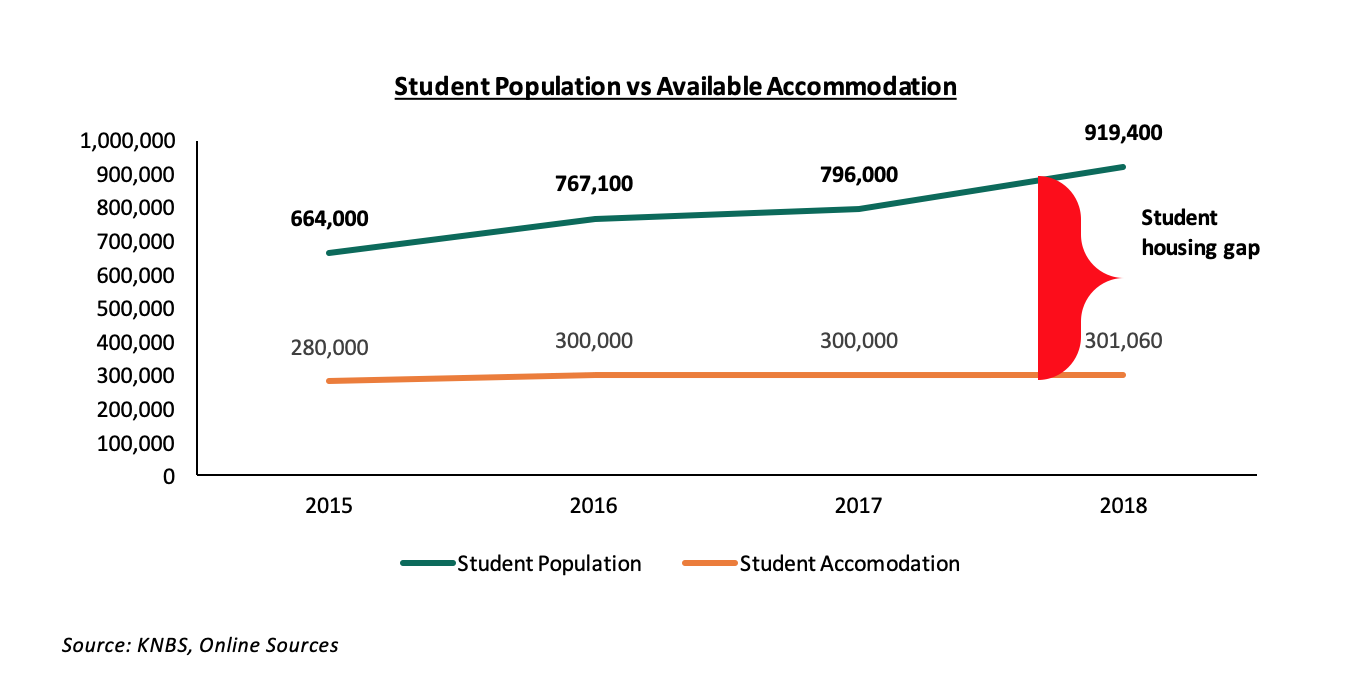
- Rapidly Growing Student Population: At present, the student population in universities and vocational centres according to Kenya National Bureau of statics 2019 Economic Survey stood at 796,000 in 2017/18 and was expected to grow by 15.5% to 919,400 in the 2018/19 academic year. The numbers are set to increase as the university/college age demographic continues to grow. According to the 2019 census data, the number of 18-24 year individuals came in at 6.4 mn, representing 13.4% of the total Kenyan population of 47.6 mn,
Source: KNBS, Online Sources
Purpose-built student housing volumes in Kenya have only registered a paltry change over the past five decades with no institution having developed a new project. The recorded change is due to newly opened institutions, and Acorn’s portfolio of 1,060 units as at 2019. We expect this to grow by a further 1,000 units once Acorn and Questworks complete their respective Thome and Madaraka projects by 2021. With the current available stock at 301,060, the student housing gap has been growing at a 4-year CAGR of 20.7%, and 123.8% more per year than the affordable housing deficit which grows by 200,000 units p.a. according to the National Housing Corporation (NHC).
- Increase in Tertiary Institutions: According to the Kenya National Bureau of Statistics (KNBS), the number of technical colleges and universities grew by a 4-year CAGR of 32.0% and 4.4%, respectively. In a bid to gain scale, the institutions continue to expand through satellite branches supported by government policy on increasing the number of universities in each county as well as infrastructural improvements, necessitating investment in student accommodation,
- Public Policy: Government measures such as scrapping visa requirements for other African countries is a boost for enrolment of international students to local institutions. In addition, the Kenya National Qualifications Authority is developing a policy to help the country increase the number of international students from across Africa to 30,000 and turn it into a regional higher education hub, which will result in greater demand for quality student accommodation.
In terms of supply, provision of student’s halls of residence was traditionally assumed to be the role of the institution. However, with public sector budget constraints especially towards varsities’ funding and insufficient land supply for private universities, the institutions rely on the private sector to plug the deficit. To this end, various institutions namely Moi University, Kenyatta University, South Eastern Kenya University and the University of Embu have initialized public-private partnerships to address the hostel deficit. However, despite these agreements having been signed as early as 2014, none has come to fruition, which we attribute to the challenges faced by public-private partnerships (PPPs)in Kenya such as; (i) difficulties in managing the multi-stakeholder nature of most of the PPP projects, (ii) lack of appropriate legal frameworks in Kenya to enable transfer of public land into special purpose vehicles to be able to attract private capital and bank debt, and (iii) the extended time-frame of PPPs while private developers prefer to exit projects within 3-5 years. The PPP hostel projects have a design, build, own, operate and transfer model, where the developers will recoup their return after 20 years.
The shortage of purpose-built student accommodation is attributable to:
- High Land Costs - Land in urban areas in Kenya has continued to soar, driven by demand for development class land which has also led to its shortage, especially in Nairobi, where the price per acre averages Kshs 139.4 mn,
- Insufficient Access to Funding - Unlike in the developed markets where investors can easily secure debt and equity financing, obtaining financing for local developers has been difficult due to reluctance of lending institutions to finance such private developers and therefore apply strict underwriting standards. Additionally, the local capital markets, which can be a source of long-term funding remains relatively undeveloped compared to developed markets and also limited access, and,
- Inadequate Expertise - Purpose-built student housing accommodation requires high development and management expertise, which the majority of developers lack capacity for.
Section IV. Market Performance Summary
We conducted research across 9 areas namely, Parklands, Ruiru, Kahawa Sukari, Thome, Juja, Rongai, Athi River, and Karen. The student housing market in Kenya tends to be fragmented with majority of housing in major established universities ranging from studio units to shared apartments, with sizes ranging from 9 SQM for a single room to 30 SQM for shared living. However, the majority of the stock is old and rundown buildings lacking in necessary student services such as ample security, professional management and reliable internet access.
From the research, as the number of occupants per room increase, the average monthly rent per person decreases with average monthly rent per person for a 6-sharing apartment totalling Kshs 270 per SQM. Additionally, shared living recorded the highest occupancy rates in comparison to single living owing to the fact majority of the students choose to forego privacy to save on rental costs.
On average, the private hostels charge Kshs 8,742 per month compared to university-let hostels, which charge a maximum of Kshs 1,000 per month.
|
Student Housing Performance in Nairobi Metropolitan Area - 2020 |
||||
|
Number of Persons per Room |
Average Rent (Kshs) |
Average Rent per SQM |
Average Occupancy |
Average Rental Yield |
|
1 |
12,735 |
637 |
76.8% |
11.7% |
|
2 |
8,188 |
457 |
81.2% |
8.9% |
|
4 |
6,672 |
345 |
81.0% |
6.7% |
|
6 |
5,498 |
270 |
86.5% |
5.6% |
|
Average |
8,742 |
427 |
81.4% |
*7.4% |
*The average is a weighted average based on the number of people sharing per room |
||||
Source: Cytonn Research 2020
We also analysed the data depending on the market segments; upper mid-end markets, which tend to host private universities and the low mid-end and satellite towns which largely host mid-tier colleges and public universities. All purpose-built student accommodation tends to be located in the upper mid-end markets such as Madaraka, Parklands and Thome. As such, they attract relatively higher rental rates that average at Kshs 599 per SQM in comparison to the low mid-end markets with Kshs 430 per SQM.
In lower mid-end areas, student housing is of lower quality and most rent at an average of Kshs 7,624 per month. Common facilities offered include simple furnishing comprising of simple metal or wooden bed, study desk, a kitchenette, hot shower, and free wifi. In terms of security, most rely on proximity to police stations.
However, purpose-built student housing offer amenities such as tuck shops, back-up generators, CCTV and 24/7 security teams, secure biometric access, common rooms with DSTV, gyms, and game rooms, laundry machines, separate study rooms, and some even offer shuttle services. The rents for PBSA range from Kshs 10,000 with the highest in the market being Kshs 31,000 per month.
|
Nairobi Metropolitan Area Student Housing Summary 2020 |
|||||
|
Area |
Average Plinth Area |
Average Monthly Rent (Kshs) |
Average Rent per SM |
Average Occupancy |
Average Rental Yield |
|
Upper Mid-End Student Housing |
|||||
|
Parklands |
21.6 |
11,643 |
574 |
84.4% |
9.8% |
|
Madaraka |
21.5 |
12,361 |
583 |
79.0% |
9.4% |
|
Thome |
23.8 |
14,538 |
619 |
75.2% |
9.5% |
|
Karen |
16.1 |
10,022 |
624 |
72.2% |
9.2% |
|
Average |
20.7 |
12,141 |
599 |
77.7% |
9.5% |
|
Lower Mid-End Student Housing |
|||||
|
Rongai |
18.2 |
11,393 |
534 |
71.3% |
9.1% |
|
Kahawa Sukari |
13.1 |
4,472 |
332 |
84.9% |
6.8% |
|
Athi River |
24.9 |
7,792 |
352 |
79.4% |
6.7% |
|
Thika |
13.0 |
3,964 |
320 |
77.4% |
5.9% |
|
Juja |
14.9 |
3,583 |
249 |
85.0% |
5.1% |
|
Average |
17.3 |
7,624 |
430 |
78.3% |
7.5% |
NB: The yields are calculated assuming an average development cost per SQM of Kshs 50,000 for non-purpose built student housing, and Kshs 59,000 per SQM for PBSA |
|||||
Source: Cytonn Research 2020
- Rental Rates – Karen and Thome attract the highest rent per SQM with Kshs 619 and Kshs 624, respectively. These areas host top tier private universities such as Catholic University of Eastern Africa and United States International University, and thus, they attract students largely from the middle class and high-income families. Generally, the average monthly rental rates fluctuate based on location, the type of institutions targeted, which tend to warrant differences in terms of the quality of student housing and amenities expected by the students. Additionally, hostels within Nairobi County tend to charge higher than satellites owing to the relatively high land costs, which are passed onto the tenants,
- Amenities - Rental properties in the off-campus market offer a number of amenities, many of which are absent in on-campus housing. Three amenities that are available off-campus and almost non-existent on campus include; hot showers, wireless internet access and DSTV,
Occupancy Rates – The low mid-end areas recorded slightly higher occupancy rates averaging 78.3% compared to upper mid-end areas with 77.7%. This is because the former tend to attract more student populations owing to their affordability. For instance, a student studying at a university in Karen would choose to live and commute from Rongai where the housing is relatively more affordable.
In comparison to other asset classes within the real estate sector, student housing posted a relatively high rental yield averaging 7.4% and surpassing Mixed-use developments (MUDs) and residential sectors with 7.3% and 5.0%, respectively, as shown below:
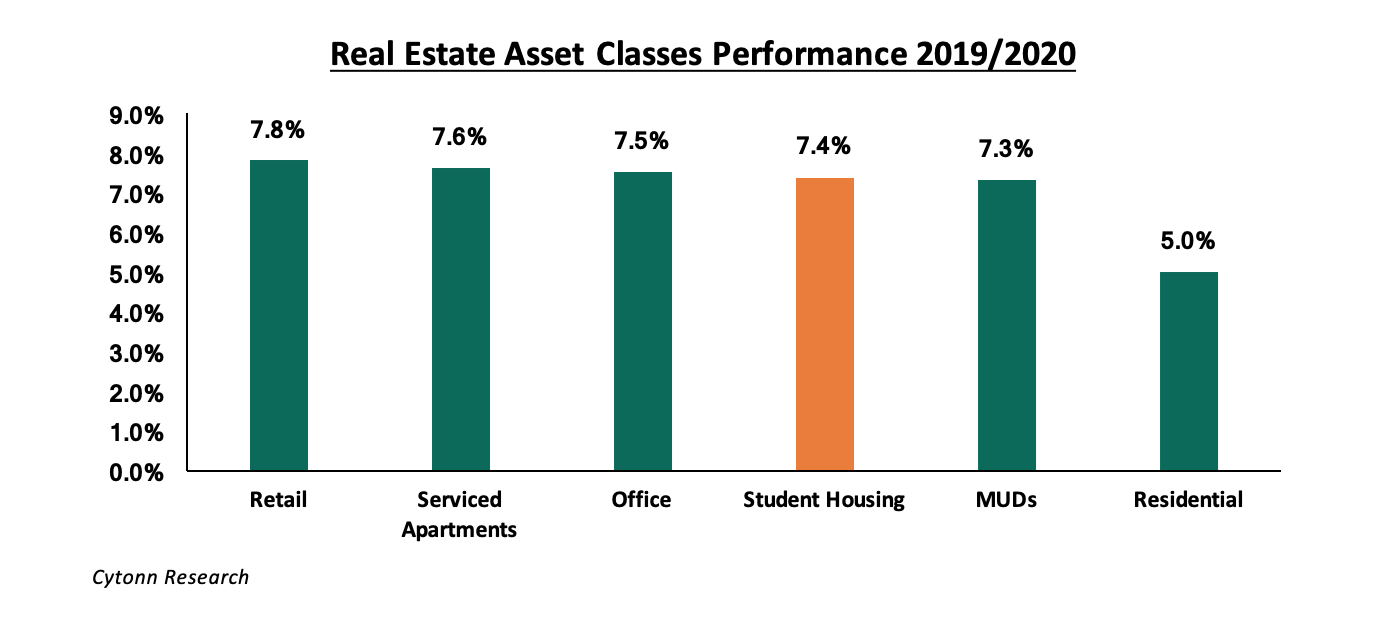
Cytonn Research
Section V. Conclusion and Recommendation
Currently, less than 25.0% of the current demand is met by university-operated supply. As such, the student housing market in Kenya is driven by a large volume of private owners with relatively small portfolios of off-campus hostels, where the quality of accommodation is often way below what students want, or expect. We expect that the government’s policy to have a university in every county as well as plans to increase international students to 30,000, will sustain the high student accommodation demand, creating an opportunity for investors to meet the demand for well-located, high-quality and affordable accommodation.
For investment opportunity, Nairobi Metropolitan Area hosts the majority of the big local universities including the University of Nairobi, Kenyatta University (KU), Jomo Kenyatta University of Agriculture and Technology (JKUAT) and accounts for a majority share of the total student enrolment at 43.1% as per the 2018/19 academic year. Additionally, Nairobi hosts the best private universities in Kenya popular with international students, namely, United States International University and Strathmore University, and as such, we expect that the region will continue to present a large gap for quality purpose-built accommodation.
To have successful student housing, that benefits from constant occupancy rates and consistent rental income, investors should conduct thorough research to identify the niche markets. The developments should be in-line with international standards such as (i) high-quality finishes and amenities, (ii) thoughtful and market-specific design, and (iii) are located in close proximity to universities, ideally less than five minutes walking distance.
Disclaimer: The views expressed in this publication are those of the writers where particulars are not warranted. This publication is meant for general information only and is not a warranty, representation, advice or solicitation of any nature. Readers are advised in all circumstances to seek the advice of a registered investment advisor.

- Talk to us
- Kenya
- P.O Box 20695 - 00200, Nairobi, Kenya
- Cell +254709101200
- Tel +254709101200
- WhatsApp +254741676635
- United States
- +254709101200
- DOWNLOAD OUR APP
-


- Kenya
- 8th Floor, Pinetree Plaza, Kaburu Drive, Ngong Road, Nairobi, Kenya
- USA
- Suite 1150, 1775 Eye Street NW, USA, Washington DC 20006, USA
- Investments
- High Yield
- Private Equity
- Real Estate
- Real Estate
- RiverRun Estates
- Cytonn Towers
- The Ridge
- Taraji Heights
- The Alma