Unit Trust Funds Performance, Q2'2021, & Cytonn Weekly #42/2021
By Cytonn Research, Oct 24, 2021
Executive Summary
Kenya’s 2022 Election Campaign Promises Tracker
Fixed Income
During the week, T-bills remained undersubscribed, with the overall subscription rate coming in at 74.2%, a marginal decline from 74.3% recorded the previous week. The 91-day paper recorded the highest subscription rate, receiving bids worth Kshs 6.5 bn against the offered Kshs 4.0 bn, translating to a subscription rate of 163.0%, a significant increase from the 75.4% recorded the previous week. The oversubscription was partly attributable to increased investors’ preference due to the better risk adjusted return. The subscription rate for the 182-day and the 364-day papers decreased to 65.3% and 47.6%, from 90.1% and 58.2%, respectively, recorded the previous week. The yields on the 91-day and 364-day papers increased by 6.8 bps and 13.0 bps, to 7.0% and 8.4%, respectively, while the yield on the 182-day paper declined by 1.1 bps to 7.4%. The government continued to reject expensive bids, accepting bids worth Kshs 15.9 bn out of the Kshs 17.8 bn bids received, translating to an acceptance rate of 89.0%;
We are projecting the y/y inflation rate for October 2021 to fall within the range of 6.2% - 6.6%, compared to 6.9% recorded in September, mainly driven by the decrease in fuel prices coupled with stable food prices during the month. Also, the National Treasury gazetted the revenue and net expenditures for the first three months of FY’2021/2022, highlighting that total revenue collected as at the end of September 2021 amounted to Kshs 463.5 bn, equivalent to 26.1% of the Kshs 1,775.6 bn budgeted amounts and is 104.4% ahead of the prorated estimates of Kshs 443.9 bn;
Equities
During the week, the equities market recorded mixed performance, with NASI and NSE 20 declining by 0.2% and 0.5%, respectively, while NSE 25 remained relatively unchanged. This week’s performance took their YTD performance to gains of 17.4%, 4.7% and 13.4% for NASI, NSE 20 and NSE 25, respectively. The equities market performance during the week was driven by gains recorded by large cap stocks such as EABL and Equity Group which gained by 2.7% and 0.9%, respectively. The gains were however weighed down by losses recorded by banking stocks such as NCBA, Diamond Trust Bank (DTB-K) and KCB Group, which declined by 2.9%, 2.1% and 2.0% respectively;
Real Estate
During the week, Knight Frank Kenya, a real estate consultancy firm, released the Africa Logistics Industrial Review H1’2021 report, highlighting that the industrial sector continues to outperform other real estate sectors with average rental yields coming in at 12.0% compared to the 4.8%, 6.9%, and 7.6% yields realized for the residential, commercial office and retail sectors, respectively, in H1’2021. In the infrastructure sector, the national government, through Kenya Urban Roads Authority (KURA) announced plans to revamp sections of the 9.8 Km Ngong Road starting from Dagoretti Corner to Karen Shopping Centre;
Focus of the Week
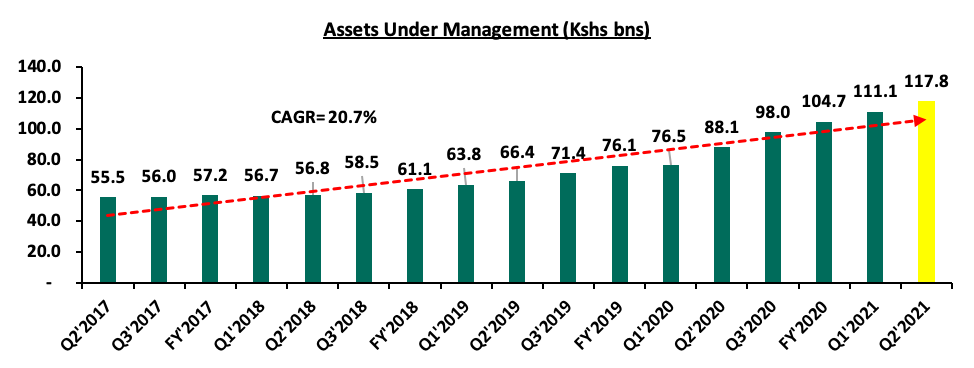
Following the release of the Capital Markets Authority (CMA) Quarterly Statistical Bulletin – Q3’2021, we examine the performance of Unit Trust Funds, as the total Assets Under Management (AUM) of Unit Trust Funds have been steadily increasing. During the period of review, Unit Trusts’ Assets Under Management grew by 6.0% to Kshs 117.8 bn as at the end of Q2’2021, from Kshs 111.1 bn recorded in Q1’2021. Additionally, as at the end of Q2’2021, there were 25 approved Collective Investment Schemes;
Investment Updates:
- Weekly Rates:
- Cytonn Money Market Fund closed the week at a yield of 10.54%. To invest, just dial *809#;
- Cytonn High Yield Fund closed the week at a yield of 13.95% p.a. To invest, email us at sales@cytonn.com and to withdraw the interest you just dial *809#;
- We continue to offer Wealth Management Training Monday through Saturday, from 9:00 am to 11:00 am, through our Cytonn Foundation. The training aims to grow financial literacy among the general public. To register for any of our Wealth Management Trainings, click here;
- If interested in our Private Wealth Management Training for your employees or investment group, please get in touch with us through wmt@cytonn.com;
- The court ordered the placement of the CHYS and CPN into administration to allow for proper reorganization of the two funds that have been facing some liquidity challenges. For more information, click here;
- Any CHYS and CPN investors still looking to convert are welcome to consider one of the five projects currently available for conversion, click here for the latest conversion term sheet;
- Cytonn Insurance Agency acts as an intermediary for those looking to secure their assets and loved ones’ future through insurance namely; Motor, Medical, Life, Property, WIBA, Credit and Fire and Burglary insurance covers. For assistance, get in touch with us through insuranceagency@cytonn.com;
- Cytonnaire Savings and Credit Co-operative Society Limited (SACCO) provides a savings and investments avenue to help you in your financial planning journey. To enjoy competitive investment returns, kindly get in touch with us through clientservices@cytonn.com;
Real Estate Updates:
- For an exclusive tour of Cytonn’s real estate developments, visit: Sharp Investor's Tour, and for more information, email us at sales@cytonn.com;
- Phase 3 of The Alma is now ready for occupation. To rent please email properties@cytonn.com;
- We have 8 investment-ready projects, offering attractive development and buyer targeted returns; See further details here: Summary of Investment-ready Projects;
- For recent news about the group, see our news section here;
Hospitality Updates:
- We currently have promotions for Staycations. Visit cysuites.com/offers for details or email us at sales@cysuites.com;
- Share a meal with a friend during the Sunday Brunch at The Hive Restaurant at Cysuites Hotel and Apartment. Every Sunday from 11.00 AM to 4.00 PM at a price of Kshs 2,500 for Adults and Kshs 1,500 for children under 12 years;
Election Watch:
Kenya’s next Presidential Elections are set to be held in August 2022 and with less than a year left, we have seen the political temperatures in the country continue to rise. As such, we shall be analyzing the economic campaign promises made by the politicians and the impact these promises will have in the economy. To read more on the same, click here;
Money Markets, T-Bills Primary Auction:
During the week, T-bills remained undersubscribed, with the overall subscription rate coming in at 74.2%, a marginal decline from 74.3% recorded the previous week. The 91-day paper recorded the highest subscription rate, receiving bids worth Kshs 6.5 bn against the offered Kshs 4.0 bn, translating to a subscription rate of 163.0%, a significant increase from the 75.4% recorded the previous week. The oversubscription was partly attributable to increased investors’ preference for the shorter-dated paper due to the better risk adjusted return. The subscription rate for the 182-day and the 364-day papers decreased to 65.3% and 47.6%, from 90.1% and 58.2%, respectively, recorded the previous week. The yields on the 91-day and 364-day papers increased by 6.8 bps and 13.0 bps, to 7.0% and 8.4%, respectively, while the yield on the 182-day paper declined by 1.1 bps to 7.4%. The government continued to reject expensive bids, accepting bids worth Kshs 15.9 bn out of the Kshs 17.8 bn bids received, translating to an acceptance rate of 89.0%.
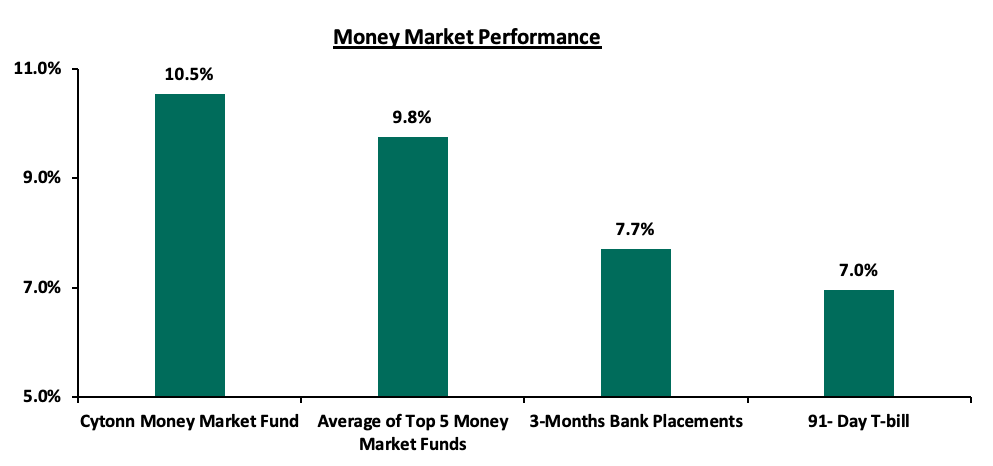
In the money markets, 3-month bank placements ended the week at 7.7% (based on what we have been offered by various banks), while the yield on the 91-day T-bill increased by 6.8 bps to 7.0%. The average yield of the Top 5 Money Market Funds increased by 0.2% points to 9.8%, from 9.6%, recorded the previous week. The yield on the Cytonn Money Market Fund increased marginally by 0.02% points to 10.54%, from 10.52% recorded the previous week.
The table below shows the Money Market Fund Yields for Kenyan Fund Managers as published on 22nd October:
|
Money Market Fund Yield for Fund Managers as published on 22nd October 2021 |
|||
|
Rank |
Fund Manager |
Daily Yield |
Effective Annual Rate |
|
1 |
Cytonn Money Market Fund |
10.02% |
10.54% |
|
2 |
Zimele Money Market Fund |
9.56% |
9.91% |
|
3 |
Nabo Africa Money Market Fund |
9.26% |
9.70% |
|
4 |
Madison Money Market Fund |
9.00% |
9.42% |
|
5 |
Sanlam Money Market Fund |
8.84% |
9.24% |
|
6 |
CIC Money Market Fund |
8.72% |
9.03% |
|
7 |
Apollo Money Market Fund |
9.10% |
8.95% |
|
8 |
Co-op Money Market Fund |
8.28% |
8.63% |
|
9 |
Dry Associates Money Market Fund |
8.28% |
8.60% |
|
10 |
GenCapHela Imara Money Market Fund |
8.24% |
8.59% |
|
11 |
British-American Money Market Fund |
8.19% |
8.51% |
|
12 |
Orient Kasha Money Market Fund |
8.04% |
8.37% |
|
13 |
ICEA Lion Money Market Fund |
8.02% |
8.35% |
|
14 |
NCBA Money Market Fund |
8.01% |
8.32% |
|
15 |
Old Mutual Money Market Fund |
6.98% |
7.21% |
|
16 |
AA Kenya Shillings Fund |
6.14% |
6.31% |
Source: Business Daily
Liquidity:
During the week, liquidity in the money market eased slightly, with the average interbank rate declining marginally to 4.5%, from 4.6% recorded the previous week, partly attributable to government payments coupled with Treasury Bills redemptions of Kshs 6.5 bn, which offset tax remittances. Additionally, there was a 3.6% increase in the average volumes traded in the interbank market to Kshs 12.9 bn, from Kshs 12.4 bn recorded the previous week.
Kenya Eurobonds:
During the week, the yields on Eurobonds recorded mixed performance, with the 10-year bond issued in 2018 increasing by 0.3% points to 6.0%, from 5.7% recorded the previous week. Similarly, the yields on the 10-year bond issued in 2014, the 7-year bond and 12-year bond issued in 2019 increased by 0.1% points to 3.6%, 5.5% and 6.8%, from 3.5%, 5.4% and 6.7% recorded the previous week, respectively, while the yields on the 30-year bond issued in 2018 and the 12-year bond issued in 2021 remained unchanged at 7.9% and 6.6%, respectively. Below is a summary of the performance:
|
Kenya Eurobond Performance |
||||||
|
|
2014 |
2018 |
2019 |
2021 |
||
|
Date |
10-year issue |
10-year issue |
30-year issue |
7-year issue |
12-year issue |
12-year issue |
|
31-Dec-20 |
3.9% |
5.2% |
7.0% |
4.9% |
5.9% |
- |
|
30-Sep-21 |
3.2% |
5.4% |
7.5% |
5.0% |
6.5% |
6.5% |
|
15-Oct-21 |
3.5% |
5.7% |
7.9% |
5.4% |
6.7% |
6.6% |
|
18-Oct-21 |
3.5% |
5.8% |
7.9% |
5.5% |
6.8% |
6.6% |
|
19-Oct-21 |
3.6% |
5.8% |
7.9% |
5.5% |
6.8% |
6.6% |
|
20-Oct-21 |
3.7% |
5.8% |
7.9% |
5.5% |
6.8% |
6.6% |
|
21-Oct-21 |
3.6% |
6.0% |
7.9% |
5.5% |
6.8% |
6.6% |
|
Weekly Change |
0.1% |
0.3% |
0.0% |
0.1% |
0.1% |
0.0% |
|
MTD Change |
0.4% |
0.6% |
0.4% |
0.5% |
0.3% |
0.1% |
|
YTD Change |
(0.3%) |
0.8% |
0.9% |
0.6% |
0.9% |
- |
Kenya Shilling:
During the week, the Kenyan shilling depreciated marginally by 0.2% against the US dollar to close the week at Kshs 111.1, from Kshs 110.9 recorded the previous week, mainly attributable to increased dollar demand from energy and merchandise importers. On a YTD basis, the shilling has depreciated by 1.7% against the dollar, in comparison to the 7.7% depreciation recorded in 2020. We expect the shilling to remain under pressure for the remainder of 2021 as a result of:
- Rising uncertainties in the global market due to the Coronavirus pandemic, which has seen investors continue to prefer holding their investments in dollars and other hard currencies and commodities,
- Increased demand from merchandise traders as they beef up their hard currency positions in anticipation for more trading partners reopening their economies globally, and,
- Rising global crude oil prices on the back of supply constraints at a time when demand is picking up with the easing of COVID-19 restrictions and as economies reopen.
The shilling is however expected to be supported by:
- The Forex reserves, currently at USD 9.2 bn (equivalent to 5.6-months of import cover), which is above the statutory requirement of maintaining at least 4.0-months of import cover, and the EAC region’s convergence criteria of 4.5-months of import cover. In addition, the reserves were boosted by the USD 1.0 bn proceeds from the Eurobond issued in July, 2021 coupled with the USD 407.0 mn IMF disbursement and the USD 130.0 mn World Bank loan financing received in June, 2021, and,
- Improving diaspora remittances evidenced by an 18.8% y/y increase to USD 309.8 mn in September 2021, from USD 260.7 mn recorded over the same period in 2020, which has continued to cushion the shilling against further depreciation.
Weekly Highlight:
- October Inflation Projections
We are projecting the y/y inflation rate for October 2021 to fall within the range of 6.2% - 6.6%. The key drivers include:
- The recent decline in fuel prices, with Super Petrol prices decreasing by 3.7% to Kshs 129.7 per litre, from Kshs 134.7 per litre. Diesel and Kerosene prices also declined by 4.3% and 6.6%, respectively, to Kshs 110.6 and Kshs 103.5 per litre, from Kshs 115.6 and Kshs 110.8 per litre, respectively. With fuel being a major contributor to Kenya’s headline inflation, the decrease in fuel prices is expected to ease the upward pressure on the inflation basket,
- Food prices have remained relatively stable during the month attributable to improvement in agricultural output due to the ongoing rains in some parts of the country, and,
- Upward readjustment of the fuel cost charge on electricity bills by 2.3% to Kshs 4.0 per Kilowatt hour (KWh) in October, from Kshs 3.9 per Kilowatt hour (KWh) in September and foreign exchange fluctuation tariff for electricity usage to Kshs 1.0 cents per Kilowatt hour (KWh) in October from 76.0 cents per Kilowatt hour (KWh) last month. The readjustment will increase the cost of electricity consumption for households.
Going forward, we expect the inflation rate to remain within the government’s set range of 2.5% - 7.5%. However, concerns remain high on the widening trade deficit as global fuel prices continue to rise due to supply bottlenecks. We expect the CBK and the Government to employ monetary and fiscal policies in-order to comply with the conditions set by the IMF in the Extended Credit facility agreement in February 2021. In the agreement, IMF indicated that Kenya’s inflation should remain well anchored and between the government target range so that Kenya can continue accessing the loan facility already approved. Given that the next IMF evaluation test date is in December 2021, the government has a sufficient period to readjust in the event of the spike in the inflation rate in the months in between.
- Revenue and Net Exchequer for FY’2021/2022
The National Treasury gazetted the revenue and net expenditures for the first three months of FY’2021/2022, ending 30th September 2021. Below is a summary of the performance:
|
FY'2021/2022 Budget Outturn - As at 30th September 2021 |
|||||
|
Amounts in Kshs billions unless stated otherwise |
|||||
|
Item |
12-months Original Estimates |
3 Months Actual Receipts |
Percentage Achieved |
Prorated Estimates |
% achieved of prorated |
|
Opening Balance |
|
21.3 |
|
|
|
|
Tax Revenue |
1,707.4 |
416.8 |
24.4% |
426.9 |
97.6% |
|
Non-Tax Revenue |
68.2 |
25.4 |
37.2% |
17.0 |
148.9% |
|
Total Revenue |
1,775.6 |
463.5 |
26.1% |
443.9 |
104.4% |
|
External Loans & Grants |
379.7 |
7.7 |
2.0% |
94.9 |
8.1% |
|
Domestic Borrowings |
1,008.4 |
306.8 |
30.4% |
252.1 |
121.7% |
|
Other Domestic Financing |
29.3 |
4.2 |
14.2% |
7.3 |
56.7% |
|
Total Financing |
1,417.4 |
318.7 |
22.5% |
354.3 |
89.9% |
|
Recurrent Exchequer issues |
1,106.6 |
256.4 |
23.2% |
276.6 |
92.7% |
|
CFS Exchequer Issues |
1,327.2 |
276.1 |
20.8% |
331.8 |
83.2% |
|
Development Expenditure & Net Lending |
389.2 |
81.9 |
21.0% |
97.3 |
84.1% |
|
County Governments + Contingencies |
370.0 |
61.1 |
16.5% |
92.5 |
66.0% |
|
Total Expenditure |
3,193.0 |
675.5 |
21.2% |
798.3 |
84.6% |
|
Fiscal Deficit excluding Grants |
(1,417.4) |
(212.0) |
15.0% |
(538.8) |
39.3% |
|
Total Borrowing |
1,388.1 |
314.6 |
22.7% |
347.0 |
90.6% |
The key take-outs from the report include:
- Total revenue collected as at the end of September 2021 amounted to Kshs 463.5 bn, equivalent to 26.1% of the Kshs 1,775.6 bn collection for this financial year and is 104.4% ahead of the prorated estimates of Kshs 443.9 bn. Cumulatively, Tax revenues amounted to Kshs 416.8 bn, equivalent to 24.4% of the target of Kshs 1,707.4 bn and are 97.6% of the prorated estimates of Kshs 426.9 bn,
- Total financing amounted to Kshs 318.7 bn, equivalent to 22.5% of the original estimates of Kshs 1,417.4 tn and is 89.9% of the prorated estimates of Kshs 354.3 bn. Additionally, domestic borrowing amounted to Kshs 306.8 bn, equivalent to 30.4% of the original estimates of Kshs 1.0 tn and is 121.7% ahead of the prorated estimates of Kshs 252.1 bn,
- The total expenditure amounted to Kshs 675.5 bn, equivalent to 21.2% of the original estimates of Kshs 3,193.0 bn, and is 84.6% of the prorated expenditure estimates of Kshs 798.3 bn. Additionally, the net disbursements to recurrent expenditures came in at Kshs 256.4 bn, equivalent to 23.2% of this year’s provisions and 92.7% of the prorated estimates of Kshs 276.6 bn, and development expenditure amounted to Kshs 81.9 bn, equivalent to 21.0% of this year’s budget of Kshs 389.2 bn and is 84.1% of the prorated estimates of Kshs 97.3 bn,
- Consolidated Fund Services (CFS) Exchequer issues lagged behind their prorated target at Kshs 256.4 bn which is 83.2% of the prorated amount of Kshs 331.8 bn. The cumulative public debt servicing cost amounted to Kshs 238.9 bn which is 20.4% of the Kshs 1,169.2 bn, annual target and is 81.7% of the prorated estimates of Kshs 292.3 bn. We expect the debt servicing cost to remain high as the shilling continues to depreciate against the dollar. Further weakening will see the government incur a relatively higher cost to purchase foreign currency used to settle the outstanding debt obligations as the Debt Servicing Suspension Initiative nears expiry, and,
- Total Borrowings as at the end of September 2021 amounted to Kshs 314.6 bn, equivalent to 22.7% of the Kshs 1,388.1 bn annual target and are 90.6% of the prorated estimates of Kshs 347.0 bn. The cumulative domestic borrowing target of Kshs 1.0 tn comprises of adjusted Net domestic borrowings of Kshs 661.6 bn and Internal Debt Redemptions (Roll-overs) of Kshs 346.8 bn.
The strong revenue performance in the first three months of the current fiscal year is commendable and can be attributed to improving macro-economic environment, relaxation of Covid-19 containment measures, and sustained implementation of enhanced compliance efforts by the Kenya Revenue Authority. Additionally, the implementation of the Finance Act 2021 which brought changes to the Excise Duty Tax, Income Tax as well as the Value Added Tax is set to expand the tax base and consequently enhance revenue collection.
Rates in the fixed income market have remained relatively stable due to the tightened but sufficient levels of liquidity in the money markets. The government is 34.8% ahead of its prorated borrowing target of Kshs 215.3 bn having borrowed Kshs 290.2 bn of the Kshs 658.5 bn borrowing target for the FY’2021/2022. We expect a gradual economic recovery going into FY’2021/2022 as evidenced by KRAs collection of Kshs 476.6 bn in revenues during the first quarter of the current deficit year, which is equivalent to 103.2% of the prorated revenue collection target. However, despite the projected high budget deficit of 7.5% and the lower credit rating from S&P Global to 'B' from 'B+', we believe that the monetary support from the IMF and World Bank will mean that the interest rate environment may stabilize since the government will not be desperate for cash.
Markets Performance
During the week, the equities market recorded mixed performance, with NASI and NSE 20 declining by 0.2% and 0.5%, respectively, while NSE 25 remained relatively unchanged. This week’s performance took their YTD performance to gains of 17.4%, 4.7% and 13.4% for NASI, NSE 20 and NSE 25, respectively. The equities market performance during the week was driven by gains recorded by large cap stocks such as EABL and Equity Group which gained by 2.7% and 0.9%, respectively. The gains were however weighed down by losses recorded by banking stocks such as NCBA, Diamond Trust Bank (DTB-K) and KCB Group, which declined by 2.9%, 2.1% and 2.0% respectively.
During the week, equities turnover increased by 53.1% to USD 29.0 mn, from USD 18.9 mn recorded the previous week, taking the YTD turnover to USD 1.0 bn. Foreign investors turned net buyers, with a net buying position of USD 0.3 mn, from a net selling position of USD 0.8 mn recorded the previous week, taking the YTD net selling position to USD 26.3 mn.
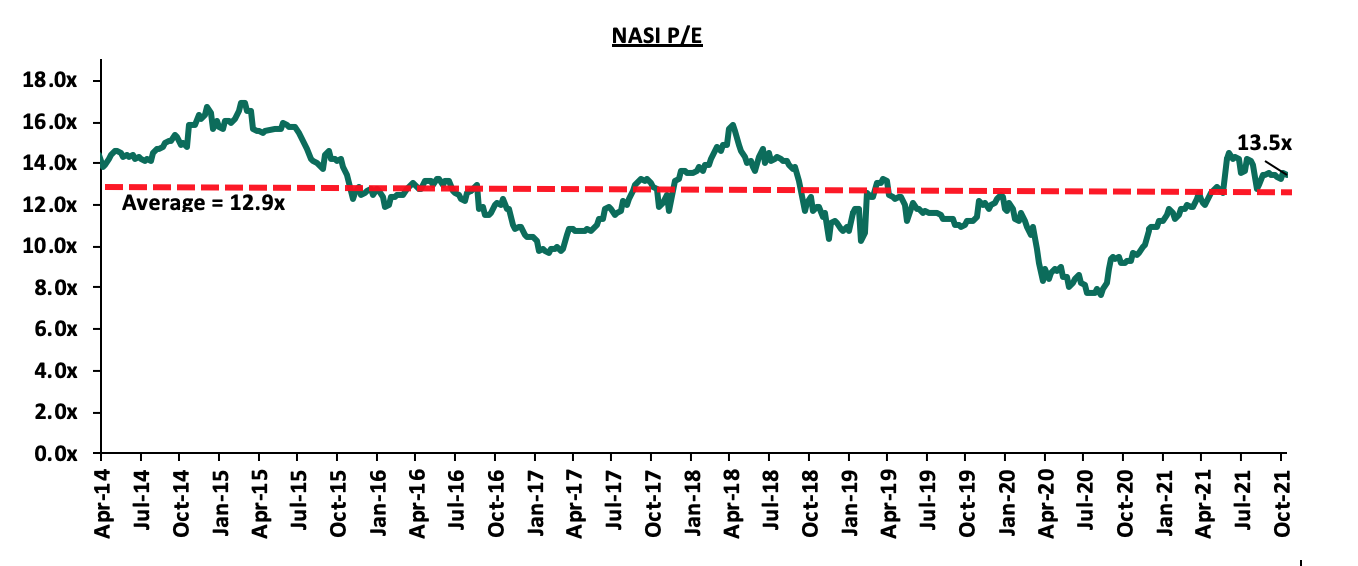
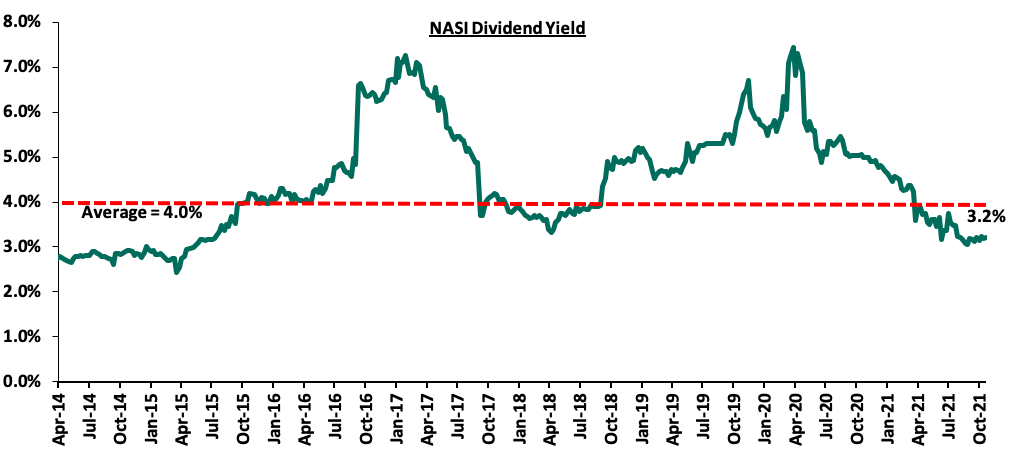
The market is currently trading at a price to earnings ratio (P/E) of 13.5x, 4.7% above the historical average of 12.9x, and a dividend yield of 3.2%, 0.8% points below the historical average of 4.0%. Key to note, NASI’s PEG ratio currently stands at 1.5x, an indication that the market is trading at a premium to its future earnings growth. Basically, a PEG ratio greater than 1.0x indicates the market may be overvalued while a PEG ratio less than 1.0x indicates that the market is undervalued. Excluding Safaricom, which is currently 62.6% of the market, the market is trading at a P/E ratio of 11.7x and a PEG ratio of 1.3x. The current P/E valuation of 13.5x is 75.8% above the most recent trough valuation of 7.7x experienced in the first week of August 2020. The charts below indicate the historical P/E and dividend yields of the market.
Universe of coverage:
|
Company |
Price as at 15/10/2021 |
Price as at 22/10/2021 |
w/w change |
YTD Change |
Year Open 2021 |
Target Price* |
Dividend Yield |
Upside/ Downside** |
P/TBv Multiple |
Recommendation |
|
I&M Group*** |
21.5 |
21.5 |
(0.0%) |
(52.1%) |
44.9 |
32.0 |
10.5% |
59.3% |
0.6x |
Buy |
|
ABSA Bank*** |
10.2 |
10.1 |
(1.0%) |
5.6% |
9.5 |
13.8 |
0.0% |
37.3% |
1.1x |
Buy |
|
Kenya Reinsurance |
2.5 |
2.5 |
(0.4%) |
6.1% |
2.3 |
3.1 |
8.2% |
34.7% |
0.3x |
Buy |
|
NCBA*** |
25.8 |
25.0 |
(2.9%) |
(6.0%) |
26.6 |
31.0 |
6.0% |
30.0% |
0.6x |
Buy |
|
KCB Group*** |
45.1 |
44.2 |
(2.0%) |
15.1% |
38.4 |
53.4 |
2.3% |
23.1% |
1.0x |
Buy |
|
Standard Chartered*** |
128.3 |
129.3 |
0.8% |
(10.6%) |
144.5 |
145.4 |
8.1% |
20.6% |
1.0x |
Buy |
|
Co-op Bank*** |
13.0 |
12.8 |
(1.9%) |
1.6% |
12.6 |
14.1 |
7.8% |
18.4% |
0.9x |
Accumulate |
|
Diamond Trust Bank*** |
59.5 |
58.3 |
(2.1%) |
(24.1%) |
76.8 |
67.3 |
0.0% |
15.5% |
0.3x |
Accumulate |
|
Equity Group*** |
49.5 |
50.0 |
0.9% |
37.8% |
36.3 |
57.5 |
0.0% |
15.1% |
1.4x |
Accumulate |
|
Stanbic Holdings |
86.0 |
90.0 |
4.7% |
5.9% |
85.0 |
96.6 |
1.9% |
9.2% |
0.9x |
Hold |
|
Liberty Holdings |
7.8 |
7.8 |
(0.3%) |
0.8% |
7.7 |
8.4 |
0.0% |
8.2% |
0.6x |
Hold |
|
Sanlam |
12.0 |
11.7 |
(2.5%) |
(10.4%) |
13.0 |
12.4 |
0.0% |
6.4% |
1.0x |
Hold |
|
Jubilee Holdings |
348.5 |
350.0 |
0.4% |
26.9% |
275.8 |
330.9 |
2.6% |
(2.9%) |
0.7x |
Sell |
|
Britam |
7.6 |
7.5 |
(1.8%) |
7.1% |
7.0 |
6.7 |
0.0% |
(10.7%) |
1.4x |
Sell |
|
HF Group |
3.7 |
3.8 |
1.3% |
19.7% |
3.1 |
3.1 |
0.0% |
(17.6%) |
0.2x |
Sell |
|
CIC Group |
2.7 |
2.6 |
(2.2%) |
24.6% |
2.1 |
1.8 |
0.0% |
(31.6%) |
0.9x |
Sell |
|
Target Price as per Cytonn Analyst estimates **Upside/ (Downside) is adjusted for Dividend Yield ***For Disclosure, these are stocks in which Cytonn and/or its affiliates are invested in Key to note, I&M Holdings YTD share price change is mainly attributable to the counter trading ex-bonus issue |
||||||||||
We are “Neutral” on the Equities markets in the short term. With the market currently trading at a premium to its future growth (PEG Ratio at 1.5x), we believe that investors should reposition towards companies with a strong earnings growth and are trading at discounts to their intrinsic value. Additionally, we expect the recent relaxation of lockdown measures in the country to have a positive impact on the economic outlook.
During the week, Knight Frank Kenya, a real estate consultancy firm, released the Africa Logistics Industrial Review H1’2021, a report that highlights the performance of the real estate industrial sector across various countries in Africa. The following were the key highlights from the report;
- The industrial sector continues to outperform other real estate sectors with average rental yields coming in at 12.0% in H1’2021. This is mainly attributed to; i) increased demand for urban logistic facilities as a result of improving appetite for industrial stock by investors, ii) improved infrastructure boosting industrial activities, and, iii) uptick in online retail sales which in return boost uptake for warehouses,
- Kinshasa recorded the highest average rental yields at 15.0%, 3.0% points higher than the market average of 12.0%, attributed to higher rental rates recorded at Kshs 1,110 ($10.0) per SQM against the market average of Kshs 632.7 ($5.7) per SQM, as well as improved occupier demand, and,
- The rental rates for prime industrial spaces in Nairobi realized a 27.7% improvement to Kshs 666.0 ($6.0) per SQM in 2021 from Kshs 521.7 ($4.7) per SQM recorded in 2018, hence ranking position 9 out of the 27 countries. The rental yields came in at 8.5% compared to the 4.8%, 6.9%, and 7.6% yields realized for the residential, commercial office and retail sectors, respectively, in H1’2021. The overall performance was driven by; (i) expansion of local and international retailers seeking storage space for goods, (ii) government focus on the Big 4 Agenda on manufacturing which is expected to influence demand for warehouses used to manufacture products, (iii) improvement of infrastructure, for instance Standard Gauge Railway project which is expected to increase the output of Special Economic Zones, and, (iv) e-commerce driving demand for warehouse spaces.
The table below shows summary of the industrial sector rental performance of prime cities in Africa;
|
Summary of Industrial Sector Rental Performance of Prime Cities In Africa H1’2021 |
|||
|
Rank |
City |
Asking Rents (USD/SQM) H1’2021 |
Prime Rental Yields H1’2021 |
|
1 |
Kinshasa |
10.0 |
15.0% |
|
2 |
Algiers |
10.0 |
13.0% |
|
3 |
Dakar |
9.8 |
13.0% |
|
4 |
Libreville |
8.0 |
15.0% |
|
5 |
Maputo |
7.5 |
10.0% |
|
6 |
Abidjan |
7.4 |
12.0% |
|
7 |
Dar Es Salaam |
7.0 |
10.0% |
|
8 |
Kampala |
6.0 |
13.0% |
|
9 |
Nairobi |
6.0 |
8.5% |
|
10 |
Casablanca |
5.6 |
12.0% |
|
11 |
Gaborone |
5.6 |
8.5% |
|
12 |
Luanda |
5.5 |
12.0% |
|
13 |
Johannesburg |
5.5 |
10.0% |
|
14 |
Tunis |
5.0 |
14.0% |
|
15 |
Accra |
5.0 |
10.0% |
|
16 |
Port Luis |
5.0 |
10.0% |
|
17 |
Cairo |
5.0 |
10.0% |
|
18 |
Antananarivo |
5.0 |
9.0% |
|
19 |
Cape Town |
4.8 |
10.0% |
|
20 |
Lusaka |
4.5 |
13.0% |
|
21 |
Addis Ababa |
4.5 |
9.0% |
|
22 |
Lagos |
4.4 |
12.0% |
|
23 |
Bamako |
4.0 |
14.0% |
|
24 |
Douala |
3.5 |
12.0% |
|
25 |
Lilongwe |
3.5 |
12.0% |
|
26 |
Harare |
3.3 |
11.0% |
|
27 |
Blantyre |
2.5 |
12.0% |
|
Average |
|
5.7 |
12.0% |
Source: Knight Frank Research, N/B: 1.0 USD = Kshs 111.0
We expect the industrial sector to continue registering remarkable performance as a result of the sophisticated and numerous infrastructure development activities going on in the country thus boosting industrial activity, coupled with the rising demand for warehouses.
- Infrastructure
During the week, the national government through Kenya Urban Roads Authority (KURA) announced plans to revamp sections of the 9.8 Km Ngong Road starting from Dagoretti Corner to Karen Shopping Centre. The construction of the project worth Kshs 3.0 bn fully funded by the government commenced in July 2017 by and was being undertaken by a Chinese firm, Quinjian International Group (K) Limited as the main contractor, and was to be completed in 2019 however works stalled midway due to construction irregularities leading to government halting the project, at a completion rate of 95.0%. According to KURA, the project is part and parcel of the construction and infrastructure upgrades aimed at elevating Nairobi City’s status to a more superior level. Upon its completion, it will further improve access to neighbouring areas, promote the safety of the road users, as well as boost property prices, and, create investment opportunities in the surrounding areas. Moreover, the decision also further supports government’s initiative to develop quality and adequate roads to make Kenya an intra-regional hub for trade in East Africa in the country, as also evidenced by the various projects initiated and implemented such as; i) Nairobi Commuter Rail project, ii) Nairobi Expressway project, iii) Standard Gauge Railway Phase 2A, and, iv) Nairobi Western Bypass, among other key projects.
We expect the infrastructure sector to continue recording more development activities mainly due to government’s aggressiveness to implement and complete projects, evidenced by the additional 0.6% budget allocation to Kshs 182.5 bn for the FY’2021/2022, from Kshs 181.4 bn in FY’2020/2021 aimed at facilitating the construction and renovation of roads in Kenya.
The graph below shows the budget allocation to the infrastructure sector over the last nine financial years:
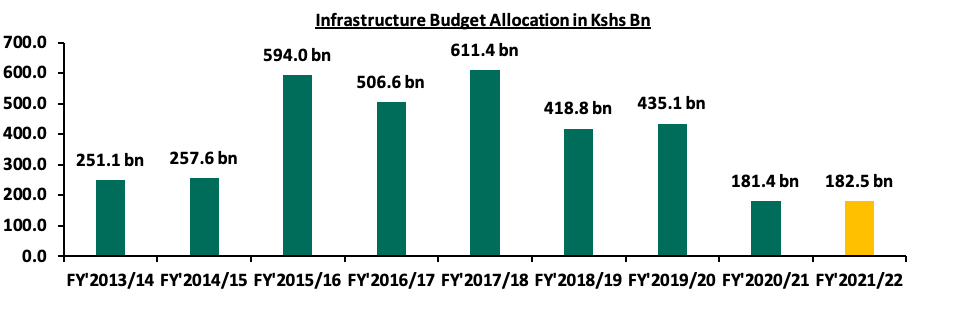
Source: National Treasury
Real estate sector in Kenya is expected to continue recording increased activities and improved performance mainly attributed to the infrastructure development activities which eases access to various areas in the country as well as opening them up for investments.
Unit Trust Funds (UTFs) are Collective Investment Schemes that pool funds from different investors and are managed by professional fund managers. The fund managers invest the pooled funds in a portfolio of securities with the aim of generating returns to meet the specific objectives of the fund. Following the release of the Capital Markets Authority (CMA) Quarterly Statistical Bulletin – Q3’2021, we analyze the performance of Unit Trust Funds, as the total Assets Under Management (AUM) have been steadily increasing and they are among the most popular investment options in the Kenyan market. We will further analyze the performance of Money Market Funds, a product under Unit Trust Funds. In our previous focus on Unit Trust Funds, we looked at the Q1'2021 Unit Trust Funds Performance by Fund Managers. In this topical, we focus on the Q2’2021 performance of Unit Trust Funds where we shall analyze the following:
- Performance of the Unit Trust Funds Industry,
- Performance of Money Market Funds,
- Comparing Unit Trust Funds AUM Growth with other Markets, and,
- Recommendations
Section I: Performance of the Unit Trust Funds Industry
Unit Trust Funds are investment schemes that pool funds from investors and are managed by professional Fund Managers. The fund manager invests the pooled funds with the aim of generating returns in line with the specific objectives of the fund. The Unit Trust Funds earn returns in the form of dividends, interest income, rent and/or capital gains depending on the underlying security. The main types of Unit Trust Funds include:
- Money Market Funds – These are funds that invests in fixed income securities such as fixed deposits, treasury bills and bonds, commercial papers, etc. They are very liquid, have stable returns, and, they are suitable for risk averse investors,
- Equity Funds – These are funds which largely invest in listed securities and seek to offer superior returns over the medium to long-term by maximizing capital gains and dividend income. The funds invest in various sectors to reduce concentration of risk and maintain some portion of the fund’s cash in liquid fixed income investments to maintain liquidity and pay investors if need be without losing value,
- Balanced Funds – These are funds whose investments are diversified across the Equities and the Fixed Income market. The Balanced Fund offers investors long-term growth as well as reasonable levels of stability of income,
- Fixed Income Funds – These are funds which invest in interest-bearing securities, which include treasury bills, treasury bonds, preference shares, corporate bonds, loan stock, approved securities, notes and liquid assets consistent with the portfolio’s investment objective, and,
- Sector Specific Funds – These are funds that invest primarily in a particular sector or industry. The funds provide a greater measure of diversification within a given sector than may be otherwise possible for the other funds. They are specifically approved by the capital Markets Authority as they are not invested as per the set rules and regulations.
As per the Capital Markets Authority (CMA) Quarterly Statistical Bulletin – Q3’2021, the industry’s overall Assets Under Management (AUM) grew by 6.0% to Kshs 117.8 bn during the second quarter from Kshs 111.1 bn as at the end of Q1’2021. Assets Under Management of the Unit Trust Funds have grown at a 4-year CAGR of 20.7% to Kshs 117.8 bn in Q2’2021, from Kshs 55.5 bn recorded in Q2’2017.
This growth can be largely attributable to:
- Low Investments minimums for plain vanilla funds: Unit Trust Funds have become relatively affordable to retail investors, with a majority of the Collective Investment Schemes’ (CIS) in the market requiring an initial investment ranging between Kshs 100.0 - Kshs 10,000.0,
- Increased Investor Knowledge: There has been a drive towards investor education which has meant that more people are aware and have a deeper understanding of the investment subject. As a result, their confidence has been boosted and more of them are investing,
- Diversified product offering: Unit Trust Funds are also advantageous in terms of offering investors the opportunity of diversifying their portfolios by providing them with access to a wider range of investment securities through pooling of funds, which would have not been accessible if they invested on their own,
- Efficiency and ease of access to cash/High Liquidity: Funds invested in UTFs are invested as portfolios with different assets and the fund managers always maintain a cash buffer. They are relatively liquid and investors can get their cash on demand. Unit trusts are highly liquid, as it is easy to sell and buy units without depending on demand and supply at the time of investment or exit, and,
- Adoption of Fintech: Digitization and automation within the industry has enhanced liquidity, enabling investors to receive their funds within 3 to 5 working days if they are withdrawing to their bank accounts, and immediate access to funds when withdrawing via M-PESA. According to the Central Bank of Kenya, more and more individuals are transacting through mobile money services as evidenced by the increase in the total number of registered mobile money accounts to 68.1 mn in August 2021 from 66.6 mn recorded in January 2021. Fintech has increased the efficiency of processing both payments and investments for fund managers.
According to the Capital Markets Authority, as at the end of Q2’2021, there were 25 approved Collective Investment Schemes in Kenya. Out of the 25, however, only 19 were active while 6 were inactive. During the period under review, total Assets Under Management grew by 6.0% to Kshs 117.8 bn in Q2’2021, from Kshs 111.1 bn as at the end of Q1’2021. The table below outlines the performance of the Fund Managers:
|
Assets Under Management (AUM) for the Approved and Active Collective Investment Schemes |
||||||
|
No. |
Fund Managers |
Q1’2021 AUM (Kshs mns) |
Q1’2021 Market Share |
Q2’2021 AUM (Kshs mns) |
Q2’2021 Market Share |
AUM Growth Q1'2021-Q2'2021 |
|
1 |
CIC Asset Managers |
44,761.7 |
40.3% |
47,292.8 |
40.2% |
5.7% |
|
2 |
NCBA Unit Trust Scheme |
13,609.4 |
12.3% |
14,814.0 |
12.6% |
8.9% |
|
3 |
Britam |
14,150.3 |
12.7% |
14,429.4 |
12.3% |
2.0% |
|
4 |
ICEA Lion |
11,843.3 |
10.7% |
12,553.8 |
10.7% |
6.0% |
|
5 |
Sanlam Investments |
6,758.7 |
6.1% |
7,631.1 |
6.5% |
12.9% |
|
6 |
Old Mutual |
6,168.5 |
5.6% |
6,292.0 |
5.3% |
2.0% |
|
7 |
Dry Associates |
2,581.9 |
2.3% |
2,678.6 |
2.3% |
3.7% |
|
8 |
Nabo Capital (Centum) |
1,778.7 |
1.6% |
2,446.1 |
2.1% |
37.5% |
|
9 |
Madison Asset Managers |
1,896.8 |
1.7% |
1,972.1 |
1.7% |
4.0% |
|
10 |
African Alliance Kenya |
1,827.7 |
1.7% |
1,850.3 |
1.6% |
1.2% |
|
11 |
Zimele Asset Managers |
1,454.5 |
1.3% |
1,663.3 |
1.4% |
14.4% |
|
12 |
Co-op Trust Investment Services Limited |
1,371.9 |
1.2% |
1,500.9 |
1.3% |
9.4% |
|
13 |
Cytonn Asset Managers |
960.2 |
0.9% |
772.0 |
0.7% |
(19.6%) |
|
14 |
Genghis Capital |
645.5 |
0.6% |
683.8 |
0.6% |
5.9% |
|
15 |
Apollo Asset Managers |
685.8 |
0.6% |
634.8 |
0.5% |
(7.4%) |
|
16 |
Equity Investment Bank |
297.9 |
0.3% |
289.4 |
0.2% |
(2.9%) |
|
17 |
Alpha Africa Asset Managers |
216.4 |
0.2% |
222.0 |
0.2% |
2.6% |
|
18 |
Amana Capital |
75.6 |
0.1% |
45.1 |
0.0% |
(40.3%) |
|
19 |
Wanafunzi Investments |
0.6 |
0.0% |
0.6 |
0.0% |
3.9% |
|
20 |
Metropolitan Cannon Asset Managers |
- |
- |
- |
- |
- |
|
21 |
FCB Capital Limited |
- |
- |
- |
- |
- |
|
22 |
Fusion Investment Management Ltd |
- |
- |
- |
- |
- |
|
23 |
Standard Chartered Investment Services |
- |
- |
- |
- |
- |
|
24 |
Natbank Trustee & Investment Services |
- |
- |
- |
- |
- |
|
25 |
Absa Asset Management Ltd |
- |
- |
- |
- |
- |
|
Total |
111,085.3 |
100.0% |
117,771.8 |
100.0% |
6.0% |
|
Source: Capital Markets Authority: Quarterly Statistical Bulletin, Q3’2021
Key to note from the above table:
- Assets Under Management: CIC Asset Managers remained the largest overall Unit Trust Fund Manager with an AUM of Kshs 47.3 bn in Q2’2021, from an AUM of Kshs 44.8 bn in Q1’2021, translating to a 5.7% AUM growth,
- Market Share: CIC Asset Managers remained the largest overall Unit Trust with a market share of 40.2%, a marginal decline from 40.3% in Q1’2021. Key to note, Nabo Capital recorded the highest increase in its market share with the market share increasing to 2.1%, from 1.6% in Q1’2021, and,
- Growth: In terms of AUM growth, Nabo Capital recorded the strongest growth of 37.5%, with its AUM increasing to Kshs 2.4 bn, from Kshs 1.8 bn in Q1’2021 while Amana Capital recorded the largest decline, with its AUM declining by 40.3% to Kshs 45.1 mn in Q2’2021, from Kshs 75.6 mn in Q1’2021.
- Metropolitan Cannon Asset Managers, FCB Capital Limited, Fusion Investment Management Ltd, Standard Investment Trust, NatBank Trustee & Investment Services, and ABSA Asset Management Ltd remained inactive as at the end of Q2’2021.
Section II: Performance of Money Market Funds
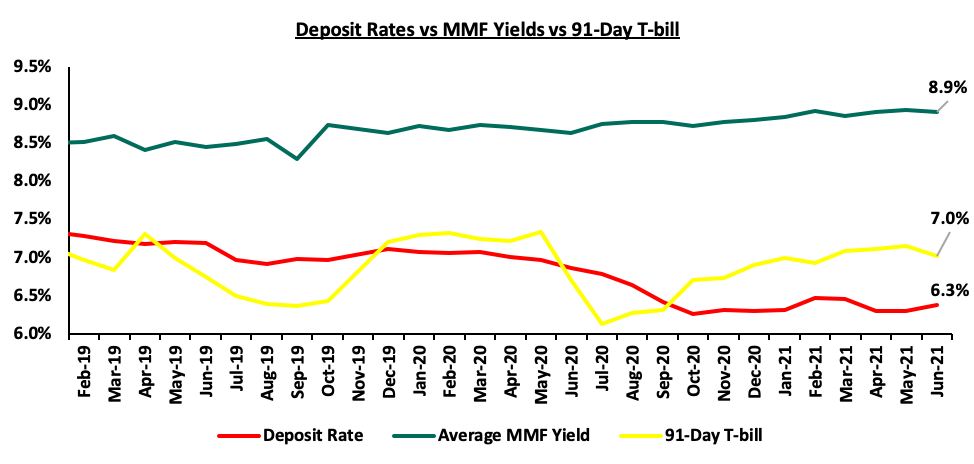
Money Market Funds (MMFs) in the recent past have gained popularity in Kenya, with one of the main reasons being the higher returns money market funds offer compared to the returns on bank deposits and treasury bills. According to the Central Bank of Kenya data, the average deposit rate during the year declined to 6.3% in Q2’2021, from an average of 6.4% recorded in Q1’2021. The average deposit rate and average 91-Day T-bill rate remained lower than the average MMF yields of 8.9%.
As per the regulations, funds in MMFs should be invested in liquid interest-bearing securities. These securities include bank deposits, securities listed on the Nairobi Securities Exchange (NSE), and securities issued by the Government of Kenya. The fund is best suited for investors who require a low-risk investment that offers capital stability, liquidity, and require a high-income yield. The fund is also a good safe haven for investors who wish to switch from a higher risk portfolio to a low risk portfolio, especially in times of uncertainty.
Top Five Money Market Funds by Yields
During the period under review, the following Money Market Funds had the highest average effective annual yield declared, with the Cytonn Money Market Fund having the highest effective annual yield at 10.5% against the industrial average of 8.9%.
|
Top 5 Money Market Fund Yield in Q2'2021 |
||
|
Rank |
Money Market Fund |
Effective Annual Rate (Average Q2'2021) |
|
1 |
Cytonn Money Market Fund |
10.5% |
|
2 |
Nabo Africa Money Market Fund |
10.1% |
|
3 |
Zimele Money Market Fund |
9.9% |
|
4 |
Orient Kasha Money Market Fund |
9.7% |
|
5 |
GenCapHela Imara Money Market Fund |
9.6% |
|
|
Industrial Average |
8.9% |
Section III: Comparing Unit Trust Funds AUM Growth with other Markets
Unit Trust Funds assets recorded a q/q growth of 6.0% in Q2’2021, while the listed bank deposits recorded a weighted growth of 18.4% over the same period. For both the Unit Trust Funds and bank deposits, this was lower than the values recorded as at Q2’2020 of 15.1% and 18.5%, respectively. The chart below highlights the Unit Trust Funds AUM growth vs bank deposits growth in Q2’2021;
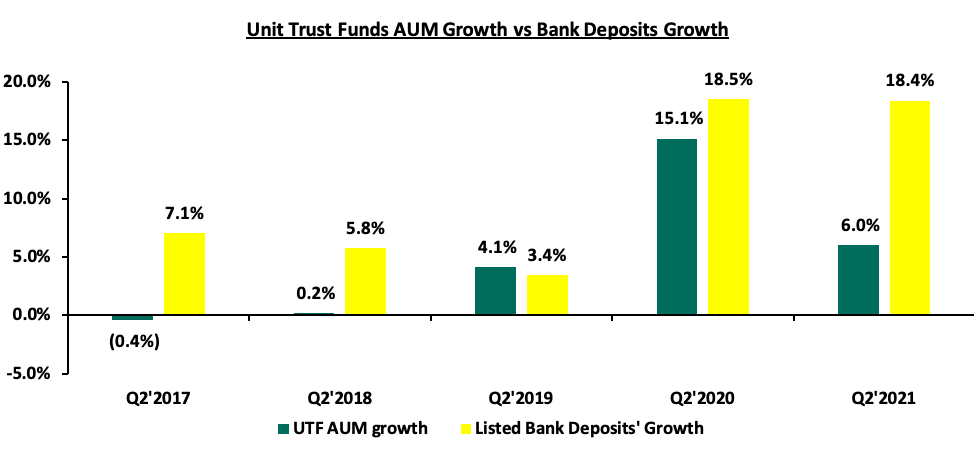
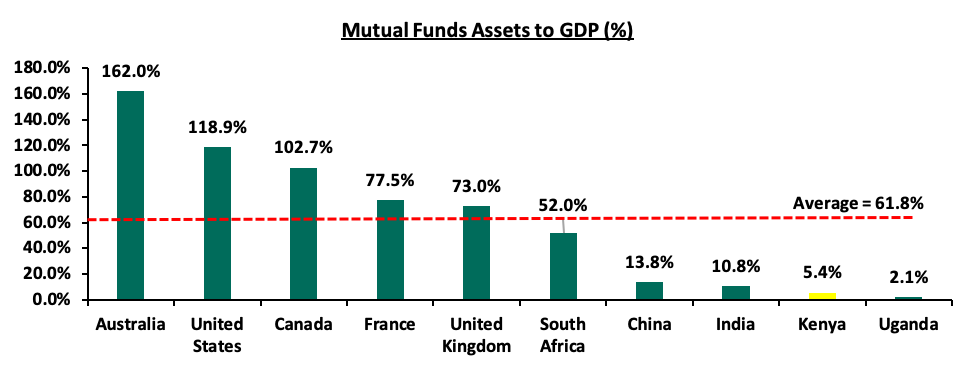
Bank deposit growth at 18.4% outpaced UTFs growth of 6.0%, and save for Q2’2019, bank deposit growth usually outpace UTFs growth, an indication that our capital markets potential and growth remains constrained. According to World Bank data, in well-functioning economies, businesses rely on bank funding for a mere 40.0%, with the larger percentage of 60.0% coming from the Capital markets. Closer home, CMA notes that in 2020, businesses in Kenya relied on banks for 95.0% of their funding while less than 5.0% came from the capital markets. Notably, our Mutual Funds/UTFs to GDP ratio at 5.4% is still very low compared to global average of 61.8%, indicating that we still have room to improve and enhance our capital markets. The table below shows some countries’ mutual funds as a percentage of GDP:
Source: World Bank Data
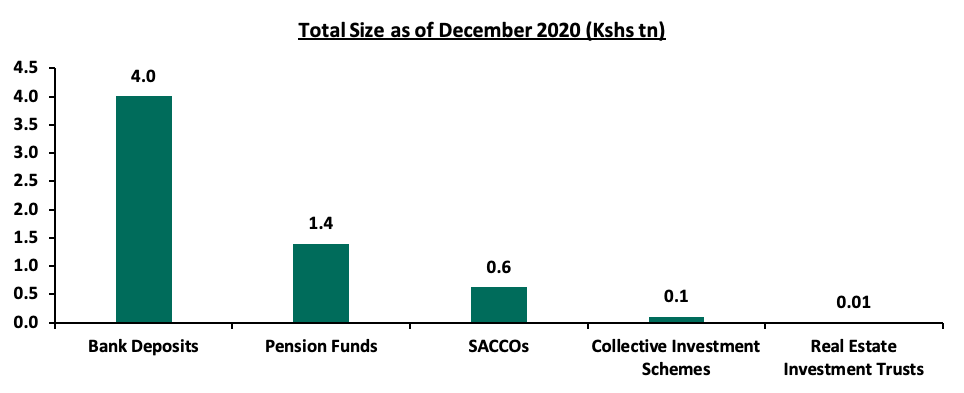
Over the past 4 years, the UTFs AUM has grown at a CAGR of 20.7% to Kshs 117.8 bn in Q2’2021, from Kshs 55.5 bn recorded in Q2’2017. However, even at Kshs 117.8 bn, the industry is dwarfed by asset gatherers such as bank deposits at Kshs 4.0 tn and the pension industry at Kshs 1.4 tn as of the end of 2020. Below is a graph showing the sizes of different saving channels and capital market products in Kenya as at December 2020:
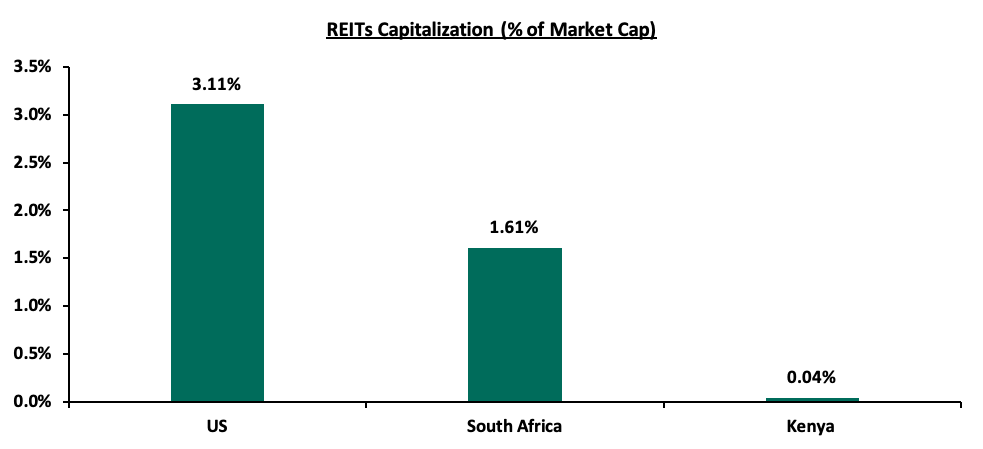
On a REITs to Market Cap Ratio, Kenya also still has a lot of room for improvement. The listed REITs capitalization as a percentage of Total market cap in the US stands at 3.11% compared to 1.61% in South Africa and 0.04% in Kenya. Below is a graph showing comparison of Kenya’s REITs to Market Cap Ratio to that of United States (US) and South Africa:
Section IV: Recommendations
In order to improve our Capital Markets and stimulate its growth, we recommend the following actions:
- Provide Support to Fund Managers: We believe that the regulator, CMA, needs to include market stabilization tools as part of the regulations/Act that will help Fund Managers meet fund obligations during times of distress – such as mass withdrawals. We do commend the regulator on its role on protecting investor interests. However, since Fund Managers also play a key role in the capital markets, the regulator should also be able to protect the brand image of various fund managers in the industry. We believe that working together with industry players to resolve matters rather than alienating and publicly ostracizing industry players facing challenges may not particularly be in investors’ interest,
- Allow for sector funds: The current capital markets regulations require that funds must diversify. Consequently, one has to seek special dispensation in the form of sector funds such as a financial services fund, a technology fund or a real estate UTF fund. Regulations allowing unit holders to invest in sector funds would expand the scope of unit holders interested in investing,
- Reduce the minimum investments to reasonable amounts: Currently, the minimum investment for sector specific funds is Kshs 1.0 mn, while that for Development REITS is currently at Kshs 5.0 mn. The high minimum initial and top up investments amounts are unreasonably high given that the national median income for employed individuals is estimated at around Kshs 50,000. It therefore locks out a lot of potential investors. Additionally, these high amounts discriminate against most retail investors, giving them fewer investment choices. This is the key reason why the listed REITS to Market cap ratio for Kenya remains at 0.04% compared to South Africa at 1.61% and US at 3.11%,
- Eliminate conflicts of interest in the governance of capital markets: The capital markets regulations should enable a governance structure that is more responsive to market participants and market growth. Specifically, restricting Trustees of Unit Trust Schemes to Banks only limits choices, especially given that banking markets and capital markets are in competition,
- Create increased competition in the market by encouraging different players to set up shop and offer different services such as the opening up of Trustees to non-financial institutions: Competition in capital markets will not only push Unit Trust Fund managers to provide higher returns for investors but will also eliminate conflicts of interest in markets and enhance the provision of innovative products and services, and,
- Improve fund transparency to provide investors with more information: Each Unit Trust Fund should be required to publish their portfolio holdings on a quarterly basis and make the information available to the public so as to enhance transparency for investors. Providing investors with more information will help both investors and prospects make better informed decisions and subsequently improve investor confidence.
During Q3’2021, we saw the Capital Markets Authority (CMA) publish two draft regulations; the Capital Markets (Collective Investment Schemes) Regulations 2021 and the Capital Markets (Collective Investment Schemes) (Alternative Investment Funds) Regulations 2021. The proposed regulations seek to update the current Collective Investment Scheme Regulations given the change in market dynamics since the last published Regulations in 2001, as well as address emerging issues. The move by CMA to review the current regulations is welcomed as it seems intended to improve the Capital Markets in Kenya by providing more versatile regulations and provide for existence of regulated funds that invest in alternative asset classes. However, it’s our view that proceeding with the regulations as proposed would not be ideal for the market. In our Draft CMA Investments Regulations topical, we analyzed these regulations and thereafter gave our recommendations on the areas of improvement. We await to hear back from CMA as to the next steps with regard to the draft regulations.
Disclaimer: The views expressed in this publication are those of the writers where particulars are not warranted. This publication, which is in compliance with Section 2 of the Capital Markets Authority Act Cap 485A, is meant for general information only and is not a warranty, representation, advice or solicitation of any nature. Readers are advised in all circumstances to seek the advice of a registered investment advisor.

- Talk to us
- Kenya
- P.O Box 20695 - 00200, Nairobi, Kenya
- Cell +254709101200
- Tel +254709101200
- WhatsApp +254741676635
- United States
- +254709101200
- DOWNLOAD OUR APP
-


- Kenya
- 8th Floor, Pinetree Plaza, Kaburu Drive, Ngong Road, Nairobi, Kenya
- USA
- Suite 1150, 1775 Eye Street NW, USA, Washington DC 20006, USA
- Investments
- High Yield
- Private Equity
- Real Estate
- Real Estate
- RiverRun Estates
- Cytonn Towers
- The Ridge
- Taraji Heights
- The Alma