Unlocking Kenya’s Capital Markets, & Cytonn Weekly #17/2025
By Research Team, Apr 27, 2025
Executive Summary
Fixed Income
During the week, T-bills were oversubscribed for the fourth consecutive week, with the overall subscription rate coming in at 178.5%, higher than the subscription rate of 160.1% recorded the previous week. Investors’ preference for the shorter 91-day paper persisted, with the paper receiving bids worth Kshs 16.1 bn against the offered Kshs 4.0 bn, translating to an oversubscription rate of 401.4%, significantly higher than the undersubscription rate of 52.2% recorded the previous week. The subscription rate for the 182-day paper increased to 152.2% from the 88.0% recorded the previous week, while for the 364-day paper decreased to 115.7% from the 275.3% recorded the previous week. The government accepted a total of Kshs 42.77 bn worth of bids out of Kshs 42.85 bn bids received, translating to an acceptance rate of 99.8%. Of the accepted amounts Kshs. 39.5 bn was used for redemption/rollover of maturing bills. The yields on the government papers were on a downward trajectory with the yields on the 182-day paper decreasing the most by 14.0 bps to 8.6% from 8.8% recorded the previous week. The yields on the 364-day paper decreased by 5.0 bps to 10.0%, from the 10.1% recorded the previous week, while the 91-day paper decreased by 2.7 bps to 8.4% from the 8.5% recorded the previous week;
During the week The Central Bank of Kenya (CBK) initiated a comprehensive review of the Risk-Based Credit Pricing Model (RBCPM), five years after its implementation in 2019. The RBCPM was originally developed as a market-driven solution to address inefficiencies in Kenya’s credit market, including high lending rates and a lack of transparency in credit pricing. The aim is to have a clear pricing module for the banks;
We are projecting the y/y inflation rate for April 2025 to increase marginally to within the range of 3.6% - 3.8% mainly on the back of the decrease in the Central Bank Rate (CBR) by 75.0 bps to 10.00% from 10.75% and Increased electricity prices;
Equities
During the week, the equities market was on an upward trajectory, with NSE 10 gaining the most by 1.1% while NSE 25 and NASI gained by 1.0% and 0.4% respectively, and NSE 20 remained relatively unchanged, taking the YTD performance to gains of 4.5% and 0.4% for NSE 20 and NASI, and losses of 2.8%, 1.0% for NSE 10 and NSE 25 respectively. The equities market performance was driven by gains recorded by large-cap stocks such as Absa Bank, Diamond Trust Bank Kenya (DTB-K) and Equity of 6.9%, 2.0%, and 1.9%, respectively. The performance was however weighed down by losses recorded by large cap stocks such as Safaricom of 0.6%;
Additionally, in the regional equities market, the East African Exchanges 20 (EAE 20) share index remained relatively unchanged during the week, attributable to losses recorded by large cap stocks such Tanzania Cigarette Corporation, as Tanga Cement Company and Tanzania Breweries Limited of 7.5%, 2.8% and 2.0% respectively, that were matched by the gains recorded by large cap stocks such as Equity Group, Absa Bank Kenya and KCB Group of 2.8%, 1.8% and 1.5% respectively;
Real Estate
During the week, the Kenya National Bureau of Statistics (KNBS) released the Leading Economic Indicators (LEI) February 2025 Reports, which highlighted the performance of major economic indicators;
Also, during the week, Kenya’s affordable housing project initiative faced a fresh challenge where it was found that a financially unstable construction company, despite struggling with debt and tax issues, was controversially awarded a Kshs 2.2 bn contract in January 2025 to construct affordable housing units in Loitoktok, Kajiado County;
On the Unquoted Securities Platform, Acorn D-REIT and I-REIT traded at Kshs 26.7 and Kshs 22.9 per unit, respectively, as per the last updated data on 17th April 2025. The performance represented a 33.4% and 14.5% gain for the D-REIT and I-REIT, respectively, from the Kshs 20.0 inception price. Additionally, ILAM Fahari I-REIT traded at Kshs 11.0 per share as of 17th April 2025, representing a 45.0% loss from the Kshs 20.0 inception price;
Focus of the Week
The Nairobi Securities Exchange (NSE) has experienced an extended drought in Initial Public Offers (IPOs), with the last recorded IPO occurring in 2015. Despite efforts to spur listings, including setting ambitious targets by the Capital Markets Authority (CMA) and the President, the market has fallen short. Currently, a few large cap stocks dominate the NSE, posing concentration risks and potential market volatility. However, the development of capital markets remains vital for Kenya's economic growth, as it channels long-term savings into investment and enhances capital allocation efficiency. In this study, we delve into the current state of the NSE, other components of Kenya's capital markets, the challenges they face, and provide recommendations for their enhancement;
Investment Updates:
- Weekly Rates: Cytonn Money Market Fund closed the week at a yield of 13.85 % p.a. To invest, dial *809# or download the Cytonn App from Google Play store here or from the Appstore here;
- We continue to offer Wealth Management Training every Tuesday, from 7:00 pm to 8:00 pm. The training aims to grow financial literacy among the general public. To register for any of our Wealth Management Trainings, click here;
- If interested in our Private Wealth Management Training for your employees or investment group, please get in touch with us through wmt@cytonn.com;
- Cytonn Insurance Agency acts as an intermediary for those looking to secure their assets and loved ones’ future through insurance namely; Motor, Medical, Life, Property, WIBA, Credit and Fire and Burglary insurance covers. For assistance, get in touch with us through insuranceagency@cytonn.com;
- Cytonn Asset Managers Limited (CAML) continues to offer pension products to meet the needs of both individual clients who want to save for their retirement during their working years and Institutional clients that want to contribute on behalf of their employees to help them build their retirement pot. To more about our pension schemes, kindly get in touch with us through pensions@cytonn.com;
Hospitality Updates:
- We currently have promotions for Staycations. Visit cysuites.com/offers for details or email us at sales@cysuites.com;
Money Markets, T-Bills Primary Auction:
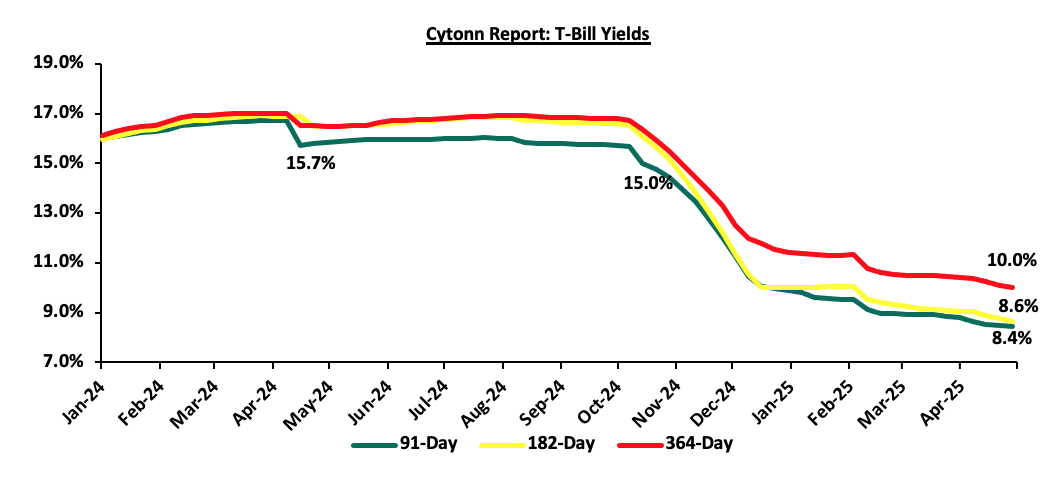
During the week, T-bills were oversubscribed for the fourth consecutive week, with the overall subscription rate coming in at 178.5%, higher than the subscription rate of 160.1% recorded the previous week. Investors’ preference for the shorter 91-day paper persisted, with the paper receiving bids worth Kshs 16.1 bn against the offered Kshs 4.0 bn, translating to an oversubscription rate of 401.4%, significantly higher than the undersubscription rate of 52.2% recorded the previous week. The subscription rate for the 182-day paper increased to 152.2% from the 88.0% recorded the previous week, while for the 364-day paper decreased to 115.7% from the 275.3% recorded the previous week. The government accepted a total of Kshs 42.77 bn worth of bids out of Kshs 42.85 bn bids received, translating to an acceptance rate of 99.8%. Of all the accepted amount s kshs. 39.5 bn was used for rollover/redemption of maturing bills. The yields on the government papers were on a downward trajectory with the yields on the 182-day paper decreasing the most by 14.0 bps to 8.6% from 8.8% recorded the previous week. The yields on the 364-day paper decreased by 5.0 bps to 10.0%, from the 10.1% recorded the previous week, while the 91-day paper decreased by 2.7 bps to 8.4% from the 8.5% recorded the previous week.
The chart below shows the yield performance of the 91-day, 182-day and 364-day papers from January 2024 to April 2025:
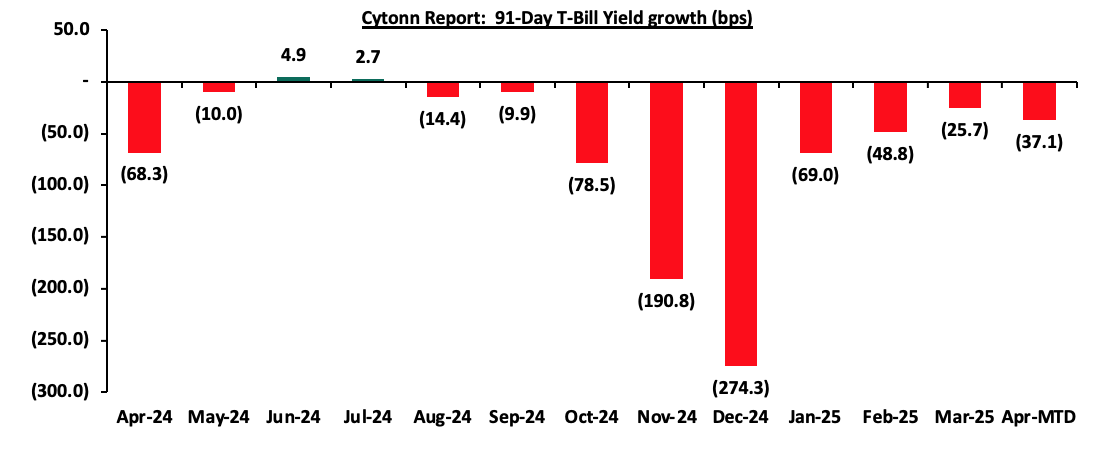
The chart below shows the yield growth for the 91-day T-bill:
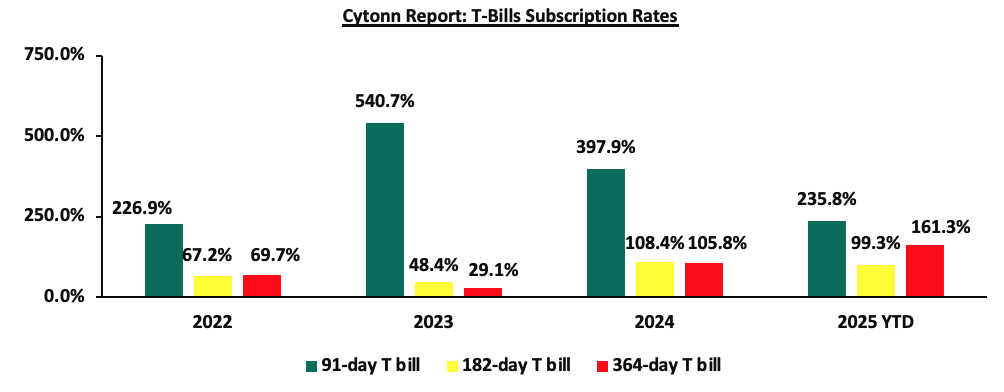
The chart below compares the overall average T-bill subscription rates obtained in 2022,2023, 2024 and 2025 Year-to-date (YTD):
Money Market Performance:
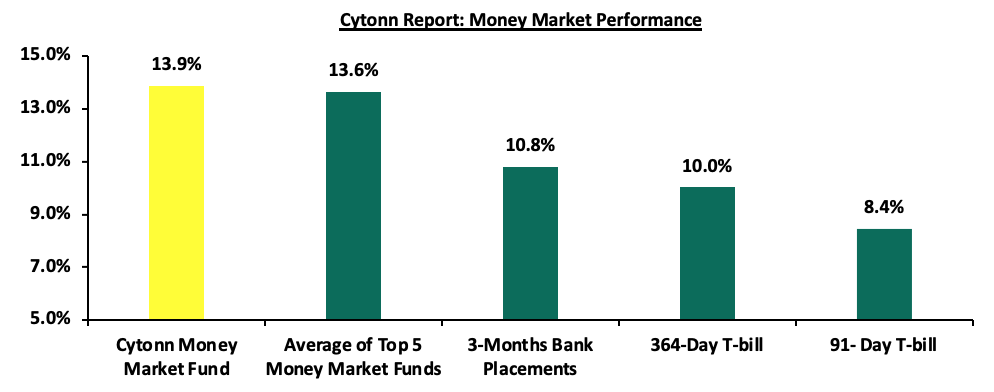
In the money markets, 3-month bank placements ended the week at 10.4% (based on what we have been offered by various banks) and the yields on the government papers were on a downward trajectory with the yields on the 364-day paper decreasing by 5.0 bps to 10.0% from the 10.1% recorded the previous week, while the 91-day paper decreased by 2.7 bps to 8.4% from the 8.5% recorded the previous week. The yield on the Cytonn Money Market Fund decreased by 104.0 bps to 13.9% from the 14.9% recorded the previous week, while the average yields on the Top 5 Money Market Funds decreased by 22.6 bps to close the week at 13.6%, from the 13.9% recorded the previous week.
The table below shows the Money Market Fund Yields for Kenyan Fund Managers as published on 25th April 2025:
|
Cytonn Report: Money Market Fund Yield for Fund Managers as published on 25th April 2025 |
||
|
Rank |
Fund Manager |
Effective Annual Rate |
|
1 |
Gulfcap Money Market Fund |
13.9% |
|
2 |
Cytonn Money Market Fund (Dial *809# or download the Cytonn app) |
13.9% |
|
3 |
Kuza Money Market fund |
13.8% |
|
4 |
Orient Kasha Money Market Fund |
13.5% |
|
5 |
Lofty-Corban Money Market Fund |
13.1% |
|
6 |
Ndovu Money Market Fund |
13.1% |
|
7 |
Etica Money Market Fund |
13.0% |
|
8 |
GenAfrica Money Market Fund |
13.0% |
|
9 |
Arvocap Money Market Fund |
12.8% |
|
10 |
Enwealth Money Market Fund |
12.6% |
|
11 |
Nabo Africa Money Market Fund |
12.6% |
|
12 |
Old Mutual Money Market Fund |
12.3% |
|
13 |
British-American Money Market Fund |
12.1% |
|
14 |
Madison Money Market Fund |
11.9% |
|
15 |
Apollo Money Market Fund |
11.6% |
|
16 |
Jubilee Money Market Fund |
11.5% |
|
17 |
Dry Associates Money Market Fund |
11.4% |
|
18 |
Sanlam Money Market Fund |
11.4% |
|
19 |
Faulu Money Market Fund |
11.4% |
|
20 |
Absa Shilling Money Market Fund |
10.6% |
|
21 |
CIC Money Market Fund |
10.6% |
|
22 |
Co-op Money Market Fund |
10.5% |
|
23 |
ICEA Lion Money Market Fund |
10.4% |
|
24 |
KCB Money Market Fund |
10.2% |
|
25 |
Mali Money Market Fund |
10.0% |
|
26 |
AA Kenya Shillings Fund |
9.7% |
|
27 |
Genghis Money Market Fund |
9.7% |
|
28 |
Mayfair Money Market Fund |
9.4% |
|
29 |
Ziidi Money Market Fund |
7.4% |
|
30 |
Stanbic Money Market Fund |
7.2% |
|
31 |
Equity Money Market Fund |
5.5% |
Source: Business Daily
Liquidity:
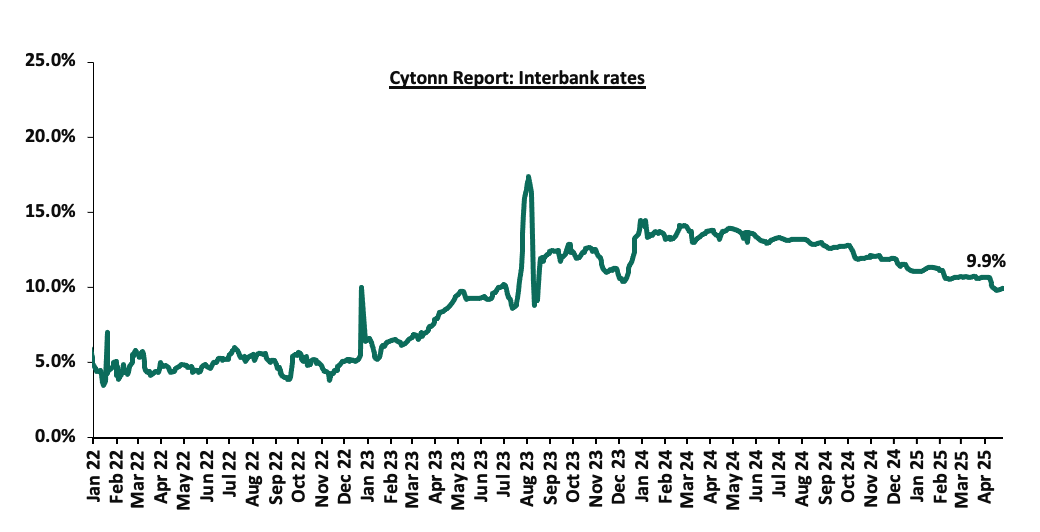
During the week, liquidity in the money markets marginally tightened, with the average interbank rate increasing by 5.4 bps, to remain relatively unchanged from the 9.9% recorded the previous week, partly attributable to government payments that were offset by tax remittances. The average interbank volumes traded increased significantly by 233.6% to Kshs 23.3 bn from Kshs 7.0 bn recorded the previous week. The chart below shows the interbank rates in the market over the years:
Kenya Eurobonds:
During the week, the yields on Kenya’s Eurobonds were on a downward trajectory with the yield on the 12-year Eurobond issued in 2019 decreasing the most by 63.5 bps to 10.9% from the 11.5% recorded the previous week. The table below shows the summary performance of the Kenyan Eurobonds as of 24th April 2025;
|
Cytonn Report: Kenya Eurobonds Performance |
|
||||||
|
|
2018 |
2019 |
2021 |
2024 |
2025 |
||
|
Tenor |
10-year issue |
30-year issue |
7-year issue |
12-year issue |
13-year issue |
7-year issue |
11-year issue |
|
Amount Issued (USD) |
1.0 bn |
1.0 bn |
0.3 bn |
1.2 bn |
1.0 bn |
1.5 bn |
1.5 bn |
|
Years to Maturity |
2.9 |
22.9 |
2.1 |
7.1 |
9.2 |
5.8 |
11.0 |
|
Yields at Issue |
7.3% |
8.3% |
7.0% |
7.9% |
6.2% |
10.4% |
9.9% |
|
02-Jan-25 |
9.1% |
10.3% |
8.5% |
10.1% |
10.1% |
10.1% |
|
|
01-Apr-25 |
8.8% |
10.8% |
7.5% |
10.4% |
10.4% |
10.4% |
|
|
17-Apr-25 |
10.7% |
11.5% |
9.0% |
11.5% |
11.1% |
11.7% |
|
|
18-Apr-25 |
10.7% |
11.5% |
9.0% |
11.5% |
11.1% |
11.7% |
|
|
19-Apr-25 |
10.7% |
11.6% |
9.0% |
11.5% |
11.2% |
11.7% |
|
|
22-Apr-25 |
10.7% |
11.5% |
9.0% |
11.4% |
11.1% |
11.7% |
|
|
23-Apr-25 |
10.2% |
11.3% |
8.9% |
10.9% |
10.7% |
11.1% |
|
|
24-Apr-25 |
10.1% |
11.2% |
8.9% |
10.9% |
10.7% |
11.1% |
|
|
Weekly Change |
(0.5%) |
(0.3%) |
(0.1%) |
(0.6%) |
(0.4%) |
(0.5%) |
- |
|
MTD Change |
1.4% |
0.5% |
1.4% |
0.5% |
0.3% |
0.7% |
- |
|
YTD Change |
1.2% |
1.0% |
0.4% |
0.8% |
0.6% |
1.0% |
- |
Source: Central Bank of Kenya (CBK) and National Treasury
Kenya Shilling:
During the week, the Kenyan Shilling appreciated against the US Dollar by 34.2 bps, to Kshs 129.3 from the Kshs 129.8 recorded the previous week. On a year-to-date basis, the shilling has depreciated by 3.2 bps against the dollar, compared to the 17.4% appreciation recorded in 2024.
We expect the shilling to be supported by:
- Diaspora remittances standing at a cumulative USD 4,972.0 mn in the twelve months to March 2025, 13.5% higher than the USD 4,380.0 mn recorded over the same period in 2024. These has continued to cushion the shilling against further depreciation. In the March 2025 diaspora remittances figures, North America remained the largest source of remittances to Kenya accounting for 53.0% in the period,
- The tourism inflow receipts which came in at Kshs 452.2 bn in 2024, a 19.8% increase from Kshs 377.5 bn inflow receipts recorded in 2023, and owing to tourist arrivals that improved by 14.6% to 2,394,376 in 2024 from 2,089,259 in 2023, and,
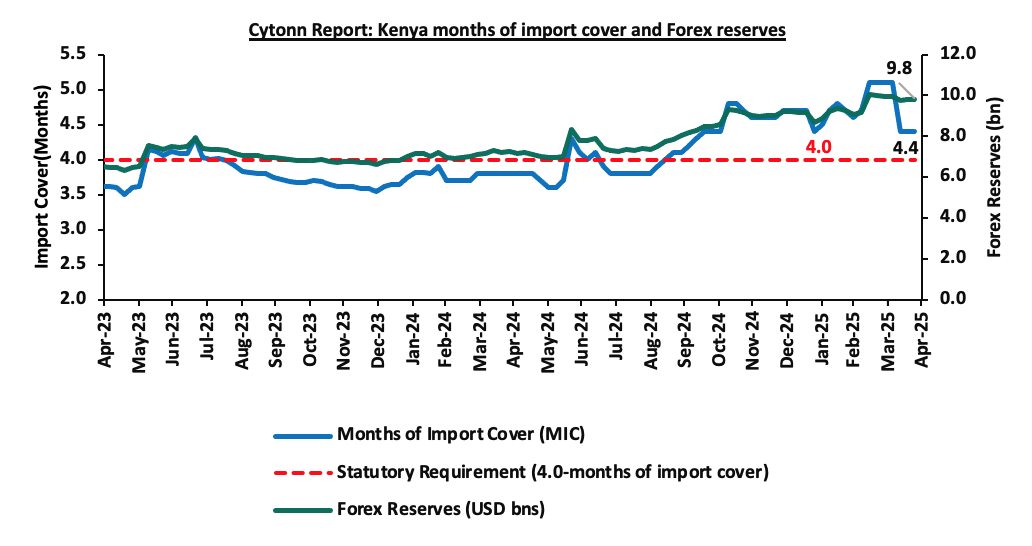
- Improved forex reserves currently at USD 9.8 bn (equivalent to 4.4-months of import cover), which is above the statutory requirement of maintaining at least 4.0-months of import cover and below the EAC region’s convergence criteria of 4.5-months of import cover.
The shilling is however expected to remain under pressure in 2025 as a result of:
- An ever-present current account deficit which came at 3.1% of GDP in the twelve months to February 2025, and,
- The need for government debt servicing, continues to put pressure on forex reserves given that 62.1% of Kenya’s external debt is US Dollar-denominated as of September 2024.
Key to note, Kenya’s forex reserves increased by 0.03% during the week, to remain relatively unchanged from USD 9.8 bn recorded in the previous week, equivalent to 4.4 months of import cover (based on updated import data), to remain also relatively unchanged from the months of import cover recorded last week, and above the statutory requirement of maintaining at least 4.0-months of import cover.
The chart below summarizes the evolution of Kenya's months of import cover over the years:
Weekly Highlights
- CBK’s review of the Risk-Based Credit Pricing Model
During the week The Central Bank of Kenya (CBK) initiated a comprehensive review of the Risk-Based Credit Pricing Model (RBCPM), five years after its implementation in 2019. The RBCPM was originally developed as a market-driven solution to address inefficiencies in Kenya’s credit market, including high lending rates and a lack of transparency in credit pricing. The model was meant to promote responsible lending by allowing banks to determine loan prices based on the specific credit risk of individual borrowers, incorporating factors such as credit history, collateral, and financial behavior.
The Central Bank of Kenya raised several concerns regarding the Risk-Based Credit Pricing Model (RBCPM), primarily centered on the availability, quality, and fairness of the credit scoring data underpinning the model, as well as inconsistencies in its application across commercial banks. These concerns highlight the risk of undermining the model’s integrity and its alignment with international best practices and domestic monetary policy reforms. In addition to these overarching concerns, findings from onsite inspections revealed significant implementation gaps. Some banks’ models generated excessively high lending rates, prompting them to apply arbitrary discounts, indicating flaws in model design. Furthermore, certain banks excluded specific loan products such as mobile loans, government-funded schemes, and cash-backed facilities from RBCPM application. Others failed to regularly update the model variables, leading to outdated pricing components. Additional charges, not included in the model, were also imposed by some banks, and lending rate differentiation was often based on customer segments rather than individual risk profiles. The inspections also uncovered weak governance frameworks, with many banks lacking documented model oversight and review procedures, and noted that high costs of funds, especially for banks heavily reliant on term deposits, further contributed to elevated base lending rates.
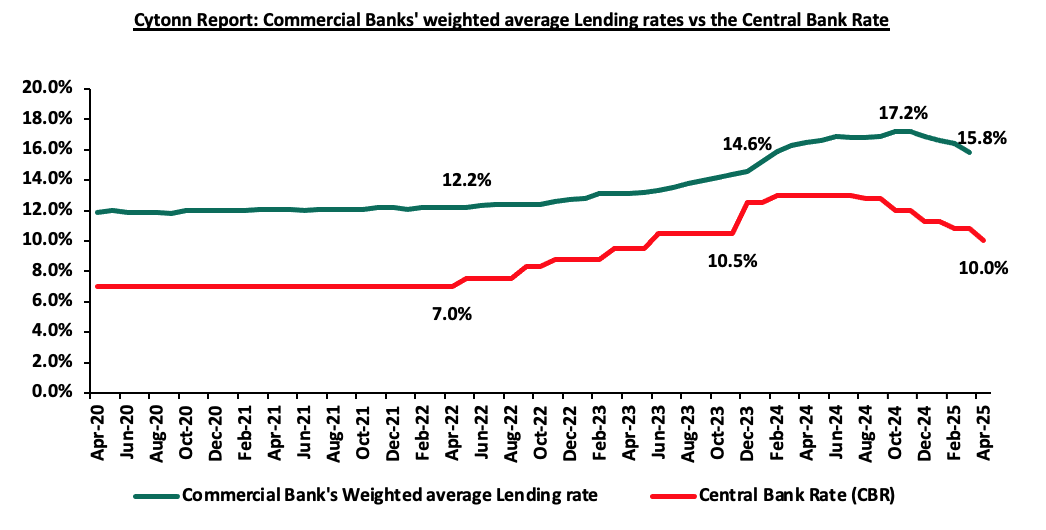
To strengthen the model and align it with evolving monetary policy reforms, CBK reviewed international credit pricing models from jurisdictions such as the US, UK, India, and South Africa. Most countries use a common base rate, often tied to the central bank’s policy rate, with banks applying a premium based on risk and operational costs. In this context, CBK proposes using the Central Bank Rate (CBR) as Kenya’s common reference rate for lending. The CBR, being forward-looking and reflective of the overall economic environment, is deemed more stable and predictable than the interbank rate which is prone to volatility during periods of tight liquidity and is deemed backward looking, which the Kenya Bankers Association (KBA) had recommended. Under the CBK’s proposed model, lending rates will be calculated as CBR plus a premium (“K”), which includes operating costs, expected returns to shareholders, and a borrower-specific risk premium. All banks will be required to submit their proposed “K” to CBK for review, and CBK will publicly disclose these components for each bank on its website, the total Cost of Credit (TCC) website and in two newspapers of nationwide circulation to ensure transparency and comparability. Notably, despite the CBK lowering the CBR, lending rates have remained high, highlighting the continued challenges in reducing the cost of credit despite monetary policy adjustments. The graph below shows the Central Bank Rate for the last five years, along with the commercial banks' lending rates and deposit rates;
Looking ahead, the revised Policy Rate will apply to all new loans immediately upon implementation and to existing loans within a three-month transition period. CBK aims to foster a more efficient, fair, and transparent lending environment that supports financial inclusion and economic growth. To ensure that the reforms are inclusive and well-informed, CBK is soliciting public and stakeholder feedback on the proposed changes by May 2, 2025. These contributions will be crucial in finalizing a robust and forward-looking credit pricing framework that is consistent with both local economic realities and international best practices.
- April Inflation projection
We are projecting the y/y inflation rate for April 2025 to increase marginally to within the range of 3.6% - 3.8% mainly on the back of:
- The decrease in the Central Bank Rate (CBR) by 75.0 bps to 10.00% from 10.75% – In 2025, the CBK Monetary Policy Committee has continued reducing the Central Bank Rate (CBR) with a 75.0 bps cut in April, lowering it to 10.00%, from 10.75%. In their previous meeting on 5th February 2025, they implemented a less significant reduction, cutting the CBR by 50.0 bps to 10.75%. This reduction in the CBR is likely to increase the money supply through lower borrowing costs, which may cause a slight rise in inflation rates as the effects of the CBR gradually take hold in the broader economy.
- Increased electricity prices – In April 2025, electricity prices increased marginally on the back of a rise in fuel cost charges and forex adjustment charges. EPRA set the fuel cost charge at Kshs 4.1, up from Kshs 3.5 in March 2025, while the forex adjustment was raised to Kshs 1.0 from Kshs 0.8 in March 2025. With electricity being one the major inputs of inflation, this increase is expected to increase production costs for businesses as well as increase electricity costs for households and thus tightening inflation.
We, however, expect that inflation rate will, however, be supported by:
- Decrease in Fuel Prices in April– In their last fuel prices release, EPRA announced that the maximum allowed price for Super Petrol, Diesel and Kerosene decreased by Kshs 2.0, Kshs 2.2 and Kshs 2.4 per litre respectively. Consequently, Super Petrol, Diesel and Kerosene will now retail at Kshs 174.6, Kshs 164.9 and Kshs 149.0 per litre respectively, from Kshs 176.6, Kshs. 167.1 and Kshs 151.4 per litre respectively, representing decreases of 1.1%,1.3% and 1.6% for Super Petrol, Diesel and Kerosene respectively. This decline in fuel prices is likely to lower food prices by reducing transportation and production costs, which would make food more affordable for consumers.as well as business operational costs, since fuel is a major input cost for businesses,
Going forward, we expect inflationary pressures to remain anchored in the short term, remaining within the CBK’s target range of 2.5%-7.5% aided by the stable fuel prices, decreased fuel costs and stability in the exchange rate. However, risks remain, particularly from the potential for increased demand-driven inflation due to accommodative monetary policy. The decision to lower the CBR to 10.00% during the latest MPC meeting will likely increase money supply, possibly increasing inflation, especially with further cuts expected in the coming meetings. The CBK’s ability to balance growth and inflation through close monitoring of both inflation and exchange rate stability will be key to maintaining inflation within the target range.
Rates in the Fixed Income market have been on a downward trend due to high liquidity in the money market which allowed the government to front load most of its borrowing. The government is 71.1% ahead of its prorated net domestic borrowing target of Kshs 493.8 bn, and 41.5% ahead of the total FY’2024/25 net domestic borrowing target of Kshs 597.2 bn, having a net borrowing position of Kshs 844.7 bn (inclusive of T-bills). However, we expect the yield curve to stabilize in the short and medium term, with the government looking to increase its external borrowing to maintain the fiscal surplus, hence alleviating pressure in the domestic market. As such, we expect the yield curve to remain stable in the short to medium-term and hence investors are expected to shift towards the long-term papers to lock in the high returns
Market Performance
During the week, the equities market was on an upward trajectory, with NSE 10 gaining the most by 1.1% while NSE 25 and NASI gained by 1.0% and 0.4% respectively, and NSE 20 remained relatively unchanged, taking the YTD performance to gains of 4.5% and 0.4% for NSE 20 and NASI, and losses of 2.8%, 1.0% for NSE 10 and NSE 25 respectively. The equities market performance was driven by gains recorded by large-cap stocks such as Absa Bank, Diamond Trust Bank Kenya (DTB-K) and Equity of 6.9%, 2.0%, and 1.9%, respectively. The performance was however weighed down by losses recorded by large cap stocks such as Safaricom of 0.6%.
Additionally, in the regional equities market, the East African Exchanges 20 (EAE 20) share index remained relatively unchanged during the week, attributable to losses recorded by large cap stocks such Tanzania Cigarette Corporation, as Tanga Cement Company and Tanzania Breweries Limited of 7.5%, 2.8% and 2.0% respectively, that were matched by the gains recorded by large cap stocks such as Equity Group, Absa Bank Kenya and KCB Group of 2.8%, 1.8% and 1.5% respectively.
During the week, equities turnover increased significantly by 138.1% to USD 17.6 mn, from USD 7.4 mn recorded the previous week, taking the YTD total turnover to USD 251.6 mn. Foreign investors remained net sellers for the third consecutive week, with a net selling position of USD 1.9 mn, from a net selling position of USD 1.7 mn recorded the previous week, taking the YTD foreign net selling position to USD 31.7 mn, compared to a net selling position of USD 16.9 mn in 2024.
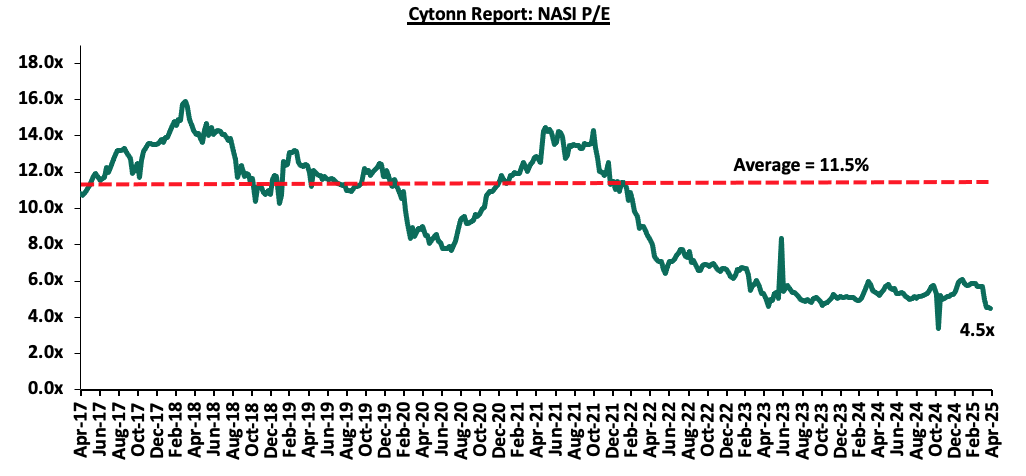
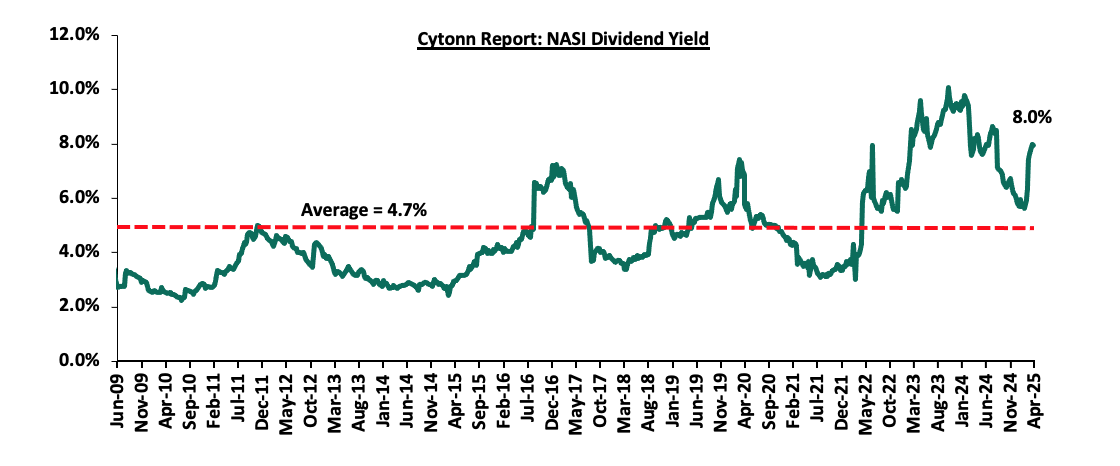
The market is currently trading at a price-to-earnings ratio (P/E) of 4.5x, 61.4% below the historical average of 11.5x. The dividend yield stands at 8.0%, 3.3% points above the historical average of 4.7%. Key to note, NASI’s PEG ratio currently stands at 0.6x, an indication that the market is undervalued relative to its future growth. A PEG ratio greater than 1.0x indicates the market is overvalued while a PEG ratio less than 1.0x indicates that the market is undervalued. The charts below indicate the historical P/E and dividend yields of the market;
Universe of Coverage:
|
Cytonn Report: Equities Universe of Coverage |
||||||||||
|
Company |
Price as at 17/04/2025 |
Price as at 25/04/2026 |
w/w change |
YTD Change |
Year Open 2025 |
Target Price* |
Dividend Yield |
Upside/ Downside** |
P/TBv Multiple |
Recommendation |
|
Jubilee Holdings |
200.0 |
191.0 |
(4.5%) |
9.3% |
174.8 |
260.7 |
7.1% |
43.5% |
0.3x |
Buy |
|
KCB Group |
38.3 |
38.5 |
0.7% |
(9.2%) |
42.4 |
50.7 |
7.8% |
39.5% |
0.5x |
Buy |
|
I&M Group |
30.0 |
30.3 |
1.0% |
(16.0%) |
36.0 |
36.8 |
9.9% |
31.6% |
0.5x |
Buy |
|
Co-op Bank |
16.0 |
16.0 |
0.3% |
(8.3%) |
17.5 |
18.6 |
9.4% |
25.8% |
0.6x |
Buy |
|
Equity Group |
44.6 |
45.5 |
1.9% |
(5.3%) |
48.0 |
52.8 |
9.4% |
25.5% |
0.8x |
Buy |
|
Diamond Trust Bank |
73.5 |
75.0 |
2.0% |
12.4% |
66.8 |
87.1 |
9.3% |
25.5% |
0.3x |
Buy |
|
Standard Chartered Bank |
300.3 |
300.3 |
0.0% |
5.3% |
285.3 |
328.8 |
15.0% |
24.5% |
1.7x |
Buy |
|
ABSA Bank |
17.3 |
18.5 |
6.9% |
(1.9%) |
18.9 |
21.0 |
9.5% |
23.0% |
1.2x |
Buy |
|
NCBA |
54.0 |
54.0 |
0.0% |
5.9% |
51.0 |
60.2 |
10.2% |
21.7% |
0.9x |
Buy |
|
Stanbic Holdings |
173.3 |
175.8 |
1.4% |
25.8% |
139.8 |
185.3 |
11.8% |
17.2% |
1.1x |
Accumulate |
|
CIC Group |
3.0 |
2.9 |
(3.0%) |
35.5% |
2.1 |
3.1 |
4.5% |
11.4% |
0.8x |
Accumulate |
|
Britam |
6.8 |
6.9 |
2.1% |
19.2% |
5.8 |
7.5 |
0.0% |
8.1% |
0.6x |
Hold |
|
*Target Price as per Cytonn Analyst estimates **Upside/ (Downside) is adjusted for Dividend Yield ***Dividend Yield is calculated using FY’2024 Dividends |
||||||||||
We are “Bullish” on the Equities markets in the short term due to current cheap valuations, lower yields on short-term government papers and expected global and local economic recovery, and, “Neutral” in the long term due to persistent foreign investor outflows. With the market currently trading at a discount to its future growth (PEG Ratio at 0.6x), we believe that investors should reposition towards value stocks with strong earnings growth and that are trading at discounts to their intrinsic value. We expect the current high foreign investors sell-offs to continue weighing down the economic outlook in the short term.
- Industry Report
During the week, the Kenya National Bureau of Statistics (KNBS) released the Leading Economic Indicators (LEI) February 2025 Reports, which highlighted the performance of major economic indicators. Key highlights related to the Real Estate sector include;
- In February 2025, the number of arrivals was 155,391, reflecting a 5.0% decrease from 163,601 arrivals recorded in January 2025. The slight contraction was mainly attributable to seasonal travel patterns, where there’s an influx of arrivals in December and January due to the Christmas festivities. However, February marks the end of festivities which leads to reduction of tourist arrivals in the country. On a year-on-year basis, this represented a 6.1% increase compared to 146,442 arrivals in February 2024. The improved performance can be attributed to several factors; i) recovery in global tourism industry coupled with a strong marketing campaign, ii) visa openness following the introduction of the Electronic Tourist Authorization (eTA) at the beginning of the year, iii) improvements in air connectivity through introduction of new routes and more frequencies by major airlines and the introduction of direct flights by three new airlines—IndiGo (Mumbai-Nairobi), Fly Dubai (Dubai-Mombasa), and Airlink (Johannesburg-Nairobi), iv) the creation of specialized tourism offerings such as cruise, adventure, cultural, and sports tourism, and, v) expanded global promotion of Kenya's tourism by the Ministry of Tourism and the Kenya Tourism Board using platforms like Magical Kenya. The chart below shows the number of international arrivals in Kenya between Q1’2022 and January and February 2025;
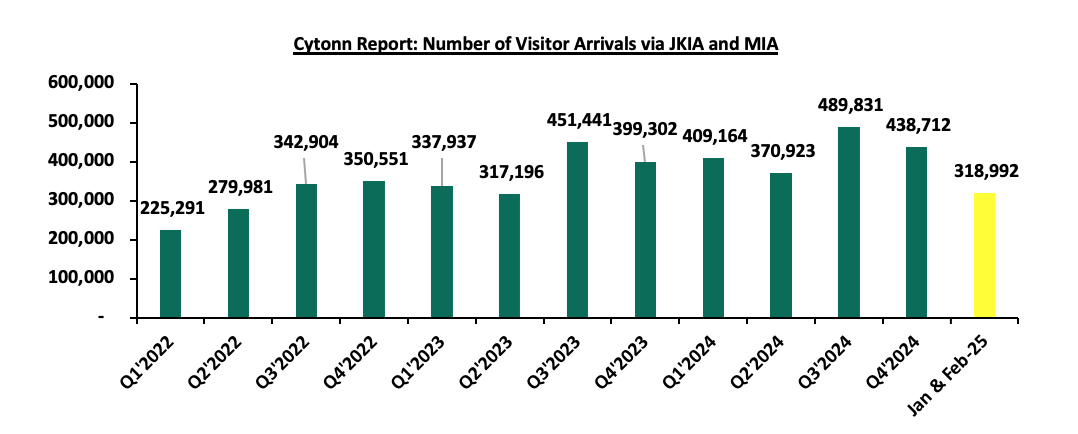
Source: Kenya National Bureau of Statistics (KNBS)
- The total value of building plans approved in the Nairobi Metropolitan Area (NMA) increased by 54.7% to Kshs 13.3 bn in February 2025 from Kshs 8.6 bn. This can be attributed to: (i) increase in residential projects by 72.1% to Kshs 10.5 bn in February 2025 from Kshs 6.1 bn in January 2025, (ii) Government’s initiative for affordable housing has greatly influenced the increase in building plan approvals. This initiative aims to encourage developers to participate in these projects. On a y/y basis, the value decreased by 7.6% to Kshs 13.3 bn in February 2025, from Kshs 14.4 bn recorded in February 2024. This can be attributed to: i) continued high cost of construction materials such as reinforced steel and cement which was increased by 10.7% in 2024 to Kshs 830 from Kshs 750 recorded in 2023, ii) developers and investors shifted strategies, emphasizing operational efficiency and sustainability rather than embarking on new large-scale developments, iii) Lending institutions issues stringent lending measures due to the increase in Non-Performing loans in the sector. As of September 2024, the gross NPL ratio stood at 16.5%, a slight improvement from 16.6% in June 2024. The chart below shows the value of building plans approved in the Nairobi Metropolitan Area (NMA) between Q1’2022 and January and February 2025;
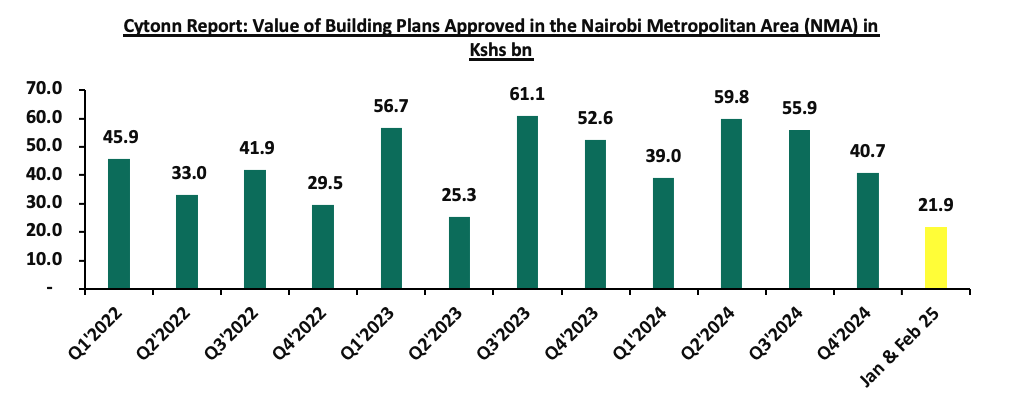
Source: Kenya National Bureau of Statistics (KNBS)
- The consumption of cement came in at 749,285 metric tonnes in February 2025, a 4.5% decrease from 784,290 metric tonnes recorded in January 2025. This can be attributed to: (i) a reduction in cement production where it declined to 759,332 metric tonnes in February 2025 from 796,304 metric tonnes in January 2025 which limited supply available for consumption. On a y/y basis, the performance represented a 14.4% increase to 749,285 metric tonnes in February 2025 from 655,255 metric tonnes in February 2024. The increase in performance was attributable to; i) surge in domestic construction and infrastructure development ii) increased government-led infrastructure investments and iii) strategic focus on stimulating domestic economic activity through public works projects. The chart below shows cement consumption in metric tonnes in Kenya between Q1’2021 and January and February 2025;
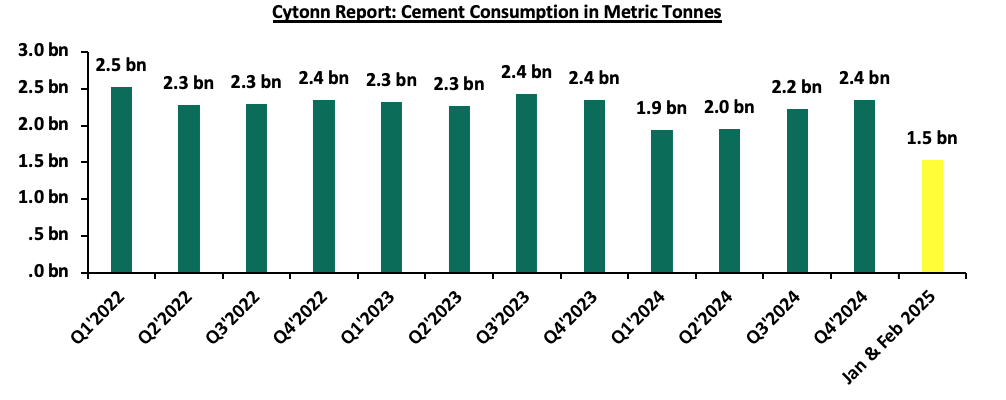
Source: Kenya National Bureau of Statistics (KNBS)
- Residential Sector
During the week, Kenya’s affordable housing project initiative faced a fresh challenge where it was found that a financially unstable construction company, despite struggling with debt and tax issues, was controversially awarded a Kshs 2.2 bn contract in January 2025 to construct affordable housing units in Loitoktok, Kajiado County. At the time of the tender award, the company had not paid a court-ordered debt of Kshs 1.9 mn and was also involved in a tax dispute with the Kenya Revenue Authority over Kshs 4.2 mn in unpaid taxes. These financial struggles were confirmed through separate court proceedings, including one that led to the brief jailing of one of the company’s directors for defaulting on payments.
The contract award triggered protests from rival bidders, leading to a formal complaint to the Public Procurement and Administrative Review Board (PPARB). After a detailed review, the board found that the housing department had treated the bids unequally. While a rival bidder was disqualified for discrepancies in their bill of quantities, the winning company had even more serious inconsistencies in its bid, including altered and non-uniform pricing. The board concluded that the evaluation process lacked fairness, transparency, and equal treatment and subsequently cancelled the tender. It instructed the State Department for Housing to reconsider two disqualified bids, including one that had offered to do the job at a lower cost.
This procurement irregularity raises serious concerns about the credibility and governance of Kenya’s Affordable Housing Programme, which aims to construct 250,000 housing units annually to address the country’s housing deficit of more than two million units. The incident casts doubt on the integrity of the bidding process and may damage public trust in the housing initiative, particularly given that it is partially funded by a mandatory 1.5 percent levy on employee salaries.
The fallout from this case may impact the economy and real estate sector by slowing project delivery due to legal battles and procurement reviews, discouraging credible contractors and investors from participating in future tenders, and weakening overall confidence in state-led development efforts. Moreover, the involvement of underqualified firms increases the risk of stalled or substandard projects, potentially resulting in the misuse of public funds and the failure to achieve the programme’s economic and social objectives.
- Real Estate Investments Trusts (REITs)
On the Unquoted Securities Platform, Acorn D-REIT and I-REIT traded at Kshs 26.7 and Kshs 22.9 per unit, respectively, as per the last updated data on 17th April 2025. The performance represented a 33.4% and 14.5% gain for the D-REIT and I-REIT, respectively, from the Kshs 20.0 inception price. The volumes traded for the D-REIT and I-REIT came in at Kshs 12.8 mn and Kshs 36.1 mn shares, respectively, with a turnover of Kshs 323.5 mn and Kshs 791.5 mn, respectively, since inception in February 2021. Additionally, ILAM Fahari I-REIT traded at Kshs 11.0 per share as of 17th April 2025, representing a 45.0% loss from the Kshs 20.0 inception price. The volume traded to date came in at 1.2 mn shares for the I-REIT, with a turnover of Kshs 1.5 mn since inception in November 2015.
REITs offer various benefits, such as tax exemptions, diversified portfolios, and stable long-term profits. However, the ongoing decline in the performance of Kenyan REITs and the restructuring of their business portfolios are hindering significant previous investments. Additional general challenges include:
- Insufficient understanding of the investment instrument among investors leading to a slower uptake of REIT products,
- Lengthy approval processes for REIT creation,
- High minimum capital requirements of Kshs 100.0 mn for REIT trustees compared to Kshs 10.0 mn for pension funds Trustees, essentially limiting the licensed REIT Trustee to banks only
- The rigidity of choice between either a D-REIT or and I-REIT forces managers to form two REITs, rather than having one Hybrid REIT that can allocate between development and income earning properties
- Limiting the type of legal entity that can form a REIT to only a trust company, as opposed to allowing other entities such as partnerships, and companies,
- We need to give time before REITS are required to list – they would be allowed to stay private for a few years before the requirement to list given that not all companies maybe comfortable with listing on day one, and,
- Minimum subscription amounts or offer parcels set at Kshs 0.1 mn for D-REITs and Kshs 5.0 mn for restricted I-REITs. The significant capital requirements still make REITs relatively inaccessible to smaller retail investors compared to other investment vehicles like unit trusts or government bonds, all of which continue to limit the performance of Kenyan REITs.
We expect Kenya’s Real Estate sector to remain on a growth trend, supported by: i) demand for housing sustained by positive demographics, such as urbanization and population growth rates of 3.8% p.a and 2.0% p.a, respectively, against the global average of 1.7% p.a and 0.9% p.a, respectively, as at 2023,, ii) activities by the government under the Affordable Housing Program (AHP) iii) heightened activities by private players in the residential sector iv) increased investment by local and international investors in the retail sector. However, challenges such as rising construction costs, strain on infrastructure development (including drainage systems), high capital requirements for REITs, and existing oversupply in select Real Estate sectors will continue to hinder the sector’s optimal performance by limiting developments and investments.
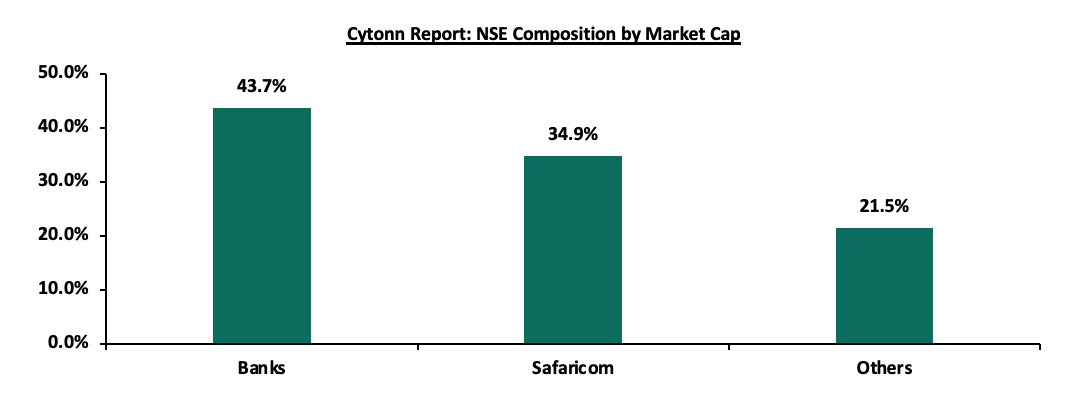
The Nairobi Securities Exchange (NSE) last recorded an Initial Public Offers (IPOs) in 2015, when Stanlib Investments issued an IPO of the first Real Estate Investment Trust (Fahari-IREIT) at the bourse, managing to raise Kshs 3.6 bn against the target of Kshs 12.5 bn, 28.8% success rate. This translates to an eight-year IPO drought, with the most recent activity at the bourse being the listing by introduction, meaning no money was raised) out of the Local Authority Pension Trust (LAPTRUST) Imara Income Real Estate Investment Trust (I-REIT) under the Restricted Sub-Segment in December 2022. LAPTRUST holds 100.0% of the Imara I-REIT shares with no initial offer to the public. Currently, the bourse has 66 listed securities with a total market capitalization of Kshs 2.0 tn as at 25th April 2025. The bourse continues to be Safaricom-dominated, with Safaricom’s market capitalization of Kshs 689.7 bn equivalent to 34.9% of the entire market capitalization. Additionally, Safaricom (34.9%) and Banks (43.7%) make up 78.5% of the total bourse, leaving all other local sectors to share the remaining 21.5%, as of 25th April 2025. The Capital Markets Authority (CMA) raised concerns that Kenya has been unable to achieve its projected listings targets as articulated in its Capital Markets Master Plan released in 2016 which envisioned at least four listings on the NSE every year; by its own masterplan CMA is now behind by 32 listings. To cure for this, the President in September 2022 set a target of 10 listings in one year, however this has not been achieved as of 2025. The chart below highlights the composition of stocks at the Nairobi Securities Exchange;
Source: Cytonn Research
Given that a few large cap stocks, namely Safaricom PLC, Equity Group Holdings, KCB Group Ltd and Absa Group Plc hold almost 54.9% of the total market capitalization, the market remains volatile, which presents a risk of a market collapse due to concentration risk.
It is important to note that capital markets development is crucial for the growth of the Kenyan economy for several reasons; Firstly, the capital markets increase the proportion of long-term savings (pensions, life covers, etc.) that is channelled to long-term investment. Capital markets enable the contractual savings industry (pension and provident funds, insurance companies, medical aid schemes, collective investment schemes, etc.) to mobilize long-term savings from small individual household and channel them into long-term investments. In this way, the capital markets enable corporations to raise funds to finance their investment in real assets. In addition, capital markets development increases the efficiency of capital allocation. Efficient capital allocation means that funds are allocated to the investment projects or firms that bring the most value to the economy; the marginal product of capital value is the highest.
Given the significant role that the capital markets play, we shall then focus on Unlocking Kenya’s Capital Markets. As such, we shall cover;
- Current State of the Nairobi Securities Exchange (NSE),
- Current State of other Components of the Kenya Capital Markets,
- Challenges facing Kenya’s Capital Markets, and,
- Recommendations and Conclusion.
Section I: Current state of the Nairobi Securities Exchange
A. The structure of the Nairobi Securities Exchange
Based in Kenya, the Nairobi Securities Exchange is one of the leading securities exchanges in Africa. It was founded in 1954 in order to facilitate the trading of financial products through the provision of a trading platform for listed securities. The NSE was demutualized and listed in 2014 and it operates under the jurisdiction of the Capital Markets Authority (CMA) of Kenya and is charged with the responsibility of developing the securities market and regulating trading activities, with the most recent key developments being:
- In July 2019, NSE launched NEXT derivatives markets, which made it the second African exchange to launch a derivative market after the Johannesburg Stock Exchange. The derivative market was to enhance investors’ portfolio performance through availing risk management tools,
- In May 2021, NSE officially launched its Unquoted Securities Platform (USP) which facilitated the trading, clearing, and settlement of securities of unquoted companies in Kenya. The platform provided access to capital and introduced capital market transactions easing the possible transition of the issuers into the primary quoted market. The USP also helped to reduce settlement delays as well as allowing surveillance by the bourse and the regulator, thereby protecting investors in the market. Acorn Holdings Limited became the first company to tap into the market infrastructure to trade shares by quoting its Income and Development Real Estate Investments Trusts on the USP,
- In June 2021, the NSE launched the mini NSE 25 share index futures contracts which was meant to appeal to retail investors due to its low initial margin cost. The segment was to help increase liquidity as well as promote exposure to the Kenya equities market through the equity index futures contracts,
- Launch of Environmental, Social and Governance (ESG) disclosure governance manual. In November 2021, the NSE published an ESG manual for Kenya listed companies meant to provide detailed guidelines on the implementation of ESG metrics in organizational strategy, as well as the collection, analysis, and reporting of ESG performance. The move was to raise standards on ESG practices by companies thereby enhancing competitiveness of Kenya's capital markets in the global market space,
- The launch of day trading. The NSE launched day trading in December 2021 as part of its strategy to enhance market liquidity following the approval by the Capital Markets Authority (CMA) of Kenya. The move made Kenya the first frontier market to implement day trading. Day trading which refers to the practice of purchasing or selling a security within a single day or trading session or multiple times over the course of the day. To complement the initiative, NSE approved an incentive structure whereby investors who participate in day trading received a 5.0% discount on subsequent trades,
- NSE announced in 2022, the introduction of fractional investing which allowed investors to purchase less than a whole share of a security. The move was to help to increase market activity by opening up access to stocks that would be out of reach due to high price,
- The Capital Markets Authority, in February 2024, granted approval to EABX Public Company Limited to operate as an “Over The Counter” Securities Exchange and recognized it as a Self-Regulatory Organization (SRO). The approval enables EABX to operationalise the Exchange by rolling out its electronic trading platform to its members in Kenya, with a plan to expand operations into the wider East African region in the near future,
- In May 2024, NSE announced the admission of Linzi Sukuk on the NSE Unquoted Securities Platform (USP) making the product the first Shari’ah compliant product to be admitted on the platform. The Linzi Sukuk, issued by Linzi FinCo Trust, is a Kshs 3.0 bn Islamic residential lease-based security with a 15-year maturity and an internal rate of return of 11.13%. The funds will support the construction of affordable institutional housing under the Government of Kenya’s Affordable Housing Program,
- NSE in August 2024, announced the addition of Co-operative Bank of Kenya as a constituent counter in the MSCI Frontier Markets Index bringing the total number of companies listed on the Nairobi Securities Exchange PLC (NSE) and incorporated in the MSCI Frontier Markets Index to five, i.e. Safaricom PLC, Equity Group Holdings, KCB Group PLC, East Africa Breweries PLC and Co-operative Bank of Kenya. In addition, the MSCI has also included the following four companies listed on the NSE in the MSCI Frontier Markets Small Cap Index namely, British American Tobacco Kenya, Diamond Trust Bank Kenya, KenGen PLC and Kenya Reinsurance Corporation. Further in February 2025, MSCI added Standard Chartered Bank Kenya to its Frontier Markets Index and HF Group to its Frontier Markets Small Cap Index, increasing visibility of Kenyan stocks to foreign investors,
- Nairobi Securities Exchange (NSE) announcedthe suspension in the trading of Bamburi Cement shares, effective February,27 2025 until May, 9 2025. The suspension on trading Bamburi Cement PLC shares was enacted following the company’s successful 96.5% acquisition by Amsons Industries (K) Ltd. The suspension was put in place to facilitate the squeeze out process for Amsons to acquire the remaining 3.5% of Bamburi’s shares.
The NSE equities market segment is the premium listing location for companies seeking to raise equity capital to support their growth needs by offering issuers a deep and liquid market that enables them to access a wide range of domestic and international retail and institutional investors. The NSE equities market is comprised of four listing segments, each specifically designed to meet capital, liquidity as well as regulatory requirements for issuers of all sizes. Namely; Main Investment Segment, Alternative Investment segment, Growth Enterprise Segment, and Fixed Income Securities Segment. Below is a list of the NSE’s market segments and the requirements to list on each of the segments.
- Main Investment Market Segment: This is the premium platform for large and well-established companies in Kenya and the region. The segment currently has 50 listed stocks with a total market capitalization of Kshs 1.9 tn, as at 25th April 2025, equivalent to 99.4% of the total NSE market capitalization. It is suitable for bigger companies that have been around for a longer period of time. For a company to be listed in this segment, it must submit at least 5-years of audited financials, 3 of which should be profitable years, and must have at least Kshs 50.0 mn worth of fully paid ordinary share capital and at least Kshs 100.0 mn in assets. At least 25.0% of shares are to be held by not less than 1000 shareholders excluding employees of the issuer,
- Alternative Investment Market Segment: This market segment is better suited for medium-sized companies that have at least Kshs 20.0 mn in assets and Kshs 20.0 mn of fully paid up share capital at the time of listing. The company must also have been in existence in the same line of business for a minimum of two years and demonstrate good growth potential. This segment currently has 9 listed companies with a market cap of Kshs 11.3 bn as at 25th April 2025, equivalent to 0.6% of the total NSE market cap. Listing fees for this segment are 0.06% of securities value to be listed, subject to a minimum of Kshs 100,000 and a maximum of Kshs 1.0 mn,
- Growth Enterprise Market Segments: It is a market segment introduced to facilitate the trading of securities of start-ups, small, and medium-sized companies. The requirements of listing in this segment are designed to be less stringent in order to enable firms in their growth phase to raise substantial capital and accelerate their growth within a regulatory environment. In this segment, there is no minimum firm asset value and profitability record requirement, a minimum of Kshs 10.0 mn in paid up share capital. This segment currently has 5 listed stocks, with a total market capitalization of Kshs 0.9 bn as at 25th April 2025 equivalent to 0.05% of the total NSE market capitalization, and,
- Fixed Income Securities Market Segment: This segment was designed to incorporate listing and secondary market trading of fixed income securities, mainly corporate and government bonds.
Other companies listed in the bourse are under the Exchange Traded Funds and the Unquoted Securities Platform namely; the New Gold Kenya ETF and the Acorn Holdings LTD respectively.
B. Types and Requirements of Listings
Securities may be admitted to listing at the exchange through the following methods;
- Initial Public Offer (IPO): This is the most common type of listing. It involves a company issuing new shares while listing on the selected stock exchange that will result in a new set of shareholders from the public buying the shares at a specified share price, and hence the company raising capital from the exercise,
- Listing by Introduction: This type of listing occurs when a company takes its existing shares and lists them on an exchange. Since only existing shares are listed by introduction, it follows that no new shares will be issued and no additional funds will be raised. This type of listing only provides the company with a regulated environment within which to operate and a platform to trade shares with public investors in the capital markets. The recent listing by introductions at the bourse was the listing of the Local Authority Pension Trust (LAPTRUST) Imara Income Real Estate Investment Trust (I-REIT) under the Restricted Sub-Segment in December 2022. LAPTRUST held 100.0% of the Imara I-REIT shares with no initial offer to the public,
- Cross Listing: This occurs when a company that is already listed on one stock exchange decides to list on another stock exchange other than its primary or original exchange. Cross-listing is advantageous in that it gives the listed company a larger scope of access to capital from different jurisdictions and different investors. No new shares are issued. Atlas managed the first cross-listing between the London Stock Exchange and the NSE raising Kshs 450.0 mn, by offering 10% of its 393.9 mn total issued shares for cross-listing on the NSE at a price per share of Kshs 11.5 with a minimum subscription of Kshs 1.0 mn per investor, and,
- Reverse Listing: This is a rare kind of listing strategy also referred to as back door listing where a company that is not listed on any exchange purchases a listed company and becomes automatically listed by virtue of this transaction. It is common when a company that wants to have access to the capital markets also wants to avoid the time and cost spent in a regular listing. The listing of I&M Bank for instance, was through the reverse acquisition of City Trust Limited (CTL) in 2013.
As above mentioned, the NSE is categorized into different market segments approved by CMA. The segments as stipulated have different eligibility, trading restrictions, and disclosure requirements, prescribed by CMA that companies planning to publicly offer shares through listing have to abide by. Below is a summary of those requirements:
|
Cytonn Report: Requirements for Public offering of shares and listing |
|||
|
Requirement |
Criteria for the Main Investment Market Segment (MIMS) |
Criteria for The Alternative Investment Market Segment (AIMS) |
Criteria for the Growth Enterprise Market Segment (GEMS) |
|
Incorporation status |
It should be a public company limited by shares and registered under the Companies Act |
||
|
Share Capital |
The issuer should have a minimum of Kshs 50.0 mn of authorized issued and fully paid up ordinary share capital |
The issuer should have a minimum of Kshs 20.0 mn of authorized issued and fully paid up ordinary share capital |
The issuer should have a minimum authorized and fully paid up ordinary share capital of Kshs 10.0 mn and must have not less than 100,000 shares in issue |
|
Net Assets |
Net assets immediately before the public offering or listing of shares should not be less than Kshs 100.0 mn. |
Net assets immediately before the public offering or listing of shares should not be less than Kshs 20.0 mn |
N/A |
|
Free Transferability of Shares |
Shares to be listed should be freely transferable and not subject to any restrictions on marketability or any pre-emptive rights |
||
|
Availability and Reliability of Financial records |
The issuer should have audited financial statements complying with IFRS for an accounting period ending on a date not more than 4-months prior to the proposed date of the offer or listing for issuers whose securities are not listed at the securities exchange, and 6-months for issuers whose securities are listed at the securities exchange. The Issuer must have prepared financial statements for the latest accounting period on a going concern basis and the audit report must not contain any emphasis of matter or qualification in this regard |
N/A |
|
|
Solvency and adequacy of working capital |
The issuer should not be insolvent and should have adequate working capital |
The issuer should not be insolvent and should have adequate Working capital. The Directors of the Issuer shall also give an opinion on the adequacy of working capital for at least 12 months immediately following the share offering, and the auditors of the issuer shall confirm in writing the adequacy of that capital. |
|
|
Share Ownership Structure |
Following the public share offering or immediately prior to listing in the case of an introduction at least 25.0% of the shares must be held by not less than 1,000 shareholders excluding employees of the issuer. In the case of a listing by introduction, the issuer shall ensure that the existing shareholders, associated persons or such other group of controlling shareholders who have influence over management shall give an undertaking not to sell their shareholding before the expiry of a period of 24 months following listing and such undertaking shall be disclosed in the Information Memorandum |
Following the public share offering or immediately prior to listing in the case of an introduction, at least 20.0% of the shares must be held by not less than 100 shareholders excluding employees of the issuer or family members of the controlling shareholders. No investor shall also hold more than 3.0% of the 20.0% shareholding. The issuer must ensure that the existing shareholders, associated persons or such other group of controlling shareholders who have influence over management shall give an undertaking to the Authority not to sell their shareholding before the expiry of a period of 24 months following listing and such undertaking shall be disclosed in the Information Memorandum. |
The Issuer must ensure at least 15.0% of the issued shares, (excluding those held by a controlling shareholder or people associated or acting in concert with him; or the Company's Senior Managers) are available for trade by the public. An issuer shall cease to be eligible for listing upon the expiry of 3 months of the listing date, if the securities available for trade by the public are held by less than 25 shareholders (excluding those held by a controlling shareholder or people associated or acting in concert with him, or the Company's Senior Managers) The issuer must ensure that the existing shareholders, associated persons or such other group of controlling shareholders, who have influence over management, shall give an undertaking in terms agreeable to the Authority, and the Securities Exchange restricting the sale of part or the whole of their shareholding before the expiry of a period of 24 months following listing. |
|
Track record, profitability and future prospects |
The issuer must have declared profits after tax attributable to shareholders in at least three of the last five completed accounting periods to the date of the offer |
The issuer must have been in existence in the same line of business for a minimum of two years one of which should reflect a profit with good growth Potential. |
N/A |
|
Dividend policy |
The issuer must have a clear future dividend policy. |
N/A |
|
Source: NSE
C. Reasons for the low number of listings
Since 2016, Kenya has failed to attract any IPOs and the last time it recorded an IPO was in 2015 when Stanlib investments issued an IPO of the first Real Estate Investment Trust (Fahari I-REIT) at the bourse, which raised Kshs 3.6 bn against the target of Kshs 12.5 bn. The most recent activity at the bourse was the listing by introduction, where no money was raised, of the Local Authority Pension Trust (LAPTRUST) Imara Income Real Estate Investment Trust (I-REIT) under the Restricted Sub-Segment in December 2022. Some of the key issues we believe the Authority needs to undertake in order to attract more IPOs are as follows;
- Shallow market: The Nairobi Securities Market is regarded as a shallow market since it only offers few instruments and limited liquidity, leaving firms with minimal financing options. The strength of securities markets that make them crucial in the growth of an economy, is their capacity to mobilize long-term savings for financing long-term projects and encourage broader ownership of firms. The intermittent trading of only a few stocks held by a small number of investors makes the NSE less efficient. In comparison to other nations like South Africa, which has a total of 274 listed companies, NSE still lags behind having only 66 listed companies. Moreover, the market still lags behind in terms of liquidity due to overreliance on a few stocks thus discouraging listing as companies with the potential to list stay away out of fear of having failed IPOs,
- Rigid regulatory framework: The regulatory structure in Kenya’s capital market has been a key impediment to the penetration of capital market products as well as the introduction of new IPOs. The current regulations governing the capital markets securities, public offers, listing, and disclosure is the Capital Markets Regulations Act 2002 do not meet the needs of the ever-evolving market. However, the authority announced that is fast-tracking reforms to update the regulations and has issued the Draft Public Offers, Listing and Disclosures seeking to address emerging issues and market dynamics in order to provide a more enabling environment in the Kenya’s Capital Markets that will spur more listings in the Nairobi Securities Exchange. Moreover, costs associated with compliance with the regulatory and corporate governance framework requirements have been a barrier to potential companies going public. Additionally, most potential companies are reluctant to list since compliance with some of the regulations exposes the company to the public realm which they regard as a loss of competitive advantage,
- The rise of Private Equity firms providing easily accessible capital: Kenya’s private equity sector has been thriving, with raising capital through private equity companies on the upswing, making companies shy from listing due to the readily available capital. According to the 2024 African Private Capital Activity Report, total volumes of private capital deals in Africa in 2024 rose by 7.7% to 485 from 450 in 2023, demonstrating the resilience and growth of private equity in the continent at large. Private equity funding is more appealing than public floatation for many companies primarily because it allows companies to stay private as they continue to finance their businesses for expansion thus preserving the kind of decision-making power of its shareholders that is typically lost when businesses seek public listing,
- Perceived high cost for listing: Most small and medium-sized companies shy from listing shares due to the perceived high direct cost in particular the annual listing fees of 0.06% of the market capitalization subject to a minimum of Kshs 200,000.0 and a maximum of Kshs. 1,500,000.0. Additionally, due to a lack of awareness, the small and medium-sized enterprises which are dominant in the Kenyan economy, depend mainly on bank loans despite raising capital through the capital markets being cheaper. According to a study by the CMA, the percentage cost of floating securities in the capital markets is comparatively lower than bank lending rates. Moreover, IPO costs have ranged from 1.9% to 10.6% from 2012-2016, with the floatation of Eveready at 10.6% being the highest while Deacons in 2016 at 1.9% being the lowest, compared to bank lending rates averaging at 15.1% as of February 2025 according to CBK. Additionally, compared to bank loans, which are annual costs over the tenure of the relevant loans, the cost of floatation is a one-off cost,
- Size of companies: The Kenya economy is dominated by small and medium-sized companies, the perception that mature companies are the ones that are in good position to issue IPOs makes the small and medium-sized companies reluctant to list for fear of having unsuccessful IPOs. This is an indication that startup companies are not growing enough to the capacity that would make them attractive to investors during IPOs which is the main reason the informal sector still dominates the economy, and,
- Loss of control: Many companies particularly those that are family-owned or closely held are reluctant to list due to fear of dilution of ownership as well as losing their voting control. The companies typically rely on bank finance to raise additional capital when required. Additionally, most companies avoid going public due to constant pressure from public shareholders. Unlike the original owners, public shareholders usually take a short-term position and they are more concerned with seeing constant rises in the stock's price so they can sell their shares for a profit.
D. Performance of the Nairobi Securities Exchange
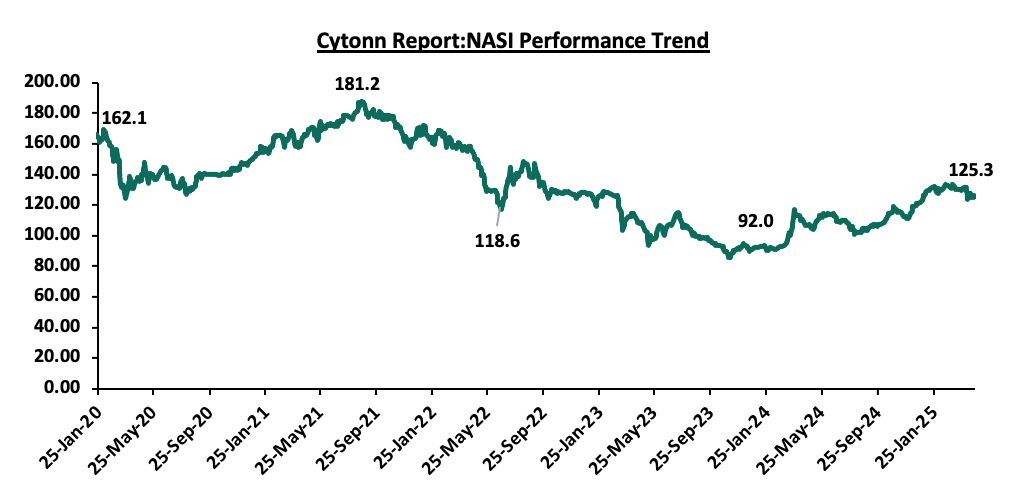
The Kenya's stock market experienced a notable turnaround in 2024, with the market witnessing a substantial gain of 34.1% in its all-share index (NASI) to 123.5 in December 2024 compared to the 92.0 recorded in January 2024, a reversal from the 27.7% loss recorded in 2023. This gain was attributed to factors such as alleviated inflationary pressures with the average inflation for 2024 coming in 4.5%, 3.3% points lower than the 7.7% average in 2023, coupled with the 17.4% appreciation of the local currency compared to the 26.8% depreciation in 2023. The chart below shows the performance trend of the Nairobi All Share Index over the last 5 years;
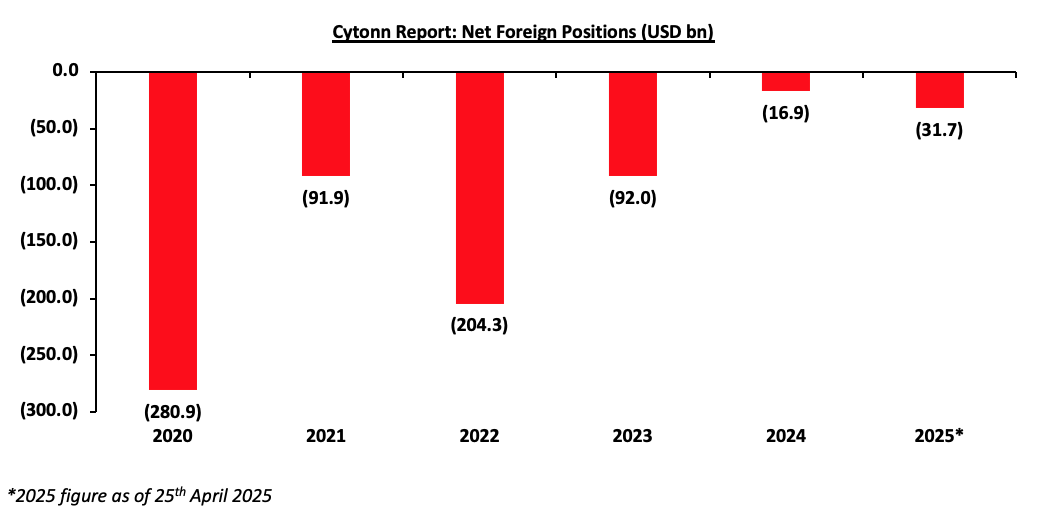
All these combined led to improved foreign inflows into Kenya’s domestic equities markets as investors were drawn by the improved investment opportunities. The improved macroeconomic outlook boosted investor confidence and positioned the market as an appealing frontier for capital allocation. Foreign investors remained net sellers for a fifth consecutive year with the net selling position however decreasing significantly by 81.6% to USD 16.9 bn in 2024 from a net selling position of USD 92.0 bn recorded in 2023. The chart below shows the net activity foreign positions over the last 5 years and 2025 YTD:
The performance of Kenya's stock market relies significantly on a select group of key players, notably Safaricom, the nation's leading telecommunications company. Safaricom, a magnet for foreign investors, constitutes a substantial 34.9% of the index as of 25th April 2025. According to Emerging Africa Group, this concentration resulted in notable disruptions during the year, as foreign investors, enticed by more promising opportunities elsewhere, divested their holdings. This led to a significant decline in the value of Safaricom shares by 44.5% to Kshs 13.7 per share as at the end of 2023 from Kshs 24.5 per share recorded at the end of 2022. Similarly, other heavily capitalized stocks such as commercial banks, also experienced substantial losses.
Section II: Current State of Other Components of Kenya’s Capital Markets
A. Real Estate Investment Trusts (REITS)
Real Estate Investment Trusts (REITs) serve as pooled investment vehicles enabling individuals to invest in real estate ventures by purchasing units within a trust. Kenya adopted REIT frameworks in 2013, following the footsteps of Ghana and Nigeria, which implemented similar structures earlier.
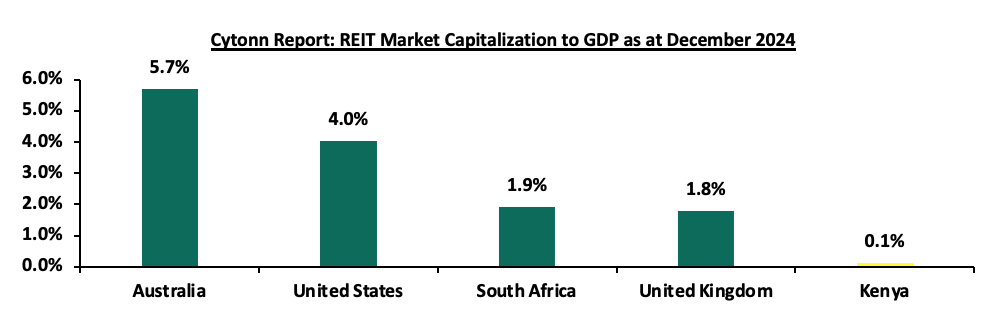
However, the Kenyan REIT market has struggled to gain momentum since its inception due to several challenges. These obstacles include stringent requirements for trustees, which demand significant capital of Kshs 100.0 mn, limiting participation primarily to banks. Additionally, the process for REIT approval is protracted, and the minimum investment threshold of Kshs 5.0 mn acts as a deterrent for potential investors. Furthermore, there is a lack of awareness and understanding among investors regarding this financial asset class. Consequently, Kenya's REIT market capitalization remains notably lower compared to its counterparts in other regions. The underdeveloped capital markets in Kenya has continually failed to provide alternative means of financing Real Estate developments. Due to this, most property developers rely on conventional sources of funding such as banks, compared to other developed countries. As a result, Kenya’s REIT Market Capitalization to GDP has remained significantly low at 0.1%, compared to other countries such as South Africa with 1.9%, as shown below;
Source: European Public Real Estate Association (EPRA), World Bank, Cytonn Research
Most property developers in Kenya continue to rely on traditional funding sources, such as banks, unlike in more developed markets. Since the establishment of REIT regulations, four REITs have been approved in Kenya, all structured as closed-ended funds with a fixed number of shares. However, none of these REITs are actively trading on the Main Investment Market Segment of the Nairobi Securities Exchange (NSE). Following the recent delisting of ILAM Fahari I-REIT, LAPTrust Imara I-REIT is the only listed REIT in the country, quoted on the restricted market sub-segment of the NSE's Main Investment Market. It is important to note that Imara did not raise funds upon listing. The ILAM Fahari I-REIT, Acorn I-REIT and D-REIT are not listed but trade on the Unquoted Securities Platform (USP), an over-the-counter market segment of the NSE. The table below outlines all REITs authorized by the Capital Markets Authority (CMA) in Kenya:
|
Cytonn Report: Authorized REITs in Kenya |
||||||
|
# |
Issuer |
Name |
Type of REIT |
Listing Date |
Market Segment |
Status |
|
1 |
ICEA Lion Asset Management (ILAM) |
Fahari |
I-REIT |
July 2024 |
Unquoted Securities Platform (USP) |
Trading |
|
2 |
Acorn Holdings Limited |
Acorn Student Accommodation (ASA) – Acorn ASA |
I-REIT |
February 2021 |
Unquoted Securities Platform (USP) |
Trading |
|
3 |
Acorn Holdings Limited |
Acorn Student Accommodation (ASA) – Acorn ASA |
D-REIT |
February 2021 |
Unquoted Securities Platform (USP) |
Trading |
|
4 |
Local Authorities Pension Trust (LAPTrust) |
Imara |
I-REIT |
March 2023 |
Restricted Market Sub-Segment of the Main Invesment Market |
Restricted |
Source: Nairobi Securities Exchange, CMA
B. Secondary Bond Market
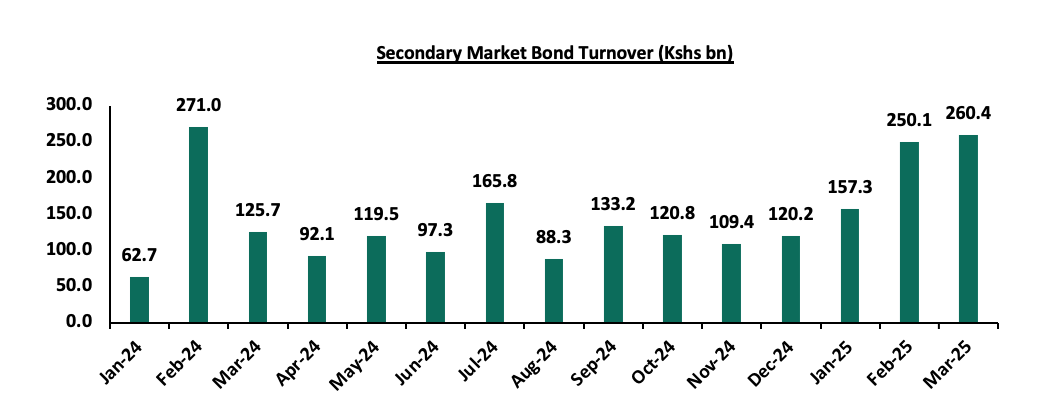
Activity in Kenya's secondary bond market improved significantly in 2024 with secondary bond turnover increasing by 55.7% in 2024 to Kshs 1,505.9 bn from Kshs 666.9 bn in 2023, attributable to increased investor appetite for fixed income securities driven by the high interest rates. So far in 2025 activity in Kenya’s secondary bond market has been on an upward trajectory recording a 45.4% growth in Q1’2025 to Kshs 667.8 bn, from Kshs 459.3 bn in Q1’2024. The growth in activity can be attributed to increased market liquidity, as investor lock in the attractive rates in anticipation of further rate cuts as the yield curve normalizes. The charts below show the secondary market bond turnover and the yields on Kenya’s 10-year Government bond;
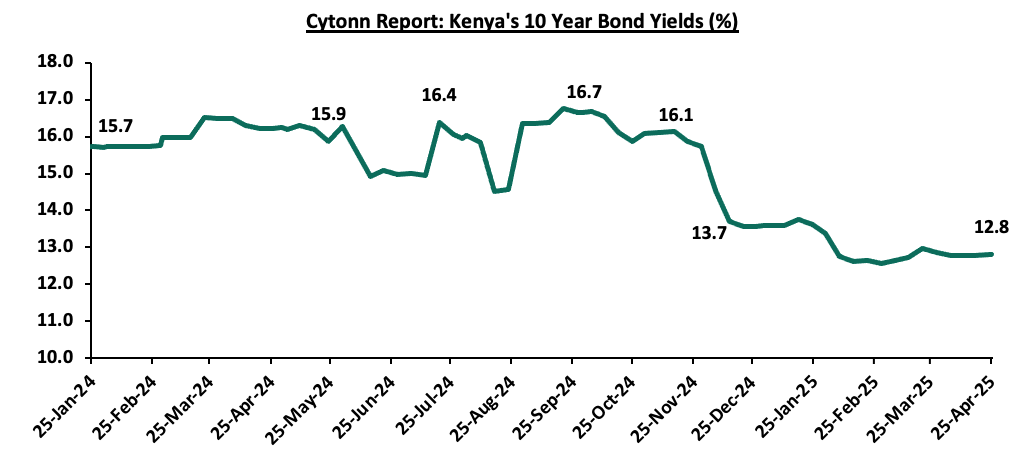
This decline in yields reflects a significant shift in investor sentiment driven by successful debt management strategies. Key factors contributing to this positive outlook include the government’s timely repayment of the USD 2.0 bn Eurobond that matured in June 2024, which alleviated concerns about potential default and demonstrated fiscal responsibility. In February 2025, the Kenyan government continued its proactive debt management by initiating a USD 900.0 mn buyback of the 2019 Eurobond maturing in 2027. This buyback was financed through a new USD 1.5 billion Eurobond with a 9.5% coupon rate, maturing in 2036. The move aimed to smooth out the country's debt maturity profile and reduce refinancing risks. Additionally, the stronger Shilling, the eased inflation and improved foreign exchange reserves have collectively enhances investor confidence, reducing the risk premium associated with Kenyan sovereign assets
Section III: Challenges Facing Kenya’s Capital Markets
Kenya's capital market has developed and reached several significant milestones over time, which have spurred the country's economic expansion. Some key developments in the capital markets over the last year include:
- The Capital Markets Authority (CMA) introduced the Draft Capital Markets Regulations, 2025 which seek to establish a comprehensive governance framework for market intermediaries in Kenya’s capital and commodities markets. Issued under the Capital Markets Act, the regulations mandate rigorous standards on board composition, independence, accountability, internal controls, risk management, and transparency. Key provisions include mandatory independent directors, restrictions on related-party representation, fit-and-proper criteria, robust internal audit and compliance systems, and clear separation of powers between the board and management. The framework also enforces detailed reporting requirements, ensures alignment with global best practices, and holds individuals personally liable for non-compliance signaling a strong move towards greater integrity, investor protection, and sustainable market confidence. CMA is currently seeking comments from stakeholders and the general public on the draft Regulations,
- The Capital Markets Authority (CMA) approved new rules to curb speculative trading in troubled firms listed on the Nairobi Securities Exchange (NSE). Key changes include cutting the daily price movement limit from 10.0% to 5.0% for such companies and establishing a dedicated Recovery Board (RB) to host firms facing financial or governance issues. Affected firms will be given two years to recover or risk delisting, with a mandatory minimum trade size of 100 shares to reduce market manipulation. This move aims to enhance investor protection and market integrity.
- Morgan Stanley Capital International (MSCI) added two more Kenyan firms to its frontier markets indices, boosting investor confidence in the Nairobi Securities Exchange (NSE) as it seeks to sustain growth after years of decline. Standard Chartered Bank Kenya joined the main frontier markets index alongside existing firms like Safaricom, Equity Group, and EABL. Additionally, HF Group was added to the frontier markets small-cap index, joining other notable firms such as BAT Kenya and KenGen.,
- The Court of Appeal refused to suspend a High Court ruling that blocked the sale of 11 state-owned enterprises. The government had planned the privatizations to reduce losses and ease the burden on public finances. However, the judges found that the National Assembly failed to show sufficient public interest to justify overturning the decision,
- Centum Investment company announced plans to set up Kenya’s first dollar denominated income Real Estate Investment Trust (I-Reit) at its Two Rivers special economic zone in Nairobi. The initial investment will be an office tower at its Two Rivers International Finance and Innovation Centre
- In January 2025, the NSE lifted the suspension on trading Kenya Airways shares after 4.5 years, following the airline’s return to profitability and the withdrawal of the National Aviation Management Bill 2020. The trading of the group’s shares was suspended in July 2020 mainly due to implementation of the National Aviation Management Bill 2020,
- The East African Securities Exchanges Association (EASEA) launched the East Africa Exchanges (EAE) 20 Share Index. The EAE 20 Share Index comprises of the top 20 listed companies in Kenya, Tanzania, Uganda and Rwanda securities exchanges.
Despite the major advancements in the Kenya capital markets, Kenya still lags behind the capital markets of developed countries. This is evidenced by the low Kenya’s Mutual Funds/UTFs to GDP ratio that came in at 2.6% at the end of FY’2024, significantly lower compared to an average of 50.6% amongst select global markets an indication of a need to continue enhancing our capital markets. Additionally, Sub-Saharan African countries such as South Africa and Namibia have higher mutual funds to GDP ratios coming in at 61.5% and 43.1%, respectively as at end of 2020, compared to Kenya. The chart below shows select countries’ mutual funds as a percentage of GDP:
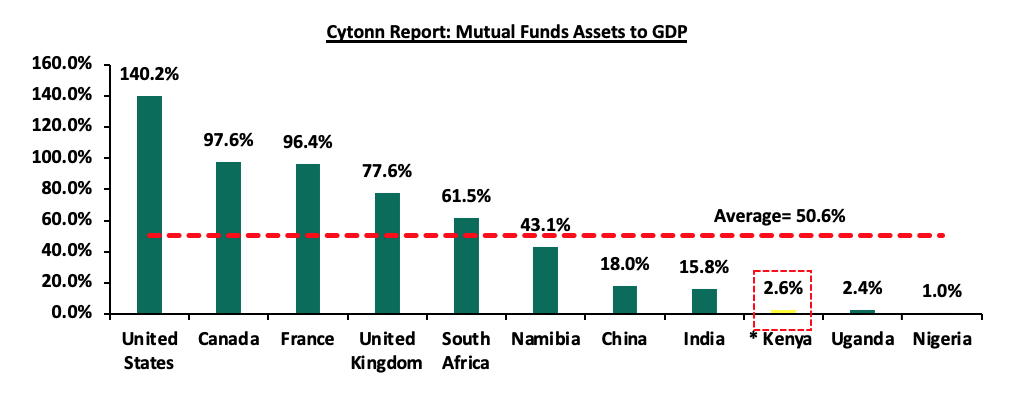
*Data as of December 2024
Source: World Bank Data
Some of the barriers that hinder the growth of the capital markets in Kenya include:
- Restrictive regulatory framework - The current regulatory framework governing capital market securities, public offers, listing, and disclosure is established by the Capital Markets Regulations Act of 2002. However, it fails to adequately cater to the evolving needs of the market. In response, the regulatory authority has announced plans to expedite reforms aimed at updating these regulations. A Draft Public Offers, Listing, and Disclosures was issued to address emerging issues and market dynamics, with the goal of creating a more conducive environment for Kenya's Capital Markets. The objective is to encourage more listings on the Nairobi Securities Exchange. Additionally, the costs associated with compliance to regulatory and corporate governance requirements have posed a significant barrier for potential companies considering going public. Moreover, many potential companies are hesitant to list due to concerns that compliance with certain regulations could expose them to public scrutiny, potentially undermining their competitive advantage,
- Unfavorable conditions for Private Offers - Unregulated markets operate under agreements between participating parties and thus lack oversight from a specific regulator. However, the offering process typically adheres to defined rules and guidelines. Regrettably, the expansion of unregulated products in Kenya's capital markets remains restricted due to the absence of regulatory backing. This situation has perpetuated the misconception that private offers pose safety risks, discouraging investor participation and constraining businesses from utilizing private offers to secure funds,
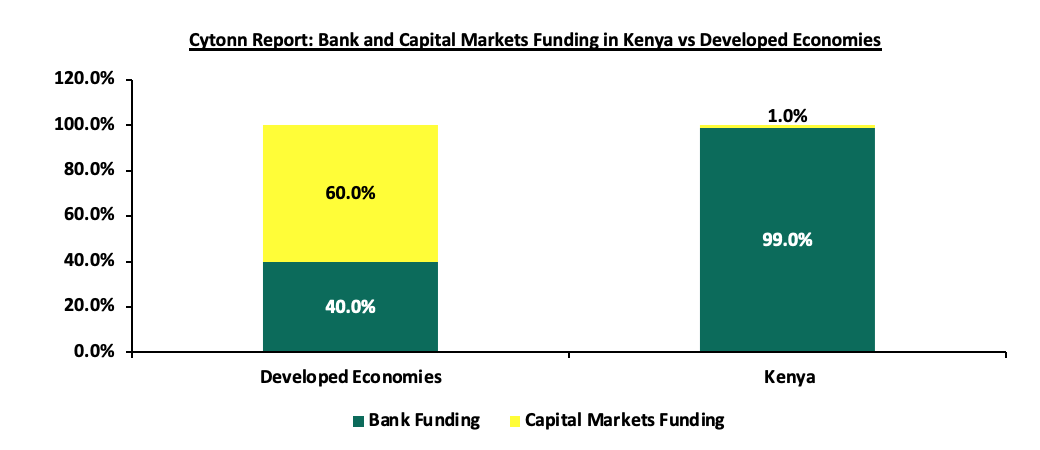
- Dependence on Banks for Funding over Capital Markets - In developed economies, the majority of businesses secure funding through capital markets, where capital market financing comprises 60.0%, while funding via banks stands at 40.0%. However, in Kenya, the situation is reversed, with capital markets contributing only 1.0%, while banks account for 99.0%. Beyond the statistical data, there is a perception that banks, rather than capital markets, dictate the economic agenda, leading to an imbalance in their respective roles in driving economic growth. Additionally, inadequate knowledge among some investors and general public has led to less participation in the capital market and overreliance on bank funding,
Source: World Bank
- Low Investor Participation - Despite efforts to promote investor education and awareness, there remains a significant portion of the population that is not engaged in the capital markets. Factors such as low financial literacy levels, cultural attitudes towards investment, and a preference for traditional savings methods contribute to this issue,
- Challenges in the approval process for issuers and market participants - The expenses and intricacies involved in obtaining approval for issuing securities on the Nairobi Securities Exchange (NSE) have deterred potential issuers from participating in the capital market. The lack of clear process of adherence to the approval framework, creates delays and affects growth of the market. This is evident from the fact that only 62 companies have been listed on the NSE since its official declaration, and,
- Previous corporate failures - Certain investors have experienced financial losses in the capital markets previously. This has resulted in a negative perception of the market for some, making it challenging for them to engage in new offerings should they arise.
Section IV: Recommendations and Conclusion
From the issues identified, we are of the view that the following should be done to facilitate growth in the number of new listings as well as development of Kenya’s Capital Markets:
- Remove Specific Obstacles to Capital Formation from Capital Markets: Under-developed capital markets make it harder to develop pools of capital focused on projects, particularly in the private markets, to complement efforts by the government. In Kenya, the main source of funding for real estate developers is banks which provide close to 99.0% of funding as compared to 40.0% in developed countries. This implies that capital markets contribute a mere 1.0% of real estate funding, compared to 60.0% in developed countries. To increase funding from capital markets, we will need to open our capital markets from the current restrictive rules and regulations, which serve to constrain capital markets development. Specifically, we need to;
- Enable Unit Trust funds to have as many bank custodians as necessary to serve their clients,
- Reduce the minimum investment required for development REITs from the current Kshs 5.0 mn, which is too high given the current median income of just Kshs 50,000 per month,
- Expand room for private offers to increase the diversity of funding available in the market,
- Allow for specialized collective investment schemes so that investors can invest in funds focused on housing, as current rules only allow up to 25.0% investment into one asset class, and,
- Reduce the capital requirements for a REIT Trustee from Kshs 100.0 mn, which has limited the REIT trustees to less than 4 players.
- Fast track Privatization of State-Owned Enterprises: In October 2023, the government published the privatization act of 2023 which sought to address the long processes of approval of State-Owned Entities (SOEs) for privatization and provide a new framework for the process. The act was declared unconstitutional by the high court last year a decision that was upheld by the court of appeal. The repeated legal setbacks highlight the need for a more robust and constitutionally sound approach to reforming the privatization process.
- Mode of appointment of the Chief Executive Officer of the Capital Markets Authority: The current CMA Act states that the CEO shall be appointed by the Minister and shall hold office on such terms and conditions of service as may be specified in the Act. Given the importance of the capital markets and its role in supporting the growth of the economy, the appointment should be done by the President with the approval of the Parliament, similar to how the Central Bank of Kenya (CBK)’s Governor is appointed. Additionally, the Parliamentary vetting process will promote transparency as the capital markets players, investors and Kenyans in general will be able to participate in the appointment,
- Promote investment in Small and Medium Sized companies with growth potential: Following the increasing number of Small and Medium Sized companies, financing them through the securities exchange is key to the growth of an economy. However, the challenge usually arises in onboarding investors who are willing to take the risk in these types of companies given some of them have low-profit history while others are less liquid. However, some of the ways that can be used to promote and expand small and medium-sized enterprises, include the introduction of tax incentives for investors willing to invest in small and medium-sized companies to facilitate financing and boost liquidity and growth,
- Investor compensation levy for CIS and REITs: Investor compensation levy for CIS and REITs: An Investor Protection Fund, in relation to a financial market, is a fund consisting of contributions made by the market participants or financial levies by the market’s regulators. Its main purpose is to ensure the protection of investors' investments against the loss sustained or adverse impact of the breach on the person or persons claiming compensation or restitution. The solution is to stimulate capital markets as a complementary alternative to banking markets, and hence the intended revision of the current CIS regulations has come at an opportune time,
- Market Transparency: The degree to which markets are transparent affects investors' decision making. Transparency of trading allows efficient price setting and thus increases confidence in the market. Therefore, it is key for the regulator to enforce measures that raise the level of transparency in the market in order to make it more attractive to investors. This will help to boost its liquidity and consequently attract potential companies who are reluctant to go public due to the inefficiency in the market,
- Create a Culture of Participation in the Stock Market: It is essential to disseminate knowledge of having a candid stock market through a listing of more companies in order to broaden the financial markets. This can be implemented by having a specific day in a calendar for financial education where the general public is educated on the importance of investment and financial culture,
- Improve Tax Incentives for New Listings: The authority needs to develop measures that are favourable to going public that will enable it to attract more companies and have a powerful and more developed securities market. In order to attract more listings, the authority needs to improve its tax treatments for dividends as well as capital gains,
- Train and offer Independent and free assessment to companies: In order to attract more listings, the authority needs to offer training on matters of financial transparency, sustainability, and corporate governance to potential companies as well as offer free assessment in order to help them position themselves for transitioning to the public markets, and,
- Simplify regulations and make it easier to access listing at the securities exchange market: The simplification of obtaining listing can encourage companies to go for listing at the stock market and take advantage of public finance in the market to gain size and boost growth than private financing through risk or venture capital. The general cost of listing should also be reduced in order to make it more favourable and appealing for IPOs.
We firmly believe that the implementation of these recommendations will not only address the current challenges hindering capital market growth but also pave the way for a more vibrant and resilient financial ecosystem. Additionally, they will help increase the market efficiency and consequently boost investors’ confidence. Having an active capital market is paramount for fostering economic growth, driving innovation, and enhancing financial stability. Vibrant Capital Markets are also key to attracting SMEs to the capital markets structure, given that they form the bulk of businesses in Kenya.
Disclaimer: The views expressed in this publication are those of the writers where particulars are not warranted. This publication is meant for general information only and is not a warranty, representation, advice or solicitation of any nature. Readers are advised in all circumstances to seek the advice of a registered investment advisor.

- Talk to us
- Kenya
- P.O Box 20695 - 00200, Nairobi, Kenya
- Cell +254709101200
- Tel +254709101200
- WhatsApp +254741676635
- United States
- +254709101200
- DOWNLOAD OUR APP
-


- Kenya
- 8th Floor, Pinetree Plaza, Kaburu Drive, Ngong Road, Nairobi, Kenya
- USA
- Suite 1150, 1775 Eye Street NW, USA, Washington DC 20006, USA
- Investments
- High Yield
- Private Equity
- Real Estate
- Real Estate
- RiverRun Estates
- Cytonn Towers
- The Ridge
- Taraji Heights
- The Alma