Jul 30, 2023
In August 2022, we published the Kenya Retail Report 2022, themed “Accelerated Retail Investments,” which highlighted that the Kenyan retail sector’s overall performance remained stable, with the average rental yield coming in at 6.8% in 2022, unchanged from what was recorded in 2021. The average occupancy rate however declined by 1.1% points to 77.3% in 2022, from 78.4% that was recorded in 2021, mainly attributed to the addition of new malls into the market such as the Global Trade Centre (GTC) and Meru Greenwood malls among others, which in turn weighed down the overall absorption rate.
This week, we update our Kenya Retail Report 2022 with the Kenya Retail Report 2023 themed “Retail Expansion with Focus into Untapped Markets” in which we discuss the progress and performance of the Kenyan retail sector. This will be based on research that was conducted on nine nodes within the Nairobi Metropolitan Area (NMA), in addition to other key urban cities in Kenya, including Kisumu, Nakuru, Mombasa, Eldoret, and the Mount Kenya Region. Based on this, we shall identify the market performance in terms of rents, occupancy rates, and rental yields, while updating on the key factors in the markets driving their performance. Therefore, we shall cover the topical as follows;
- Overview of the Kenya Retail Sector in 2023,
- Kenya Retail Sector Performance Summary in 2023,
- Retail Space Demand Analysis,
- Retail Space Investment Opportunity, and,
- Retail Sector Outlook.
Section I: Overview of the Kenya Retail Sector in 2023
The Kenya retail sector registered increased market activities in 2023 evidenced by the aggressive expansion by major local and international retailers, and developments. Some of the retailers who have been on an aggressive expansion drive during the year include; i) Naivas supermarket which opened new stores spread across Nairobi, Malindi, and Kisii Counties, plans to open another outlet in Kakamega, ii) QuickMart supermarket which opened new stores in Nairobi’s Kileleshwa and Eastlands and in Nyali, Mombasa, and, iii) Carrefour which opened a new outlet in Nairobi’s Eastleigh, in a bid to stamp market dominance.
The table below shows a summary of the number of stores of the key local and international retailer supermarket chains in Kenya;
|
Cytonn Report: Main Local and International Retail Supermarket Chains |
|||||||||
|
Name of retailer |
Category |
Branches as at FY’2018 |
Branches as at FY’2019 |
Branches as at FY’2020 |
Branches as at FY’2021 |
Branches as at FY’2022 |
Branches opened in 2023 |
Closed branches |
Current branches |
|
Naivas |
International* |
46 |
61 |
69 |
79 |
91 |
6 |
0 |
97 |
|
Quick Mart |
Hybrid** |
10 |
29 |
37 |
48 |
55 |
4 |
0 |
59 |
|
Chandarana |
Local |
14 |
19 |
20 |
23 |
26 |
0 |
0 |
26 |
|
Carrefour |
International |
6 |
7 |
9 |
16 |
19 |
1 |
0 |
20 |
|
Cleanshelf |
Local |
9 |
10 |
11 |
12 |
12 |
1 |
0 |
13 |
|
Tuskys |
Local |
53 |
64 |
64 |
6 |
6 |
0 |
59 |
5 |
|
Game Stores |
International |
2 |
2 |
3 |
3 |
0 |
0 |
3 |
0 |
|
Uchumi |
Local |
37 |
37 |
37 |
2 |
2 |
0 |
35 |
2 |
|
Choppies |
International |
13 |
15 |
15 |
0 |
0 |
0 |
15 |
0 |
|
Shoprite |
International |
2 |
4 |
4 |
0 |
0 |
0 |
4 |
0 |
|
Nakumatt |
Local |
65 |
65 |
65 |
0 |
0 |
0 |
65 |
0 |
|
Total |
|
257 |
313 |
334 |
189 |
211 |
12 |
181 |
222 |
|
*51% owned by IBL Group (Mauritius), Proparco (France), and DEG (Germany), while 49% owned by Gakiwawa Family (Kenya) |
|||||||||
|
**More than 50% owned by Adenia Partners (Mauritius), while Less than 50% owned by Kinuthia Family (Kenya) |
|||||||||
Source: Cytonn Research
Other franchises that have embarked on expansion in Kenya include:
- ChicKing, an international fast-food chain, in partnership with M/s Crispy Limited, a local franchise, opened a restaurant outlet located in Mombasa along Nyerere Avenue, the first outlet in Kenya and the East African market,
- Simbisa Brands, Zimbabwe’s largest fast-food restaurant operator, which runs quick-service restaurants such as Chicken Inn, Pizza Inn, Bakers Inn, and Creamy Inn, opened 25 new outlets in Kenya since 2022, ending up with 275 outlets as at March 2023,
- Chicken Cottage, a UK fast-food chain announced a partnership deal in 2022 with Express Kitchen, a subsidiary of AAH Limited to open 50 outlets at Hass Petroleum’s service stations in Kenya, Rwanda, Tanzania and Uganda, and,
- Java House, an international restaurant chain, who also owns 360 Degrees Artisan Pizza, Kukito, and Planet Yogurt food chains, opened a new outlet located at Eastleigh, Nairobi in June 2023. Java House also plans to open three outlets at Nairobi’s Jomo Kenyatta International Airport, Moi International Airport in Mombasa and in Machakos within the year.
In addition, there are various upcoming retail developments in the pipeline such as The Cove, The Beacon, Lana Plaza, ParkPlace Avenue, Crystal Rivers, and Britam mall in the NMA. This is supported by factors which are driving growth in the sector, including;
- Improved Accessibility - The government's focus on infrastructural developments in road and railway projects has opened up areas for investments, thereby increasing growth and expansion of retailers to provide convenience to consumers in the improved regions,
- Positive National Demographics - The demand for goods and services has been steadily rising due to Kenya’s relatively high urbanization and population growth rates of 3.7% p.a and 1.9% p.a, respectively, against the global average of 1.6% p.a and 0.9% p.a, respectively as at 2021,
- Presence of Gaps in the Market - Retailers such as Naivas, QuickMart and Carrefour, among others, have continued an aggressive expansion drive to take up new and previously occupied spaces by troubled retailers such as Uchumi, Tuskys, and Nakumatt retail chains that left the market. This is as Kenya’s formal retail penetration is still low, standing at approximately 30.0% according to the Nielsen Report 2018,
- Sustained Foreign Investor Appetite - Kenya's reputation as a regional investments hub has continued to attract multinational companies and retailers to the country, further increasing the demand for retail space, and,
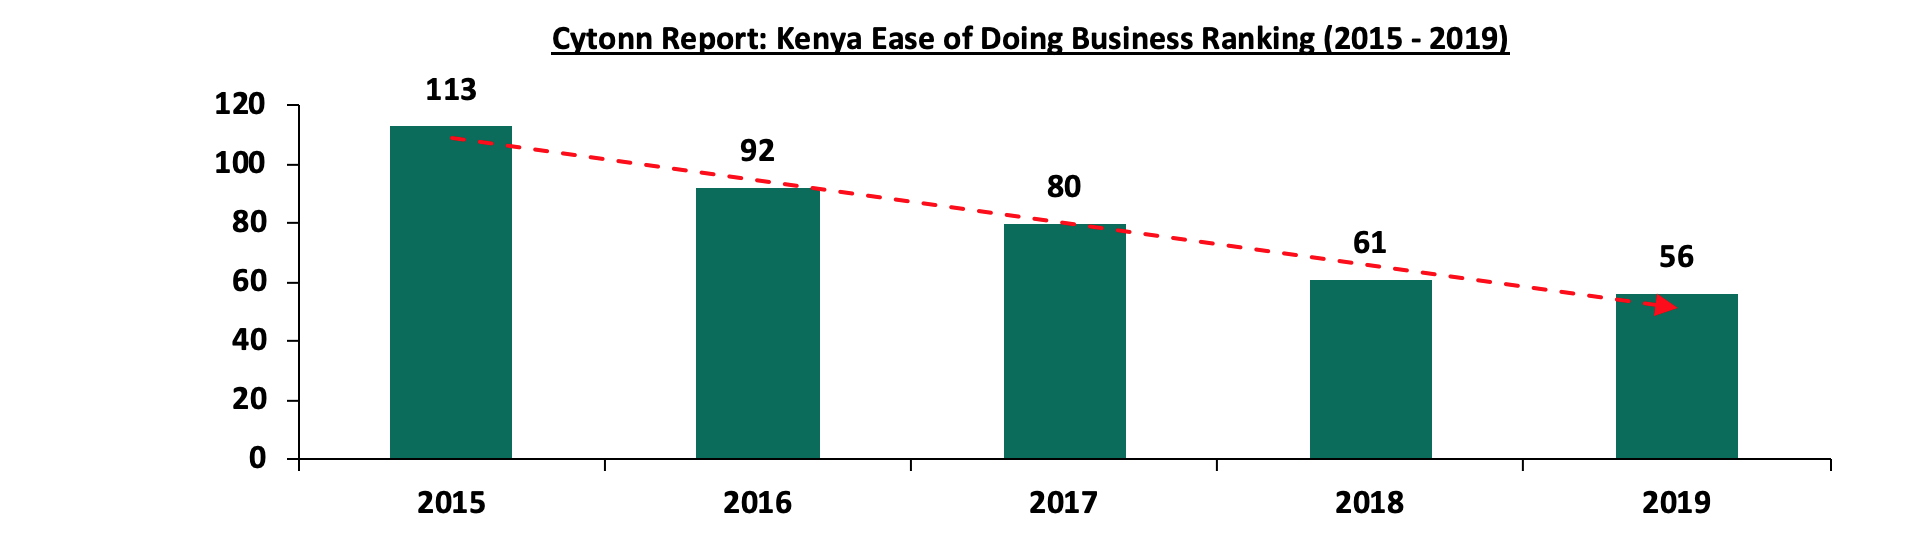
- Better Ease in Doing Business - The ease of doing business in Kenya has significantly improved, leading to enhanced investor confidence. According to the World Bank, Kenya's ranking in terms of ease of doing business was 56 in 2019, a notable improvement compared to its position at 113 five years prior. The graph below shows Kenya’s ranking performance between 2015 and 2019;
Despite the above factors driving the growth of the retail market, various challenges continue to impede the overall performance of the sector which include;
- Rising Construction Costs - Construction costs have been steadily rising, currently standing at an average of Kshs 41,600 per SQM in 2023, which is a 20.1% increase from Kshs 34,650 per SQM recorded in 2022. The increase is mainly on the back of inflationary pressure, discouraging optimal development activities in the sector,
- Constrained Access to Development Financing - Access to adequate credit has remained a challenge, given the increasing loan default rates in the property sector as financial institutions such as commercial banks continue to tighten their lending terms. According to the Central Bank of Kenya, the gross Non-Performing Loans (NPLs) in the Real Estate sector increased by 12.2% to Kshs 88.1 bn in Q1’2023, from Kshs 78.5 bn in Q1’2022,
- Subdued Consumer Purchasing Power - Retailers have encountered difficulties in maintaining sales amid restrained consumer spending. This is on the back of inflation which stood at 7.9% in June 2023, coupled by pressure on the Kenya Shilling, which has depreciated by 15.3% on a year-to-date basis against the dollar, adding to the 9.0% depreciation recorded in 2022, and,
- Oversupply of Space - There exists an oversupply of physical space, with approximately 3.3 mn SQFT in the NMA retail market, with the rest of the Kenyan retail market having an oversupply of approximately 2.1 mn SQFT, causing slowed uptake of retail spaces in the sector, and thereby leading developers to halt their plans awaiting the absorption of the existing spaces.
Section II: Kenya Retail Sector Performance Summary in 2023
Our research context delves into the performance of the retail market in the Nairobi Metropolitan Area (NMA) and key urban cities in Kenya. The Kenyan retail sector displayed a stable overall performance, with the average rental yield coming in at 7.5% in 2023, 0.7% points increase from 6.8% recorded in 2022. Notably, the average rent per SQFT increased by 7.1% to Kshs 130 in 2023 from Kshs 122 in 2022, owing to; i) an improved business environment in post COVID-19 era and post electioneering period that resulted to increased transaction volumes, ii) upward revision of rental charges in most community and neighbourhood malls in towns outside NMA driven by heightened demand from retailers expanding their businesses into newly developing economic regions of the country, and, iii) addition of high end malls that attracted higher rental rates such as the Business Bay Square and Broadwalk Mall in Nairobi, Greenwood Mall in Meru and Kilele Mall in Murang’a. Moreover, the average occupancy rate increased by 2.1% points, reaching 79.4% in 2023 compared to 77.3% in 2022. This increase was mainly driven by the rapid expansion of both local and foreign retailers, such as Simbisa brands, Carrefour, Naivas, and Quickmatt. These retailers tapped into newer market opportunities and occupied substantial spaces in the newly established malls, including Broadwalk and Meru Greenwood, among others. Additionally, the expansion of these retailers into spaces previously occupied by troubled retailers like Nakumatt and Tuskys, significantly improving the occupancy rates of these malls and contributing to the overall resilience of the retail market.
- Retail Sector Performance in Kenya Over Time
The Kenyan retail sector has remained stable over time, showing resilience in performance regarding rental yields, with the average rent per SQFT showing promising signs of rebounding to pre-COVID-19 levels of above Kshs 130 per SQFT. However, it is important to note that the sector has experienced a negative Compounded Annual Growth Rate (CAGR) of 2.4% over the past seven years, dropping to Kshs 130 per SQFT in 2023 from Kshs 155 in 2016. This decline can be attributed to the increased supply of retail spaces, leading landlords to offer rent discounts to attract and retain clients while also addressing the surplus space. The situation was exacerbated during the active 2-year period of the COVID-19 pandemic and the 2017 and 2022 electioneering periods. The average occupancy rate also declined by 3.5% points to 79.4% in 2022, from 82.9% that was recorded in 2016, mainly attributed to exit of local and foreign retailers in the market that had occupied large spaces for their businesses such as Nakumatt, Tuskys, Uchumi, The Game, Shoprite, Choppies and many more, and, ii) the addition of new malls into the market during the period consequently increasing the oversupply of the retail spaces in the sector and further weighed down the overall absorption rate.
The performance of the sector across the key cities is as summarized below;
All Values in Kshs Unless Stated Otherwise
|
Cytonn Report: Kenya’s Retail Performance Summary-2023 |
|||||||||
|
Item |
2016 |
2017 |
2018 |
2019 |
2020 |
2021 |
2022 |
2023 |
∆ Y/Y 2022/2023 |
|
Asking rents (Kshs/SQFT) |
155 |
141 |
132 |
118 |
115 |
118 |
122 |
130 |
7.1% |
|
Average Occupancy (%) |
82.9% |
80.2% |
86.0% |
77.3% |
76.6% |
78.4% |
77.3% |
79.4% |
2.1% points |
|
Average Rental Yields |
8.7% |
8.3% |
8.6% |
7.0% |
6.7% |
6.8% |
6.8% |
7.5% |
0.7% points |
Source: Cytonn Research
- Nairobi Metropolitan Area (NMA) Retail Market Performance
The NMA retail market recorded an average rental yield of 8.2% in 2023, 0.3% points higher than the 7.9% that was recorded in 2022. The performance was driven by; i) 0.9% increase in average rental charges to Kshs 177 per SQFT in 2023 from Kshs 175 per SQFT in 2022, and, ii) 1.8% points improvement in average occupancy rates which came in at 79.2% in 2023, from 77.4% in 2022.
- Performance by Nodes
Kilimani, Karen, and Westlands stood out as the best performing nodes, with average rental yields of 10.1%, 9.7%, and 9.1% respectively, surpassing other nodes. The exceptional performance of was attributed to the availability of high-quality retail spaces that command high rents, as well as the presence of quality infrastructure services in those areas. Conversely, Eastlands continued to register the least average rental yield of 6.0% due to; i) lower average rents of Kshs 128 per SQFT, as compared to the market average of Kshs 177 per SQFT, ii) poor quality infrastructure which is unsustainable for the retail spaces and hindering sufficient accessibility, iii) heavy presence of informal retail spaces that quickly adapt to market trends and service stations with value added amenities offering opportunities for better quality retail spaces, one-stop-shop approach, convenience and cheaper rates for price sensitive clients increasingly cause stiffer competition, and, iv) relatively lower demand shown by a low average occupancy rate of 75.6%, compared to the market average of 79.2%. Additionally, prime retail spaces in the satellite towns have exhibited the highest occupancy rate and rental yield attributed to population growth in the regions prompting retailers to extend their services beyond the city centre and tap opportunities in satellite towns. This shift of focus aims to bring convenience to residents in the nearest and most accessible way. This is also on the back of reduced rents by the retail space owners to attract more clients in the region amid increased demand for consumer goods, services and entertainment facilities.
The table below shows the submarket performance of nodes in the Nairobi Metropolitan Area (NMA):
All Values in Kshs Unless Stated Otherwise
|
Cytonn Report: Nairobi Metropolitan area (NMA) 2023 Retail Performance |
|||||||||
|
Area |
Rent (Kshs)/SQFT 2023 |
Occupancy % 2023 |
Rental Yield 2023 |
Rent Kshs/SQFT 2022 |
Occupancy 2022 |
Rental Yield 2022 |
∆ in Rental Rates |
∆ in Occupancy (% points) |
∆ in Rental Yield (% points) |
|
Kilimani |
190 |
84.7% |
10.1% |
187 |
83.8% |
9.8% |
2.0% |
0.9% |
0.3% |
|
Westlands |
216 |
77.6% |
9.1% |
214 |
75.7% |
8.7% |
1.0% |
1.9% |
0.4% |
|
Karen |
217 |
82.4% |
9.7% |
216 |
80.2% |
9.4% |
0.5% |
2.2% |
0.3% |
|
Kiambu road |
202 |
74.0% |
8.7% |
202 |
72.8% |
8.6% |
0.0% |
1.2% |
0.1% |
|
Ngong Road |
170 |
81.0% |
7.8% |
168 |
80.5% |
7.7% |
1.0% |
0.5% |
0.1% |
|
Mombasa road |
156 |
79.9% |
7.5% |
154 |
78.9% |
7.4% |
1.1% |
1.0% |
0.1% |
|
Thika Road |
165 |
80.7% |
7.5% |
165 |
78.7% |
7.3% |
0.0% |
2.0% |
0.2% |
|
Satellite towns |
138 |
78.8% |
6.8% |
134 |
72.2% |
6.2% |
2.5% |
6.6% |
0.6% |
|
Eastlands |
128 |
75.6% |
6.0% |
131 |
73.0% |
5.9% |
(2.8%) |
2.6% |
0.1% |
|
Average |
177 |
79.2% |
8.2% |
175 |
77.4% |
7.9% |
0.9% |
1.8% |
0.3% |
Source: Cytonn Research
- Performance by Class
The research aims to evaluate the performance of malls within each class and understand the factors contributing to their rental yields and occupancy rates. The analysis focuses on how rental charges, occupancy rates, and rental rates vary within each class compared to the overall market averages. In this research analysis, malls have been categorized into three distinct classes based on their lettable areas. The classifications are as follows:
- Regional Centers / Destination Malls: These malls have larger lettable areas, ranging from 400,000 to 800,000 square feet (SQFT), and typically house multiple anchor tenants. Notable examples include Sarit Centre, Two Rivers Mall, Garden City Mall, Business Bay Square, and Next Gen Mall,
- Community Centers: This category comprises the second largest malls, with lettable areas ranging from 125,001 to 400,000 SQFT, and they too can accommodate more than one anchor tenant. Examples include Thika Road Mall, Valley Arcade, Gateway Mall, the Village Market, and,
- Neighborhood Centers: The smallest of the three classes, these malls have lettable areas around 20,000 SQFT, allowing them to host only one anchor tenant. Examples include The Well, Ciata City Mall, and Unicity Mall, among others.
In terms of performance by class, destination malls emerged as the top performers, boasting an average rental yield of 11.5%. This exceptional performance can be attributed to their ability to command high rental charges, averaging at Kshs 284 per SQFT, which was 60.4% higher than the market average of Kshs 177 per SQFT. These malls often charge premium rents, primarily in United States Dollars (USD) currency, due to their offering of high-quality retail spaces and excellent facilities, along with the attractive presence of international retailers. As a result, they also enjoy higher footfall from shoppers. Moreover, they recorded the highest occupancy rates of 83.6% against the grand average 79.2% in the NMA due to their limited supply and increased demand by major local brands and multinational business conglomerate seeking to establish their presence in the region.
Community malls came in second recording an average rental yield of 8.4%, 0.2% points higher than the market average of 8.2%, with average occupancy rate and rental charges coming in at 81.2% and Kshs 178 per SQFT, respectively against a market average of 79.4% and Kshs 177 per SQFT, respectively as a result of an persistent improved demand for cheaper retail spaces compared to destination malls within similar regions. The increased demand for the spaces has been primarily driven by new tenants who were previously not considered as viable clients such as opticians, pharmacies, fashion designers, electrical and electronics home appliances brands, hospitals, financial institutions, fitness centers, beauty product brands, and many others. This diversified tenant mix has contributed to the sustained growth and popularity of community malls, solidifying their position as attractive options for both tenants and customers alike.
Neighborhood malls recorded the lowest average rental yields averaging at 7.2%, 1.0% points lower than the market average of 8.2%, attributed to lower average rental rates averaging Kshs 153 per SQFT compared to the market average of Kshs 177 per SQFT. Average occupancy rates came in at 76.2% against the market average of 79.4% as a result of a slowdown in demand for physical retail spaces in these malls.
The summary of performance by class is as shown below:
All Values in Kshs unless stated otherwise
|
Cytonn Report: Retail Market Performance in Nairobi by Class 2023 |
|||
|
Class |
Average of rent (Kshs) |
Average of occupancy rate |
Average of rental yields |
|
Destination |
284 |
83.6% |
11.5% |
|
Community |
178 |
81.2% |
8.4% |
|
Neighbourhood |
153 |
76.2% |
7.2% |
|
Grand Total |
177 |
79.2% |
8.2% |
- Retail Market Performance in Key Urban Cities in Kenya
Key urban cities in Kenya recorded increased average rental yields by 0.7% points to 7.5% in 2023 from 6.8% recorded in 2022 attributable to; i) increase in average occupancy rates by 2.2% points to 79.4% in 2023 from 77.3% in 2022, and, ii) 7.1% growth in average rental rates to Kshs 130 per SQFT in 2023 from Kshs 122 per SQFT in 2022.
Nairobi was the best performing region with average rental yields coming in at 8.2% in 2023, 0.7% points higher than the market average of 7.5%, driven by; i) the increased average rental charges which came in at Kshs 177 per SQFT from Kshs 173 per SQFT, and, ii) increased demand for high quality retail spaces thus increasing the average occupancy rates to 79.2% in 2023 from 75.9% recorded in 2022.
Eldoret recorded the least average rental yields coming in at 6.7% against the market average of 7.5% in 2023 and 0.1% points increase from 6.6% recorded in 2022, due to the unchanged rental rates which remained at Kshs 132 per SQFT and a very marginal increase in average occupancy rates by 0.1% points to 86.2% in 2023 from 86.1% recorded in 2022.
Mount Kenya was the most improved region, attributable to the significant improvement in occupancy rates and rental charges of the newly existing malls in the region such as the Meru Greenwood mall, Kilele mall among others. This saw an increase in the average rental yield by 2.5% points to 7.8% in 2023, from 5.3% recorded in 2022.
The performance of the key urban centers in Kenya is as summarized below:
All values in Kshs unless stated otherwise
|
Cytonn Report: Summary of Retail Performance in Key Urban Cities in Kenya 2022/2023 |
|||||||||
|
Region |
Rent 2023 |
Occupancy Rate 2023 |
Rental yield 2023 |
Rent 2022 |
Occupancy Rate 2022 |
Rental yield 2022 |
∆Y/Y in Rental Rates |
∆Y/Y in Occupancy Rate |
∆Y/Y in Rental Yield |
|
Nairobi |
177 |
79.2% |
8.2% |
173 |
75.9% |
7.8% |
2.3% |
3.3% |
0.4% |
|
Nakuru |
79 |
80.5% |
7.9% |
73 |
81.3% |
7.4% |
8.6% |
(0.8%) |
0.5% |
|
Mombasa |
127 |
82.6% |
7.8% |
110 |
84.0% |
7.0% |
15.5% |
(1.4%) |
0.8% |
|
Kisumu |
107 |
79.7% |
7.0% |
108 |
79.7% |
7.0% |
(0.4%) |
0.0% |
0.0% |
|
Eldoret |
132 |
86.2% |
6.7% |
132 |
86.1% |
6.6% |
0.0% |
0.1% |
0.1% |
|
Mount Kenya |
161 |
68.3% |
7.8% |
138 |
56.7% |
5.3% |
16.3% |
11.7% |
2.4% |
|
Average |
130 |
79.4% |
7.5% |
122 |
77.3% |
6.8% |
7.1% |
2.2% |
0.7% |
Source: Cytonn Research
Section III: Retail Space Demand Analysis
To explore investment opportunities in the retail market and bridge existing gaps, our research focused on assessing the demand for retail space in different urban regions across Kenya. The main objective is to inform developers about both undersupplied and oversupplied areas. To achieve this, we conducted a comprehensive analysis, considering the current retail spaces available and those in the development pipeline. This data was then compared to the existing demand, taking into account the population of each region.
By employing this approach, we were able to calculate crucial metrics such as the net space uptake per person in square meters, the size of the shopping population, and the current retail market occupancy rates. These metrics played a key role in identifying regions with potential investment opportunities in the retail sector. To further enhance our analysis, we used Kilimani's average uptake as a benchmark to estimate the net space uptake for the various regions under consideration. This enabled us to make informed comparisons and draw valuable insights into the retail market dynamics in different parts of Kenya:
- Total Demand/Gross Uptake: This metric quantifies the overall retail space required by the population in the region. It is calculated by multiplying the net space uptake per person by the total shopping population.
- Net Demand/Uptake: This metric measures the gross uptake of retail space, excluding the occupancy rates of malls in the region. It is derived by multiplying the gross uptake by the respective market occupancy rates.
- Supply: The supply metric accounts for the total existing malls and those in the pipeline in the region. To assess the market's condition and identify potential gaps, we calculate the over/undersupply by subtracting the supply from the demand or net uptake.
Furthermore, our analysis is based on certain key assumptions:
- Number of persons per household: We assume an average household size of 3.6 in urban areas, as per data from the Kenya Population and Housing Census 2019.
- Percentage of shopping population: We consider the shopping population to include individuals aged 14 years and above.
(If the figure is positive, then the market has an undersupply i.e, demand is more than supply and if it is a negative figure then the market has an oversupply, i.e. supply is more than demand).
The retail space demand across key regions in Kenya is as shown below;
|
Cytonn Report: Demand Analysis 2023 |
||||||||||
|
Region |
2019 |
Urban Population |
Urban population 2019 |
Shopping People |
Net Space Uptake per pax in SQM (Based on Uptake per pax in Kilimani) |
Occupancy (2 year Average) |
Gross Space Uptake per Pax SQFT (Required Space Kilimani) |
Net Uptake SQFT (Space Required) for each market |
Current supply (SQFT) |
GAP at current market performance (SQFT) |
|
Kiambu |
2.1 |
60% |
1.3 |
0.7 |
1.9 |
72.5% |
2.1 |
1.5 |
0.9 |
0.6 |
|
Mt Kenya |
2.8 |
38% |
1.1 |
0.6 |
1.5 |
68.3% |
1.7 |
1.2 |
0.4 |
0.5 |
|
Mombasa |
1.3 |
100% |
1.3 |
0.8 |
1.9 |
82.6% |
2.1 |
1.8 |
1.4 |
0.2 |
|
Kajiado |
1.1 |
41% |
0.5 |
0.3 |
0.7 |
78.5% |
0.7 |
0.6 |
0.3 |
0.2 |
|
Machakos |
1.3 |
52% |
0.7 |
0.4 |
1.0 |
75.8% |
1.1 |
0.8 |
0.3 |
0.1 |
|
Nakuru |
2.2 |
45% |
1.0 |
0.6 |
1.4 |
80.5% |
1.6 |
1.3 |
0.6 |
(0.1) |
|
Uasin Gishu |
1.3 |
44% |
0.6 |
0.3 |
0.8 |
86.2% |
0.9 |
0.8 |
0.4 |
(0.1) |
|
Kisumu |
1.2 |
50% |
0.6 |
0.3 |
0.9 |
79.7% |
1.0 |
0.8 |
1.0 |
(0.2) |
|
Nairobi |
4.6 |
100% |
4.6 |
2.7 |
6.7 |
80.3% |
7.4 |
5.9 |
8.3 |
(3.3) |
|
Total |
18.0 |
11.6 |
6.7 |
16.8 |
79.4% |
18.6 |
14.6 |
12.8 |
(2.1) |
|
|
Based on the analysis, Kenya retail sector and the NMA realized a 4.5% decline and 8.7% increase in the market gap to 2.1 mn and 3.3 mn per SQFT when compared to the 2.2 mn and 3.0 mn SQFT recorded in 2022. This is attributed to increase in demand for existing retail spaces and reduced growth in number of malls in the pipeline in other towns and significant increase in number of malls and those in the pipeline in NMA. |
||||||||||
Source: Cytonn Research
Based on our demand analysis, Nairobi, Kisumu, Uasin Gishu and Nakuru are the most oversupplied retail markets by 3.3 mn SQFT, 0.2 mn SQFT, 0.95 mn SQFT, and 0.94 mn SQFT, respectively, with average occupancy rates of 80.3%, 79.7%, 86.2% and 80.5%, respectively.
Section IV: Retail Space Investment Opportunity
We analyzed the various urban regions in Kenya in order to determine the investment opportunity within the Real Estate retail market of the country. This was based on three metrics which include the rental yields, the retail spaces required, and the household purchasing power, with allocations of 30.0%, 30.0% and 40.0% weights, respectively:
- Rental Yield- This is a measure of the value of the profit that an investor generates from an investment as a percentage of its value hence the higher the better. The weighted score for rental yields was 30.0%, and the area with the highest yield was ranked with the highest score of 9 whereas the area with lower yields was given the lowest score of 1,
- Household Expenditure - This measures the consumption expenditure of the target population hence the higher the better as well. The weighted score for this was at 40.0% and the area with the highest expenditure was given the highest score at 9, and the lowest given the lowest score at 1, and,
- Retail Space Demand - This measures the amount of retail space required by a particular region hence the higher the better as it increases occupancy rates of the available developments. 30.0% was the allocated weight for this and the area with the highest demand was given the highest score at 9 as well whilst the area with the lowest demand was allocated the lowest score at 1.
Based on our analysis, Mombasa, Nairobi, Mount Kenya, Kiambu, Nakuru, and, Kisumu, offer the best investment opportunities to retail mall developers having achieved a higher weighted score of 7.4, 6.6, 6.2, 5.8, 5.2, and, 4.2, respectively.
The table below shows the retail space investment opportunity in Kenya;
|
Cytonn Report: Retail Space Opportunity 2023 |
||||||||||
|
|
2022 |
2023 |
||||||||
|
Region/Weight
|
Retail Yield Score |
Retail Space Score |
Household expenditure (per adult) score |
|
|
Retail Yield Score |
Retail Space Score |
Household expenditure (per adult) score |
|
|
|
30% |
30% |
40% |
Weighted score |
2022 Rank |
30% |
30% |
40% |
Weighted score |
2023 Rank |
|
|
Mombasa |
5 |
7 |
8 |
6.8 |
1 |
7 |
7 |
8 |
7.4 |
1 |
|
Nairobi |
9 |
1 |
9 |
6.6 |
2 |
9 |
1 |
9 |
6.6 |
2 |
|
Mt Kenya |
1 |
9 |
5 |
5.0 |
6 |
6 |
8 |
5 |
6.2 |
3 |
|
Kiambu |
1 |
8 |
7 |
5.5 |
3 |
1 |
9 |
7 |
5.8 |
4 |
|
Nakuru |
8 |
4 |
4 |
5.2 |
4 |
8 |
4 |
4 |
5.2 |
5 |
|
Kisumu |
7 |
2 |
6 |
5.1 |
5 |
4 |
2 |
6 |
4.2 |
6 |
|
Machakos |
5 |
5 |
3 |
4.2 |
7 |
5 |
5 |
3 |
4.2 |
6 |
|
Kajiado |
3 |
6 |
2 |
3.5 |
8 |
2 |
6 |
2 |
3.2 |
8 |
|
Uasin Gishu |
4 |
3 |
1 |
2.5 |
9 |
3 |
3 |
1 |
2.2 |
9 |
Source: Cytonn Research
Section V: Retail Sector Outlook
The table presents a summary of metrics have a possible impact the retail sector, covering aspects such as retail space supply, retail market performance, retail space demand, and concludes with the market opportunity/outlook for the sector;
|
Cytonn Report: Kenya Retail Sector Outlook 2023 |
||||
|
Sentiment 2022 |
Sentiment 2023 |
2022 Outlook |
2023 Outlook |
|
|
Retail Space Supply |
Nairobi, Kisumu, Uasin Gishu and Nakuru remain the most oversupplied retail markets by 3.0 mn SQFT, 0.2 mn SQFT, 0.12 mn SQFT, and 0.1 mn SQFT, respectively, whereas areas such as Kiambu and Mt Kenya regions are both under supplied by 0.5 mn SQFT. We expect the supply to further increase particularly in Nairobi with the addition of malls such as Ojijo Properties |
Nairobi, Kisumu, Uasin Gishu and Nakuru still remain the most oversupplied retail markets by 3.3 mn SQFT, 0.2 mn SQFT, 0.1 mn SQFT, and 0.1 mn SQFT, respectively, whereas areas such as Kiambu, Mt Kenya, Mombasa, and Kajiado regions are under supplied by 0.6 mn, 0.5 mn, 0.2 mn, 0.2 mn, and 0.1 mn SQFT respectively. Going forward, we expect to see investors and developers shifting their focus to these regions
Notably, major retail developments delivered into the market in 2023 include, Business Bay Square (BBS) mall in Eastleigh, delivering approximately 31,000 SQM in gross area. We expect the supply to further increase particularly within the NMA, with the addition of an estimated 42,977 SQM through malls such Global Trade Center (GTC), Crystal Rivers in Machakos, The Cove in Lavington, Lana Plaza in Kileleshwa, Park Place Avenue in Parklands and Beacon mall in Upperhill. Other notable developments expected to be delivered into the market outside of the NMA include Promenade mall in Nyali and Nyali Bazaar in Mombasa
However notwithstanding, we anticipate a decline in the supply of malls in Kenya going forward as emphasis shifts towards convenience centers which are rapidly growing in popularity, owing to the convenience they offer. This is as they are situated closer to residential neighborhoods |
Positive |
Neutral |
|
Retail Space Demand |
We expect the aggressive expansion by local and international retailers to cushion the overall demand and uptake for spaces in the sector. However, factors such as e-commerce which is still being adopted by some retailers, is expected to weigh down the optimum uptake of physical retail space in the market |
We expect the demand for retail space to be fueled by the continued aggressive expansion drive by both local and international retailers such as Naivas, Quickmart, Chandarana and Carrefour. This will assist cushion the overall demand and bolster uptake of spaces in the sector. However, factors such as e-commerce stifling the demand for physical retail space, and the existing oversupply of retail space in the NMA and Kenyan retail sectors (excluding NMA) at approximately 3.3 mn and 2.1 mn SQFT respectively, are expected to weigh down the optimum uptake of physical retail space in the market |
Neutral |
Neutral |
|
Retail Market Performance |
Kenyan retail sector performance on overall remained stable, with the average rental yield coming in at 6.8% in 2022, unchanged from what was recorded in 2021. However, the average rent per SQFT increased by 3.5% to Kshs 122, whereas the average occupancy rate declined slightly by 1.1% points to 77.3% Nairobi Metropolitan Area was the best performing region with an average rental yield of 7.8% in 2022, respectively in 2022
We expect to see improved performance driven by increasing foreign investor confidence in the Kenyan retail market, coupled with the aggressive expansion by local and international retailers such as Naivas, Simbisa Brands, Eat’N’Go, and, Quickmart among many others. However, factors such as online shopping strategy and oversupply of spaces continue to be major challenges hindering the optimum performance of the sector |
Kenyan retail sector performance on overall improved, with the average rental yield coming in at 7.5% in 2023, 0.7% points increase from 6.8% recorded in 2022. Similarly, the average rent per SQFT increased by 7.1% to Kshs 130 from Kshs 122 recorded in 2022, whereas the average occupancy rate also increased by 2.1% points to 79.4% from 77.3% in 2022. Nairobi Metropolitan Area was the best performing region with an average rental yield of 8.2% in 2022, respectively in 2022
We expect to see increased market activity supported by; i) ongoing expansion drive by local and international retailers such as Naivas, Quickmart, Carrefour in sustained efforts to establish market dominance, and capitalize on the low formal retail penetration in Kenya, ii) growth and continued entry of multinational retailers in the country such as Simbisa brands, ChicKing, Java House, Chicken Cottage among others, and, iii) increasing foreign investors’ confidence in the Kenyan retail market |
Neutral |
Neutral |
|
Our outlook for the Kenya retail market remains NEUTRAL supported by factors such as i) growth and expansion efforts by both local and international retailers, ii) increased infrastructure development enhancing accessibility in satellite towns, and iii) positive demographics supporting demand for space. However; i) the continuous oversupply of retail space in the NMA and Kenyan retail sectors (excluding NMA) at approximately 3.3 mn and 2.1 mn SQFT respectively, ii) market exits by major retailers such as Game Stores, Shoprite, Choppies, and iii) the rapid growth of e-commerce in the retail landscape, further projected to grow at a 6.7% CAGR (2023-2027) will hinder the optimum performance of the sector by limiting demand and uptake of spaces |
||||
For the full Kenya Retail Report 2023, click here
Disclaimer: The views expressed in this publication are those of the writers where particulars are not warranted. This publication, which is in compliance with Section 2 of the Capital Markets Authority Act Cap 485A, is meant for general information only and is not a warranty, representation, advice or solicitation of any nature. Readers are advised in all circumstances to seek the advice of a registered investment advisor.

- Talk to us
- Kenya
- P.O Box 20695 - 00200, Nairobi, Kenya
- Cell +254709101200
- Tel +254709101200
- WhatsApp +254741676635
- United States
- +254709101200
- DOWNLOAD OUR APP
-


- Kenya
- 8th Floor, Pinetree Plaza, Kaburu Drive, Ngong Road, Nairobi, Kenya
- USA
- Suite 1150, 1775 Eye Street NW, USA, Washington DC 20006, USA
- Investments
- High Yield
- Private Equity
- Real Estate
- Real Estate
- RiverRun Estates
- Cytonn Towers
- The Ridge
- Taraji Heights
- The Alma