Apr 13, 2021
For detached units, top 3 markets were Rosslyn, Ruiru and Kitisuru, and for apartments, the top 3 markets were Westlands, South C, and Ruaka.
During Q1’2021, the residential sector recorded increased activities supported by; i) increased transactional volumes following improved liquidity with gradual reopening of the economy, ii) improved access to mortgage loans thus encouraging uptake of units, and, iii) continued focus on the affordable housing agenda aimed at delivering affordable homes for Kenyans.
In terms of performance, the sector recorded improvement, with y/y average total returns to investors coming in at 5.1%, up from 4.7% recorded in FY’2020. Prices in all segments saw an uptick with an overall y/y average price appreciation of 0.5% in the residential market while the y/y average rental yield recorded a 0.2% points decline to 4.7% from 4.9% recorded in FY’2020 attributed to reduced rental rates in the wake of a tough operating environment.
The chart below shows performance of average rental yields in the last five years;
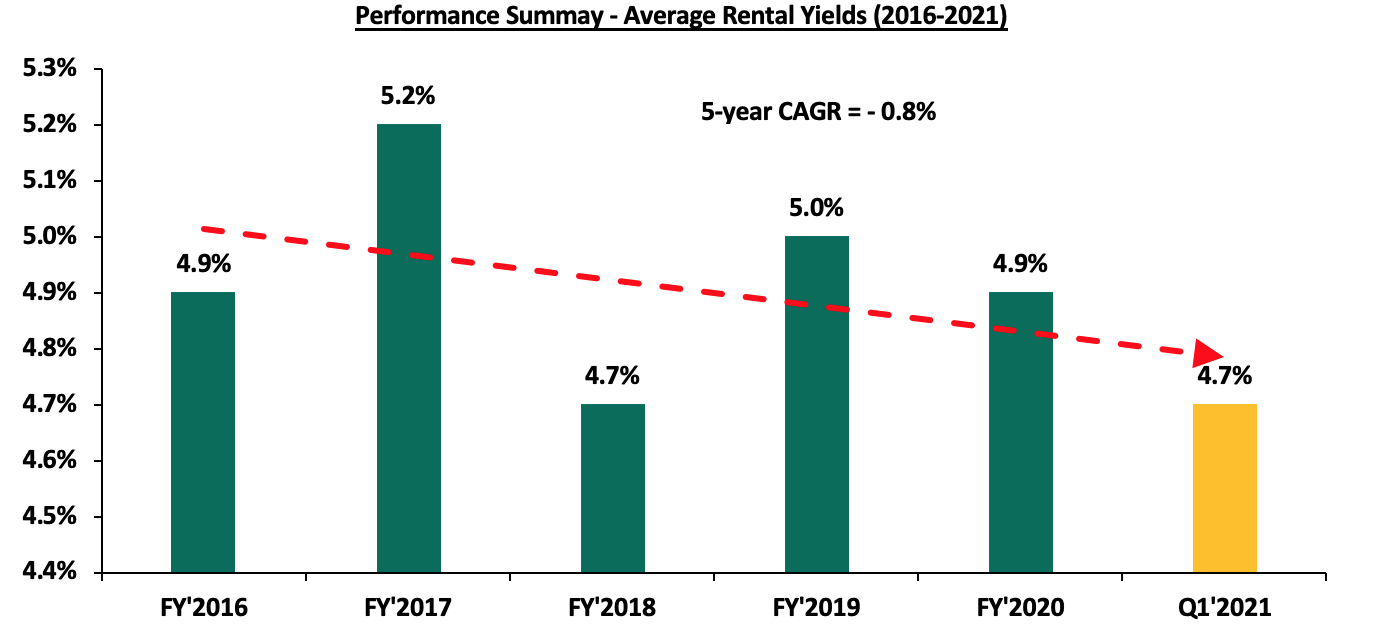
Source: Cytonn Research
A. Detached Units Performance
Detached units recorded an improvement in performance in Q1’2021 compared to FY’2020 with y/y average returns to investors coming in at 4.8%, a 0.6% points increase from 4.2% recorded in FY’2020. This was attributed to gradual reopening of the economy, that saw transactional volumes pick amid a tough economic environment. Average y/y price appreciation in the detached market saw a 0.7% points increase from 0.1% in FY’2020 to 0.8% in Q1’2021 showing their resilience to economic slowdowns amid a pandemic.
|
Detached Units Performance Summary Q1’2021 |
|||||||||
|
Segment |
Average Rental Yield Q1'2021 |
Average Y/Y Price Appreciation Q1’2021 |
Average Y/Y Total Returns Q1’2021 |
Average Rental Yield FY'2020 |
Average Y/Y Price Appreciation FY'2020 |
Average Y/Y Total Returns FY'2020 |
q/q Change in Rental Yield (% Points) |
q/q Change in Price Appreciation (% Points) |
q/q Change in Total Returns (% Points) |
|
Detached Units |
|||||||||
|
High End |
3.6% |
1.0% |
4.6% |
3.8% |
0.6% |
4.4% |
(0.2%) |
0.4% |
0.2% |
|
Upper Mid-End |
4.5% |
0.5% |
5.0% |
4.5% |
(0.3%) |
4.2% |
0.0% |
0.8% |
0.8% |
|
Satellite Towns |
4.1% |
0.7% |
4.8% |
3.9% |
0.1% |
4.0% |
0.2% |
0.6% |
0.8 % |
|
Average |
4. 1% |
0.8% |
4.8% |
4.1% |
0.1% |
4.2% |
0.0% |
0.7% |
0.6% |
The upper mid-end segment was the best performing segment with a y/y average total return of 5.0%, with Runda Mumwe and Ridgeways offering the highest y/y average total returns at 5.7% and 5.3%, respectively. The best performing node was Rosslyn recording the highest y/y average returns at 6.7% attributed to the relatively high rental yield averaging 4.3% in Q1’2020, 0.2% points higher than the detached market average which stood at 4.1%. Ruiru and Kitisuru came in second and third place respectively, at 6.3% and 5.9%, respectively, while Rongai offered the lowest returns at 2.0%.
(All Values in Kshs unless stated otherwise)
|
Detached Units Performance Q1'2021 |
||||||||
|
Area |
Average Price per SQM Q1'2021 |
Average Rent per SQM Q1'2021 |
Average Occupancy Q1'2021 |
Average Uptake Q1'2021 |
Average Annual Uptake Q1'2021 |
Average Rental Yield Q1'2021 |
Average Y/Y Price Appreciation Q1'2021 |
Average Y/Y Total Returns Q1'2021 |
|
High-End |
||||||||
|
Rosslyn |
177,615 |
744 |
84.7% |
97.1% |
12.5% |
4.3% |
2.4% |
6.7% |
|
Kitisuru |
231,719 |
776 |
89.1% |
88.1% |
14.7% |
3.9% |
2.0% |
5.9% |
|
Lower Kabete |
154,600 |
521 |
75.5% |
72.7% |
14.3% |
2.3% |
2.3% |
4.6% |
|
Karen |
189,301 |
730 |
80.3% |
89.2% |
14.3% |
3.7% |
0.0% |
3.7% |
|
Runda |
235,567 |
824 |
88.1% |
93.4% |
10.3% |
3.8% |
(1.6%) |
2.2% |
|
Average |
197,760 |
719 |
83.6% |
88.1% |
13.2% |
3.6% |
1.0% |
4.6% |
|
Upper Mid-End |
||||||||
|
Runda Mumwe |
152,759 |
639 |
81.0% |
82.1% |
14.2% |
3.7% |
2.0% |
5.7% |
|
Ridgeways |
149,503 |
775 |
82.2% |
84.5% |
13.0% |
5.1% |
0.2% |
5.3% |
|
Langata |
161,305 |
566 |
78.7% |
94.8% |
10.5% |
3.8% |
1.2% |
5.0% |
|
Redhill & Sigona |
97,432 |
480 |
74.8% |
71.5% |
12.0% |
4.8% |
0.2% |
5.0% |
|
South B/C |
125,025 |
537 |
93.3% |
69.1% |
11.1% |
4.9% |
(0.8%) |
4.1% |
|
Average |
137,205 |
599 |
82.0% |
80.4% |
12.2% |
4.5% |
0.5% |
5.0% |
|
Lower Mid-End |
||||||||
|
Ruiru |
80,003 |
319 |
72.9% |
84.2% |
24.9% |
4.2% |
2.1% |
6.3% |
|
Juja |
61,881 |
328 |
74.2% |
89.0% |
14.1% |
4.7% |
1.0% |
5.7% |
|
Syokimau/Mlolongo |
73,976 |
350 |
88.3% |
72.0% |
13.9% |
4.9% |
0.3% |
5.2% |
|
Kitengela |
70,719 |
306 |
91.5% |
82.9% |
14.2% |
4.6% |
0.6% |
5.2% |
|
Athi River |
83,154 |
309 |
82.3% |
89.1% |
14.8% |
3.7% |
0.7% |
4.4% |
|
Rongai |
82,405 |
233 |
65.4% |
73.0% |
10.8% |
2.5% |
(0.5%) |
2.0% |
|
Average |
75,356 |
307 |
79.1% |
81.7% |
15.4% |
4.1% |
0.7% |
4.8% |
Source: Cytonn Research 2021
B. Apartments Performance
Apartments registered slight improvement in Q1’2021 with average total returns recording a 0.1% points marginal increase to 5.3% y/y from of 5.2% y/y in FY’2020. Satellite towns continued to be the best performing segment with an average total returns stagnating at 5.5% attributed to their relatively high rental yield averaging 5.4%.
|
Apartments Performance Summary Q1’2021 |
|||||||||
|
Segment |
Average Rental Yield Q1'2021 |
Average Y/Y Price Appreciation Q1’2021 |
Average Y/Y Total Returns Q1’2021 |
Average Rental Yield FY'2020 |
Average Y/Y Price Appreciation FY'2020 |
Average Y/Y Total Returns FY'2020 |
q/q Change in Rental Yield (% Points) |
q/q Change in Price Appreciation (% Points) |
q/q Change in Total Returns (% Points) |
|
Apartments |
|||||||||
|
Upper Mid-End |
5.2% |
0.1% |
5.3% |
5.2% |
0.0% |
5.2% |
0.0% |
0.1% |
0.1% |
|
Lower Mid-End |
5.0% |
0.2% |
5.2% |
5.8% |
(0.9%) |
4.9% |
(0.8%) |
1.1% |
0.3% |
|
Satellite Towns |
5.4% |
0.1% |
5. 5% |
6.0% |
(0.5%) |
5.5% |
(0.6)% |
0.6% |
0.0% |
|
Average |
5.2% |
0.1% |
5.3% |
5.7% |
(0.5%) |
5.2% |
(0.5%) |
0.6% |
0.1% |
The best performing node in terms of returns was Westlands with a y/y average total return of 6.8% attributed to house prices recording a 1.6% y/y average price appreciation, which was the highest in the apartments market. South C and Ruaka came in second and third place respectively, recording average y/y total returns of 6.5% and 6.2% respectively, attributed to their relatively high rental yields at 6.4% and 5.4%, respectively. In general, apartment prices in all segments recorded an uptick attributed to the slight increase in demand amid reduced prices that wooed buyers into purchasing units.
(All Values in Kshs unless stated otherwise)
|
Apartments Performance Q1’2021 |
||||||||
|
Area |
Average Price Per SQM Q1'2021 |
Average Rent per SQM Q1'2021 |
Average Occupancy Q1'2021 |
Average Uptake Q1'2021 |
Average Annual Uptake Q1'2021 |
Average Rental Yield Q1'2021 |
Average Y/Y Price Appreciation Q1'2021 |
Y/Y Average Total Returns Q1'2021 |
|
Upper Mid-End |
||||||||
|
Westlands |
146,032 |
783 |
78.5% |
83.0% |
18.7% |
5.2% |
1.6% |
6.8% |
|
Parklands |
117,851 |
730 |
83.7% |
78.3% |
14.2% |
5.8% |
0.1% |
5.9% |
|
Kilimani |
104,470 |
709 |
88.9% |
90.5% |
23.5% |
5.8% |
(0.1%) |
5.7% |
|
Loresho |
120,877 |
564 |
89.2% |
80.0% |
9.4% |
5.0% |
0.3% |
5.3% |
|
Upperhill |
130,608 |
710 |
77.0% |
78.3% |
10.9% |
4.2% |
(0.1%) |
4.1% |
|
Kileleshwa |
124,714 |
625 |
85.2% |
76.5% |
14.7% |
5.1% |
(1.6%) |
3.5% |
|
Average |
124,092 |
687 |
83.8% |
81.1% |
15.2% |
5.2% |
0.1% |
5.3% |
|
Lower Mid-End: Suburbs |
||||||||
|
South C |
114,104 |
675 |
96.8% |
69.8% |
14.2% |
6.4% |
0.1% |
6.5% |
|
Waiyaki Way |
87,624 |
498 |
79.0% |
76.7% |
21.8% |
5.2% |
0.6% |
5.8% |
|
South B |
103,763 |
445 |
70.9% |
71.2% |
15.2% |
4.0% |
1.1% |
5.1% |
|
Kahawa West |
73,794 |
365 |
85.3% |
77.5% |
14.3% |
5.4% |
(0.5%) |
4.9% |
|
Langata |
114,460 |
499 |
84.0% |
82.4% |
13.3% |
4.2% |
(0.4%) |
3.8% |
|
Average |
98,749 |
496 |
83.2% |
75.5% |
15.8% |
5.0% |
0.2% |
5.2% |
|
Lower Mid-End: Satellite Towns |
||||||||
|
Ruaka |
100,757 |
494 |
66.4% |
74.0% |
18.2% |
5.4% |
0.8% |
6.2% |
|
Thindigua |
107,336 |
543 |
77.3% |
73.0% |
12.1% |
4.7% |
1.3% |
6.0% |
|
Rongai |
60,908 |
339 |
90.2% |
94.2% |
28.6% |
6.1% |
(0.1%) |
6.0% |
|
Ruiru |
89,888 |
510 |
66.4% |
63.9% |
17.2% |
4.5% |
1.1% |
5.6% |
|
Ngong |
58,015 |
306 |
86.4% |
70.7% |
11.4% |
5.4% |
0.1% |
5.5% |
|
Kikuyu |
81,115 |
483 |
85.8% |
96.9% |
22.0% |
6.4% |
(1.2%) |
5.2% |
|
Athi River |
58,400 |
290 |
91.2% |
91.4% |
12.8% |
5.5% |
(1.8%) |
3.7% |
|
Average |
79,488 |
424 |
80.5% |
80.6% |
17.5% |
5.4% |
0.1% |
5.5% |
Cytonn Research 2021
Our outlook on the residential sector is NEUTRAL as we expect total returns to investors to improve following increased market activity. However, we expect reduced rental rates and house prices to continue affecting the rental yields and capital appreciation of properties hence a slowdown residential sector performance. The investment opportunity for detached units lies in submarkets such as Rosslyn, Kitisuru, Runda Mumwe, and Ruiru while for apartments it lies in areas such as Westlands, South C, Ruaka and Thindigua which continued to post high returns.
For more information, please see our Cytonn Q1’2021 Markets Review.

- Talk to us
- Kenya
- P.O Box 20695 - 00200, Nairobi, Kenya
- Cell +254709101200
- Tel +254709101200
- WhatsApp +254741676635
- United States
- +254709101200
- DOWNLOAD OUR APP
-


- Kenya
- 8th Floor, Pinetree Plaza, Kaburu Drive, Ngong Road, Nairobi, Kenya
- USA
- Suite 1150, 1775 Eye Street NW, USA, Washington DC 20006, USA
- Investments
- High Yield
- Private Equity
- Real Estate
- Real Estate
- RiverRun Estates
- Cytonn Towers
- The Ridge
- Taraji Heights
- The Alma