Cytonn Q1’2021 Markets Review
By Cytonn Research Team, Apr 4, 2021
Executive Summary
Global Markets Review
Most global institutions are projecting a much higher growth in 2021 than the initial numbers with the United Nations having upgraded their numbers to 4.7% from 4.0% in their October 2020 release. The key drivers of growth are the large stimulus policies especially in the US and the widespread vaccination programs currently going. There are still significant downside risks due to the uneven distribution of the Vaccines, re-emergence of more infectious variants, the low fiscal space to play with by some countries due to the high debt levels and the increase in the poverty levels in some countries;
Sub-Saharan Africa Regional Review
According to the World Bank’s Global Economic Prospects, output in Sub-Saharan Africa contracted by an estimated 3.7% in 2020, the deepest contraction on record attributable to the COVID-19 pandemic and associated lockdown measures disrupted activity through multiple channels. The region is however forecasted to see a modest recovery of 3.4% GDP growth in 2021 which will be heavily dependent on the relaxation of lockdown constraints to aid in flow of goods and services, careful handling of the Covid-19 infection cases and an improvement in international trade and commodity markets;
Kenya Macroeconomic Review
After registering an overall expected GDP growth rate of 0.6% in 2020, the Kenyan economy is projected to register a GDP growth of 7.0% in 2021 according to the Treasury. The country saw their ratings revised downwards by Standard & Poor’s, a US based ratings agency, 'B' from 'B+’ while Fitch Rating affirmed Kenya's Long-Term Foreign-Currency Issuer Default Rating (IDR) at 'B+' with a Negative Outlook. The key concerns are the high debt levels and the fact that the COVID-19 pandemic has made it more difficult to achieve Fiscal Consolidations. There have been positives in the Stanbic Purchasing Managers Index averaging 52.3 in the first two months an indication that the business community is more upbeat but we could see this decline in the coming months with the reintroduction of new movement restrictions. The average inflation rate for Q1’2021 declined to 5.8%, compared to 6.1% in Q1’2020 this is despite the sharp increase we have seen on the oil prices that increased by 22.8% in the quarter;
Fixed Income
During the first quarter of 2021, T-bills were undersubscribed, with the overall subscription rate coming in at 94.1%, up from 84.7% in Q4’2020. The undersubscription was partly attributable to lower liquidity in the market during the quarter and the increased demand for money by the government. The average interbank rate declined to 5.4%, from 6.0% in Q4’2020, supported by government payments and debt maturities. The rates on the on the 91-day, 182-day and 364 –day Treasury bills increased to end the quarter at 7.1%,7.9% and 9.3% from 6.9%,7.4% and 8.3% respectively, in Dec 2020. The yield curve shifted upwards with the FTSE bond index having a return of (1.0%) for the first quarter;
During the week, T-bills remained undersubscribed, with the overall subscription rate coming in at 29.9%, a decline from 82.9% subscription recorded last week, partly attributable to the lower liquidity in the market and renewed fears by investors as they adopt a wait and see attitude, after the new government restrictions following a spike in the number of COVID-19 infections in the country in recent weeks. The subscription rate for the 91-day and 182-day papers declined to 50.5% and 7.6%, from 82.6% and 30.7%, respectively. The yields on the 364-day and 182-day papers rose by 4.9 bps and 2.0 bps to 9.3% and 7.9%, respectively, while the rate on the 91-day paper declined by 0.2 bps to 7.1%. The government continued to reject expensive bids by accepting Kshs 7.16 bn of the Kshs 7.19 bn bids received, translating to an acceptance rate of 99.6%;
Equities
During Q1’2021, the equities market recorded a mixed performance, with NASI and NSE 25 gaining by 4.3% and 3.4%, respectively while NSE 20 declined by 1.2%, taking their YTD performance as at the end of March to gains of 4.3% and 3.4% for NASI and NSE 25, respectively while NSE 20 declined by 1.2%. The equities market performance during the quarter was driven by gains recorded by large cap stocks such as BAT Kenya, KCB Group, Safaricom and Cooperative Bank of 31.6%, 8.4%, 5.8% and 5.6%, respectively. The gains were however weighed down by losses recorded by stocks such as Diamond Trust Bank (DTB-K), ABSA Bank and NCBA Group of 16.3%, 8.7% and 6.0%, respectively. Additionally, during the week, Equity Group, NCBA Group, I&M Holdings and HF Group released their FY’2020 financial results, indicating profit declines of 10.9%, 41.7%, 21.9%, and 1,443.7%, respectively;
Real Estate
During the Q1’2021, the real estate sector recorded moderate activities with the residential sector recording an improvement in performance with average y/y total returns to investors coming in at 5.1%, up from 4.7% recorded in FY’2020. The retail sector performance in Q1’2020 recorded a 0.1%-point decline to 7.4% from 7.5% recorded in FY’2020. Commercial office sector registered a 0.2% and 1.4% points decline in the average rental yields and occupancy rates to 6.8% and 76.3% in Q1’2021, from 7.0% and 77.7%, respectively in FY’2020. The land sector however remained resilient recording an average annualized capital appreciation of 2.8%, indicating that people consider land as a good investment asset in the long run despite the pandemic.
- Weekly Rates:
- Cytonn Money Market Fund closed the week at a yield of 10.59%. To invest, just dial *809#;
- Cytonn High Yield Fund closed the week at a yield of 14.19% p.a. To invest, email us at sales@cytonn.com and to withdraw the interest you just dial *809#;
- Solomon Kariuki, Assistant Investments and Research Analyst, Cytonn Investments was interviewed by Kameme TV as they discussed the issues surrounding the IMF loan to the government. Watch Solomon here
- For an exclusive tour of Cytonn’s real estate developments, visit: Sharp Investor's Tour and for more information, email us at sales@cytonn.com;
- We continue to offer Wealth Management Training daily, from 9:00 am to 11:00 am, through our Cytonn Foundation. The training aims to grow financial literacy among the general public. To register for any of our Wealth Management Training, click here;
- If interested in our Private Wealth Management Training for your employees or investment group, please get in touch with us through wmt@cytonn.com;
- We have 10 investment-ready projects, offering attractive development and buyer targeted returns. See further details here: Summary of Investment-ready Projects;
- For recent news about the company, see our news section here.
- Global Economic Growth:
The world economy is projected to register some strong recovery with the United Nations projecting a 4.7% growth up from the 4.0% initial projections according to United Nations Department of Economic and Social Affairs (UN-DESA). The high growth is supported by the increased stimulus packages that governments are rolling out and the increased vaccination programmes currently being rolled out. Some countries like China are ahead in containing the virus and they have seen their economies rebound back to the pre Pandemic growth. The high stimulus packages in the US has seen the economy remain resilient and the unemployment rate reduce. The projected 4.7% growth is faced by a couple of uncertainties emanating from:
- Slow roll-out and distribution of the vaccine especially in the developing economies,
- The continued spread of the virus considering the emergence of the third wave which is characterized by more infectious variants,
- The impact of policy support measures like restricted movements which are expected to stifle domestic activity and disrupt trade and transportation, and,
- Debt sustainability now that government debts, especially in developing countries have accumulated to very high levels as economies contract and the fiscal deficit widens.
The World Trade Organization, on their trade topics, WTO and COVID-19, revised downwards the global merchandise trade from 7,2% projection in October to either to 4% contractions on the back of re-emergence of more infectious variants of the virus or expand by 3.0% if the available vaccines or other medical treatments turn around faster.
- Global Commodities Market Performance:
Global commodity prices registered mixed performance in Q1’2021, with prices of precious metals having declined by 0.4% largely driven by the improved economic conditions seen during the period thus reducing the demand for safe haven assets. Below is a summary performance of various commodities;
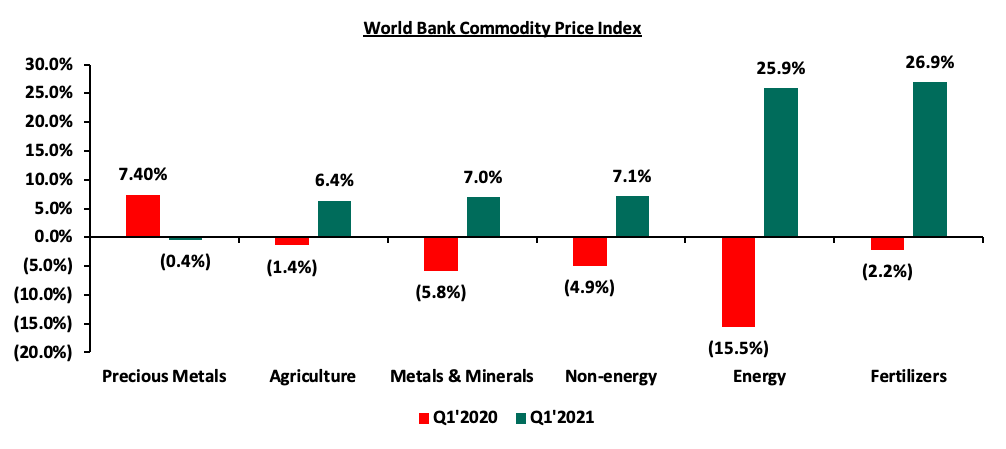
Source: World Bank
Economic Growth
Sub Saharan Africa is projected to register a 3.4% GDP growth in 2021 after a 3.7% contraction in 2020. The growth will largely be dependent on the relaxation of lockdown measures in support of curbing the virus and the recovery of the global economy to increase trade for the commodity-driven economies. Most of the African countries have huge debt levels; the World Bank projects this to be an average of 67.4% compared to the 60% recommendation, reducing the amount of stimulus that the governments can offer. However, these countries are participating in debt management and restructuring frameworks from institutions like the World Bank and G20. Case in point is the Debt Service Suspension Initiative of which 29 out of the 38 countries in the Sub-Saharan Africa participated in.
Currency Performance
The vast majority of the select currencies depreciated against the US Dollar in Q1’2021 continuing the trend witnessed in FY’2020, with only the Ghanaian Cedi and the Nigerian Naira gaining by 1.6% and 0.04%, respectively. The Ghanaian Cedi performance is partly attributable to recovering global oil and cocoa prices as well as the subsequent increase in trade and investment activities in the country. The Zambian Kwacha was the worst performer in Q1’2021 as it depreciated by 4.2% against the dollar. The performance is partly attributable to high demand for hard currency from investors and the government as it seeks to meet its debt repayment obligations. The Zambian Kwacha depreciation was however mitigated by rising global copper prices; having increased by 15.6% to USD 4.1 from USD 3.5 per pound. The Kenya Shilling depreciated by 0.3% in Q1’2021 to close at Kshs 109.5 against the US Dollar, compared to Kshs 109.2 recorded at the end of 2020.
Below is a table showing the performance of select African currencies:
|
Select Sub Saharan Africa Currency Performance vs USD |
|||||
|
Currency |
Mar-20 |
Dec-20 |
Mar-21 |
Last 12 Months change (%) |
YTD change (%) |
|
Ghanaian Cedi |
5.7 |
5.8 |
5.8 |
(0.9%) |
1.6% |
|
Nigerian Naira |
360.0 |
380.7 |
380.6 |
(5.4%) |
0.04% |
|
Tanzanian Shilling |
2,308.0 |
2,314.0 |
2,314.0 |
(0.3%) |
0.0% |
|
Kenyan Shilling |
104.7 |
109.2 |
109.5 |
(4.6%) |
(0.3%) |
|
Ugandan Shilling |
3,785.0 |
3,647.0 |
3,660.0 |
3.4% |
(0.4%) |
|
South African Rand |
17.8 |
14.7 |
14.8 |
20.8% |
(0.5%) |
|
Malawian Kwacha |
729.3 |
763.2 |
776.3 |
(6.1%) |
(1.7%) |
|
Botswanan Pula |
11.8 |
10.8 |
11.0 |
7.2% |
(2.2%) |
|
Mauritius Rupee |
39.1 |
39.6 |
40.7 |
(3.8%) |
(2.7%) |
|
Zambian Kwacha |
18.1 |
21.1 |
22.1 |
(17.7%) |
(4.2%) |
African Eurobonds
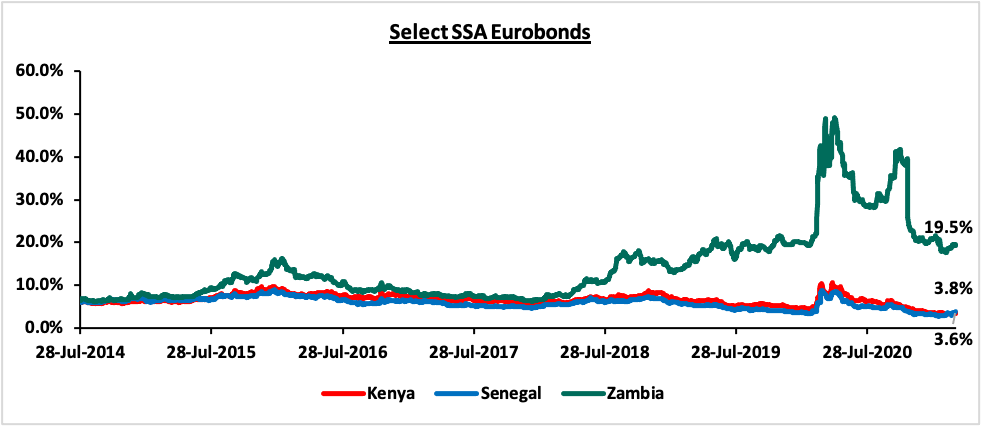
Yields on African Eurobonds generally declined in Q1’2021, partly attributable to investors attaching a lower risk premium on the Sub-Saharan region due to the anticipation of quick economic recovery from the adverse effects of the pandemic in 2020. Yields on Kenyan and Zambian Eurobonds declined in Q1’2021 by 0.4% and 0.9% points to 3.6% and 19.5%, from 3.9% and 20.4%, respectively, recorded in December 2020. The Zambian Eurobonds yields’ decline is partly attributable to; (i) Government of Zambia’s Economic Recovery Programme launched in December 2020, (ii) the expected debt management agreement following talks with the International Monetary Fund for an Extended Credit Facility and (iii) the rising copper prices. Yields on the Zambia Eurobond remain relatively high, owing to the high risk attached to the country as it failed to honor its service obligations of a USD 42.5 mn Eurobond coupon in November 2020 and is struggling with high debt levels which are currently at 8% to GDP. On the other hand, yields on the Senegalese Eurobond increased by 0.6% points to 3.8% in Q1’2021, from 3.3% recorded in December 2020, attributable to the economic decline due to the COVID-19 pandemic with the tourism and transport sectors being some of the hardest hit sectors.
Below is a graph showing the Eurobond secondary market performance of select 10-year Eurobonds issued by their respective countries;
Equities Market Performance
Sub-Saharan Africa (SSA) stock markets recorded mixed performance in Q1’2021, with Ghana’s GGSECI being the best performing market gaining by 15.8% attributable to the country’s improving economy coupled with the stable local currency. Nigeria’s NGSEASI was the worst-performing market with a loss of 3.0%, partly attributable to the effects the pandemic as the country is experiencing it’s second wave of infections coupled with concerns over decarbonization trends in the world which are expected to keep the oil prices low. Hydrocarbon products account for 90.0% of the Nigeria’s exports.
Below is a summary of the performance of key exchanges:
|
Equities Markets Performance (Dollarized*) |
||||||
|
Country |
Index |
Mar-20 |
Dec-20 |
Mar-21 |
Last 12 Months change (%) |
YTD change (%) |
|
Ghana |
GGSECI |
378.9 |
332.5 |
384.9 |
1.6% |
15.8% |
|
South Africa |
JALSH |
2,493.8 |
4,044.8 |
4,502.4 |
80.5% |
11.3% |
|
Kenya |
NASI |
1.3 |
1.4 |
1.5 |
15.5% |
4.0% |
|
Uganda |
USEASI |
0.3 |
0.4 |
0.4 |
8.8% |
2.8% |
|
Tanzania |
DARSDEI |
1.5 |
1.5 |
1.5 |
0.7% |
1.0% |
|
Rwanda |
RSEASI |
0.2 |
0.2 |
0.2 |
(5.7%) |
(0.1%) |
|
Zambia |
LASILZ |
233.3 |
185.1 |
182.3 |
(21.9%) |
(1.5%) |
|
Nigeria |
NGSEASI |
59.2 |
105.8 |
102.6 |
73.4% |
(3.0%) |
|
*The index values are dollarized for ease of comparison |
||||||
GDP growth in Sub-Saharan Africa region is expected to recover gradually in 2021, in line with the rest of the global economy. The region still faces key challenges among them the COVID-19 pandemic with the region experiencing a slow distribution of the vaccines. Additionally, some of the countries are suffering from high debt levels that will make them less attractive to foreign capital. The significant weakening of the currencies has made debt service also become very expensive.
The Kenyan Economy is projected to grow at an average of 5.4% according to various organizations as shown below.
|
No. |
Organization |
Q1’2021 Projections |
Q1’2020 Projections |
|
1. |
International Monetary Fund |
4.7% |
6.0% |
|
2. |
Cytonn Investments Management PLC |
4.0% |
4.3% |
|
3. |
Central Bank of Kenya |
6.4% |
3.4% |
|
4. |
National Treasury |
7.0% |
6.0% |
|
5. |
UNCTAD |
5.7%* |
5.5% |
|
6. |
Africa Development Bank (AfDB) |
5.0% |
6.0% |
|
7. |
World Bank |
4.7% |
6.0% |
|
Average |
5.4% |
5.3% |
|
|
* Forecasted in Q4’2020 |
|||
Source: Cytonn Research
The growth is largely supported by the opening up of the country for business which is projected to help sectors like tourism, hospitality and trade etc. which were worst hit by the pandemic, to recover. There was a general optimism in the first quarter with the average Stanbic Bank Monthly Purchasing Managers’ Index (PMI) for the first two months averaging at 52.3, which is higher than the 49.4 recorded during a similar period in 2020 pointing to a solid improvement in the private sector. Also, from the Kenya Revenue Authorities collections it was clear that the economy was doing much better with the collections for the month of March, increasing by 11.2% to Kshs 144.6 bn from the Kshs 127.7 bn collected in February 2021.
The country however saw two of the key rating agencies revise the countries credit outlook with the Standard & Poor’s, lowering its long-term foreign and local currency sovereign credit ratings on Kenya to 'B' from 'B+’ while Fitch Rating affirmed Kenya's Long-Term Foreign-Currency Issuer Default Rating (IDR) at 'B+' with a Negative Outlook. The revisions were on the back of lower economic performance due to the pandemic and the high debt levels increasing the country’s vulnerability
Despite the positivity at the beginning of the year, the macroeconomic environment in Kenya has come under pressure towards the end of Q1’2021, as a result of;
- Expectations of lackluster economic growth, following fears of a third wave of COVID-19 and the announcement of new restrictions measures by the government,
- Volatility in the foreign exchange market and the decline in the forex reserves to USD 7.3 bn equivalent to 4.5 months of import cover, and,
- Declining business conditions as evidenced by the Stanbic Bank Monthly Purchasing Manager’s Index (PMI), which declined to 50.9 in February, from 53.2 the previous month.
Inflation:
The average inflation rate declined to 5.8% in Q1’2021 compared to 6.1% in a similar period in 2020. Inflation for the month of March came in at 5.9% with the m/m inflation from the 5.8% recorded in February. The rising inflation rate can be attributed to the rising fuel prices since the start of the year. Going forward, we expect inflation to be higher than 5.2%, which was the average in 2020, but remain within the government target range of 2.5% - 7.5%, mainly due to the rising global fuel prices and the new taxes introduced at the start of the year that will be transmitted to the final consumers.
Below chart is the inflation chart for the last five years:

The Kenya Shilling:
The Kenya Shilling depreciated against the US Dollar by 0.3% in Q1’2021, to close at Kshs 109.5, from Kshs 109.2 at the end of Q4’2020, attributable to the importer dollar demands outweighing inflows from sectors such as agriculture and remittances. During the week, the Kenya Shilling appreciated against the US Dollar by 0.4% to close at 109.5, from 109.8 the previous week. We expect the shilling to continue depreciating in 2021 as a result of:
- Rising uncertainties in the global market due to the Coronavirus outbreak, which has seen investors continue to prefer holding their investments in dollars, other hard currencies and commodities, and,
- Continued strengthening of the US Dollar against major currencies as evidenced by the 3.7% gain in the ICE U.S. Dollar Index as compared to a 6.7% decline in 2020. The ICE U.S. Dollar Index is a benchmark index that measures the international value of the US Dollar where investors can monitor the value of the US Dollar relative to a basket of six other world currencies.
The shilling is however expected to be supported by:
- The Forex reserves, currently at USD 7.3 bn (equivalent to 4.5-months of import cover), which is above the statutory requirement of maintaining at least 4.0-months of import cover, and the EAC region’s convergence criteria of 4.5-months of import cover. The Forex reserves have been declining and this may mean that the government of Kenya will struggle to support the local currency when it depreciates if the trend continues,
- The improving current account position which narrowed to 4.6% of GDP in the 12 months to February 2021 compared to 5.8% of GDP during a similar period in 2020, and,
- Improving diaspora remittances evidenced by an 18.9% y/y increase to USD 260.3 mn in February 2021, from USD 219.0 mn recorded over the same period in 2020, has cushioned the shilling against further depreciation.
Monetary Policy:
The Monetary Policy Committee (MPC) met twice in Q1’2021, maintaining the Central Bank Rate (CBR) at 7.0% in both meetings. In the two sittings held in Q1’2020, the MPC concluded that the current accommodative monetary policies together with the package of policy measures implemented over the last year have protected the economy from substantial decline and supported the most vulnerable citizens, and as such decided to retain the Central Bank Rate (CBR) at 7.0% for the eighth time since April 2020 when the rate was lowered to 7.00% from 7.25%.
Q1’2021 Highlights:
- Kenya National Bureau of Statistics (KNBS) released the Quarterly Gross Domestic Product Report, where the Kenyan economy recorded a 1.1% contraction in Q3’2020 down from a growth of 5.8% recorded in a similar period in 2019. This was the second consecutive contraction, following the 5.7% contraction recorded in Q2’2020. Consequently, the average GDP growth rate for the 3 quarters in 2020 is a contraction of 0.6%, a decline from 5.5% recorded during a similar period in 2019,
- KNBS also released the Quarterly Balance of Payments report for Q3’2020 highlighting that the balance of payments deteriorated in Q3’2020, coming in at a deficit of Kshs 178.0 bn from a surplus of Kshs 13.2 bn in Q3’2019. This translates to a balance of payment deficit equivalent to 14.5% of GDP in Q3’2020, from a deficit equivalent to 1.1% of GDP recorded in Q3’2019. The decline was mainly due to the 73.5% decline in the Financial Account balance to Kshs 32.1 bn in Q3’20202 from Kshs 120.9 bn recorded in Q3’2019. For more information, see our Cytonn monthly January 2021,
- The National Treasury released the Supplementary Budget Estimates I for the 2020/21 fiscal year on the back of a challenging first half of the fiscal year 2020/21, with the challenges including the adverse effects of the COVID-19 pandemic on the economy. The proposed budget was tabled to the National Assembly for debate and approval at a later date. The Treasury proposes an increase in the gross total supplementary budget by Kshs 120.8 bn to Kshs 3,036.5 bn from Kshs 2,915.7 bn previously. The proposed budget increment is attributable to COVID-19 related expenditure and efforts by the government to spur economic activity. For more information, see our Cytonn Weekly #06/2021,
- The Kenyan authorities and the International Monetary Fund (IMF) mission team reached an agreement on economic and structural policies that would reinforce a 38-month program under the Extended Fund Facility (EFF) and Extended Credit Facility (ECF). Notably, the credit facility is approximately USD 2.4 bn (Kshs 262.9 bn) and is meant to help Kenya respond to the unprecedented shock of the COVID-19 pandemic as well as reduce Kenya’s debt levels. The agreement is subject to approval from the IMF’s Management and Executive Board consideration, which is expected to happen in the coming weeks. For more information, see our Cytonn Weekly #07/2021,
- Standard & Poor’s, a US-based credit rating agency, lowered its long-term foreign and local currency sovereign credit ratings on Kenya to 'B' from 'B+’, on the back of the effects of the ongoing pandemic which resulted in GDP contraction of 5.7% and 1.1% in Q2’ and Q3’2020, respectively, and increasing debt levels, which in turn increase the country’s vulnerability to debt defaults. For more information, see our Cytonn Weekly #10/2021, and,
- Fitch Rating affirmed Kenya's Long-Term Foreign-Currency Issuer Default Rating (IDR) at 'B+' with a Negative Outlook. The agency pointed out that the rating reflected a track record of strong growth, relative macroeconomic stability and a favorable government debt structure which was balanced by negatives such as rising public debt levels and high net external indebtedness. On the other hand, the Negative Outlook on the ratings reflected the underlying weaknesses of the public finances and the uncertain pace of planned fiscal consolidation. Below is a summary of the credit rating on Kenya so far:
-
Rating Agency
Previous Rating
Current Rating
Current Outlook
Date Released
S&P Global
B+
B
Stable
5th March 2021
Moody’s
B1
B2
Negative
19th June 2020
Fitch Ratings
B+
B+
Negative
26th March 2021
-
The agency however warned that they would downgrade the rating based on; i) the country’s failure to stabilize the debt to GDP ratio which is currently at 69.6%, ii) political instability around the upcoming elections, iii) the continued impact of COVID-19 which could lead to delays in the economic recovery, and, iv) a sustained fall in exports, remittances, and other external receipts or the emergence of strains on external financing.
Money Markets, T-Bills & T-Bonds Primary Auction:
During the first quarter of 2021, T-bills were undersubscribed, with the overall subscription rate coming in at 94.1%, up from 84.7% in Q4’2020. The undersubscription was partly attributable to a slight improvement in the liquidity in the market during the quarter, which saw the average interbank rate decline to 5.4%, from 6.0% in Q4’2020, supported by government payments and debt maturities. Overall subscriptions for the 91-day, 182-day, and 364-day papers came in at 69.4%, 54.6% and 139.8% in Q1’2021, from 116.4%, 51.5% and 100.5% in Q4’2020, respectively, with investors’ participation remaining skewed towards the longer 364-day paper. The yields on all the papers increased with the 364-day, 182-day and the 91-day T-bills to 9.3%, 7.9% and 7.1%, from 8.3%, 7.7% and 6.9%, respectively recorded at the end of Q4’2020. The acceptance rate for the quarter declined to 92.6% from 94.2% in Q4’2020, with the government accepting a total of Kshs 264.6 bn of the Kshs 287.1 bn worth of bids received during the quarter.
During the week, T-bills remained undersubscribed, with the overall subscription rate coming in at 29.9%, a decline from the undersubscription of 82.9% recorded last week, partly attributable due to the lower liquidity in the market and renewed fears by investors as they adopt a wait and see attitude, after the new government restrictions following a spike in the number of COVID-19 infections in the country in recent weeks. Investors’ continued interest in the 364-day paper saw it record the highest subscription rate at 44.1%, a decrease from 166.0% recorded the previous week, as the paper has an attractive rate of 9.3%, which is higher than the rate for most bank placements. Additionally, the subscription rate for the 91-day and 182-day papers also declined to 50.5% and 7.6%, from 82.6% and 30.7%, respectively. Yields on the 364-day and 182-day papers rose by 4.9 bps and 2.0 bps to 9.3% and 7.9%, respectively, while the rate on the 91-day paper declined by 0.2 bps to 7.1%. The increase in the yields can be attributable to investors continuing to demand a premium for the elevated market risks following the increase in the number of COVID-19 infections. The government continued to reject expensive bids by accepting Kshs 7.16 bn of the Kshs 7.19 bn bids received, translating to an acceptance rate of 99.6%.
Primary T-bond auctions in Q1’2021
During Q1’2021, there was a trend of the government issuing more than one bond for the month in a bid to raise more money from the market and during the quarter there were six Treasury bond primary issues, with the details in the table below:
|
Issue Date |
Bond Auctioned |
Effective Tenor to Maturity (Years) |
Coupon Rate |
0ffered (Kshs bn) |
Raised (Kshs bn) |
Total bids received |
Average Yield |
Subscription Rate |
Acceptance Rate |
|
11/1/2021 |
FXD1/2021/002 |
2.0 |
9.5% |
25.00 |
55.9 |
61.2 |
9.5% |
244.6% |
91.3% |
|
25/01/2021 |
IFB1/2021/016 |
16.0 |
12.3% |
50.0 |
81.1 |
125.5 |
12.3% |
250.9% |
64.6% |
|
8/2/2021 |
FXD1/2013/15 |
7.1 |
11.3% |
50.0 |
9.4 |
13.6 |
11.8% |
83.7% |
76.7% |
|
FXD1/2012/20 |
11.8 |
12.0% |
22.7 |
28.3 |
12.6% |
||||
|
22/02/2021 |
FXD1/2013/15 (Tap Sale) |
7.1 |
11.8% |
18.0 |
7.0 |
7.2 |
11.8% |
62.4% |
97.1% |
|
FXD1/2012/20 (Tap Sale) |
11.8 |
12.6% |
3.9 |
4.1 |
12.6% |
||||
|
15/03/2021 |
FXD1/2019/10 |
8.0 |
12.4% |
50.0 |
15.5 |
15.9 |
12.4% |
97.4% |
99.2% |
|
FXD2/2018/20 |
17.4 |
13.2% |
32.8 |
32.8 |
13.4% |
||||
|
Q1’2021 Average |
11.7% |
38.6 |
27.9 |
36.5 |
11.8% |
147.8% |
84.9% |
||
|
Q4’2020 Average |
|
|
11.8% |
34.4 |
15.4 |
18.0 |
12.2% |
56.8% |
85.2% |
Key take-outs from the table above are:
- Primary bonds issued in Q1’2021 were oversubscribed, with the subscription rate averaging 147.8% for the quarter, higher than the average subscription rate for Q4’2019, which was 56.8%. This was mainly attributable to investors preference on longer dated papers to lock in the good yields,
- The average acceptance rate for the quarter came in at 84.9%, as the CBK continued to reject bids deemed expensive to maintain the rates low, and,
- The government reopened two bonds on a tap sale, namely FXD1/2013/15 and FXD1/2012/2020 in the month of February to plug in any deficits from the initial issuances earlier in the month. However, the re-opened bonds were still undersubscribed, recording a subscription rate averaging 62.4%, lower than the 83.7% in the first issuance. The undersubscription was attributable to the short bidding period and the saturation of bonds with similar tenor in the market. The government accepted Kshs 228.3 bn against a target of Kshs 288.4 bn during the quarter.
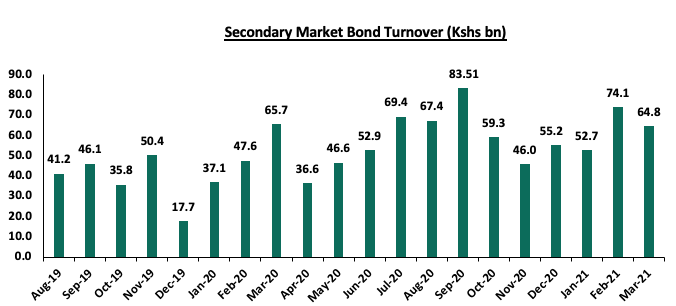
Secondary Bond Market Activity:
- Bond Turnover
The secondary bond market recorded increased activity, with the turnover increasing by 27.4% to Kshs 191.6 bn, from Kshs 150.4 bn in Q1’2020, partially attributable to local institutional investors increasing their allocation to treasury bonds considered a safe haven in this period of market uncertainties.
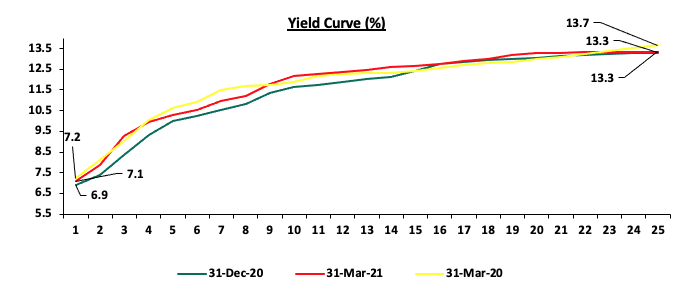
- Yield Curve
The yield curve has readjusted upwards from the December levels as the government sought to raise more cash from the market. The increase led to the FTSE bond Index registering a negative return of (1.0%). We expect the rise in the yield curve to be sustained in the coming quarter, mainly because increased borrowing appetite by the government coupled with investors hunt for higher yields. The graph below indicates the various movements:
Money Market Performance
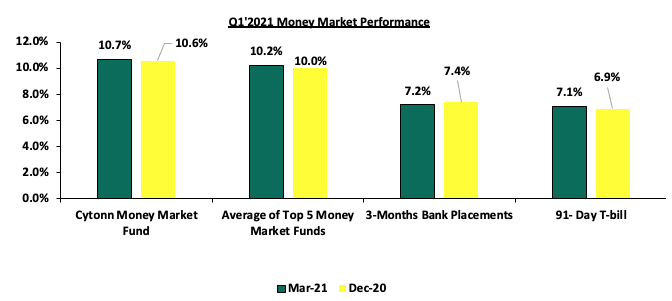
In the money markets, 3-month bank placements ended the week at 7.2% lower than 7.4% recorded at the end of Q4’2020 (based on what we have been offered by various banks), the 91-day T-bill remained unchanged at 7.1% during the week, but was 0.2% points higher than the 6.9% at the end of Q4’2020, while the average of Top 5 Money Market Funds remained unchanged at 10.2% during the week, which was higher than the 10.0% at the end of Q4’2020 but averaged at 10.0% during the quarter. The yield on the Cytonn Money Market (CMMF) declined by 0.2% points to 10.7%, from 10.9% recorded the previous week, during Q1’2021 CMMF averaged a 10.7% return.
Liquidity:
In Q1’2021, liquidity in the money market eased, as evidenced by the decline in the interbank rate to 5.4%, from 6.0% the previous quarter. Additionally, the average volumes traded in the interbank market increased by 1.6% to Kshs 15.8 bn, from Kshs 15.5 bn recorded in Q4’2020. The increased liquidity in the market was supported by government payments and debt maturities.
During the week, liquidity eased with the average interbank rate declining to 5.4%, from 5.6% recorded the previous week attributable to government payments which offset tax remittances. Additionally, there was a 43.1% increase in the average volumes traded in the interbank market to Kshs 15.8 bn, from Kshs 11.0 bn the previous week.
Kenya Eurobonds:
During Q1’2021, there was a mixed performance of the Eurobonds issued, we saw increases in the dual-tranche Eurobonds issued in 2018 and 2019 and decreases in the 10-year Eurobond issued in 2014. The mixed performance points to the fact that investors are still seeking direction as they try to get how the Credit downgrades and the economic expectations are affecting the credit outlook of the country.
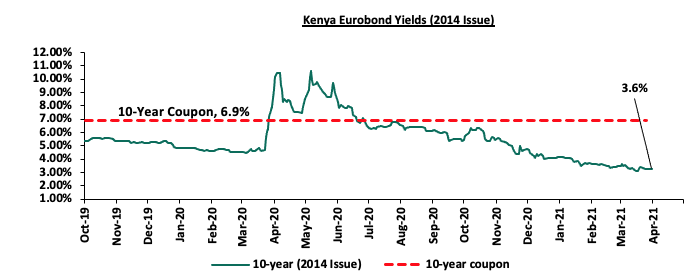
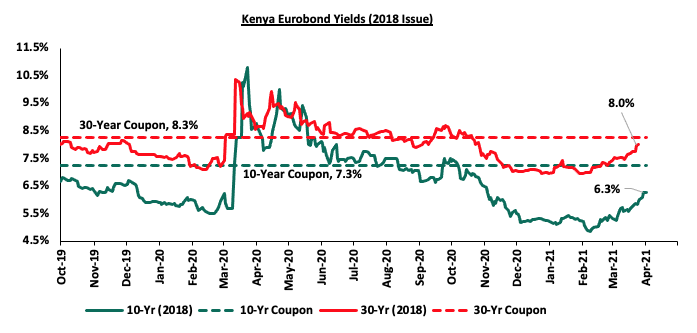
During the week, the yield on the 30-year increased marginally by 0.3% points to 8.0%, from the 7.7% recorded last week, while the yield on the 10-year Eurobond increased by 0.4% points to 6.3% from 5.9% recorded last week.
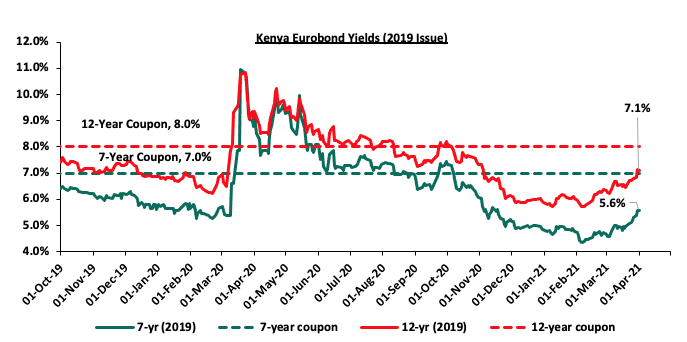
During the week, the yield on the 7-year Eurobond issued in 2019 increased by 0.4% points, to 5.6%, from 5.2% recorded the previous week while the yields on the 12-year Eurobond issued in 2019 increased by 0.3% points to 7.1% from 6.8% recorded the previous week.
Rates in the fixed income market have remained relatively stable as the government rejects expensive bids. The government is 17.2% behind its domestic borrowing target, having borrowed Kshs 346.7 bn against a pro-rated target of Kshs 418.5 bn or the financial year 2021/2021. In our view, due to the current subdued economic performance brought about by the effects of the COVID-19 pandemic, the government will record a shortfall in revenue collection with the target having been set at Kshs 1.9 tn for FY’2020/2021, thus leading to a larger budget deficit than the projected 7.5% of GDP. The high deficit and the lower credit rating will mean that the government might be forced to borrow more from the domestic market which will ultimately create uncertainty in the interest rate environment. In our view, investors should be biased towards short-term to medium-term fixed income securities to reduce duration risk.
Market Performance:
During Q1’2021, the equities market recorded a mixed performance, with NASI and NSE 25 gaining by 4.3% and 3.4%, respectively, while NSE 20 declined by 1.2%, taking their YTD performance as at the end of March to gains of 4.3% and 3.4% for NASI and NSE 25, respectively, while NSE 20 declined by 1.2%. The equities market performance during the quarter was driven by gains recorded by large caps such as BAT Kenya, KCB Group, Safaricom, and Co-operative Bank of 31.6%, 8.4%, 5.8% and 5.6%, respectively. The gains were however weighed down by losses recorded by stocks such as Diamond Trust Bank (DTB-K), ABSA Bank and NCBA Group of 16.3%, 8.7% and 6.0%, respectively.
Equities turnover increased by 15.2% during the quarter to USD 288.5 mn, from USD 250.5 mn in Q4’2020. Foreign investors remained net sellers during the quarter with a net selling position of USD 8.9 mn, from a net selling position of USD 24.5 recorded in Q4’2020.
During the week, the equities market was on a downward trajectory with NASI, NSE 20 and NSE 25 losing by 3.5%, 2.0% and 2.9%, respectively, driven by losses recorded by large-cap stocks such as Cooperative Bank, EABL and Equity Group of 12.1%, 5.8%, and 4.8%, respectively. The losses were however mitigated by gains recorded by NCBA Group, which gained by 9.7%.
During the week, equities turnover increased by 32.1% to USD 29.0 mn from USD 21.9 mn recorded the previous week, taking the YTD turnover to USD 294.2 mn. During the week, foreign investors turned net sellers, with a net selling position of USD 9.1 mn, from a net buying position of USD 4.4 mn recorded the previous week.
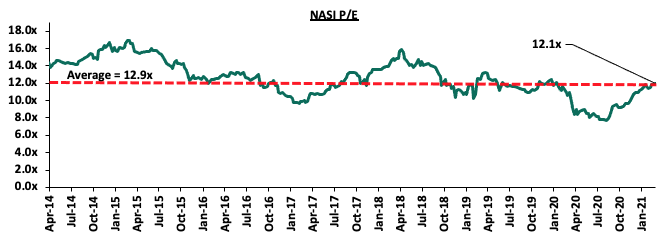
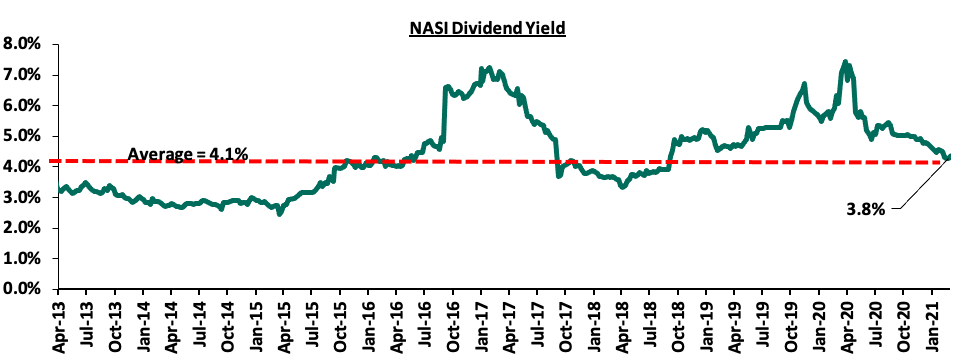
The market is currently trading at a price to earnings ratio (P/E) of 12.1x, 6.7% below the historical average of 12.9x, and a dividend yield of 3.8%, 0.3% points below the historical average of 4.1%. Key to note, NASI’s PEG ratio currently stands at 1.4x, an indication that the market is trading at a premium to its future earnings growth. Basically, a PEG ratio greater than 1.0x indicates the market may be overvalued while a PEG ratio less than 1.0x indicates that the market is undervalued. As such, with the market trading at a premium to its future earnings growth, despite the low valuations currently in the market, we believe that investors should reposition towards companies with a strong earnings growth and are trading at discounts to their intrinsic value. The current P/E valuation of 12.1x is 56.5% above the most recent trough valuation of 7.7x experienced in the first week of August 2020. The charts below indicate the historical P/E and dividend yields of the market.
There have been a couple of companies that have released during the quarter and among them are the banking stocks. One of the key features for the banks has been the worsening Asset quality. The table below explains the changes in the asset qualities of the various banks.
Asset Quality
Below is a summary of the asset quality for the listed banks
|
Bank |
FY'2019 NPL Ratio |
FY'2020 NPL Ratio |
FY'2019 NPL Coverage |
FY'2020 NPL Coverage |
% point change in NPL ratio |
% point change in NPL coverage |
|
ABSA Bank Kenya |
6.6% |
7.7% |
77.0% |
71.1% |
1.1% |
(5.9%) |
|
Diamond Trust Bank |
7.7% |
10.4% |
42.9% |
44.6% |
2.7% |
1.7% |
|
Equity Group |
9.5% |
11.5% |
47.5% |
62.4% |
2.0% |
14.9% |
|
I&M Holdings |
11.3% |
11.6% |
59.1% |
66.8% |
0.3% |
7.7% |
|
Stanbic Bank |
9.6% |
11.8% |
57.1% |
60.6% |
2.2% |
3.5% |
|
NCBA Group |
12.6% |
14.7% |
55.9% |
60.9% |
2.1% |
5.0% |
|
KCB |
11.1% |
14.8% |
59.5% |
59.8% |
3.7% |
0.3% |
|
Standard Chartered Bank |
13.9% |
16.0% |
78.7% |
80.6% |
2.1% |
1.9% |
|
Co-operative Bank |
11.2% |
18.7% |
51.8% |
50.3% |
7.5% |
(1.5%) |
|
HF Group |
27.7% |
24.6% |
47.8% |
63.4% |
(3.1%) |
15.6% |
|
Mkt Weighted Average |
10.5%** |
12.8%* |
57.6%** |
60.8%* |
2.3% |
3.2% |
|
*Market cap weighted as at 1/04/2021 **Market cap weighted as at 09/04/2020 |
||||||
Key take-outs from the table include;
- Asset quality for the listed banks deteriorated during the period of review, with the weighted average NPL ratio rising by 2.3% points to a market cap weighted average of 12.8%, from 10.5% in FY’2019. The deterioration in asset quality was as a result of the coronavirus-induced downturn in the economy which led to an uptick in the non-performing loans. Notably, for Diamond Trust Bank (DTB-K), and NCBA, the NPL ratio is at the highest it has been for more than a decade,
- NPL Coverage for the listed banking sector increased to a market cap weighted average of 60.8% in FY’2020, from 57.6% recorded in FY’2019, as the banks increased their provisioning levels to proactively manage risks given the tough economic conditions occasioned by the pandemic. This was in line with our expectations of higher provisioning levels which would subdue profitability in FY’2020 across the banking sector on account of the tough business environment, and,
- ABSA and Co-operative Bank recorded a decline in their NPL Coverage despite their NPL ratio rising, which could suggest modest provisioning. Given the current economic environment and elevated risk of loans defaults, we expected higher provisioning for the banks. Key to note, if Cooperative Bank’s NPL Coverage remained at the 51.8% level recorded in 2019, the bank would have had an additional provisioning of Kshs 0.9 bn, which would have reduced the earnings per share from the reported Kshs 2.1 to Kshs 1.8, while if ABSA’s NPL coverage remained at the 77.0%, level recorded in 2019, the bank would have had an additional provisioning of Kshs 1.5 bn, which would have reduced the earnings per share from the reported Kshs 0.8 to Kshs 0.5.
The table below highlights the performance of the listed banking sector, showing the performance using several metrics, and the key take-outs of the performance;
|
Bank |
Core EPS Growth |
Interest Income Growth |
Interest Expense Growth |
Net Interest Income Growth |
Net Interest Margin |
Non-Funded Income Growth |
NFI to Total Operating Income |
Growth in Total Fees & Commissions |
Deposit Growth |
Growth in Government Securities |
Loan to Deposit Ratio |
Loan Growth |
Return on Average Equity |
|
Equity |
(10.9%) |
23.5% |
26.3% |
22.6% |
7.6% |
25.1% |
41.1% |
6.9% |
53.5% |
26.8% |
64.5% |
30.4% |
16.5% |
|
Stanbic |
(18.6%) |
(3.4%) |
(1.6%) |
(4.1%) |
4.7% |
(8.7%) |
44.9% |
(18.7%) |
15.7% |
25.0% |
75.5% |
2.7% |
10.3% |
|
I&M |
(21.9%) |
2.5% |
5.1% |
0.6% |
5.4% |
4.3% |
35.6% |
4.4% |
14.3% |
88.6% |
71.3% |
6.9% |
13.2% |
|
KCB |
(22.1%) |
19.4% |
14.2% |
21.0% |
8.5% |
1.0% |
29.5% |
(10.4%) |
11.7% |
26.6% |
77.6% |
10.3% |
14.4% |
|
Co-op |
(24.4%) |
11.9% |
1.3% |
16.1% |
8.5% |
1.9% |
32.5% |
0.7% |
13.8% |
37.4% |
75.7% |
7.5% |
12.5% |
|
SCBK |
(33.9%) |
(6.1%) |
(20.4%) |
(1.8%) |
6.8% |
(10.2%) |
30.2% |
(12.0%) |
12.3% |
0.2% |
47.4% |
(5.6%) |
11.0% |
|
NCBA |
(41.7%) |
73.4% |
54.0% |
91.1% |
5.8% |
3.1% |
45.1% |
19.2% |
11.4% |
12.8% |
59.0% |
(0.3%) |
6.6% |
|
ABSA |
(44.2%) |
1.3% |
2.7% |
0.9% |
7.1% |
5.2% |
32.3% |
(9.9%) |
6.7% |
2.5% |
82.3% |
7.2% |
15.1% |
|
DTB-K |
(51.5%) |
(5.4%) |
(8.0%) |
(3.4%) |
5.0% |
6.1% |
25.3% |
(7.8%) |
6.4% |
12.0% |
70.0% |
4.8% |
5.8% |
|
HF Group |
(1443.7%) |
(17.4%) |
(23.8%) |
(5.2%) |
4.2% |
(63.0%) |
21.8% |
(38.0%) |
6.8% |
54.4% |
92.6% |
(4.0%) |
(23.3%) |
|
FY'20 Mkt Weighted Average* |
(24.4%) |
16.4% |
12.4% |
18.6% |
7.3% |
6.5% |
35.3% |
(2.1%) |
22.4% |
26.6% |
69.8% |
11.8% |
13.2% |
|
FY'19Mkt Weighted Average** |
8.9% |
3.2% |
3.4% |
3.4% |
7.3% |
17.4% |
37.4% |
18.4% |
12.7% |
19.4% |
75.0% |
12.8% |
18.4% |
|
*Market cap weighted as at 1/04/2021 **Market cap weighted as at 09/04/2020 |
|||||||||||||
Key takeaways from the table above include:
- The listed banking sector recorded a 24.4% weighted average decline in core Earnings Per Share (EPS), compared to a weighted average growth of 8.9% in FY’2019, attributable to the increased Non performing loans and loan loss provisions due to the unfavorable economic environment as a result of the pandemic which impacted individuals and businesses’ ability to service loans. This was evidenced by the deterioration in asset quality, with the weighted average NPL ratio increasing to 12.8% from 10.5% in FY’2019,
- The Banks have recorded a weighted average deposit growth of 22.4%, faster than the 12.7% growth recorded in FY’2019,
- Interest expense grew at a faster pace, by 12.4%, compared to a 3.4% growth in FY’2019 while cost of funds declined, coming in at a weighted average of 3.1% in FY’2020, from 3.2% in FY’2019, owing to the faster growth in average interest-bearing liabilities, an indication that the listed banks were able to mobilize cheaper deposits,
- Average loan growth came in at 11.8%, lower than the 12.8% growth recorded in FY’2019. The loan growth was also slower than the 26.6% growth in government securities, an indication of the banks’ preference of investing in Government securities as opposed to lending due to the elevated credit risk occasioned by the pandemic. The faster growth in government securities could also be attributed to cautious lending by banks in a bid to reduce the cost of risk as well as mitigate further deterioration of the asset quality,
- Interest income grew by 16.4%, compared to a growth of 3.2% recorded in FY’2019. Despite the growth in interest income, the Yield on Interest Earning Assets (YIEA) declined to 10.1%, from the 10.4% recorded in FY’2019, an indication of the increased allocation to lower-yielding government securities by the sector during the period. The decline in the YIEA can also be attributed to the reduced lending rates for customers by the sector, in line with the Central Bank Rate cuts. The Net Interest Margin (NIM) remained flat at 7.3%, similar to what was recorded in FY’2019 for the whole listed banking sector, and,
- Non-Funded Income growth increased by 6.5% compared to the 17.4% growth recorded in FY’2019. This can be attributable to i) a slower growth in the fees and commission which declined by 2.1% compared to a growth of 18.4% in FY’2019 and ii) the waiver on fees on mobile transactions below Kshs 1,000 coupled with the free bank-mobile money transfer. However, with the expiry of the waiver on bank charges on 2nd March 2021, we expect NFI growth to recover in the medium-long term due to the increased adoption of digital channels. According to Central Bank Annual Report 2019/2020, 67.0% of banking transactions were conducted on mobile phones after the onset of the pandemic, compared to 55.0% of transactions before the pandemic. Moreover, more than 1.6 mn additional customers are now using mobile-money channels compared to the period before the pandemic began.
For the various earnings notes of the various companies, click these links:
- Stanbic Holdings FY’2020 Earnings Note;
- KCB Group FY’2020 Earnings Note;
- Cooperative Bank FY’2020 Earnings Note;
- ABSA Bank Kenya FY’2020 Earnings Note;
- Diamond Trust Bank Kenya (DTB-K) FY’2020 Earnings Note;
- Standard Chartered Bank Kenya FY’2020 Earnings Note;
- Equity Group FY’2020 Earnings Note;
- I&M Holdings FY’2020 Earnings Note;
- NCBA Group FY’2020 Earnings Note;
- HF Group FY’2020 Earnings Note;
Quarterly Highlights:
During the quarter;
- The Insurance Regulatory Authority (IRA), released the Q3’2020 Insurance Industry Reporthighlighting that the industry’s gross premiums rose by 2.6% to Kshs 179.4 bn, from Kshs 174.9 bn recorded in Q3’2019, with the general insurance business contributing to 58.6% of the industry’s premium income, a 1.6% points decline from the 60.2% contribution witnessed in Q3’2019. The regulator noted that the COVID-19 pandemic had impacted the insurance sector mainly through reduced returns from the capital markets and a rise in insurance claims in the long term insurance business class. For more information see our Cytonn Weekly #03/2021,
- The Central Bank of Kenya (CBK), released the Commercial Banks’ Credit Survey Report for the quarter ended December 2020. According to the report, the banking sector’s loan book recorded a 7.1% y/y growth compared to 8.8% the prior year, with gross loans increasing to Kshs 3.0 tn in December 2020, from Kshs 2.8 tn recorded in December 2019 while the aggregate balance sheet recorded a 12.5% increase y/y to Kshs 5.4 tn in FY’2020, from Kshs 4.8 tn in FY’2019. For more information, please see Cytonn Weekly #05/2021,
- Liberty Holdings Limited (Liberty), a financial services and property holding company announced plans to buy an additional 84.2 mn shares in Liberty Kenya Holdings Plc (LK), which represents 15.8% of the company. The deal entails a private sale of 49.5 mn ordinary shares from the Kimberlite Frontier Africa Master Fund (KFAMF), representing 9.2% of Liberty Kenya's issued share capital and a further 34.6 mn ordinary shares from Coronation Africa Frontiers which owns 6.5% of the company's stock. The planned acquisition will increase the company’s stake to 73.5% (393.6 mn ordinary shares) from the current 57.7% (309.3 mn ordinary shares), retaining Liberty’s status as the biggest shareholder of the insurer. The total cost of this transaction is Kshs 926.6 mn, with Liberty Holdings Limited buying each share at Kshs 11.0 while Liberty Kenya Holdings is currently trading at Kshs 8.1 indicating an undervaluation of 35.8%. For more information, please see Cytonn Weekly#09/2021, and,
- The Central Bank of Kenya (CBK) announced that the emergency measures on restructuring of loans for bank borrowers put in place in March 2020, expired on 2nd March 2021. The emergency measures were meant to cushion the borrowers from the adverse effects of the pandemic which would affect their ability to service loans such as the reduction in disposable income. According to the Central Bank, the measures were highly effective, giving borrowers restructuring options which included moratorium on principle or interest and waivers on interest fees. Cumulatively, as at the end of February 2021, loans amounting to Kshs 1.7 tn were restructured, accounting for 57.0% of the banking sector’s gross loans as at February 2021. Following the resumption of payments by most borrowers, outstanding restructured loans as at end of February stood at Kshs 569.3 bn, which was 19.0% of the sector’s total gross loans, a sign that the economy is on a recovery path. For more information, please see Cytonn Weekly#12/2021.
Universe of Coverage:
|
Company |
Price at 26/3/2021 |
Price at 1/4/2021 |
w/w change |
q/q change |
YTD Change |
Year Open 2021 |
Target Price* |
Dividend Yield |
Upside/ Downside** |
Recommendation |
|
Diamond Trust Bank*** |
66.5 |
68.0 |
2.3% |
(16.3%) |
(11.4%) |
76.8 |
105.1 |
0.0% |
54.6% |
Buy |
|
Kenya Reinsurance |
2.6 |
2.5 |
(2.7%) |
5.2% |
9.5% |
2.3 |
3.3 |
4.3% |
34.8% |
Buy |
|
Co-op Bank*** |
13.6 |
12.0 |
(12.1%) |
5.6% |
(4.8%) |
12.6 |
14.5 |
8.4% |
29.7% |
Buy |
|
Sanlam |
12.0 |
11.0 |
(8.3%) |
(16.6%) |
(15.4%) |
13.0 |
14.0 |
0.0% |
27.3% |
Buy |
|
I&M Holdings*** |
43.2 |
49.0 |
13.6% |
11.1% |
9.3% |
44.9 |
60.1 |
4.6% |
27.2% |
Buy |
|
Britam |
7.1 |
7.0 |
(1.4%) |
(3.3%) |
0.0% |
7.0 |
8.6 |
0.0% |
22.9% |
Buy |
|
Liberty Holdings |
8.2 |
8.2 |
0.0% |
7.0% |
6.5% |
7.7 |
9.8 |
0.0% |
19.5% |
Accumulate |
|
ABSA Bank*** |
8.9 |
8.8 |
(0.7%) |
(8.7%) |
(7.6%) |
9.5 |
10.5 |
0.0% |
19.3% |
Accumulate |
|
Standard Chartered*** |
145.0 |
142.0 |
(2.1%) |
(1.7%) |
(1.7%) |
144.5 |
153.2 |
7.4% |
15.3% |
Accumulate |
|
KCB Group*** |
41.1 |
41.1 |
0.0% |
8.4% |
7.0% |
38.4 |
46.0 |
2.4% |
14.4% |
Accumulate |
|
Jubilee Holdings |
267.8 |
278.5 |
4.0% |
(4.8%) |
1.0% |
275.8 |
313.8 |
0.0% |
12.7% |
Accumulate |
|
Equity Group*** |
41.0 |
39.1 |
(4.8%) |
3.8% |
7.7% |
36.3 |
43.0 |
0.0% |
10.1% |
Accumulate |
|
Stanbic Holdings |
83.5 |
83.3 |
(0.3%) |
(4.4%) |
(2.1%) |
85.0 |
84.9 |
4.6% |
6.5% |
Hold |
|
NCBA*** |
23.1 |
25.4 |
9.7% |
(6.0%) |
(4.7%) |
26.6 |
25.4 |
5.9% |
6.1% |
Hold |
|
CIC Group |
2.3 |
2.2 |
(2.2%) |
(2.3%) |
4.3% |
2.1 |
2.1 |
0.0% |
(4.5%) |
Sell |
|
HF Group |
4.6 |
3.8 |
(17.5%) |
20.8% |
20.4% |
3.1 |
3.0 |
0.0% |
(20.6%) |
Sell |
|
*Target Price as per Cytonn Analyst estimates as at Q3’2020. We are currently reviewing our target prices for the Banking Sector coverage **Upside/ (Downside) is adjusted for Dividend Yield ***For Disclosure, these are stocks in which Cytonn and/or its affiliates are invested in |
||||||||||
We are “Neutral” on the Equities markets in the short term. We expect the recent discovery of a new strain of COVID-19 coupled with the introduction of strict lockdown measures in major economies to continue dampening the economic outlook. We believe there exist pockets of value in the market, with a bias on financial services stocks given the resilience exhibited in the sector. The sector is currently trading at historically cheaper valuations and as such, presents attractive opportunities for investors.
During the Q1’2021, the real estate sector recorded moderate activities with the residential sector recording an improvement in performance with average y/y total returns to investors coming in at 5.1%, up from 4.7% recorded in FY’2020. The retail sector performance in Q1’2020 recorded a decline of 0.1% points to 7.4% from 7.5% recorded in FY’2020. The average occupancies in the retail sector dropped by 0.2% points from 75.2% in FY’2020 to 75.0% in Q1’2021, the average monthly rents declined by 1.6% to Kshs 166 per SQFT in Q1’2021 from Kshs 169 per SQFT in FY’2020. Commercial office sector registered a 0.2% and 1.4% points decline in the average rental yields and occupancy rates to 6.8% and 76.3% in Q1’2021, from 7.0% and 77.7%, respectively in FY’2020. The land sector however remained resilient recording an average annualized capital appreciation of 2.8%, indicating that people consider land as a good investment asset in the long run despite the pandemic. Some of the key factors that have continued to shape the performance of the real estate sector include:
- Positive demographics,
- Improving infrastructure opening up areas for development,
- Improved investor confidence with the Kenya’s ease of doing business ranking coming in at #65,
- Continued investor focus on affordable housing, and,
- The government activities to enable access to affordable mortgages rates e.g. from Kenya Mortgage Refinance Company
There are however a couple of challenges facing the sector among them
- Travel restrictions in the country,
- The existing oversupply of in some sectors e.g. 2.0 mn SQFT in the retail sector and 6.3mn SQFT in the commercial office sector,
- Tough economic environment affecting the purchasing power of people,
- Shift towards e-commerce affecting the uptake of retail spaces,
- Constrained financing options in the markets, and,
- Business downsizing and adaptation of work from home affecting the demand for commercial office spaces.
Despite these limitations, the real estate sector will remain an attractive investment class in the long run as it continues to offer high developer returns, provide security of returns for investors with a guarantee of increased value for as long as the investor has a good location and can come up with a compelling concept.
Sectoral Market Performance
- Residential Sector
During Q1’2021, the residential sector recorded an improvement in performance with average Y/Y total returns to investors coming in at 5.1%, up from 4.7% recorded in FY’2020. Prices in all segments saw an uptick with an overall average price appreciation of 0.5% in the residential market while the average rental yield recorded 0.2% points decline to 4.7% from 4.9% recorded in FY’2020 attributed to reduced rental rates in the wake of a tough operating environment.
|
Residential Performance Summary Q1’2021 |
|||||||||
|
Segment |
Average Rental Yield Q1'2021 |
Average Y/Y Price Appreciation Q1’2021 |
Average Y/Y Total Returns Q1’2021 |
Average Rental Yield FY'2020 |
Average Y/Y Price Appreciation FY'2020 |
Average Y/Y Total Returns FY'2020 |
q/q Change in Rental Yield (% Points) |
q/q Change in Price Appreciation (% Points) |
q/q Change in Total Returns (% Points) |
|
Detached Units |
|||||||||
|
High End |
3.6% |
1.0% |
4.6% |
3.8% |
0.6% |
4.4% |
(0.2%) |
0.4% |
0.2% |
|
Upper Mid-End |
4.5% |
0.5% |
5.0% |
4.5% |
(0.3%) |
4.2% |
0.0% |
0.8% |
0.8% |
|
Satellite Towns |
4.1% |
0.7% |
4.8% |
3.9% |
0.1% |
4.0% |
0.2% |
0.6% |
0.8 % |
|
Average |
4. 1% |
0.8% |
4.8% |
4.1% |
0.1% |
4.2% |
0.0% |
0.7% |
0.6% |
|
Apartments |
|||||||||
|
Upper Mid-End |
5.2% |
0.1% |
5.3% |
5.2% |
0.0% |
5.2% |
0.0% |
0.1% |
0.1% |
|
Lower Mid-End |
5.0% |
0.2% |
5.2% |
5.8% |
(0.9%) |
4.9% |
(0.8%) |
1.1% |
0.3% |
|
Satellite Towns |
5.4% |
0.1% |
5.5% |
6.0% |
(0.5%) |
5.5% |
(0.6)% |
0.6% |
0.0% |
|
Average |
5.2% |
0.1% |
5.3% |
5.7% |
(0.5%) |
5.2% |
(0.5%) |
0.6% |
0.1% |
|
|||||||||
Source: Cytonn Research 2021
- Detached Units Performance
Detached units recorded an improvement in performance in Q1’2021 compared to FY’2020 with y/y average returns to investors coming in at 4.8%, 0.6% points increase from 4.2% recorded in FY’2020. This was attributed to gradual reopening of the economy, that saw transactional volumes pick amid a tough economic environment. The upper mid-end segment was the best performing segment with a y/y average total return of 5.0%, with Runda Mumwe and Ridgeways offering the highest y/y average total returns at 5.7% and 5.3%, respectively. The best performing node was Rosslyn recording the highest y/y average returns at 6.7%, followed by Ruiru and Kitisuru at 6.3% and 5.9%, respectively, while Rongai offered the lowest returns at 2.0%.
(All Values in Kshs unless stated otherwise)
|
Detached Units Performance Q1'2021 |
||||||||
|
Area |
Average Price per SQM Q1'2021 |
Average Rent per SQM Q1'2021 |
Average Occupancy Q1'2021 |
Average Uptake Q1'2021 |
Average Annual Uptake Q1'2021 |
Average Rental Yield Q1'2021 |
Average Y/Y Price Appreciation Q1'2021 |
Average Y/Y Total Returns Q1'2021 |
|
High-End |
||||||||
|
Rosslyn |
177,615 |
744 |
84.7% |
97.1% |
12.5% |
4.3% |
2.4% |
6.7% |
|
Kitisuru |
231,719 |
776 |
89.1% |
88.1% |
14.7% |
3.9% |
2.0% |
5.9% |
|
Lower Kabete |
154,600 |
521 |
75.5% |
72.7% |
14.3% |
2.3% |
2.3% |
4.6% |
|
Karen |
189,301 |
730 |
80.3% |
89.2% |
14.3% |
3.7% |
0.0% |
3.7% |
|
Runda |
235,567 |
824 |
88.1% |
93.4% |
10.3% |
3.8% |
(1.6%) |
2.2% |
|
Average |
197,760 |
719 |
83.6% |
88.1% |
13.2% |
3.6% |
1.0% |
4.6% |
|
Upper Mid-End |
||||||||
|
Runda Mumwe |
152,759 |
639 |
81.0% |
82.1% |
14.2% |
3.7% |
2.0% |
5.7% |
|
Ridgeways |
149,503 |
775 |
82.2% |
84.5% |
13.0% |
5.1% |
0.2% |
5.3% |
|
Langata |
161,305 |
566 |
78.7% |
94.8% |
10.5% |
3.8% |
1.2% |
5.0% |
|
Redhill & Sigona |
97,432 |
480 |
74.8% |
71.5% |
12.0% |
4.8% |
0.2% |
5.0% |
|
South B/C |
125,025 |
537 |
93.3% |
69.1% |
11.1% |
4.9% |
(0.8%) |
4.1% |
|
Average |
137,205 |
599 |
82.0% |
80.4% |
12.2% |
4.5% |
0.5% |
5.0% |
|
Lower Mid-End |
||||||||
|
Ruiru |
80,003 |
319 |
72.9% |
84.2% |
24.9% |
4.2% |
2.1% |
6.3% |
|
Juja |
61,881 |
328 |
74.2% |
89.0% |
14.1% |
4.7% |
1.0% |
5.7% |
|
Syokimau/Mlolongo |
73,976 |
350 |
88.3% |
72.0% |
13.9% |
4.9% |
0.3% |
5.2% |
|
Kitengela |
70,719 |
306 |
91.5% |
82.9% |
14.2% |
4.6% |
0.6% |
5.2% |
|
Athi River |
83,154 |
309 |
82.3% |
89.1% |
14.8% |
3.7% |
0.7% |
4.4% |
|
Rongai |
82,405 |
233 |
65.4% |
73.0% |
10.8% |
2.5% |
(0.5%) |
2.0% |
|
Average |
75,356 |
307 |
79.1% |
81.7% |
15.4% |
4.1% |
0.7% |
4.8% |
Source: Cytonn Research 2021
- Apartments Performance
Apartments registered slight improvement in Q1’2021 with average total returns recording a 0.1% points marginal increase to 5.3% y/y from of 5.2% y/y in FY’2020. Satellite towns continued to be the best performing with an average total returns stagnating at 5.5% attributed to the relatively high rental yield averaging 5.4%. The best performing nodes in terms of returns were Westlands, and South C, and Ruaka which recorded an average y/y total returns of 6.8%, 6.5% and 6.2%, respectively attributed to the resilience of house prices in the areas coupled with above average apartments rental yield of 5.2%. In general, apartment prices in all segments recorded an uptick attributed to the slight increase in demand amid reduced prices that wooed buyers into purchasing units.
(All Values in Kshs unless stated otherwise)
|
Apartments Performance Q1’2021 |
||||||||
|
Area |
Average Price Per SQM Q1'2021 |
Average Rent per SQM Q1'2021 |
Average Occupancy Q1'2021 |
Average Uptake Q1'2021 |
Average Annual Uptake Q1'2021 |
Average Rental Yield Q1'2021 |
Average Y/Y Price Appreciation Q1'2021 |
Y/Y Average Total Returns Q1'2021 |
|
Upper Mid-End |
||||||||
|
Westlands |
146,032 |
783 |
78.5% |
83.0% |
18.7% |
5.2% |
1.6% |
6.8% |
|
Parklands |
117,851 |
730 |
83.7% |
78.3% |
14.2% |
5.8% |
0.1% |
5.9% |
|
Kilimani |
104,470 |
709 |
88.9% |
90.5% |
23.5% |
5.8% |
(0.1%) |
5.7% |
|
Loresho |
120,877 |
564 |
89.2% |
80.0% |
9.4% |
5.0% |
0.3% |
5.3% |
|
Upperhill |
130,608 |
710 |
77.0% |
78.3% |
10.9% |
4.2% |
(0.1%) |
4.1% |
|
Kileleshwa |
124,714 |
625 |
85.2% |
76.5% |
14.7% |
5.1% |
(1.6%) |
3.5% |
|
Average |
124,092 |
687 |
83.8% |
81.1% |
15.2% |
5.2% |
0.1% |
5.3% |
|
Lower Mid-End: Suburbs |
||||||||
|
South C |
114,104 |
675 |
96.8% |
69.8% |
14.2% |
6.4% |
0.1% |
6.5% |
|
Waiyaki Way |
87,624 |
498 |
79.0% |
76.7% |
21.8% |
5.2% |
0.6% |
5.8% |
|
South B |
103,763 |
445 |
70.9% |
71.2% |
15.2% |
4.0% |
1.1% |
5.1% |
|
Kahawa West |
73,794 |
365 |
85.3% |
77.5% |
14.3% |
5.4% |
(0.5%) |
4.9% |
|
Langata |
114,460 |
499 |
84.0% |
82.4% |
13.3% |
4.2% |
(0.4%) |
3.8% |
|
Average |
98,749 |
496 |
83.2% |
75.5% |
15.8% |
5.0% |
0.2% |
5.2% |
|
Lower Mid-End: Satellite Towns |
||||||||
|
Ruaka |
100,757 |
494 |
66.4% |
74.0% |
18.2% |
5.4% |
0.8% |
6.2% |
|
Thindigua |
107,336 |
543 |
77.3% |
73.0% |
12.1% |
4.7% |
1.3% |
6.0% |
|
Rongai |
60,908 |
339 |
90.2% |
94.2% |
28.6% |
6.1% |
(0.1%) |
6.0% |
|
Ruiru |
89,888 |
510 |
66.4% |
63.9% |
17.2% |
4.5% |
1.1% |
5.6% |
|
Ngong |
58,015 |
306 |
86.4% |
70.7% |
11.4% |
5.4% |
0.1% |
5.5% |
|
Kikuyu |
81,115 |
483 |
85.8% |
96.9% |
22.0% |
6.4% |
(1.2%) |
5.2% |
|
Athi River |
58,400 |
290 |
91.2% |
91.4% |
12.8% |
5.5% |
(1.8%) |
3.7% |
|
Average |
79,488 |
424 |
80.5% |
80.6% |
17.5% |
5.4% |
0.1% |
5.5% |
Cytonn Research 2021
Other highlights during the quarter include;( See Cytonn Monthly- January 2021 and Cytonn Monthly- February- 2021)
- Kenya Mortgage and Refinance Company (KMRC), a treasury-backed lender, announced that it has so far advanced Kshs 2.8 bn in credit to mortgage lenders accounting for approximately 7.5% of the Kshs 37.2 bn they had planned to lend from September 2020. For more information, please see Cytonn Weekly #11/2021,
- Student Factory Africa, a consortium of architects, partnered with Betonbouw B, a Dutch-based private equity firm to launch a 4,500-bed student accommodation hostel to be located next to Catholic University of Eastern Africa in Karen, at a cost of Kshs 5.0 bn. For more information, please see Cytonn Weekly #11/2021, and,
- Property developer Mi Vida Homes, partnered with NCBA bank to provide mortgage finance for the purchase of apartment units at their Garden City project. The units being financed include 1, 2 and 3-bedroom apartments priced from Kshs 8.8 mn to Kshs 16.7 mn, with phase one of the project anticipated to be completed by March 2022. NCBA has been partnering with credible institutions and developers, others being Shelter Afrique and Tatu City developers, to facilitate affordable long-term mortgage financing to homebuyers with the aim of supporting the affordable housing agenda. Mi Vida Homes aims to address shortage of middle-income housing by delivering a minimum of 3,000 units over the next five years. The number of mortgage accounts in Kenya currently stands at 27,993 as at 2019 out of an adult population of more than 24.0 million people in Kenya, with low mortgage uptake of approximately 2.5% being attributed to; i) the high interest rates and high deposit requirements, ii) soaring of property prices, iii) low-income levels making it hard to service loans, and, v) lack of credit risk information for those in the informal sector leading to their exclusion.
The graph below shows the Mortgage to GDP ratio of different countries as of 2019;
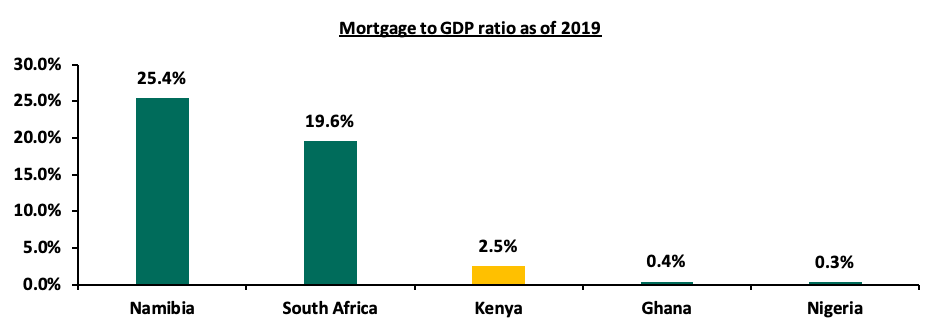
Source: Centre of Affordable Housing Africa
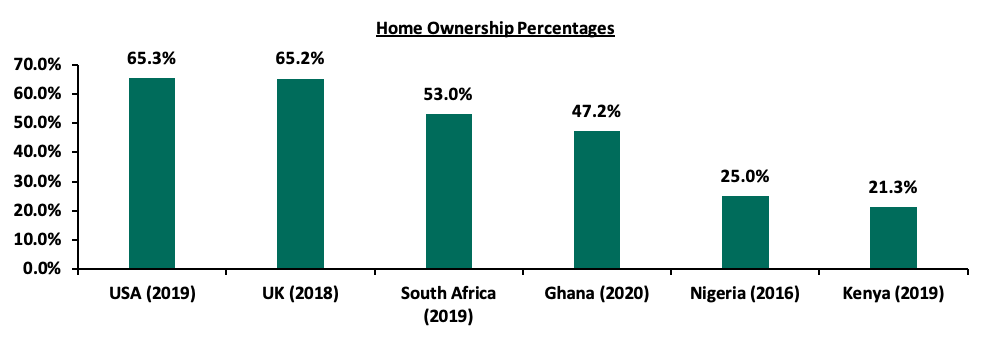
The above partnership is expected to result in increased mortgage uptake thus sparking an increase in the urban home ownership level which has remained low in Kenya at approximately 21.3%, implying that more than 78.7% of the total population are renters, compared to more developed countries such as South Africa which have more than 53.0% of the population owning homes. The low home ownership level in Kenya is mainly attributed to unavailability and unaffordability of housing finance.
The graph below shows the home ownership percentages for different countries in comparison to Kenya;
Source: Online Research
Residential sector performance is expected to be boosted by increased activities with focus on affordable housing by both the government and private sector availing relatively cheap mortgage facilities to homebuyers expected to lead to increased home ownership.
- Commercial Office Sector
The commercial office sector recorded a 0.2% and 1.4% points decline in the average rental yields and occupancy rates to 6.8% and 76.3% in Q1’2021, from 7.0% and 77.7%, respectively in FY’2020. The declines in the rental yields and the occupancies is attributable to the ongoing COVID-19 pandemic which has led to reduced demand for office spaces as businesses restructure their operations hence scaling down. The asking rents also decreased by 0.8% to an average of Kshs 92 per SQFT in Q1’2021, from Kshs 93 per SQFT in FY’2020, while the asking prices declined by 0.4% to an average of Kshs 12,228 per SQFT in Q1’2021 from Kshs 12,280 per SQFT in FY’2020. The decline in the asking prices and rents is attributed to a surplus of office space which stood at 6.3mn SQFT as at 2020 which has created a bargaining chip for tenants forcing developers to reduce their prices so that they can retain and attract occupants for their office spaces.
The table below highlights the performance of the Nairobi Metropolitan Area (NMA) Commercial Office sector over time:
(All values in Kshs unless stated otherwise)
|
Nairobi Metropolitan Area (NMA) Commercial Office Returns Over Time |
||||||
|
Year |
Q1'2020 |
H1’2020 |
Q3' 2020 |
FY'2020 |
Q1’2021 |
∆ FY'2020/ Q1’2021 |
|
Occupancy % |
81.7% |
80.0% |
79.9% |
77.7% |
76.3% |
(1.4%) points |
|
Asking Rents (Kshs) /SQFT |
97 |
95 |
94 |
93 |
92 |
(0.8%) |
|
Average Prices (Kshs) /SQFT |
12,535 |
12,516 |
12,479 |
12,280 |
12,228 |
(0.4%) |
|
Average Rental Yields (%) |
7.8% |
7.3% |
7.2% |
7.0% |
6.8% |
(0.2%) points |
Source: Cytonn Research 2021
Gigiri and Karen were the best performing submarkets in Q1’2021 recording rental yields of 8.3% and 8.0%, respectively attributed to their superior locations, availability of high quality office spaces charging prime rental prices, relatively good infrastructure, and low supply of commercial office spaces within the markets.
Thika Road and Mombasa Road were the worst performing commercial office nodes within the Nairobi Metropolitan Area recording rental yields of 5.3% and 4.7%, respectively attributed to the effect of traffic snarl-ups, low quality office spaces, and zoning regulations as Mombasa Road is mainly considered as an industrial area, while Thika Road is a popular residential hub, thus making the locations unattractive to business firms.
The table below shows the Nairobi Metropolitan Area (NMA) sub-market performance:
(All values in Kshs Unless Stated Otherwise)
|
Nairobi Metropolitan Area Commercial Office Submarket Performance Q1’2021 |
|||||||||||
|
Area |
Price (Kshs) /SQFT Q1'2021 |
Rent (Kshs) /SQFT Q1'2021 |
Occupancy (%) Q1'2021 |
Rental Yield (%) Q1'2021 |
Price (Kshs) /SQFT FY’2020 |
Rent Kshs/ SQFT FY 2020 |
Occupancy (%) FY’2020 |
Rental Yield (%) FY'2020 |
∆ in Rent |
∆ in Occupancy (% points) |
∆ in Rental Yields (% points) |
|
Gigiri |
13,400 |
116 |
81.0% |
8.3% |
13,400 |
116 |
82.5% |
8.5% |
0.0% |
(1.5% |
(0.2%) |
|
Karen |
13,511 |
107 |
83.8% |
8.0% |
13,567 |
106 |
83.6% |
7.8% |
0.5% |
0.2% |
0.1% |
|
Westlands |
11,974 |
101 |
74.0% |
7.6% |
11,975 |
104 |
74.4% |
7.8% |
(2.4%) |
(0.3%) |
(0.2%) |
|
Parklands |
10,763 |
92 |
77.2% |
7.4% |
10,958 |
93 |
79.9% |
8.2% |
(0.8%) |
(2.7%) |
(0.8%) |
|
Kilimani |
12,187 |
92 |
78.6% |
6.7% |
12,233 |
93 |
79.1% |
6.8% |
(0.4%) |
(0.5%) |
(0.1%) |
|
Upperhill |
12,524 |
95 |
74.8% |
6.8% |
12,684 |
92 |
78.5% |
6.9% |
2.5% |
(3.7%) |
(0.1%) |
|
Nairobi CBD |
12,110 |
81 |
80.9% |
6.6% |
11,889 |
82 |
82.4% |
6.8% |
(1.0%) |
(1.5%) |
(0.2%) |
|
Thika Road |
12,417 |
76 |
74.4% |
5.3% |
12,500 |
80 |
76.1% |
5.8% |
(4.7%) |
(1.7%) |
(0.4%) |
|
Mombasa road |
11,167 |
72 |
61.6% |
4.7% |
11,313 |
73 |
63.0% |
4.8% |
(1.8%) |
(1.4%) |
(0.1%) |
|
Average |
12,228 |
92 |
76.3% |
6.8% |
12,280 |
93 |
77.7% |
7.0% |
(0.9%) |
(1.4%) |
(0.2%) |
Source: Cytonn Research 2021
We have a NEGATIVE outlook for the NMA commercial office sector attributed to the reduced demand of commercial office spaces brought about by the COVID-19 pandemic amid tough economic environments as firms continue to downsize due to financial constrains while others embrace the working from home strategy and may make it a permanent measure with the third wave of the pandemic making it worse. Landlords are expected to continue adopting strategies to cushion themselves against the impacts of the pandemic such as giving discounts and concessions to attract and retain clients. The sector is however expected to recover in the long run as the economy picks up. Investment opportunity lies in Gigiri and Karen which offer relatively good returns compared to the market averages.
- Retail Sector
The retail sector performance in Q1’2020 recorded a decline of 0.1% points to 7.4% from 7.5% recorded in FY’2020. The average occupancies dropped by 0.2% points from 75.2% in FY’2020 to 75.0% in Q1’2021, the average monthly rents declined by 1.6 % to Kshs 166 per SQFT in Q1’2021 from Kshs 169 per SQFT in FY’2020. The general decline in performance of the sector is attributed to; i) exit by some retailers, both local and international to cushion themselves against the pandemic, ii) constrained spending power among consumers resulting from a tough financial environment, iii) declining occupancy rates due to the reduced demand for physical retail spaces as a result of the shifting focus to e-commerce by some retailers, iv) current oversupply in the retail sector of 2.0 mn SQFT in the Kenyan retail market and 3.1 mn SQFT in the NMA Metropolitan Area. However, some of the factors that continue to cushion the performance of the sector include: i) continued improvement of infrastructure opening up areas for investment, ii) relatively high population growth rate, and, iii) investor confidence due to the ease of doing business in Kenya, having been ranked position #56 by World Bank in the ease of doing business.
The performance of the retail sector in Nairobi over time is as shown below:
(All values in Kshs unless stated otherwise)
|
Summary of performance overtime |
||||||
|
Item |
Q1'2020 |
H1'2020 |
Q3'2020 |
FY'2020 |
Q1’2021 |
∆ Q1’2021 |
|
Average Asking Rents (Kshs/SQFT) |
173 |
170 |
169 |
169 |
166 |
(1.6%) |
|
Average Occupancy (%) |
76.3% |
74.0% |
74.2% |
75.2% |
75.0% |
(0.2%) points |
|
Average Rental Yields (%) |
7.7% |
7.4% |
7.4% |
7.5% |
7.4% |
(0.1%) points |
Source: Cytonn Research 2021
In terms of the sub markets analysis, Westlands and Karen were the best performing nodes recording average rental yields of 10.1% compared to the overall market average of 7.4%. The performance is attributed to presence of affluent residents who have a high consumer purchasing power with the areas hosting high end income earners, the ease of access to the areas, and, relatively high occupancy rates of above 81.0% against the market average of 74.9%.
Eastlands recorded the lowest yields of 5.5%, 1.9% points lower than the average market rates of 7.4%, the performance is attributed to low rental charges of Kshs 132 per SQFT against a market average of Kshs 167 Per SQFT, competition from informal retail spaces, and constrained consumer purchasing power.
The table below shows the submarket performance in the Nairobi Metropolitan Area (NMA):
(All values in Kshs unless stated otherwise)
|
Nairobi Metropolitan Area Retail Market Performance Q1’2021 |
|||||||||
|
Area |
Rent (Kshs) /SQFT Q1'2021 |
Occupancy% Q1'2021 |
Rental Yield Q1'2021 |
Rent (Kshs) /SQFT FY’ 2020 |
Occupancy FY’ 2020 |
Rental Yield FY’ 2020 |
Q1’ 2021 ∆ in Rental Rates |
Q1’ 2021 ∆ in Occupancy (% points) |
Q1’ 2021∆ in Rental Yield (% points) |
|
Westlands |
205 |
84.5% |
10.1% |
209 |
81.5% |
9.9% |
(2.0%) |
3.0% |
0.2% |
|
Karen |
219 |
82.6% |
10.1% |
217 |
81.0% |
9.8% |
1.1% |
1.6% |
0.3% |
|
Kilimani |
173 |
83.8% |
8.7% |
171 |
82.5% |
8.5% |
0.9% |
1.3% |
0.2% |
|
Ngong Road |
178 |
75.0% |
7.6% |
178 |
80.3% |
8.2% |
(0.4%) |
(5.3%) |
(0.5%) |
|
Kiambu road |
163 |
70.8% |
6.7% |
176 |
67.5% |
6.9% |
(8.1%) |
3.3% |
(0.2%) |
|
Mombasa road |
139 |
73.0% |
6.0% |
140 |
70.0% |
5.9% |
(0.7%) |
3.0% |
0.1% |
|
Satelite towns |
138 |
72.4% |
6.0% |
133 |
73.0% |
5.8% |
4.0% |
(0.6%) |
0.2% |
|
Thika Road |
148 |
66.8% |
5.6% |
158 |
70.5% |
6.3% |
(6.2%) |
(3.7%) |
(0.7%) |
|
Eastlands |
132 |
66.0% |
5.5% |
137 |
70.2% |
6.1% |
(3.5%) |
(4.2%) |
(0.5%) |
|
Average |
166 |
75.0% |
7.4% |
169 |
75.2% |
7.5% |
(1.6%) |
(0.2%) |
(0.1%) |
Source: Cytonn Research 2021
Other notable highlights in the retail sector in Q1’2021 include:
- Naivas Supermarket announced plans to open its 70th retail store at Kilifi Complex Centre in Kilifi taking up the 25,000 SQFT space previously occupied by troubled retailer Tuskys. This follows the opening of other outlets such as Ananas Mall in Thika, Hazina Towers, and Prestige Plaza among others. For more analysis, please see Cytonn Weekly #03/2021,
- Giordano, a Hong Kong clothing retailer, opened its 3rd store in Nairobi at Two Rivers Mall along Kiambu Road, taking up 1,076 SQFT space. The two other outlets by the retailer which were opened in 2020 are located at the Garden City Mall along Thika Road and at the Junction Mall along Ngong Road. For more analysis, please see Cytonn Monthly-January 2021,
- French Retailer Carrefour opened 3 new outlets in: i) Westgate Mall in Westlands, taking up approximately 15,000 SQFT of space previously occupied by Shoprite, ii) Nextgen Mall along Mombasa Road taking up approximately 18,000 SQFT of space previously occupied by Souk Bazar supermarket, and iii) Centre Point Mall in Diani, Kwale County taking up approximately 10,000 SQFT of space occupied by former retail giant Nakumatt. For more analysis, please see Cytonn Monthly-February 2021, Cytonn Weekly #05/2021, and, Cytonn Weekly #07/2021,
- Kentucky Fried Chicken (KFC), a US fast food chain, opened a new branch in Mombasa County, in an expansion drive that saw it take up approximately 2200 SQFT of space in Mombasa Trade Centre, marking its first outlet in the county and raising its national branch count to 24. For more analysis, please see Cytonn Weekly #11/2021, and,
- QuickMart Supermarket, a local retailer opened up a retail store in Eldoret at Eldo Center Mall taking up space that was previously occupied by struggling retailer Tuskys. This brings the total number of outlets opened by the retailer to 39 with two outlets opened this year. Eldoret has remained an attractive investment area for retailers supported by; i) positive demographics with Eldoret having a population of 475,715 an increase by 64.4%, from 289,340 in 2009, ii) a growing middle class, and, iii) improving infrastructure. In terms of performance, according to the Cytonn Kenya Retail Report 2020, Eldoret had the highest occupancy rates at 80.2%, 3.6% points higher than the market average of 76.6%, however, Eldoret recorded rental yields of 5.9%, 0.8% lower than the market averages due to limited quality retail space supply and competition from informal retail markets.
The table below shows a summary of retail performance in key urban cities in Kenya;
All Values in Kshs Unless Stated Otherwise
|
Summary of Retail Performance in Key Urban Cities in Kenya |
|||
|
Region |
Rent/SQFT 2020 |
Occupancy% 2020 |
Rental Yield 2020 |
|
Mount Kenya |
125.0 |
78.0% |
7.7% |
|
Nairobi |
168.5 |
74.5% |
7.5% |
|
Mombasa |
114.4 |
76.3% |
6.6% |
|
Kisumu |
97.2 |
74.0% |
6.3% |
|
Eldoret |
130.0 |
80.2% |
5.9% |
|
Nakuru |
55.7 |
76.6% |
5.9% |
|
Average |
115.1 |
76.6% |
6.7% |
Source: Cytonn research 2020
The table below shows the number of stores of key local and international retail supermarket chains in Kenya:
|
Name of Retailer |
Highest No. of Branches that ever Existed as at FY’2020 |
Number of Branches Opened in 2021 |
Closed Branches |
Current Number of Branches |
|
Naivas Supermarket |
69 |
1 |
0 |
70 |
|
Tuskys |
64 |
0 |
59 |
5 |
|
QuickMart |
37 |
2 |
0 |
39 |
|
Chandarana Foodplus |
20 |
0 |
0 |
20 |
|
Carrefour |
9 |
3 |
0 |
12 |
|
Uchumi |
37 |
0 |
33 |
4 |
|
Game Stores |
3 |
0 |
0 |
3 |
|
Choppies |
15 |
0 |
13 |
2 |
|
Shoprite |
4 |
0 |
2 |
2 |
|
Nakumatt |
65 |
0 |
65 |
0 |
|
Total |
323 |
6 |
172 |
157 |
Source: Online Research
We retain a NEUTRAL outlook for the retail sector with the performance expected to be affected by factors such as shift towards e-commerce reducing need for physical retail spaces, ii) reduced purchasing power among consumers amid a tough economic environment, iii) reduced rental rates as landlords offer rental concessions and discounts to retain tenants. However, the performance of the retail sector is expected to be cushioned by, i) expansion by local and international retailors, ii) improving infrastructure opening up areas for investment, positive demographics, and iii) investor confidence due to the ease of doing business in Kenya, having been ranked position #56 by World Bank.
- Hospitality Sector
During the quarter, the Kenya National Bureau of Statistics (KNBS), released the Leading Economic Indicators (LEI) December 2020, indicating that the total number of international arrivals through Jomo Kenyatta International Airport (JKIA) and Moi International Airport (MIA) rose by 48.7% from 31,875 persons in November 2020 to 47,406 persons in December 2020.
The graph below shows the number of international arrivals in Kenya in the last five years;
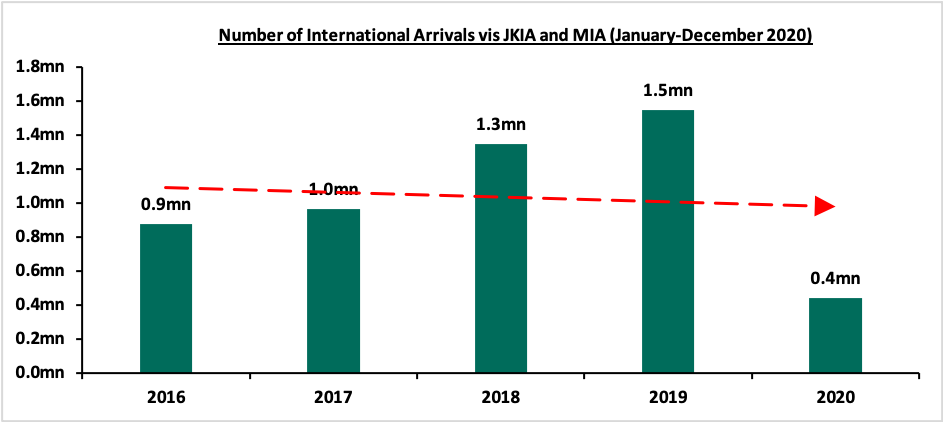
Source: Kenya National Bureau of Statistics
Despite this, the hospitality sector remains the hardest hit by the COVID-19 pandemic which resulted in reduced demand for hospitality facilities and services given the overreliance on tourism and MICE. The current lockdown has made matters worse with individuals operating in the hospitality sector witnessing reduced activities, low occupancies for hotels and serviced apartments, and others being forced to halt their operations.
A highlight of the quarter was;
- The Kenyan National Treasury cut the Ministry of Tourism budget by 3.4 bn to 9.4 bn from 12.8 bn in the proposed Supplementary Budget Estimates for the 2020/2021 fiscal year in an effort to reduce funds meant for tourism marketing. This comes at a time when the hard-hit sector has been recovering from the effects of the Covid-19 pandemic following the government’s Post-Corona Hospitality Sector Recovery Stimulus by offering financial aid from Ministry of Tourism through the Tourism Finance Corporation (TFC) and other international agencies, repackaging of the tourism sector to appeal to domestic tourists, and relaxation of travel advisories. However, we expect the move by the National Treasury to constrain the recovery plans in the hospitality sector with the current Covid-19 restrictions on bars, restaurants and eateries in Nairobi, Nakuru, Machakos, Kajiado and Kiambu expected to affect accommodation and food services sector which will have a downturn on the hospitality sector performance.
We expect the hospitality sector to record subdued performance with the reduced budgetary allocation expected to hamper recovery efforts while the lockdown restrictions will affect accommodation and food services hence reduced occupancy rates in hotels.
- Land Sector
The land sector has continued to show resilience in Q1’2021 recording an average annualized capital appreciation of 2.8%, indicating that people consider land as a good investment asset in the long run despite the pandemic. The satellite towns recorded the highest annual capital appreciation of 7.2%, this is attributed to the affordability of land, continued focus on affordable housing and improving infrastructure opening up the areas for development.
The table below shows the performance of the sector during the quarter:
All Values in Kshs Unless Stated Otherwise
|
Summary of the Performance Across All regions Q1’2021 |
|||
|
|
Q1'2020 |
Q1'2021 |
Annualized Capital Appreciation |
|
Un-serviced land-Satelite Towns |
24.5 mn |
25.6 mn |
7.2% |
|
Nairobi Suburbs- Low Rise Residential Areas |
86.8 mn |
89.9 mn |
4.6% |
|
Serviced land-Satelite Towns |
14.5 mn |
15.0 mn |
3.8% |
|
Nairobi Suburbs- High Rise Residential Areas |
136.3 mn |
134.1 mn |
0.5% |
|
Nairobi Suburbs- Commercial Areas |
419.2 mn |
410.2 mn |
(2.0%) |
|
Average |
136.2 mn |
135.0 mn |
2.8% |
Source: Cytonn Research 2021
Performance per node
- The asking land prices for the Unserviced land in satellite towns recorded an annualized capital appreciation of 7.2%, this is attributed increased demand for development land, and focus on affordable housing. Ruaka had the highest land prices per acre of Kshs 93.4 mn compared to the market average of Kshs 25.6 mn.
All values is Kshs unless stated otherwise
|
Satellite Towns - Unserviced Land |
|||
|
Location |
Q1'2020 |
Q1’2021 |
Annualized Capital Appreciation |
|
Juja |
10.2 mn |
11.3 mn |
10.5% |
|
Athi River |
3.8 mn |
4.1 mn |
8.6% |
|
Ongata Rongai |
11.4 mn |
12.4 mn |
8.5% |
|
Utawala |
12.9 mn |
13.9 mn |
7.6% |
|
Limuru |
17.5 mn |
18.5 mn |
5.5% |
|
Ruaka |
91.0 mn |
93.4 mn |
2.7% |
|
Average |
24.5 mn |
25.6 mn |
7.2% |
Source: Cytonn Research 2021
- The asking prices of land in the low rise areas recorded an annual capital appreciation of 4.6% attributable to high demand in the areas. These areas have also remained attractive due to their exclusivity and privacy with the areas being attractive for family units as they are sparsely populated.
All values is Kshs unless stated otherwise
|
Low Rise Residential Areas |
|||
|
Location |
Q1'2020 |
Q1'2021 |
Annualized Capital Appreciation |
|
Kitisuru |
77.4 mn |
83.7 mn |
8.2% |
|
Runda |
70.2 mn |
74.8 mn |
6.5% |
|
Ridgeways |
65.2 mn |
69.0 mn |
5.8% |
|
Karen |
57.0 mn |
59.0 mn |
3.5% |
|
Spring Valley |
164.3 mn |
162.9 mn |
(0.9%) |
|
Average |
86.8 mn |
89.9 mn |
4.6% |
Source: Cytonn Research 2021
- The serviced land in satelite towns recorded an average annualized capital appreciation of 4.7% with Thika being the best performing area recording an average annualized capital appreciation of 10.5%. Ruai recorded a price correction of (6.4%) attributed to reduced demand of land as investors focus on areas witnessing more real estate related activities.
All values is Kshs unless stated otherwise
|
Satellite Towns- Serviced Land |
|||
|
Location |
Q1'2020 |
Q1’2021 |
Annualized Capital Appreciation |
|
Thika |
10.1 mn |
11.2 mn |
10.5% |
|
Ruiru |
21.1 mn |
23.0 mn |
9.0% |
|
Ongata Rongai |
16.7 mn |
17.9 mn |
7.3% |
|
Syokimau-Mlolongo |
12.0 mn |
12.6 mn |
4.8% |
|
Athi River |
12.8 mn |
13.2 mn |
3.1% |
|
Ruai |
14.0 mn |
13.1 mn |
(6.4%) |
|
Average |
14.5 mn |
15.0 mn |
4.7% |
Source: Cytonn Research 2021
- The asking land prices in the high rise residential areas recorded a 0.5% annualized capital appreciation with Kasarani being the best perform node at 5.2% as the price has remained low at Kshs 68.1 mn compared an average of Kshs 134.1 mn. The attractiveness is also supported by developers showing interest in the area to accommodate the growing middle income population and availability of infrastructure with the area being served by Thika Road. Kileleshwa registered an 3.6% price correction attributed to reduced demands as investors continue to explore more affordable land options with an acre averaging at Kshs 301.1mn compared to the market average of Kshs 134.1mn per acre.
All values is Kshs unless stated otherwise
|
High Rise Residential Areas |
|||
|
Location |
Q1'2020 |
Q1'2021 |
Annualized Capital Appreciation |
|
Kasarani |
64.7 mn |
68.1 mn |
5.2% |
|
Embakasi |
68.7 mn |
71.0 mn |
3.3% |
|
Dagoretti |
99.2 mn |
96.4 mn |
(2.9%) |
|
Kileleshwa |
312.4 mn |
301.1 mn |
(3.6%) |
|
Average |
136.3 mn |
134.1 mn |
0.5% |
Source: Cytonn Research 2021
- The commercial zones recorded a 2.0% price correction in the average asking land prices. This is attributed to the decrease demand for development land mainly due to the high asking prices of Kshs 410.2 mn per acre thus limiting the ability of developers to generate favorable returns from the investments. The existing oversupply in the commercial office spaces of 6.3 mn SQFT and 2.0 mn SQFT in the Nairobi metropolitan area has also affected the supply since developers have halted their plans to allow for absorption of the existing spaces. Upperhill recorded the highest price correction of (3.4%) attributable reduced demand brought about by unaffordability as land in the area costs Kshs 488.8 mn per acre against the commercial zone average of Kshs 410.2mn per acre.
All values is Kshs unless stated otherwise
|
Commercial Zones |
|||
|
Location |
Q1'2020 |
Q1’2021 |
Annualized Capital Appreciation |
|
Riverside |
350.9 mn |
348.3 mn |
(0.7%) |
|
Westlands |
421.3 mn |
415.4 mn |
(1.4%) |
|
Kilimani |
398.5 mn |
388.4 mn |
(2.5%) |
|
Upper Hill |
506.1 mn |
488.8 mn |
(3.4%) |
|
Average |
419.2 mn |
410.2 mn |
(2.0%) |
Source: Cytonn Research
Despite the current decline in real estate related activities as a result of the effects of the COVID-19 pandemic, the land sector has continued to show resilience, the performance of the land sector has been cushioned by various factors including i) growing demand for land to develop especially in the satelite towns, ii) improving infrastructure, iii) positive demographics, iv) continued focus on the affordable housing initiative.
- Infrastructure Sector
Highlights in the sector during Q1’2020 include;
- The National Treasury proposed an allocation of Kshs 200.0 bn to the State Department of Infrastructure. The proposal is expected to increase the budget allocation to the infrastructure sector by 16.0% from Kshs 172.4 bn allocated in the financial year 2020/2021. For more information, please see Cytonn Monthly-January 2021, and,
- The Kenya Urban Roads Authority (KURA) announced the construction of a Kshs 907.2 mn 8-Kilometre road in Nairobi’s Umoja-Innercore aimed at improving access into the area. The project is expected to include a 7-meter wide two-lane carriageway, a footpath, bus bays, drainage facilities, road markings and street lighting. For more information, see Cytonn Weekly #06/2021.
The expected increase in the infrastructure budget allocation is expected to boost the implementation of select infrastructural projects thus opening up areas for development hence boosting the real estate sector. This will be in line with the country’s economic expansion goals to make Kenya the African hub for transportation, industrial, and services sectors. Despite the reduced budget allocation to the sector some of the other ongoing infrastructural projects include; i) the Nairobi Express way, ii) Nairobi Western Bypass, iii) Lamu Port Access Road, and, iv) the Mombasa Port Development Project among others.
- Statutory Review
During the Q1’2021;
- The Kenya’s National Treasury announced plans to draft a national property rating legislation to replace the outdated Valuation for Rating Act of 1956and the Rating Act of 1963. The agency seeks to overhaul the 1956 property valuation laws in a bid to determine new land rates and ensure inclusion of more property owners into the tax bracket. For more information, please see Cytonn Weekly #01/2021, and,
- The Landlord and Tenant Bill of 2021was tabled in Parliament with the aim of consolidating the laws relating to the renting of business and residential premises and regulating the relationship between the landlord and tenant in order to promote stability in the rental sector. For more information, please see Cytonn Weekly #11/2021.
- Listed Real Estate
During Q1’2021, the Fahari I-REIT reported a 17.2% price increase its share price closing the quarter at Kshs 6.8 per having opened the year trading at Kshs 5.8 per share. The share price remains low compared to Net Asset Value of the REIT at Kshs 20.9 having lost 68.0% from its initial trading price of Kshs 20.0 in November 2015.The graph below shows performance of the Fahari I-REIT since inception;
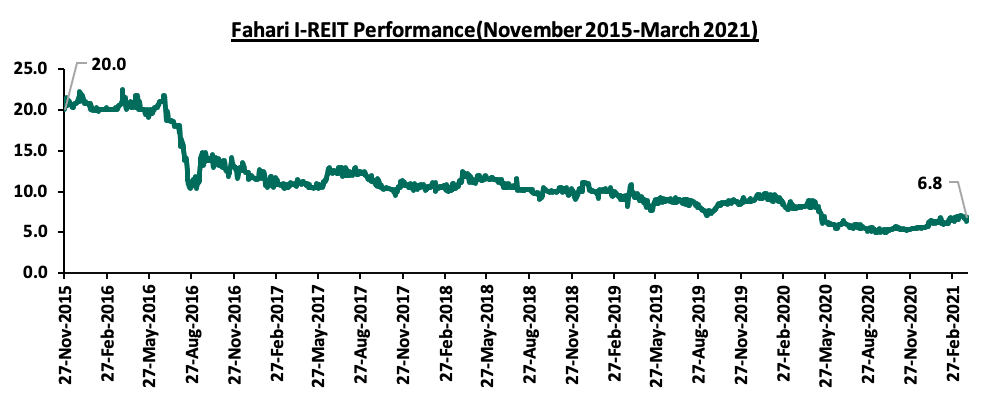
During the week, student hostels developer Acorn Holdings, announced that it had raised a total of Kshs 2.1 bn from investors in issuance of its development real estate investment trust (D-REIT) and income REIT (I-REIT) thus falling short of its Kshs 7.5 bn target. The total performance of the two REITs stands at 28.0% with the D-REIT at 18.7% and the I-REIT at 8.6% having raised Kshs 1.4 bn for the D-REIT raised and Kshs 641.5 mn for the I-REIT. According an early statement Kshs 1.0 bn of the REIT money was raised from InfraCo, a United Kingdom-funded private infrastructure development group. For more information, Cytonn Weekly #09/2021.
We expect the REIT market to pick up signaling hope for the real estate sector developers to raise funds to finance their investments from the Capital Markets. However, REITs performance is expected to be constrained by i) insufficient institutional-grade real estate assets, ii) lack of investor appetite in the instruments, iii) high minimum investment amounts set at Kshs 5.0 mn that is over 100x the median income in Kenya, and, iv) low investor knowledge.
Real Estate Performance Summary and Outlook
Below is a summary of the sectorial performance in H1’2020 and investment opportunities:
|
Theme |
Thematic Performance and Outlook Q1’2021 |
Outlook |
|
Residential |
|
Neutral |
|
||
|
Office |
|
Negative |
|
||
|
Retail |
|
Neutral |
|
||
|
Hospitality |
|
Neutral |
|
||
|
Land |
|
Positive |
|
||
|
Listed Real Estate |
|
Neutral |
The outlook of the real estate sector is positive for one sector-land, neutral for four sectors-residential, retail, hospitality and listed real estate, and negative for one sector-commercial office. Therefore, our overall outlook for the real estate sector is NEUTRAL, supported by; positive demographics, improving infrastructure, continued focus on the affordable housing font, and improved access to mortgages. The performance of the sector is likely to be constrained by the existing oversupply in the commercial office font and the retail sector, reduced consumer purchasing power brought about by the tough economic environment and reduced demand as businesses downsize especially in the commercial office sector and the retail sector.
Disclaimer: The views expressed in this publication are those of the writers where particulars are not warranted. This publication, which is in compliance with Section 2 of the Capital Markets Authority Act Cap 485A, is meant for general information only and is not a warranty, representation, advice or solicitation of any nature. Readers are advised in all circumstances to seek the advice of a registered investment advisor.

- Talk to us
- Kenya
- P.O Box 20695 - 00200, Nairobi, Kenya
- Cell +254709101200
- Tel +254709101200
- WhatsApp +254741676635
- United States
- +254709101200
- DOWNLOAD OUR APP
-


- Kenya
- 8th Floor, Pinetree Plaza, Kaburu Drive, Ngong Road, Nairobi, Kenya
- USA
- Suite 1150, 1775 Eye Street NW, USA, Washington DC 20006, USA
- Investments
- High Yield
- Private Equity
- Real Estate
- Real Estate
- RiverRun Estates
- Cytonn Towers
- The Ridge
- Taraji Heights
- The Alma