Dec 8, 2024
According to the ACTSERV Q3’2024 Pension Schemes Investments Performance Survey, the ten-year average return for segregated schemes over the period 2015 to 2024 was 7.7% with the performance fluctuating over the years reflective of the markets performance. Notably, segregated retirement benefits scheme returns increased to 0.4% return in Q3’2024, up from the 2.9% loss recorded in Q3’2023. The y/y growth in overall returns was largely driven by the 3.0% points increase in returns from Offshore investments to 4.7% from 1.7% in Q3’2023 as well as the 2.1% gain from equities attributable to the positive returns realized from the banking sector stocks. This was however a 6.2% points decline from the overall return of 6.6% recorded in Q2’2024. This week, we shall focus on understanding Retirement Benefits Schemes and look into the quarterly performance and current state of retirement benefits schemes in Kenya with a key focus on Q3’2024.
In our previous report, we highlighted that treasury data revealed that for the FY’2023/2024, Kshs 23.8 bn of pension perks were not released to pensioners, citing liquidity challenges. This was in violation of the fiscal requirement to treat pension payments as the first charge in the budget and affected at least 250,000 retirees. This brought back to light the biggest challenge that the country’s civil servants' pension system has had, the overreliance on the exchequer for payment of benefits. The Government had operated a defined benefits (non-contributory) Pension Scheme since independence fully financed through the Exchequer. Given the clear challenges that this system had and the need for reforms in the Public Service Pensions Sector, the Government enacted the Public Service Superannuation Scheme Act 2012. The Act set up the Public Service Superannuation Scheme in 2021, converting all the defined benefit schemes in the public sector to one defined contributions scheme to align with the best practices in the industry. The now new system took in all government officers below 45 years, and gave those above that age the option to join the new system while closing any new entrants to the previous system. Currently, employees in the scheme contribute 7.5% of their basic salary, while the government contributes 15.0%. The scheme is currently managed by Gen Africa Asset Managers, and of the latest data, has assets under management of Kshs 78.8 bn. Given the country’s fiscal constraints, the older pension scheme is likely to remain under pressure until the new system fully kicks in.
We have been tracking the performance of Kenya’s Pension schemes with the most recent topicals being, Retirement Benefits Schemes Q2’2024 Performance Report, Kenya Retirement Benefits Schemes Q1’2024, Performance Kenya Retirement Benefits Schemes Q4’2023 Performance, Progress of Kenya’s Pension Schemes-2022 and Kenya Retirement Benefits Schemes FY’2021 Performance. This week, we shall focus on understanding Retirement Benefits Schemes and looking into the historical and current state of retirement benefits schemes in Kenya with a key focus on 2023 (latest official data) and what can be done going forward. We shall also analyze other asset classes such as REITs that the schemes can tap into to achieve higher returns. Additionally, we shall look into factors and challenges influencing the growth of the RBSs in Kenya as well as the actionable steps that can be taken to improve the pension industry. We shall do this by looking into the following:
- Introduction to Retirement Benefits Schemes in Kenya,
- Historical and Current State of Retirement Benefits Schemes in Kenya,
- Factors Influencing the Growth of Retirement Benefits Scheme in Kenya,
- Challenges that Have Hindered the Growth of Retirement Benefit Schemes, and,
- Recommendations on Enhancing the Performance of Retirement Benefits Schemes in Kenya;
Section I: Introduction to Retirement Benefits Schemes in Kenya
A retirement benefits scheme is a savings avenue that allows contributing individuals to make regular contributions during their productive years into the scheme and thereafter get income from the scheme upon retirement. There are a number of benefits that accrue to retirement benefits scheme members, including:
- Income Replacement – Retirement savings ensure that your income stream does not stop even when you stop working. After retirement, many people experience a decline in the amount and stability of income relative to their productive years. Retirement savings ensure that this decline is manageable or non-existent and enables you to be able to live the lifestyle you desire even after retirement,
- Compounded and Tax-free interest – Savings in a pension scheme earn compounded interest which means that your money grows faster as the interest earned is reinvested. Additionally, retirement schemes’ investments are tax-exempt meaning that the schemes have more to reinvest,
- Tax-exempt contributions – Pension contributions enjoy a monthly tax relief of up to Kshs 20,000 or 30.0% of your salary whichever is less – this lessens the total PAYE deducted from your earnings,
- Avoid old age poverty – By providing an income in retirement, pension schemes ensure that the scheme members do not experience old age poverty where they have to rely on their family, relatives, and friends for survival, and,
- Home Ownership - Savings in a pension scheme can help you achieve your dream of owning a home. This can be done through a mortgage or a direct residential house purchase using your pension savings. A member may assign up to 60.0% of their pension benefits or the market value of the property, whichever is less, to provide a mortgage guarantee. The guarantee may enable the member to acquire immovable property on which a house has been erected, erect a house, add, or carry out repairs to a house, secure financing or waiver, as the case may be, for deposits, stamp duty, valuation fees and legal fees and any other transaction costs required. On the other hand, a pension scheme member may utilize up to 40.0% of their benefits to purchase a residential house directly subject to a maximum allowable amount of Kshs 7.0 mn and the amount they use should not exceed the buying price of the house.
Section II: Historical and the Current State of Retirement Benefits Schemes in Kenya
- Growth of Retirement Benefits Schemes
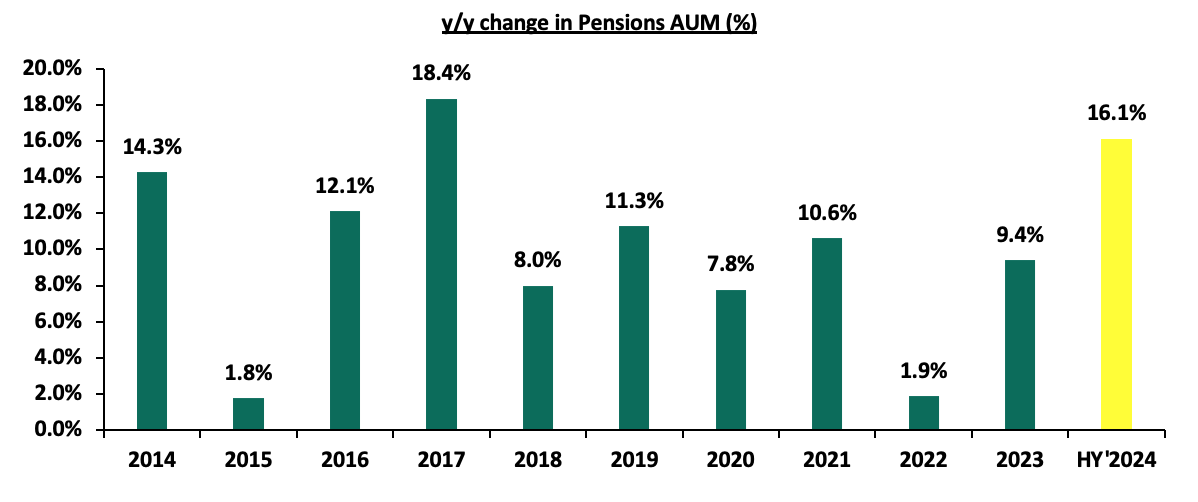
According to the latest Retirement Benefits Authority (RBA) Industry Report for June 2024, assets under management for retirement benefits schemes increased by 14.7% to Kshs 2.0 tn in June 2024 from the Kshs 1.7 tn recorded in December 2023. The growth of the assets is attributed to the improved market and economic conditions during the period as evidenced by improved business conditions, eased inflationary pressures and stability of the exchange rate. The Purchasing Manager’s Index (PMI) for HY’2024 came in at 50.0, up from 48.7 recorded in HY’2023. Additionally, the average inflation rate in HY’2024 came in at 5.6% compared to 8.5% recorded in a similar period in 2023. Notably, on a year-on -year basis, assets under management increased by 16.1% from the Kshs 1.7 tn recorded in June 2023, partly attributable to the enhanced contributions to the mandatory scheme, NSSF, which began in earnest in February 2023 following the court of appeal ruling.
The graph below shows the growth of Assets under Management of the retirement benefits schemes over the last 10 years:
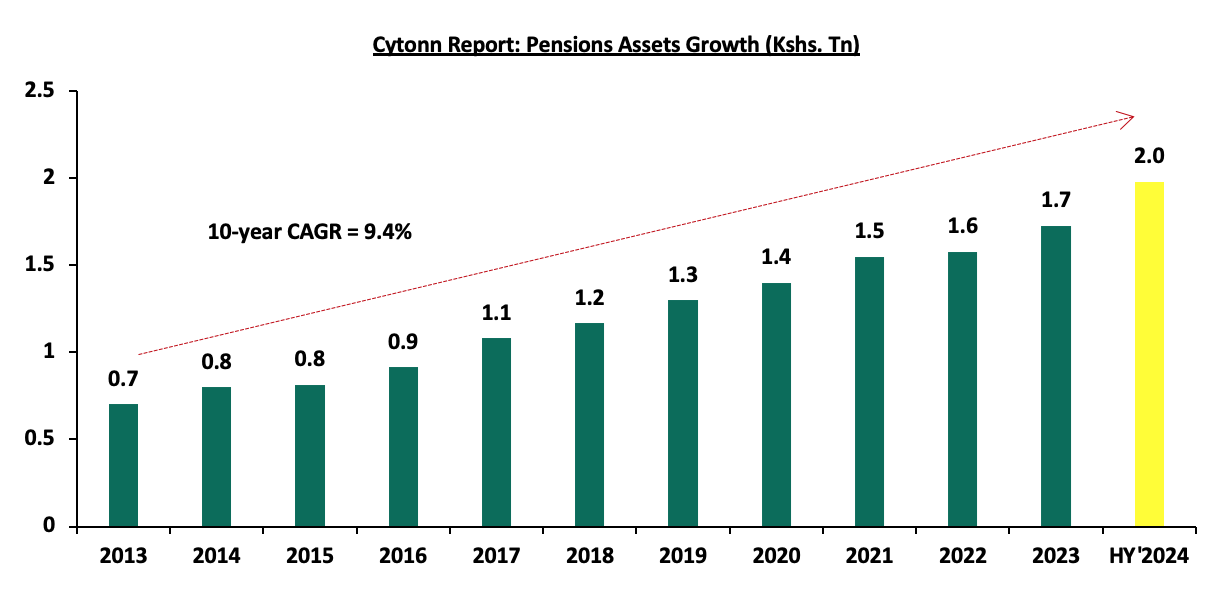
The 16.1% y/y growth to Kshs 2.0 mn in HY’2024 from Kshs 1.7 mn in HY’2023, is 6.7% points increase from the 9.4% growth between 2023 and 2022. Additionally, the 9.4% increase in Assets Under Management is 7.5% points increase in growth from the 1.9% growth that was recorded in 2022, demonstrating the significant role that the enhanced NSSF contributions made to the recovery of the industry’s performance following a difficult period in 2022.
The chart below shows the y/y changes in the assets under management for the schemes over the years.
Despite the continued growth, Kenya is characterized by a low saving culture with research by the Federal Reserve Bank only 14.2% of the adult population in the labor force save for their retirement in Retirement Benefits Schemes (RBSs).
The graph below shows the Assets under Management of Pensions against other Capital Markets products and bank deposits:
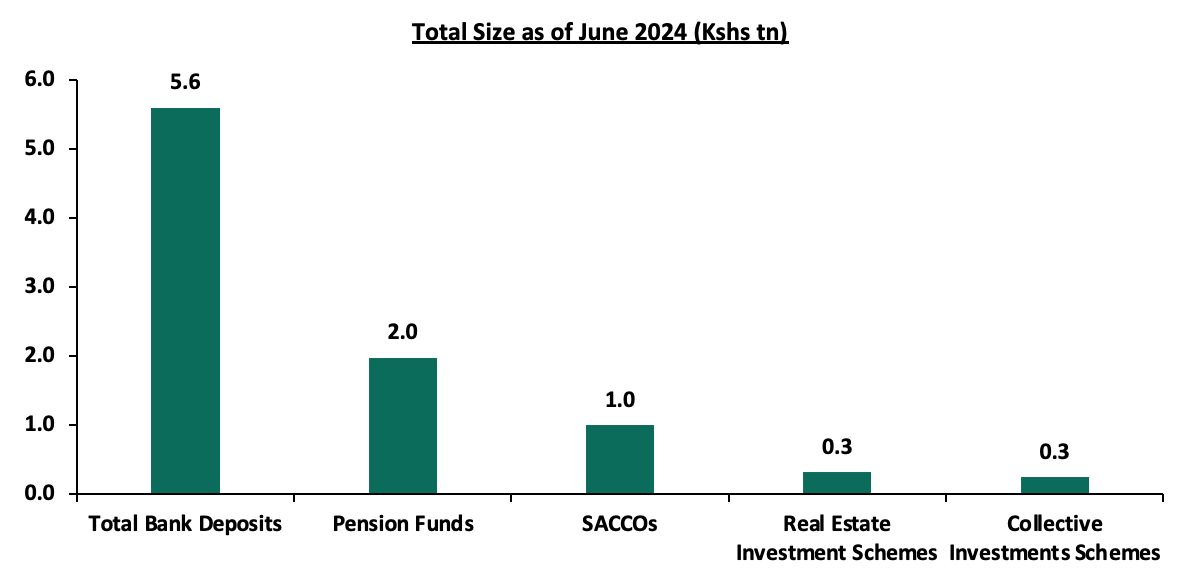
Sources: CMA, RBA, SASRA and REIT Financial Statements
- Retirement Benefits Schemes Allocations and Various Investment Opportunities
Retirement Benefits Schemes strategically allocate funds across various asset classes available in the market to safeguard members' contributions while striving to generate attractive returns. These schemes have access to a diverse range of investment opportunities, including traditional asset classes such as equities and fixed income securities. Additionally, they can explore alternative investments such as real estate, private equity, infrastructure, and other non-traditional assets, which may offer higher returns and diversification benefits. The choice of investments is guided by the scheme's Investment Policy Statement (IPS), regulatory guidelines, and the need to align with the risk tolerance and long-term goals of the members. As such, the performance of Retirement Benefits Schemes in Kenya depends on a number of factors such as;
- Asset allocation,
- Selection of the best-performing security within a particular asset class,
- Size of the scheme,
- Risk appetite of members and investors, and,
- Investment horizon.
The Retirement Benefits (Forms and Fees) Regulations, 2000 offers investment guidelines for retirement benefit schemes in Kenya in terms of the asset classes to invest in and the limits of exposure to ensure good returns and that members’ funds are hedged against losses. According to RBA’s Regulations, the various schemes through their Trustees can formulate their own Investment Policy Statements (IPS) to Act as a guideline on how much to invest in the asset option and assist the trustees in monitoring and evaluating the performance of the Fund. However, the Investment Policy Statements often vary depending on risk-return profile and expectations mainly determined by factors such as the scheme’s demography and the economic outlook.
The Retirement Benefits Authority (RBA) regulations also emphasize the importance of diversification as a key principle in managing pension funds. By setting limits on exposure to specific asset classes, the regulations mitigate the risks associated with market volatility, ensuring that no single investment disproportionately affects the scheme's overall performance. Trustees are required to regularly review and update their Investment Policy Statements (IPS) to reflect changes in market conditions, economic dynamics, and the evolving needs of the scheme's members. This proactive approach not only aligns the investment strategy with the scheme’s objectives but also enhances accountability and transparency in fund management, safeguarding members’ retirement savings. The table below represents how the retirement benefits schemes have invested their funds in the past:
|
Cytonn Report: Kenyan Pension Funds’ Assets Allocation |
||||||||||||||
|
Asset Class |
2014 |
2015 |
2016 |
2017 |
2018 |
2019 |
2020 |
2021 |
2022 |
2023 |
HY’2024 |
Average |
Limit |
|
|
Government Securities |
31.0% |
29.8% |
38.3% |
36.5% |
39.4% |
42.0% |
44.7% |
45.7% |
45.8% |
47.5% |
51.1% |
41.1% |
90.0% |
|
|
Quoted Equities |
26.0% |
23.0% |
17.4% |
19.5% |
17.3% |
17.6% |
15.6% |
16.5% |
13.7% |
8.4% |
8.8% |
16.7% |
70.0% |
|
|
Immovable Property |
17.0% |
18.5% |
19.5% |
21.0% |
19.7% |
18.5% |
18.0% |
16.5% |
15.8% |
14.0% |
11.9% |
17.3% |
30.0% |
|
|
Guaranteed Funds |
11.0% |
12.2% |
14.2% |
13.2% |
14.4% |
15.5% |
16.5% |
16.8% |
18.9% |
20.8% |
20.5% |
15.8% |
100.0% |
|
|
Listed Corporate Bonds |
6.0% |
5.9% |
5.1% |
3.9% |
3.5% |
1.4% |
0.4% |
0.4% |
0.5% |
0.4% |
0.4% |
2.5% |
20.0% |
|
|
Fixed Deposits |
5.0% |
6.8% |
2.7% |
3.0% |
3.1% |
3.0% |
2.8% |
1.8% |
2.7% |
4.8% |
2.7% |
3.5% |
30.0% |
|
|
Offshore |
2.0% |
0.9% |
0.8% |
1.2% |
1.1% |
0.5% |
0.8% |
1.3% |
0.9% |
1.6% |
2.0% |
1.2% |
15.0% |
|
|
Cash |
1.0% |
1.4% |
1.4% |
1.2% |
1.1% |
1.2% |
0.9% |
0.6% |
1.1% |
1.5% |
1.2% |
1.1% |
5.0% |
|
|
Unquoted Equities |
0.0% |
0.4% |
0.4% |
0.4% |
0.3% |
0.3% |
0.2% |
0.2% |
0.3% |
0.2% |
0.2% |
0.4% |
5.0% |
|
|
Private Equity |
0.0% |
0.0% |
0.0% |
0.0% |
0.1% |
0.1% |
0.1% |
0.2% |
0.2% |
0.3% |
0.4% |
0.1% |
10.0% |
|
|
REITs |
0.0% |
0.0% |
0.1% |
0.1% |
0.1% |
0.0% |
0.0% |
0.0% |
0.0% |
0.6% |
0.6% |
0.1% |
30.0% |
|
|
Commercial Paper, non-listed bonds by private companies |
0.0% |
0.0% |
0.0% |
0.0% |
0.0% |
0.0% |
0.0% |
0.0% |
0.0% |
0.0% |
0.2% |
0.0% |
10.0% |
|
|
Others e.g. unlisted commercial papers |
0.0% |
0.0% |
0.0% |
0.0% |
0.0% |
0.0% |
0.0% |
0.1% |
0.2% |
- |
0.0% |
0.0% |
10.0% |
|
|
Total |
100.0% |
100.0% |
100.0% |
100.0% |
100.0% |
100.0% |
100.0% |
100.0% |
100.0% |
100.0% |
|
100.0% |
100.0% |
|
Source: Retirement Benefits Authority
Key Take-outs from the table above are;
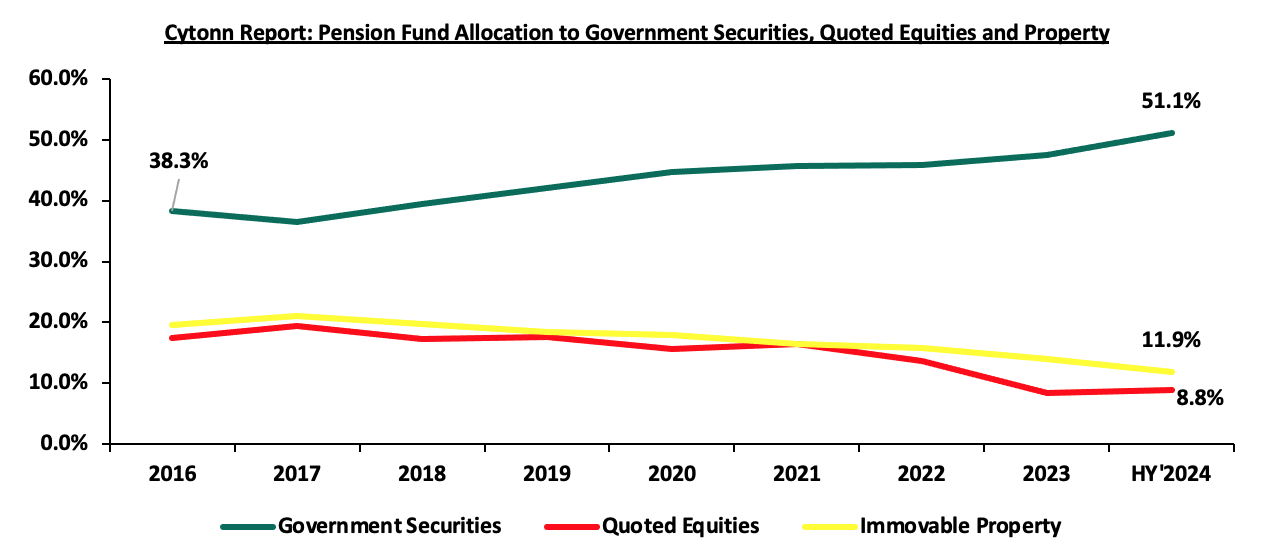
- Schemes in Kenya allocated an average of 57.8% of their members’ funds towards government securities and Quoted Equities between the period of 2013 and end of June 2024. The 41.1% average allocation to government securities is the highest among the asset classes attributable to safety assurances of members’ funds because of low-risk associated with government securities. Notably, allocation towards government securities increased by 3.6% points to 51.1% in HY’2024 from 47.5% in FY’2023 attributable to high yields by the government papers and increased issuance of treasury bonds to finance fiscal deficits as well as increase domestic borrowing during the period,
- The allocation towards quoted equities increased to 8.8% as of June 2024, from 8.4% in December 2023 on the back of improved performance in the Kenyan equities market as evidenced by 19.0% of the NASI index in H1’2024, driven by a recovery in corporate earnings and increased investor confidence. Favourable macroeconomic conditions, such as easing inflation and a strengthened shilling, boosted market sentiment, have encouraged trustees to allocate more funds to equities during the period,
- Retirement Benefits Schemes investments in offshore markets increased by 0.4% points to 2.0% as of June 2024, from 1.6% in December 2023 as a result of the opportunities in developed and emerging markets, and currency hedging strategies that allowed schemes to benefit from foreign exchange gains, and,
- The 0.2% points increase in investment in commercial paper, non-listed bonds issued by private companies was due to an investment of Kshs 3.0 bn in Linzi sukuk bond by one of the schemes during the period.
The chart below shows the allocation by pension schemes on the three major asset classes over the years:
Source: RBA Industry report
- Performance of the Retirement Benefit Schemes
According to the ACTSERV Q3’2024 Pension Schemes Investments Performance Survey, the ten-year average return for segregated schemes over the period 2015 to 2024 was 7.7% with the performance fluctuating over the years to a high of 18.7% in 2017 and a low of 1.4% in 2015 reflective of the markets performance. Notably, segregated retirement benefits scheme returns increased to 0.4% return in Q3’2024, up from the 2.9% loss recorded in Q3’2023. The y/y growth in overall returns was largely driven by the 3.0% points increase in returns from Offshore investments to 4.7% from 1.7% in Q3’2023 as well as the 2.1% gain from equities attributable to the positive returns realized from the banking sector stocks. This was however a 6.2% points decline from the overall return of 6.6% recorded in Q2’2024. The chart below shows the performance of segregated pension schemes since 2013:
Source: ACTSERV Survey Reports (Segregated Schemes)
The key take-outs from the graph include:
- Schemes recorded a 0.4% gain in Q3’2024, representing 6.2% points decrease from the 6.6% gain recorded in Q2’2024. The performance was largely driven by a decline in gain from fixed income investments to the 0.04% gain recorded in Q3’2024, from 8.0% in Q2’2024 largely attributable to declining interest rates across the yield curve, occasioned by easing inflation and decreased government domestic borrowing appetite The decline was however supported by the increase in gains from Offshore assets, recording a 4.7% gain in Q3’2024, from the 1.6% gain recorded in Q2’2024, majorly on the back of investor sentiment shift to opportunities in the global markets, and,
- Returns from segregated retirement funds have exhibited significant fluctuations, ranging from a high of 20.3% recorded in 2013 to a low of 0.4% in HY’2024, highlighting the sensitivity of fund performance to market and economic conditions.
The survey covered the performance of asset classes in three broad categories: Fixed Income, Equity, Offshore, and Overall Return.
Below is a table showing the third quarter performances over the period 2020-2024:
|
Cytonn Report: Quarterly Performance of Asset Classes (2020 – 2024) |
||||||
|
|
Q3'2020 |
Q3'2021 |
Q3'2022 |
Q3’2023 |
Q3'2024 |
Average |
|
Offshore |
11.3% |
1.9% |
(2.8%) |
1.7% |
4.7% |
3.4% |
|
Equity |
5.1% |
5.2% |
6.3% |
(10.4%) |
2.1% |
1.7% |
|
Fixed Income |
4.0% |
2.9% |
2.3% |
(1.5%) |
0.04% |
1.5% |
|
Overall Return |
4.2% |
3.4% |
3.0% |
(2.9%) |
0.4% |
1.6% |
Source: ACTSERV Surveys
Key take-outs from the table above include;
- Returns from Fixed Income recorded an increase of 1.5% points to 0.04% in Q3’2024 from the 1.5% loss recorded in Q3’2023. This performance in Q3’2024 is partially attributable to improved market conditions compared to a similar period in 2023, as evidenced by the higher yields on government securities and improved investor sentiment towards government debt instruments as well as an ease in inflationary pressures with the average inflation rate for Q3’2024 coming in at 4.1% from in 6.9% Q3’2023,
- Returns from Equity investments also recorded a significant increase by 12.5% points to a 2.1% gain in Q3’2024, from the 10.4% loss recorded in Q3’2023. The performance was partly attributable to positive investor sentiment and renewed investor confidence following the performance of the Kenyan currency this year, having gained by 17.4% on a year-to-date basis, and,
- Returns from the Offshore investments recorded an increase to a 4.7% return in Q3’2024 from the 1.7% recorded in Q3’2023. The performance was partly attributable to favourable global market conditions, including improved economic growth in key international markets and a recovery in international equity and fixed-income assets. Additionally, stable currency performance during this period minimized foreign exchange losses, allowing the investments to benefit purely from the positive returns of the underlying global assets.
Other Asset Classes that Retirement Benefit Schemes Can Leverage on
Retirement benefits schemes have for a long time skewed their investments towards traditional assets, mostly, government securities and the equities market, averaging 57.8% as of 30th June 2024, leaving only 42.2% for the other asset classes. In the asset allocation, alternative investments that include immovable property, private equity as well as Real Estate Investments Trusts (REITs) account for an average of only 17.5% against the total allowable limit of 70.0%. This is despite the fact that these asset classes such as REITs offer benefits such as low-cost exposure to Real Estate and tax incentives hence the potential for better returns. It is vital to note, however, that in HY’2024 the second largest increase in allocation was recorded in investments in private equity by 63.3% to 8.8 bn from 5.4 bn recorded in HY’2023. This is partly attributable to favourable interest rates following monetary policy adjustments creating conducive conditions for private equity investments by reducing the cost of financing and encouraging long-term investments in high-growth sectors. Allocation to immovable property decreased by 4.1% to Kshs 236.3 bn in HY’2024 from Kshs 246.3 bn in HY’2023, while investments in Real Estate Investments Trusts increased by 4.5% to Kshs 11.1 bn in HY’2024 from Kshs 10.6 bn in HY’2023
The graph below shows the y/y change in allocation to the various asset classes;
Source: RBA Industry Report
However, in terms of overall asset allocation, alternative investments still lagged way behind the other asset classes, as demonstrated in the graph below;
Source: RBA Industry Report
We believe that Alternative Investments including REITs would play a big role in improving the performance of retirement benefits schemes;
Alternative Investments (Immovable Property, Private Equity and REITs)
Alternative Investments refers to investments that are supplemental strategies to traditional long-only positions in equities, bonds, and cash. They differ from traditional investments on the basis of complexity, liquidity, and regulations and can invest in immovable property, private equity, and Real Estate Investment Trusts (REITs) to a limit of 70.0% exposure. We believe that Alternative Investments, including REITs, would play a significant role in improving the performance of retirement benefits schemes by providing opportunities for higher returns and enhanced portfolio resilience.
Alternative Investments, such as immovable property, private equity, and REITs, offer not only diversification and competitive long-term returns but also the potential to hedge against inflation. Investments in real assets like immovable property and REITs often benefit from inflationary environments, as property values and rental incomes tend to rise with inflation. Additionally, private equity provides access to high-growth sectors, such as technology and renewable energy, which are less correlated to traditional market movements, offering an attractive risk-adjusted return profile.
Furthermore, REITs in Kenya, particularly Development and Income REITs, present unique opportunities for retirement schemes. They provide exposure to the real estate sector without the liquidity constraints and management challenges associated with direct property ownership. As the Kenyan real estate market continues to mature and regulatory frameworks for REITs improve, these instruments are becoming more viable for retirement funds seeking stable, inflation-protected income streams and long-term growth. By strategically allocating a portion of their portfolio to alternative investments, retirement schemes can enhance overall returns while safeguarding members' contributions against market volatility.
Section III: Factors Influencing the Growth of Retirement Benefit Schemes
The retirement benefit scheme industry in Kenya has registered significant growth in the past 10 years with assets under management growing at a CAGR of 9.4% to Kshs 1.7 tn in FY’2023, from Kshs 0.7 tn in 2013. The growth is attributable to:
- Increased Pension Awareness – More people are becoming increasingly aware of the importance of pension schemes and as such, they are joining schemes to grow their retirement pot which they will use during their golden years. Over the last 20 years, pension coverage has grown from 12.0% to about 26.0% of the labour force. The Retirement Benefits Authority, through their Strategic Plan 2024-2029, aims to further expand this coverage to 34.0% by 2029. This growth reflects industry-wide initiatives to increase awareness among Kenyan citizens on the need for retirement planning and innovations,
- Public-Private partnerships - Public-private partnerships can be instrumental in expanding financial inclusion in the Kenyan pension sector. Collaborations between the government and private financial institutions can lead to the development and promotion of inclusive pension products. In Kenya, the National Social Security Fund (NSSF) is currently licensing and partnering with the private sector (Pension Fund Managers) to invest and manage NSSF Tier II contributions. This is a good example that the government is giving employees, employers, and persons in the informal sector to invest and save for their retirement in the private sector,
- Legislation – The National Assembly, on 1st November 2024, published the Tax Laws (Amendment) Bill 2024. The Bill aims to amend the Income Tax Act by increasing the deductible amount for contributions to registered pension, provident, and individual retirement funds or public pension schemes to Kshs 360,000 annually from Kshs 240,000, and to Kshs 30,000 from Kshs 20,000 monthly. These changes aim to adjust for inflation and modernize deductions that have remained unchanged for over a decade. The revisions are expected to reduce individual taxable income and enhance retirement benefits. In addition, the implementation of the National Social Security Fund Act, 2013 is entering its second year and is expected to foster the growth of the pension industry by allowing both the employees in the formal and informal sector to save towards their retirement, as opposed to the previous NSSF Act cap 258 of 1965, which was only targeting the employees in the formal sector,
- Tax Incentives - Members of Retirement Benefit Schemes are entitled to a maximum tax-free contribution of Kshs 20,000 monthly or 30.0% of their monthly salary, whichever is less. Consequently, pension scheme members enjoy a reduction in their taxable income and pay less taxes. This incentive has motivated more people to not only register but also increase their regular contributions to pension schemes,
- Micro-pension schemes - Micro-pension schemes are tailored to address the needs of Kenyans in the informal sector with irregular earnings. These schemes allow people to make small, flexible contributions towards their retirement. By accommodating their financial realities, micro-pensions can attract a broader segment of the population into the pension sector. Examples of these pension schemes are Mbao Pension Plan and Individual Pension Schemes i.e. Britam Individual Pension Plan where one can start saving voluntarily and any amount towards their retirement,
- Relevant Product Development – Pension schemes are not only targeting people in formal employment but also those in informal employment through individual pension schemes, with the main aim of improving pension coverage in Kenya. To achieve this, most Individual schemes have come up with flexible plans that fit various individuals in terms of affordability and convenience. Additionally, the National Social Security Fund Act, 2013 contains a provision for self-employed members to register as members of the fund, with the minimum aggregate contribution in a year being Kshs 4,800 with the flexibility of making the contribution by paying directly to their designated offices or through mobile money or any other electronics transfers specified by the board,
- Demographics - Kenya’s rising population has played a big role in supporting the pensions industry in Kenya. The young population aged 15-24, currently at a population of 10.4 mn approximately 19.6% of the total population, has grown rapidly with the United Nations projecting that the corresponding population of youth in Kenya aged 15-24 years and ready to join the workforce will increase to 18.0 mn, from 9.5 mn over the period 2015 to 2065. This will support the continuous increase in people joining the workforce and saving for retirement. Which will consequently increase scheme membership significantly,
- Technological Advancement – The adoption of technology into pension schemes has improved the efficiency and management of pension schemes. A notable example of pension technology in Kenya is the M-Akiba platform. This is a mobile-based platform that was developed by the government to enable Kenyans to save for their retirement using their mobile phones. Additionally, the improvement of mobile penetration rate and internet connectivity has enabled members to make contributions and track their benefits from the convenience of their mobile phones, and,
- Financial literacy programs - Financial literacy programs play a vital role in promoting the growth of retirement benefit schemes by enhancing financial inclusion among the public. Educating the public about the benefits of retirement savings and how to navigate pension schemes can empower individuals to take control of their financial future. The Retirement Benefits Authority (RBA) is at the forefront of ensuring the public is educated on financial literacy by organizing free training.
Section IV: Challenges that Have Hindered the Growth of Retirement Benefit Schemes
Despite the expansion of the Retirement Benefit industry, several challenges continue to hinder its growth. Key factors include:
- Market Volatility – In segregated schemes, investment returns are not guaranteed and are subject to market fluctuations. In Q3’2024, the equities market saw a decline of 2.2%, following a 3.2% drop in Q2’2024 and a notable 28% gain in Q1’2024. This level of volatility introduces uncertainty in the growth of retirement savings,
- Low Pension Coverage in the Informal Sector – The informal sector is a significant part of Kenya's economy but is marked by irregular incomes and job insecurity. The Retirement Benefit Statistical Digest 2021 reports that only 266,764 individuals are registered in individual pension schemes. This number is low compared to the 15.2 mn people in the informal sector, representing 83.2% of the total workforce (Kenya National Bureau of Statistics Economic Survey Report 2023). Many in this sector prioritize immediate financial needs over long-term savings, and traditional pension products may not meet their financial realities,
- Inadequate Contributions - Even when individuals are covered by retirement schemes, their contributions are often inadequate to meet future financial needs due to factors such as low disposable income, delayed enrolment in schemes and inadequate contribution rates. Insufficient contributions translate directly into lower payouts upon retirement. For retirees, this can result in financial insecurity, dependence on family or government assistance and inability to meet basic living expenses,
- High Unemployment Rate – According to the Kenya National Bureau of Statistics Q4’2022 labour report, 6% of Kenya’s 29.1 mn working-age population aged between 15-64 years was unemployed. The high unemployment rate poses a significant challenge for many individuals, making it difficult for them to contribute consistently to retirement schemes,
- Low Awareness and Financial Literacy- Many people do not fully understand the importance of saving for retirement or the long-term benefits of participating in a pension plan. This is because many people are unaware of their existence, the benefits they offer, or how to enrol. This is especially prevalent in rural or underserved areas where access to information is limited,
- Premature Access to Savings – Members of individual pension schemes have the ability to withdraw 100.0% of their personal contributions, excluding any transferred employer contributions. On the other hand, members of umbrella and occupational schemes can access up to 50.0% of their benefits before retirement age, typically in cases of job loss or a change of employment. While this option offers immediate financial relief, it reduces the value of retirement savings, which in turn hinders the long-term growth potential of the pension sector,
- Unremitted Contributions – Financial constraints have led some employers to delay or fail to remit pension contributions to umbrella and occupational schemes. As a result, unremitted contributions have increased significantly, growing from Ksh 34.7 billion in 2020 to Ksh 42.8 billion in 2021, according to the Retirement Benefits Statistical Digest 2021, and,
- Delayed Benefit Payments – Simplify the approval process by reducing the number of steps and parties involved. Pension scheme administrators should be given more autonomy in calculating and authorizing payments to speed up the disbursement process. Implement automated systems for calculating and processing benefits, reducing manual intervention and the time spent moving files between service providers.
Section V: Recommendations to Enhance the Growth and Penetration of Retirement Benefit Schemes in Kenya
- Reintroduction of Finance Bill 2024 proposals for the industry – The proposals in the Finance Bill 2024 were forward-thinking for the pensions industry and would be beneficial if reintroduced. These reforms had significant potential to strengthen the retirement system. Shifting the registration of retirement funds from the Commissioner to the Retirement Benefits Authority (RBA) would simplify the process, while expanded tax exemptions on withdrawals for early retirement and health-related needs would provide more equitable support. Extending the pension withdrawal period from 15 to 20 years promotes long-term savings and reduces reliance on government assistance in the future. Additionally, increasing the gratuity tax exemption limit to Ksh 30,000.0 could encourage higher contributions to retirement schemes, though its advantages would primarily benefit high-income earners
- Strengthen Public Education and Awareness –Launch targeted campaigns to educate the public about the importance of retirement planning and the benefits of pension schemes. Conduct workshops and seminars in rural and underserved areas to demystify pension schemes and enhance understanding. The Retirement Benefits Authority (RBA) has recently been at the fore front of this much-needed campaign, organizing seminars, workshops, and roadshows to meet this objective,
- Develop Tailored Pension Products for the Informal Sector – Design micro-pension plans with low, flexible contribution thresholds to suit irregular income patterns in the informal sector. Leverage mobile money platforms and apps to facilitate seamless enrolment, contributions, and tracking of pension accounts.
- Improve Regulatory Framework to Address Unremitted Contributions – The Retirement Benefits Authority (RBA) should increase its monitoring and auditing of employers to ensure timely and full remittance of pension contributions. Employers found non-compliant should face stricter penalties, including fines or legal action, to incentivize timely remittance. For employers facing temporary financial constraints, the RBA could offer the option of negotiating manageable payment plans or extensions to clear overdue contributions, preventing companies from defaulting entirely.
- Streamline the Benefit Payment Process – The process of approving and disbursing retirement benefits should be streamlined to reduce delays. Automating certain steps and creating clear timelines for each stage of the process would help retirees receive their benefits promptly, improving trust and encouraging broader participation in pension schemes,
- Promote Employer Participation in Pension Schemes – The government and industry stakeholders should incentivize all employers to enrol their employees in occupational pension schemes. This can be achieved through tax benefits, financial support programs, or public recognition for employers who consistently contribute to their employees' retirement plans, and,
- Introduce Policy Reforms to Limit Premature Withdrawals –Limit the percentage of pension savings that can be withdrawn before retirement to a lower amount to reduce the impact on long-term retirement savings. Withdrawals should only be allowed for specific emergencies, such as critical illness, with clear documentation and justification. Additionally, schemes could offer workshops and educational materials to help members understand the long-term benefits of saving for retirement and the negative impact of early withdrawals on their future financial security.
These recommendations will definitely foster sustainable growth in Kenya's retirement benefit schemes by addressing some of the structural challenges that currently hinder the sector's potential.
Disclaimer: The views expressed in this publication are those of the writers where particulars are not warranted. This publication, which is in compliance with Section 2 of the Capital Markets Authority Act Cap 485A, is meant for general information only and is not a warranty, representation, advice, or solicitation of any nature. Readers are advised in all circumstances to seek the advice of a registered investment advisor.

- Talk to us
- Kenya
- P.O Box 20695 - 00200, Nairobi, Kenya
- Cell +254709101200
- Tel +254709101200
- WhatsApp +254741676635
- United States
- +254709101200
- DOWNLOAD OUR APP
-


- Kenya
- 8th Floor, Pinetree Plaza, Kaburu Drive, Ngong Road, Nairobi, Kenya
- USA
- Suite 1150, 1775 Eye Street NW, USA, Washington DC 20006, USA
- Investments
- High Yield
- Private Equity
- Real Estate
- Real Estate
- RiverRun Estates
- Cytonn Towers
- The Ridge
- Taraji Heights
- The Alma