Jan 29, 2018
During the year 2017, the Kenyan equities market recorded strong performance with NASI, NSE 25 and NSE 20 gaining by 28.4%, 21.3% and 16.5%, respectively. This performance was driven by gains in large caps such as DTB, KCB Group, Safaricom, Equity Group and Co-operative Bank, which gained 62.7%, 48.7%, 39.7%, 32.5% and 21.2%, respectively. Looking at these indices an investor then wonders which among them is the right measure of the market performance. In this write-up, we seek to lay out what causes the discrepancies in returns and then conclude by pointing out what really is the best benchmark for investors to use when measuring performance.
Introduction: An index is a statistical indicator or a measure of performance. According to FTSE Russell, a stock index is a group of securities chosen to track a particular investment scheme such as a market, asset class, sector, industry, or even a strategy. The collection of securities that make up the index are known as the basket, with each item contributing a certain weight. An index is basically supposed to be a representation of the performance of its constituents, as it would be difficult to track the performance of each individual component on an ongoing basis, especially in a case where the constituents are many. Below are some of the uses of an Index:
- To show the general performance of the market at a particular point in time and over a given period of time,
- Used by portfolio managers as a benchmark, hence measures the performance, and can help determine whether an active or a passive strategy is the right way to go,
- Indices are used as a foundation for developing investment products such as Exchange Traded Funds, which is a marketable security that tracks an index, a bond or a commodity, and,
- To assess the risk of investing in a certain stock, for instance, the risk of investing in a stock listed on NSE is calculated from the variance of the stock’s performance from the index’s performance.
While constructing an index, a couple of things need to be agreed upon in advance:
- Weighting methodology:
Below are the various methods used in weighting an index;
- Market-Capitalization Weighted Index: This index weights constituent securities by market capitalization, “Market - Cap”, which is the number of outstanding shares multiplied by the share price. Most of the indices are market-cap weighted, and include Nairobi Securities Exchange All Share Index (NASI), and FTSE 100. The performance of a market-cap weighted index is mainly influenced by large-cap securities, as is the case for NASI where Safaricom significantly influences the index’s performance. As highlighted in our topical on Safaricom’s 44% of NSE Market Capitalization and Portfolio Construction, Safaricom’s size and stability anchors the value of local equities given that it contributed to 54.7% of the performance of NSE in 2017. The main advantage of a market-cap weighted index is that it actually reflects the behavior of the entire market. However, its main downside is the assumption that all outstanding shares are available for trading, which makes this index not a good benchmark for portfolio managers because the entire market is not investable. Due to this, portfolio managers normally adjust the market-cap weighted index for free float to reflect the shares available for trading. Some of the Market-Capitalization Weighted Index adjusted for Free Float are S&P 500 and MSCI,
- Price-Weighted Index: The weights of each component in the basket is based on the current stock price, implying that securities trading at higher prices account for a higher weight in the index, irrespective of the number of shares outstanding. The advantage of this method of pricing an index is that it is relatively easier, but its disadvantage is that it does not represent the total value of a security and it also ignores the investability of a security hence is not a good representative. Price-weighted indices are not as widely used as market-cap weighted indices. Example of such indices are the Kenyan NSE 20 and the Dow Jones Industrial Average in New York Stock Exchange (NYSE),
- Equally-Weighted Index: In this index, all securities are assigned an equal weight therefore enhancing diversification in the portfolio, which is not easily achieved in the market-cap weighted and price-weighted indices. The main disadvantage of these indices is that substantial investment in the illiquid stocks may cause movements in the market, therefore affecting the ability of the index to reflect performance of the market,
- Risk-Weighted Index: This index assigns weight to a security based on the amount of risk associated with the specific security. In this case, risk is defined as a measure of the volatility of the stock. Therefore, stocks that have recorded more volatility historically get assigned a smaller weight as they are perceived riskier, while those with minimal price movements account for higher weight in the index, and,
- Fundamentally-Weighted Index: This index assigns weight to securities based on the financial condition of a company, which is an assessment of financial performance of the company to determine its intrinsic value. Companies that are more financially stable based on assessment of individual analysts are assigned higher weights. Therefore, a main con with this method is the subjectivity present in determining the intrinsic value of a firm.
- Compositions and Rebalancing:
Given that the market changes occasionally, it warrants changes in the composition of an index, especially where the index does not have all the qualifying components. Most indices have a rebalancing cycle, which stipulates how often stocks are included or excluded from the index. For the NSE 20, the criteria for inclusion of a company is; (i) must have a least 20% of its free float available for trading at the NSE, (ii) must have been continuously quoted for a least 1 year, (iii) must have a minimum market capitalization of Kshs 50.0 mn, (iv) should ideally be a “blue chip” (a blue chip is a company with a track record of superior earnings and a dividend record, hence strong investor sentiments, which makes it highly priced), and (iv) company shares must have their primary listing on the NSE. The all share index, NASI, main changes are based on key corporate actions like splits etc. For both indices, the rebalancing is done on a quarterly basis.
- Calculation methodology:
There are two ways of calculating the value of an index:
- Arithmetic Mean: In this method, the value of an index is obtained by dividing the sum of all market capitalization by the base. This method is simple and easy to apply. The NSE all share index (NASI) applies this method in calculating returns,
- Geometric Mean: This method uses the compounding methodology and is therefore slightly complicated. The geometric mean is calculated by multiplying all the sum of initial capital and returns (Initial capital (1) + returns), taking the n-th root, where n is the period of investment, and subtracting the initial capital (1). The NSE 20 share index uses the Geometric mean to calculate returns.
Usually in most cases, returns obtained using the geometric mean methodology are lower than those obtained using the arithmetic mean methodology.
Having discussed the various ways in which indices are differentiated, we have identified the following characteristics as ideal for a good investable index (benchmark);
- Capped Weighting - Indices should have a cap, above which a particular stock should not exceed in order to maintain diversification and reduce the risk posed by one dominant stock. For example, in our topical, Safaricom’s 44% of NSE Market Capitalization and Portfolio Construction, we identified the Capped Shareholders Weighted Index (SWIX), which rebalances every quarter to cap stocks at 10% of the index, creating less single-stock concentration,
- Free Float Adjustment – Some stocks, despite having a significant weighting, may not be practical for investing as they have very few shares available for trading. The ideal index should factor this in its various constituent.
Below is a comparison of the two indices, NSE 20 and NASI, whose performance necessitated this write-up:
|
Comparison of NASI and NSE 20 |
||
|
Metric |
NASI |
NSE 20 |
|
Constituents |
Consists of all the stocks listed on the Nairobi Securities Exchange (NSE). Currently NSE has 62 listed companies divided into the following sectors: · Telecommunication and Technology (1), · Banking (11), · Manufacturing and Allied (9) · Insurance (6), · Energy and Petroleum (5), · Construction and Allied (5), · Commercial and Services (10), · Investment (5), · Agricultural (6), · Automobiles and Accessories (3), and · Investment Services (1) |
Consists of 20 of the NSE listed companies, which are selected based on the above-mentioned criteria and include; Telecommunication and Technology (1), · Banking (6), · Manufacturing and Allied (2) · Insurance (1), · Energy and Petroleum (3), · Construction and Allied (2), · Commercial and Services (3), · Investment (1), and · Agricultural (1)
|
|
Pricing |
NASI is market-cap weighted, implying that stocks with a higher market value account for a higher weight in the index, hence they are the market drivers. This is always true for NASI with Safaricom and banking stocks controlling about 67.5% of the index |
NSE 20 is price-weighted, implying that stocks with higher prices are assigned a higher weight. In this case, BAT and EABL are the performance drivers of the index due to their high prices, while large-caps like Safaricom account for less weight due to lower stock price |
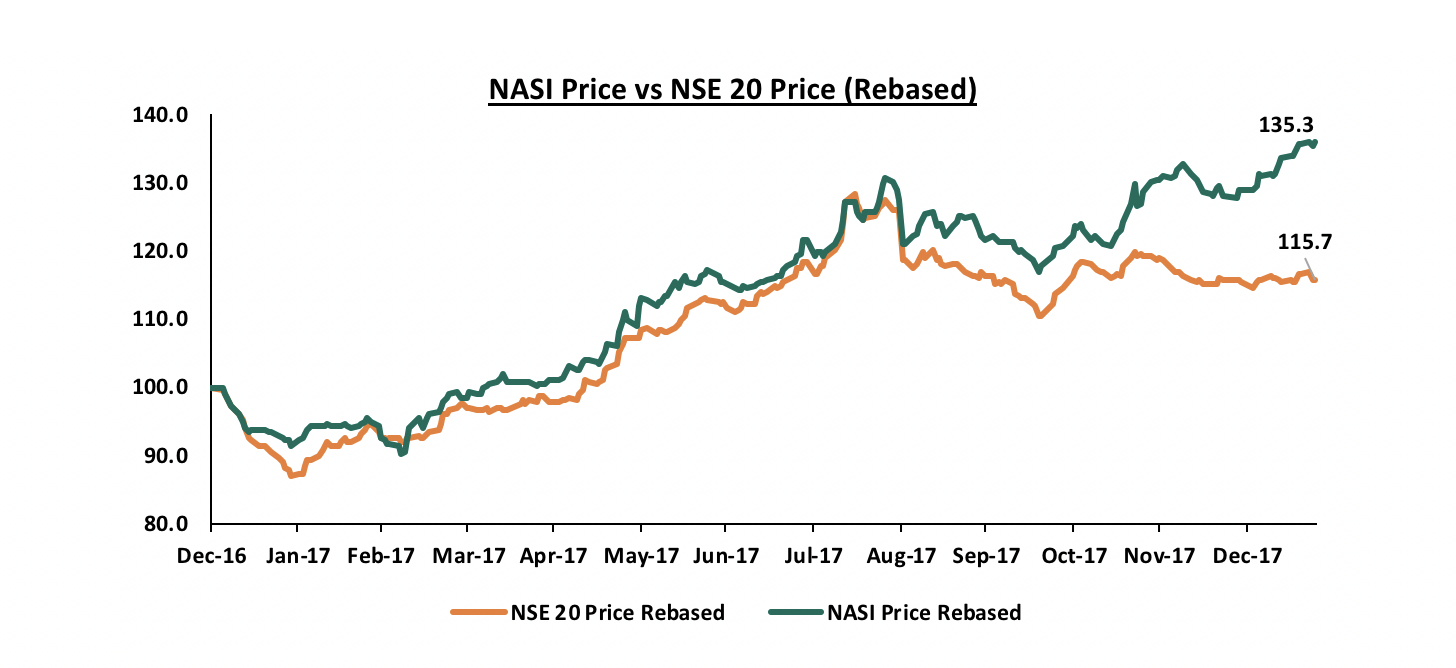
Having defined what both indices are and what they represent, we now need to determine the cause of the disparity in the performance of the indices. As highlighted earlier, during the year 2017, NASI and NSE 20 gained by 28.4% and 16.5%, respectively, to close the year at 133.3 and 3,186.2 for NASI and NSE 20, respectively. The chart below highlights the performance of NASI and NSE 20 during the year. The figures are different from the actual indices figures at peak since the data series is rebased to have a common starting point (100) for easier comparison of the two indices.
The discrepancy in the performance of the two indices can be attributed to the dominance of particular stocks in these indices. The table below show the performance for 2017 of stocks that constituted approximately 80% of both NSE 20 and NASI at the beginning of 2017, and their weightings in both NASI and NSE 20;
|
Performance of Select Common Stocks in NASI and NSE 20 |
||||||
|
Stock |
Price as at 31st Dec 2016 |
Price as at 31/12/2017 |
Price change |
Price-weight as at Dec 2016 |
Market cap as at Dec 2016 |
Market cap weight as at Dec 2016 |
|
BAT |
909.0 |
760.0 |
(16.4%) |
53.0% |
90,900.0 |
5.6% |
|
EABL |
244.0 |
238.0 |
(2.5%) |
14.2% |
192,955.2 |
11.8% |
|
Bamburi |
160.0 |
180.0 |
12.5% |
9.3% |
58,080.0 |
3.6% |
|
KCB |
28.8 |
42.8 |
48.7% |
1.7% |
88,150.4 |
5.4% |
|
Equity |
30.0 |
39.8 |
32.5% |
1.7% |
113,211.0 |
6.9% |
|
Safaricom |
19.2 |
26.8 |
39.7% |
1.1% |
767,252.4 |
46.9% |
|
Total |
1,390.9 |
1,287.3 |
81.1% |
1,310,549.0 |
80.1% |
|
|
Weighted Performance |
|
|
|
(6.0%) |
|
22.7% |
Key take-out from the above table is:
- Performance attribution by index weighting methodology – Using price-weighted methodology, the index would have recorded a weighted loss of 6.0%. On the other hand, using the market-cap weighted methodology, an index composed of these stocks would have recorded a gain of 22.7%. The underperformance by NSE 20 is as a result of the minimal weight assigned to Safaricom by price-weighted methodology, which makes its significant gain of 39.7% in 2017 less impactful on the index. The performance of NSE 20 is also undermined by losses recorded by stocks assigned higher weights in the index such as BAT and EABL, which both recorded losses.
In view of the above, it is clear that NASI and NSE 20 do not have the characteristics of a good index, and are impractical to track as a benchmark. In our assessment, the dominance of the stocks highlighted above, drive the performance of these indices and having them in your portfolio, has a major effect on your final performance. The table below summarises suitability of all indices on the NSE as measured against the above mentioned ideal characteristics of an index:
|
Index |
Capped Weighting |
Free Float Adjustment |
|
NASI |
X |
X |
|
NSE 20 |
X |
√ |
|
NSE 25 |
X |
√ |
|
FTSE 15 |
X |
√ |
|
FTSE 25 |
X |
√ |
The above table shows that the NSE currently has no index that possess all the above mentioned qualities of a good benchmark. However, the exchange made an effort in addressing the inefficiencies of both NASI and NSE 20 by introducing NSE 25 index in October 2015. The NSE 25 includes blue-chip companies that have a market capitalization of at least Kshs 1.0 bn, and have at least 20% of their shares available for trading. The index is therefore an improvement of NASI as it makes a provision for the shares available for trading and it has taken into account that the entire market is not investable. Despite this, most portfolio managers still prefer to benchmark with NASI, which could be attributed to the fact that the index has only been in use for 2-years, and may be an indication that public awareness has not been effective, as is the case with other recently introduced exchange products. A main downside for NSE 25 is that weighting is not capped, which may result in dominance of some stocks on the index. This necessitates re-invention of the existing indices by the exchange and the Capital Markets Authority to create benchmarks in which portfolio managers can invest in practically. For instance, the MSCI is constructed by market cap weighting but with the weights adjusted for free float. However, since a portfolio manager cannot practically invest in all stocks that are liquid, the MSCI capped indices were created, which constrain weights of constituents by sector, geography or by just setting a maximum weight, and they include MSCI 10/40, MSCI 25/50, MSCI 20/20, and MSCI 20/35.
In conclusion, we view the following as key actionable areas that can be implemented to make the already existing indices more relevant as portfolio benchmarks:
- Introduce capped weighting in indices similar to MSCI or Capped SWIX in South Africa: Evidently, Safaricom being the highest by market value will have a dominant weight in every market-cap weighted index and will therefore influence the performance of the index, making other constituents irrelevant. As highlighted in our Cytonn Weekly #50/2017, where we discussed the impact of Safaricom’s market dominance in portfolio construction, we also saw a good example of an index that reduces single-stock concentration. In South Africa, Naspers, which is broad-based multinational internet and media group, accounts for 20.5% of the FTSE/JSE All Share Index, 24.5% of the Top 40 Index and 24.8% of the Shareholders Weighted Index (SWIX), which are the top 3 indices used as benchmarks for investors. To maintain diversification and address the dominance by Naspers, portfolio managers in South Africa are now shifting their benchmark to the Capped SWIX, which was introduced in November 2016. This variation rebalances every quarter to cap stocks at 10% of the index, creating less single-stock concentration. Such a capped index, which could be the Capped NASI, Capped NSE 20 or Capped NSE 25, or another Capped Index, would also provide the adequate rebalancing to ensure indices in Kenya are reflective of movements in the entire market,
- Introduce indices that are based on industries or sectors: Some portfolio managers chose to invest in select sectors of the market especially because they understand this part of the market. Sector-based indices will, therefore, serve as good benchmarks as they are practical as an active strategy,
- Have forum groups to engage on index construction: These would be forums where all stakeholders in the market engage to provide options towards developing an index that can be fully representative of market movements and used as a benchmark when measuring performance,
- Generally, avail more information to the public: There is little public information available on the indices in the Nairobi Securities Exchange. The NSE does not release reports once an index is rebalanced hence the use of these indices by investors and portfolio managers to measure performance may be biased. More information on the NSE 25 and the advantages of using it as a benchmark index would go a long way in increased consumer education. Additionally, lack of a clear reporting framework, such as quarterly or annual reports on performance of the indices makes it hard to improve on what we already have.
Disclaimer: The views expressed in this publication are those of the writers where particulars are not warranted. This publication, which is in compliance with Section 2 of the Capital Markets Authority Act Cap 485A, is meant for general information only, and is not a warranty, representation, advice or solicitation of any nature. Readers are advised in all circumstances to seek the advice of a registered investment advisor.

- Talk to us
- Kenya
- P.O Box 20695 - 00200, Nairobi, Kenya
- Cell +254709101200
- Tel +254709101200
- WhatsApp +254741676635
- United States
- +254709101200
- DOWNLOAD OUR APP
-


- Kenya
- 8th Floor, Pinetree Plaza, Kaburu Drive, Ngong Road, Nairobi, Kenya
- USA
- Suite 1150, 1775 Eye Street NW, USA, Washington DC 20006, USA
- Investments
- High Yield
- Private Equity
- Real Estate
- Real Estate
- RiverRun Estates
- Cytonn Towers
- The Ridge
- Taraji Heights
- The Alma