Currency and Interest Rates Outlook, & Cytonn Weekly #20/2021
By Cytonn Research, May 23, 2021
Executive Summary
Fixed Income
During the week, T-bills remained oversubscribed, with the overall subscription rate coming in at 162.0%, up from 110.7% recorded the previous week. The demand for the 364-day paper persisted, as it recorded the highest bids worth Kshs 24.1 bn against the offered Kshs 10.0 bn, translating to a subscription rate of 241.3%, an increase from the 222.6% recorded the previous week. Investors’ continued interest in the 364-day paper is mainly attributable to the attractive return it is offering at 9.3% which is at par or higher than some of the bank deposits. The yields on all the three papers declined; with the 91-day, 182-day and 364-day paper declining by 0.1 bps, 4.2 bps and 8.1 bps, to 7.2%, 8.0 and 9.3%, respectively. During the week, the International Monetary Fund (IMF) announced that it had reached a staff level agreement with the Kenyan authorities that will allow Kenya to access a loan of USD 410.0 mn (Kshs 44.4 bn) once the review is formally completed. The Monetary Policy Committee (MPC) is set to meet on Wednesday, 26th May 2021 to review the outcome of its previous policy decisions and recent economic developments, and to decide on the direction of the Central Bank Rate (CBR). We expect the MPC to maintain the Central Bank Rate (CBR) at 7.0%;
Equities
During the week, the equities market recorded mixed performance, with the NSE 20 declining marginally by 0.2% while both NASI and NSE 25 were unchanged. This week’s performance took their YTD performance to gains of 9.0% and 5.2%, for NASI and NSE 25, respectively, and a loss of 0.7% for NSE 20. The equities market performance was driven by gains recorded by stocks such as ABSA, Equity Group and EABL which gained by 3.4%, 1.3% and 1.0%, respectively. The gains were however weighed down by losses recorded by stocks such as Bamburi and KCB Group which lost by 6.5% and 2.3%, respectively. During the week, Equity Group disclosed that it had had acquired an additional 7.7% stake valued at Kshs 996.0 mn, in Equity bank Congo (EBC) from the German Sovereign wealth Fund (KfW). The acquisition raised the total ownership in EBC to 94.3%. Based on the price paid, Equity bank has valued the EBC at Kshs 14.2 bn;
Real Estate
During the week, Naivas supermarket, a local retail chain, opened a new store in Zion Mall, Eldoret, in addition to signing a lease agreement with Greenspan Mall in Donholm, to become the anchor tenant taking up 57,000 SQFT of space. In the infrastructure sector, Uganda signed a Public-Private Partnership deal worth Kshs 5.0 bn with China Roads and Bridge Corporation (CRBC) to renovate its century-old meter gauge railway line between Malaba and Kampala, which will be linked to the Standard Gauge Railway (SGR) track through the Naivasha to Malaba old railway. President Uhuru Kenyatta launched the first berth of the Lamu Port-South Sudan-Ethiopia-Transport (LAPSSET) corridor, a project that targets to link Kenya to South Sudan, Ethiopia and the middle belt of Africa;
Focus of the Week
In March 2021, Kenya saw its sovereign rating downgraded by all the major rating agencies; Standard & Poor’s , Fitch Rating and Moody’s. The lowering of the credit rating was mainly on the back of Kenya’s high fiscal deficit coupled with the economic shocks occasioned by the challenges brought about from the impact of the COVID-19 pandemic. With the downgrading and the constant increase in the fiscal deficit we have seen some pressure on the local bonds yield curve which has resulted to 1.4% decline in the FTSE NSE Bond Index. Despite the challenges that have been facing the economy the shilling has held stable this year having appreciated by 0.5% YTD following a 7.7% depreciation in 2020. The main support that the shilling has been having is the lower demand from imports and the decline in dividend payments, we have seen increased inflows to the bond market, increased diaspora remittances, inflows from the IMF in support of the economy and the higher forex reserves held by the Central bank. This week we shall be focusing in detail the factors that are expected to drive the performance of the Kenya shilling and the interest rates and thereafter give our outlook for 2021;
Investment Updates:
- Weekly Rates:
- Cytonn Money Market Fund closed the week at a yield of 10.58%. To invest, just dial *809#;
- Cytonn High Yield Fund closed the week at a yield of 15.52% p.a. To invest, email us at sales@cytonn.com and to withdraw the interest you just dial *809#;
- Solomon Kariuki, an investment analyst at Cytonn Investments, had an interview with CNBC Africa to discuss the movements shaping Kenya’s market space, watch Solomon here;
- We continue to offer Wealth Management Training daily, from 9:00 am to 11:00 am, through our Cytonn Foundation. The training aims to grow financial literacy among the general public. To register for any of our Wealth Management Trainings, click here;
- If interested in our Private Wealth Management Training for your employees or investment group, please get in touch with us through wmt@cytonn.com;
- Cytonn Insurance Agency acts as an intermediary for those looking to secure their assets and loved ones’ future through insurance namely; Motor, Medical, Life, Property, WIBA, Credit and Fire and Burglary insurance covers. For assistance, please get in touch with us through insuranceagency@cytonn.com;
Real Estate Updates:
- For an exclusive tour of Cytonn’s real estate developments, visit: Sharp Investor's Tour, and for more information, email us at sales@cytonn.com;
- Phase 3 of The Alma by Cytonn is now ready for occupancy. To rent please email properties@cytonn.com;
- We have 10 investment-ready projects, offering attractive development and buyer targeted returns. See further details here: Summary of Investment-ready Projects;
Hospitality Updates:
- We currently have promotions for Daycations and Staycations, visit cysuites.com/offers for details or email us at sales@cysuites.com;
For recent news about the group, see our news section here.
Money Markets, T-Bills & T-Bonds Primary Auction:
During the week, T-bills remained oversubscribed, with the overall subscription rate coming in at 162.0%, up from 110.7% recorded the previous week. The demand for the 364-day paper persisted, as it recorded the highest bids worth Kshs 24.1 bn against the offered Kshs 10.0 bn, translating to a subscription rate of 241.3%, an increase from the 222.6% recorded the previous week. Investors’ continued interest in the 364-day paper is mainly attributable to the attractive return of 9.3% from the paper which is higher than the rate for most bank placements. The subscription rate for the 182-day paper increased to 101.1%, from 28.9% recorded the previous week, receiving bids worth Kshs 10.1 bn against the Kshs 10.0 bn offered. The subscription rate for the 91-day paper also increased to 116.1%, from 35.7% recorded the previous week, with the paper receiving bids worth Kshs 4.6 bn against the offered amounts of Kshs 4.0 bn. The yields on all the three papers declined; with the 91-day, 182-day and 364-day paper declining by 0.1 bps, 4.2 bps and 8.1 bps, to 7.2%, 8.0 and 9.3%, respectively. The government continued to reject expensive bids, accepting Kshs 22.4 bn out of the Kshs 38.9 bn worth of bids received, translating to an acceptance rate of 57.5%.
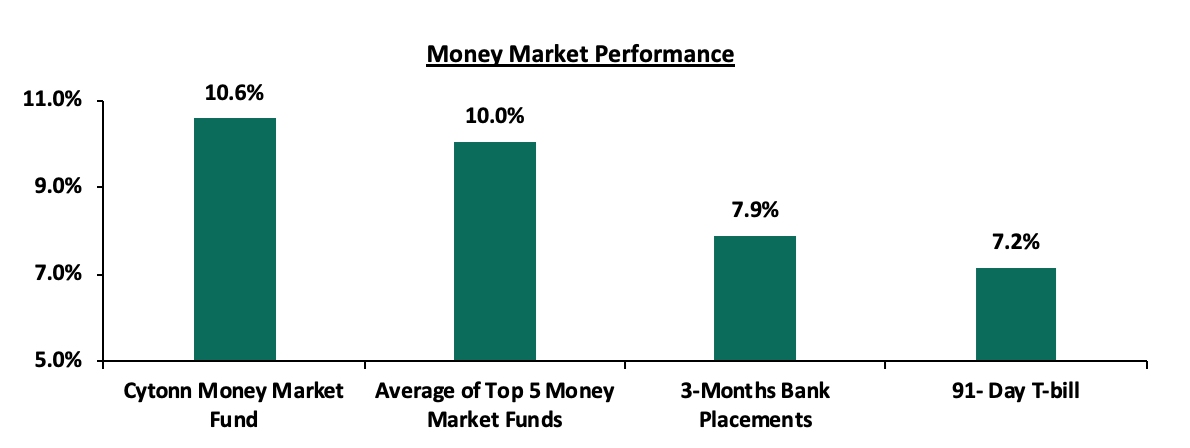
In the money markets, 3-month bank placements ended the week at 7.9% (based on what we have been offered by various banks), while the yield on the 91-day T-bill declined marginally by 0.1 bps to 7.2%. The average yield of the Top 5 Money Market Funds declined to 10.0%, from the 10.1% recorded the previous week. The yield on the Cytonn Money Market Fund remained unchanged at 10.6%, similar to what was recorded the previous week. The table below shows the Money Market Fund Yields for Kenyan Fund Managers as published on 21st May 2021:
|
Money Market Fund Yield for Fund Managers as published on 21st May 2021 |
|||
|
Rank |
Fund Manager |
Daily Yield |
Effective Annual Rate |
|
1 |
Cytonn Money Market Fund |
10.05% |
10.58% |
|
2 |
Nabo Africa Money Market Fund |
9.87% |
10.33% |
|
3 |
Zimele Money Market Fund |
9.56% |
9.91% |
|
4 |
GenCapHela Imara Money Market Fund |
9.35% |
9.80% |
|
5 |
Alphafrica Kaisha Money Market Fund |
9.22% |
9.62% |
|
6 |
Madison Money Market Fund |
9.06% |
9.48% |
|
7 |
CIC Money Market Fund |
9.01% |
9.33% |
|
8 |
Sanlam Money Market Fund |
8.79% |
9.19% |
|
9 |
Dry Associates Money Market Fund |
8.52% |
8.86% |
|
10 |
Co-op Money Market Fund |
8.44% |
8.80% |
|
11 |
British-American Money Market Fund |
8.26% |
8.58% |
|
12 |
Apollo Money Market Fund |
8.43% |
8.50% |
|
13 |
NCBA Money Market Fund |
8.04% |
8.35% |
|
14 |
ICEA Lion Money Market Fund |
8.00% |
8.33% |
|
15 |
Old Mutual Money Market Fund |
7.19% |
7.43% |
|
16 |
AA Kenya Shillings Fund |
6.01% |
6.18% |
Liquidity:
During the week, liquidity in the money market tightened, with the average interbank rate increasing to 4.9%, from 4.0% recorded the previous week, partly attributable to tax remittances which offset Government payments. The average interbank volumes declined by 32.7% to Kshs 7.6 bn, from Kshs 11.3 bn recorded the previous week.
Kenya Eurobonds:
During the week, the yields on all Eurobonds declined, with the yields on the 10-year Eurobond issued in June 2014, 10-year bond issued in 2018, 30-year bond issued in 2018, 7-year bond issued in 2019 and 12-year bond issued in 2019 declining to 3.1%, 5.4%, 7.4%, 4.7% and 6.3%, from 3.2%, 5.8%, 7.5%, 5.1% and 6.6%, respectively. The yields decline was partly attributable to improved investor confidence, following the announcement by the International Monetary Fund (IMF) that it has reached a staff-level agreement with Kenya to enable the nation access a loan of USD 410.0 mn (Kshs 44.4 bn). For a developing country, like Kenya, that is suffering from ballooning public debt, slow revenue collection and whose economy has been heavily and adversely effected by macroeconomic factors such as the ongoing pandemic, participating in an IMF loan program not only provides relief directly through loan funds but also helps to signal to investors that the IMF believes the nation has adequate fiscal policies in place to support its own recovery. The improved sentiments in turn lead to investors attaching a lower risk to debt instruments issued by the country and hence the decline in the Kenyan Eurobond yields during the week.
|
Kenya Eurobond Performance |
|||||
|
|
2014 |
2018 |
2019 |
||
|
Date |
10-year issue |
10-year issue |
30-year issue |
7-year issue |
12-year issue |
|
31-Dec-2020 |
3.9% |
5.2% |
7.0% |
4.9% |
5.9% |
|
30-April-2021 |
3.2% |
5.7% |
7.7% |
5.0% |
6.7% |
|
14-May-21 |
3.2% |
5.8% |
7.5% |
5.1% |
6.6% |
|
17-May-21 |
3.1% |
5.7% |
7.5% |
5.0% |
6.5% |
|
18-May-21 |
3.1% |
5.5% |
7.5% |
4.9% |
6.3% |
|
19-May-21 |
3.2% |
5.6% |
7.5% |
5.0% |
6.4% |
|
20-May-21 |
3.2% |
5.6% |
7.5% |
4.9% |
6.4% |
|
21-May-21 |
3.1% |
5.4% |
7.4% |
4.7% |
6.3% |
|
Weekly Change |
(0.1%) |
(0.4%) |
(0.1%) |
(0.3%) |
(0.3%) |
|
MTD Change |
(0.1%) |
(0.3%) |
(0.3%) |
(0.3%) |
(0.4%) |
|
YTD Change |
(0.8%) |
0.2% |
0.4% |
(0.1%) |
0.4% |
Source: Reuters
Kenya Shilling:
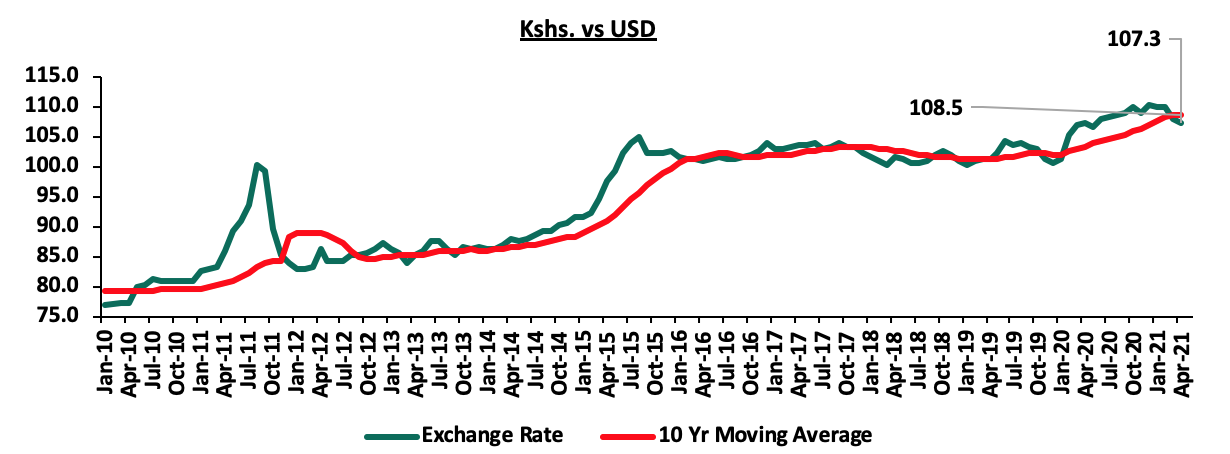
During the week, the Kenyan shilling depreciated against the US dollar by 1.1% to close at Kshs 108.2, from Kshs 107.0 recorded the previous week, mainly attributable to the build-up of dollar demand ahead of the end of the month when firms typically meet their hard currency obligations. On a YTD basis, the shilling has appreciated by 0.5% against the dollar, in comparison to the 7.7% depreciation recorded in 2020. We expect the shilling to remain under pressure in 2021 as a result of:
- Rising uncertainties in the global market due to the Coronavirus pandemic, which has seen investors continue to prefer holding their investments in dollars and other hard currencies and commodities, and,
- Demand from merchandise traders as they beef up their hard currency positions in anticipation for more trading partners reopening their economies globally,
The shilling is however expected to be supported by:
- The Forex reserves, currently at USD 7.5 bn (equivalent to 4.6-months of import cover), which is above the statutory requirement of maintaining at least 4.0-months of import cover, and the EAC region’s convergence criteria of 4.5-months of import cover,
- The improving current account position which narrowed to 4.8% of GDP in the 12 months to December 2020 compared to 5.8% of GDP during a similar period in 2019, and,
- Improving diaspora remittances evidenced by a 43.8% y/y increase to USD 299.3 mn in April 2021, from USD 208.2 mn recorded over the same period in 2020, has cushioned the shilling against further depreciation.
Weekly Highlights:
- International Monetary Fund (IMF) Loan Facility
During the week, the International Monetary Fund (IMF) announced that it had reached a staff level agreement with the Kenyan authorities that will allow Kenya to access the second tranche of USD 410.0 mn (Kshs 44.4 bn) once the review is formally completed by the IMF Executive Board. The funds are part of an approved 38-month loan facility totaling to USD 2.34 bn (Kshs 253.3 bn) that was announced in April 2021, of which USD 308.0 mn (Kshs 33.3 bn) was released on 3rd April 2021, and subsequent tranches were to be released following frequent loan programme reviews. The credit facility is aimed at assisting Kenya to (i) stabilize its economy, and, (ii) create a sustainable growth path.
The expected receipt of the Kshs 44.4 bn loan funds will increase Kenya’s external debt by 1.2% to 3.9 tn from Kshs 3.8 tn and increase the total debt to Kshs 7.4 tn. We expect the economy to continue facing fiscal challenges occasioned by the pandemic as businesses continue to suffer from Covid-19 effects. Despite this, the extension of the IMF loan has improved investor sentiments towards the country as evidenced by the decline in Eurobond yields during the week. Additionally, according to the IMF, Kenya’s economy is now projected to recover by 6.3% in 2021, down from the earlier projected annual growth rate of 7.6% released in April 2021.
- MPC May 2021
The Monetary Policy Committee (MPC) is set to meet on Wednesday, 26th May 2021 to review the outcome of its previous policy decisions and recent economic developments, and to decide on the direction of the Central Bank Rate (CBR) and any other policy measure like the Cash Reserve Ratio. In their previous meeting held on 29th March 2021, the committee maintained the CBR at 7.0%, citing that the accommodative policy stance adopted in March 2020, and all the other sittings since, which saw a cumulative 125 bps cut, was having the intended effects on the economy. This was in line with our expectations.
We expect the MPC to maintain the Central Bank Rate (CBR) at 7.0%, with their decision mainly being supported by:
- Stable Inflation which is projected to remain within the 2.5%-7.5% target range despite the recent increases in fuel prices,
- The stable macros and limited transmission mechanism to translate any additional cuts into increased economic activity growth due to underlying fundamental and structural challenges. Any additional cuts are not likely to stimulate private sector credit growth which stood at 7.7% as of March 2021, due to the elevated credit risks persist in the current environment, and,
- The FY’2021/22 budget estimates indicate that the government will set aside Kshs 26.6 bn of funds through the Post - COVID recovery strategy, of which, Kshs 8.6 bn will go towards enhancing liquidity to businesses. We expect that these funds will be directed towards reviving the economy and as such, we believe that this will reduce pressure on the MPC to pursue additional policy measures.
For a more detailed analysis, please see our MPC Note here.
Rates in the fixed income market have remained relatively stable due to the high liquidity in the money markets, coupled with the discipline by the Central Bank as they reject expensive bids. The government is 1.4% behind of its prorated borrowing target of Kshs 495.6 bn having borrowed Kshs 488.6 bn. In our view, due to the current subdued economic performance brought about by the effects of the COVID-19 pandemic, the government will record a shortfall in revenue collection having collected Kshs. 1,337.4 bn as at 10 months to April 2021, compared to Kshs 1,383.7 bn prorated target collection for FY’2020/2021, thus leading to a larger budget deficit than the projected 7.5% of GDP. The high deficit and the lower credit rating from S&P Global to 'B' from 'B+' will mean that the government might be forced to borrow more from the domestic market which will ultimately create uncertainty in the interest rate environment. In our view, investors should be biased towards short-term fixed income securities to reduce duration risk.
Markets Performance
During the week, the equities market recorded mixed performance, with NSE 20 declining marginally by 0.2% while both NASI and NSE 25 remaining unchanged. This week’s performance took their YTD performance to gains of 9.0% and 5.2%, for NASI and NSE 25, respectively, and a loss of 0.7% for NSE 20. The equities market performance was driven by gains recorded by stocks such as ABSA, Equity Group and EABL which gained by 3.4%, 1.3% and 1.0%, respectively. The gains were however weighed down by losses recorded by stocks such as Bamburi and KCB Group which lost by 6.5% and 2.3%, respectively.
Equities turnover increased by 3.4% to USD 29.6 mn, from USD 28.6 mn recorded the previous week, taking the YTD turnover to USD 463.0 mn. Foreign investors remained net sellers during the week, with a net selling position of USD 15.1 mn, from last week’s net selling position of USD 5.4 mn, taking the YTD net selling position to USD 22.9 mn.
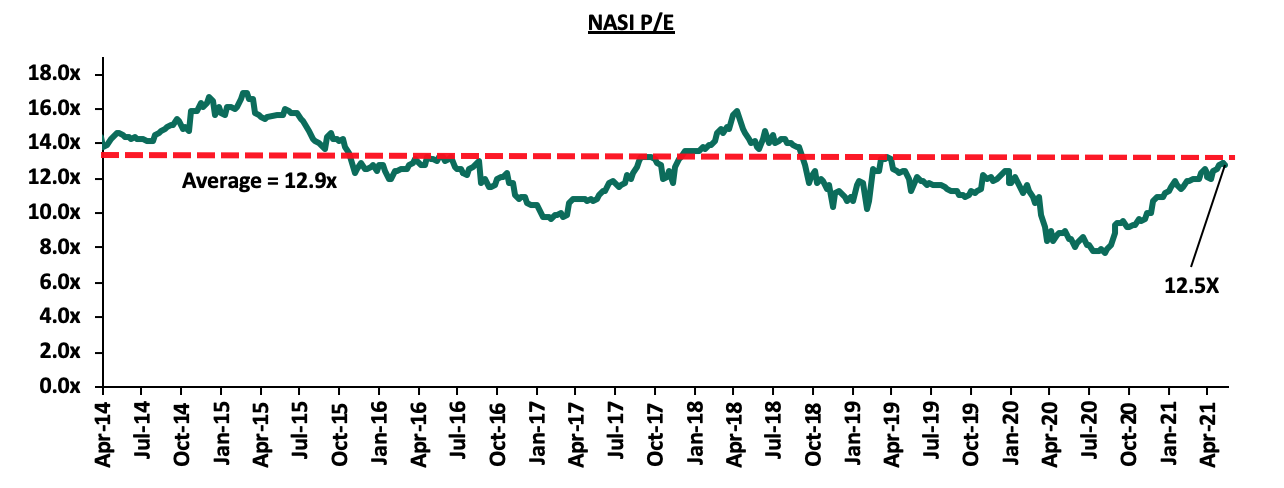
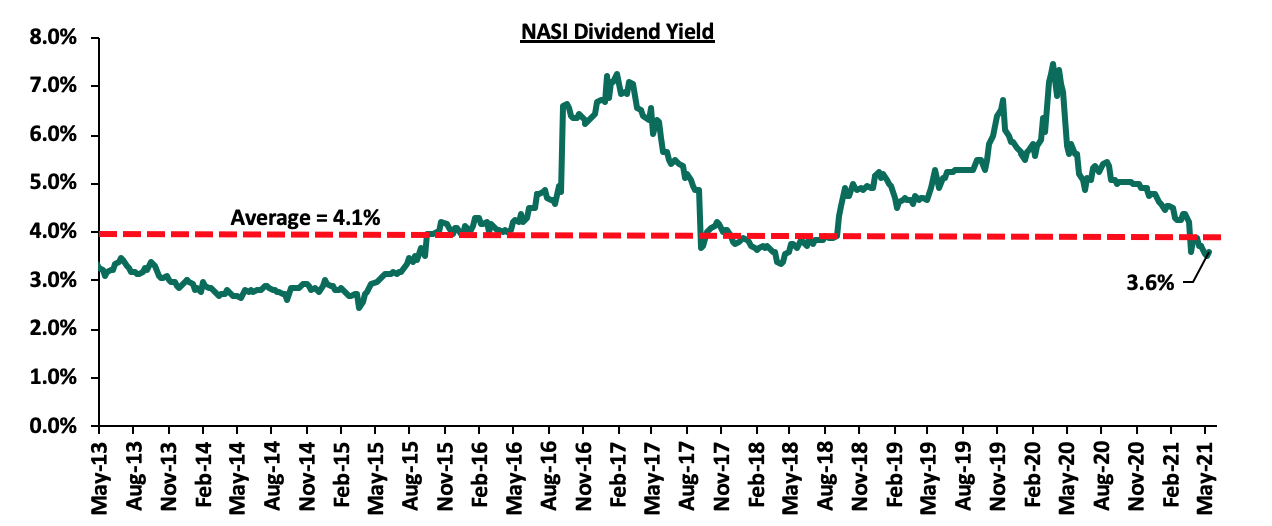
The market is currently trading at a price to earnings ratio (P/E) of 12.5x, which is 2.8% below the 12-year historical average of 12.9x, and a dividend yield of 3.6%, 0.5% points below the historical average of 4.1%. Key to note, NASI’s PEG ratio currently stands at 1.4x, an indication that the market is trading at a premium to its future earnings growth. Basically, a PEG ratio greater than 1.0x indicates that the market may be overvalued while a PEG ratio less than 1.0x indicates that the market is undervalued. The current P/E valuation of 12.5x is 62.9% above the most recent trough valuation of 7.7x experienced in the first week of August 2020. The charts below indicates the historical P/E and dividend yields of the market.
Weekly Highlight:
During the week, Equity Group disclosed that it had had acquired an additional 7.7% stake valued at Kshs 996.0 mn, in Equity bank Congo (EBC) from the German Sovereign wealth Fund (KfW). The acquisition raised the total ownership in EBC to 94.3%, indicating that they are currently valuing the company at Kshs 14.2 bn. This follows the recent acquisition of 66.5% stake in Banque Commerciale Du Congo (BCDC) by Equity Group at a cost of Kshs 10.2 bn in August 2020. The BCDC subsidiary is already the second largest most profitable regional subsidiary, having contributed Kshs 1.3 bn to the Groups Profit After Tax of Kshs 20.1 bn in 2020.
The attractiveness of DRC as an entry market can be attributed to the low banking penetration which was estimated to be around 6.0% in 2019 as compared to 29.6% bank account holding in Kenya, in a similar period. According to the World Bank, DRC’s interest rate spread in 2019 stood at of 21.2%, higher than Kenya’s spread of 4.9% during the same period. The merged entity will be known as Equity BCDC with an asset base of Kshs 322.0 bn making it the second largest bank by asset base in DRC. In our view, the recent acquisition and consolidation of the DRC market is a move to increase Equity Group’s regional footprint in line with its long-term expansion strategy. Additionally, the acquisitions will present an opportunity for increased profitability as the bank pursues business growth through reaching the unbanked population in BRC through the replication of the model used in Kenya.
Below is a summary of the deals in the last 7 years that have either happened, been announced or expected to be concluded:
|
Acquirer |
Bank Acquired |
Book Value at Acquisition (Kshs bn) |
Transaction Stake |
Transaction Value (Kshs bn) |
P/Bv Multiple |
Date |
|
I&M Holdings PLC |
Orient Bank Limited Uganda |
3.3 |
90.0% |
3.6 |
1.1x |
April-21 |
|
KCB Group |
Banque Populaire du Rwanda, and, ABC Tanzania |
4.5 (Banque Populaire du Rwanda, only. ABC Tanzania financials unknown) |
100.0% |
6.1 |
N/D |
Nov-20* |
|
Co-operative Bank |
Jamii Bora Bank |
3.4 |
90.0% |
1 |
0.3x |
Aug-20 |
|
Commercial International Bank |
Mayfair Bank Limited |
1 |
51.0% |
Undisclosed |
N/D |
May-20* |
|
Access Bank PLC (Nigeria) |
Transnational Bank PLC. |
1.9 |
100.0% |
1.4 |
0.7x |
Feb-20* |
|
Equity Group ** |
Banque Commerciale Du Congo |
8.9 |
66.5% |
10.3 |
1.2x |
Nov-19* |
|
KCB Group |
National Bank of Kenya |
7 |
100.0% |
6.6 |
0.9x |
Sep-19 |
|
CBA Group |
NIC Group |
33.5 |
53%:47% |
23 |
0.7x |
Sep-19 |
|
Oiko Credit |
Credit Bank |
3 |
22.8% |
1 |
1.5x |
Aug-19 |
|
CBA Group** |
Jamii Bora Bank |
3.4 |
100.0% |
1.4 |
0.4x |
Jan-19 |
|
AfricInvest Azure |
Prime Bank |
21.2 |
24.2% |
5.1 |
1.0x |
Jan-18 |
|
KCB Group |
Imperial Bank |
Unknown |
Undisclosed |
Undisclosed |
N/A |
Dec-18 |
|
SBM Bank Kenya |
Chase Bank Ltd |
Unknown |
75.0% |
Undisclosed |
N/A |
Aug-18 |
|
DTBK |
Habib Bank Kenya |
2.4 |
100.0% |
1.8 |
0.8x |
Mar-17 |
|
SBM Holdings |
Fidelity Commercial Bank |
1.8 |
100.0% |
2.8 |
1.6x |
Nov-16 |
|
M Bank |
Oriental Commercial Bank |
1.8 |
51.0% |
1.3 |
1.4x |
Jun-16 |
|
I&M Holdings |
Giro Commercial Bank |
3 |
100.0% |
5 |
1.7x |
Jun-16 |
|
Mwalimu SACCO |
Equatorial Commercial Bank |
1.2 |
75.0% |
2.6 |
2.3x |
Mar-15 |
|
Centum |
K-Rep Bank |
2.1 |
66.0% |
2.5 |
1.8x |
Jul-14 |
|
GT Bank |
Fina Bank Group |
3.9 |
70.0% |
8.6 |
3.2x |
Nov-13 |
|
Average |
|
|
76.7% |
|
1.2x |
|
|
* Announcement Date ** Deals that were dropped |
||||||
Earnings Releases
During the week, Co-operative Bank Kenya, ABSA Bank Kenya, and Stanbic Bank Kenya released their FY’2020 financial results. Below is a summary of their performance;
- Co-operative Bank
|
Co-operative Bank Kenya Q1’2021 Key Highlights |
|||||
|
Balance Sheet |
|||||
|
Balance Sheet Items |
Q1’2020 (Kshs bn) |
Q1’2021 (Kshs bn) |
y/y change |
||
|
Government Securities |
115.9 |
166.2 |
43.4% |
||
|
Net Loans and Advances |
276.2 |
298.2 |
8.0% |
||
|
Total Assets |
470.4 |
552.9 |
17.5% |
||
|
Customer Deposits |
339.6 |
393.8 |
16.0% |
||
|
Deposits per Branch |
2.1 |
2.2 |
4.2% |
||
|
Total Liabilities |
386.9 |
458.3 |
18.5% |
||
|
Shareholders’ Funds |
82.0 |
93.7 |
14.3% |
||
|
Income Statement |
|||||
|
Income Statement Items |
Q1’2020 (Kshs bn) |
Q1’2021 (Kshs bn) |
y/y Change |
||
|
Net Interest Income |
7.5 |
9.8 |
30.7% |
||
|
Non-Interest Income |
5.0 |
4.5 |
(9.2%) |
||
|
Total Operating income |
12.5 |
14.4 |
14.8% |
||
|
Loan Loss provision |
(0.9) |
(2.3) |
153.5% |
||
|
Total Operating expenses |
(7.3) |
(9.3) |
27.4% |
||
|
Profit before tax |
5.1 |
5.0 |
(2.6%) |
||
|
Profit after tax |
3.6 |
3.5 |
(3.7%) |
||
|
Earnings per share |
0.52 |
0.50 |
(3.7%) |
||
|
Key Ratios |
|||||
|
Income Statement Ratios |
Q1’2020 |
Q1’2021 |
% point Change |
||
|
Yield from interest-earning assets |
11.3% |
11.6% |
0.3% |
||
|
Cost of funding |
0.8% |
0.8% |
0.0% |
||
|
Net Interest Margin |
8.2% |
8.6% |
0.4% |
||
|
Non-Performing Loans (NPL) Ratio |
15.8% |
10.8% |
5.0% |
||
|
NPL Coverage |
54.8% |
58.4% |
3.6% |
||
|
Cost to Income With LLP |
58.1% |
64.5% |
6.4% |
||
|
Loan to Deposit Ratio |
81.3% |
75.7% |
(5.6%) |
||
|
Cost to Income Without LLP |
50.9% |
48.6% |
(2.3%) |
||
|
Return on average equity |
18.7% |
12.3% |
(6.4%) |
||
|
Return on average assets |
3.2% |
2.0% |
(1.2%) |
||
|
Equity to Assets |
17.4% |
16.9% |
(0.5%) |
||
|
Capital Adequacy Ratios |
|||||
|
Ratios |
Q1’2020 |
Q1’2021 |
% point Change |
||
|
Core Capital/Total deposit Liabilities |
20.2% |
18.4% |
(1.8%) |
||
|
Minimum Statutory ratio |
8.0% |
8.0% |
0.0% |
||
|
Excess |
12.2% |
10.4% |
(1.8%) |
||
|
Core Capital/Total Risk-Weighted Assets |
15.6% |
15.2% |
(0.4%) |
||
|
Minimum Statutory ratio |
10.5% |
10.5% |
0.0% |
||
|
Excess |
5.1% |
4.7% |
(0.4%) |
||
|
Total Capital/Total Risk-Weighted Assets |
16.1% |
16.9% |
0.8% |
||
|
Minimum Statutory ratio |
14.5% |
14.5% |
0.0% |
||
|
Excess |
1.6% |
2.4% |
0.8% |
||
Key take-outs from the earnings release include;
- Core earnings per share declined by 3.7% to Kshs 0.50 in Q1’2021, from Kshs 0.52 in Q1’2020, which was not in-line with our projections of a 9.3% decline to Kshs 0.47. The performance was driven by a 27.4% increase in total operating expenses to Kshs 9.3 bn in Q1’2021, from Kshs 7.3 bn in Q1’2020 but was mitigated by a 14.8% increase in total operating income,
- Interest income rose by 27.6% to Kshs 13.4 bn in Q1’2021, from Kshs 10.5 bn in Q1’2020, attributable to a 44.1% increase in interest income from government securities to Kshs 4.1 bn, from Kshs 2.9 bn in Q1’2020, coupled with a 22.5% rise in interest income from loans and advances to Kshs 9.2 bn, from Kshs 7.6 bn in Q1’2020,
- The Yield on Interest Earning Assets (YIEA) increased to 11.6%, from 11.3% in Q1’2020 due to the faster 17.4% growth in trailing interest income, which outpaced the 14.5% growth in the average interest-earning assets,
- Interest expense increased by 19.8% to Kshs 3.6 bn in Q1’2021, from Kshs 3.0 bn in Q1’2020, largely due to a 20.9% rise in interest expense from customer deposits to Kshs 3.2 bn, from Kshs 2.6 bn. This was however mitigated by a 2.7% decline in other interest expenses to Kshs 0.37 bn in Q1’2021, from Kshs 0.38 bn in Q1’2020. As such, cost of funds declined to 3.2%, from 3.4% in Q1’2020,
- Total operating expenses rose by 27.4% to Kshs 9.3 bn in Q1’2021, from Kshs 7.3 bn in Q1’2020, largely driven by the 153.5% rise in Loan Loss Provisions (LLP) to Kshs 2.3 bn, from Kshs 0.9 bn in Q1’2020. The increased provisioning levels by the lender is mainly as a result of the elevated levels of risk currently in the market due to the pandemic. Notably Staff costs decreased by 7.8% to Kshs 3.2 bn, from the Kshs 3.5 bn recorded in Q1’2020,
- The balance sheet recorded an expansion as total assets grew by 17.5% to Kshs 552.9 bn in Q1’2021, from Kshs 470.4 bn in Q1’2020, mainly attributable to the 43.4% growth in government securities to Kshs 166.2 bn, from Kshs 115.9 bn, coupled with a 8.0% growth in net loans and advances to Kshs 298.2 bn in Q1’2021, from Kshs 276.2 bn in Q1’2020. The increase in allocation to government securities shows the bank’s cautious lending strategy considering the elevated credit risk being experienced in the market,
- Total liabilities grew by 18.5% to Kshs 458.3 bn, from Kshs 386.9 bn in Q1’2020, which was largely attributable to a 16.0% rise in customer deposits to Kshs 393.8 bn in Q1’2021, from Kshs 339.6 bn in Q1’2020, coupled with a 71.1% increase in borrowings to Kshs 46.9 bn, from Kshs 27.4 bn in Q1’2020. The increased borrowing levels can be attributed to a Kshs 21.6 bn borrowing by Kingdom Bank to support its operations,
- Deposits per branch increased by 4.2% to Kshs 2.2 bn, from Kshs 2.1 bn in Q1’2020 despite the increase in the number of branches 11.3% to 177 branches from 159 in Q1’2020,
- Gross Non-Performing Loans (NPLs) increased by 63.3% to Kshs 52.0 bn in Q1’2021, from Kshs 31.8 bn in Q1’2020. The NPL ratio rose to 15.8% in Q1’2021, from 10.8% in Q1’2020 owing to slower growth in gross loans by 4.8% compared to the 63.3% growth in gross non-performing loans. This can be attributed to Non-performing loans of Kshs 7.3 bn from the recently acquired Kingdom Bank where Cooperative Bank owns 90.0% stake. It is important to note that Co-operative Bank’s NPL Ratio is lower than the sector’s NPL ratio of 14.7%,
- General Loan Loss Provisions increased by 97.6% to Kshs 23.6 bn, from Kshs 11.9 bn in Q1’2020. The NPL coverage ratio improved to 58.4% in Q1’2021, from 54.8% in Q1’2020, due to the faster 97.6% growth in General Loan Loss Provisions which was outpaced by the 63.3% growth in Gross Non-Performing Loans (NPLs), and,
- Co-operative Bank remains sufficiently capitalized with a core capital to risk-weighted assets ratio of 15.2%, 4.7% points above the statutory requirement of 10.5%. Also, the total capital to risk-weighted assets ratio came in at 16.9%, exceeding the statutory requirement of 14.5% by 2.4% points.
For a comprehensive analysis, please see our Co-operative Bank Q1’2021 Earnings Note
- ABSA
|
ABSA Bank Kenya Q1’2021 Key Highlights |
|||
|
Balance Sheet |
|||
|
Balance Sheet Items |
Q1’2020 (Kshs bn) |
Q1’2021 (Kshs bn) |
y/y change |
|
Government Securities |
125.4 |
126.7 |
1.1% |
|
Net Loans and Advances |
203.0 |
218.3 |
7.5% |
|
Total Assets |
381.5 |
384.1 |
0.7% |
|
Customer Deposits |
238.7 |
257.1 |
7.7% |
|
Deposits per branch |
2.7 |
3.1 |
12.8% |
|
Total Liabilities |
339.2 |
335.4 |
(1.1%) |
|
Shareholder's Funds |
42.3 |
48.7 |
15.1% |
|
Income Statement |
|||
|
Income Statement Items |
Q1’2020 (Kshs bn) |
Q1’2021 (Kshs bn) |
y/y change |
|
Net Interest Income |
5.6 |
6.0 |
5.9% |
|
Net non-Interest Income |
3.0 |
2.9 |
(3.9%) |
|
Total Operating income |
8.6 |
8.8 |
2.5% |
|
Loan Loss provision |
(1.1) |
(1.4) |
24.9% |
|
Total Operating expenses |
(5.2) |
(5.4) |
4.6% |
|
Profit before tax |
3.4 |
3.4 |
(0.7%) |
|
Profit after tax |
2.0 |
2.4 |
23.7% |
|
Core EPS |
0.4 |
0.4 |
23.7% |
|
Key Ratios |
|||
|
Income statement ratios |
Q1'2020 |
Q1'2021 |
% point change |
|
Yield from interest-earning assets |
9.9% |
9.3% |
(0.6%) |
|
Cost of funding |
3.3% |
3.0% |
(0.2%) |
|
Net Interest Margin |
7.4% |
7.0% |
(0.4%) |
|
Non-Performing Loans (NPL) Ratio |
8.1% |
7.5% |
(0.6%) |
|
NPL Coverage |
64.5% |
73.4% |
8.9% |
|
Cost to Income With LLP |
60.1% |
61.3% |
1.2% |
|
Loan to Deposit Ratio |
85.0% |
84.9% |
(0.1%) |
|
Cost to Income Without LLP |
47.1% |
45.5% |
(1.6%) |
|
Return on average equity |
17.0% |
13.6% |
(3.4%) |
|
Return on average assets |
2.1% |
1.2% |
(0.9%) |
|
Equity to assets |
11.1% |
12.3% |
(1.2%) |
|
Capital Adequacy Ratios |
Q1'2020 |
Q1'2021 |
% Points change |
|
Core Capital/Total Liabilities |
16.6% |
17.5% |
0.9% |
|
Minimum Statutory ratio |
8.0% |
8.0% |
0.0% |
|
Excess |
8.6% |
9.5% |
0.9% |
|
Core Capital/Total Risk Weighted Assets |
13.8% |
14.4% |
0.6% |
|
Minimum Statutory ratio |
10.5% |
10.5% |
0.0% |
|
Excess |
3.3% |
3.9% |
0.6% |
|
Total Capital/Total Risk Weighted Assets |
16.5% |
17.0% |
0.5% |
|
Minimum Statutory ratio |
14.5% |
14.5% |
0.0% |
|
Excess |
2.0% |
2.5% |
0.5% |
Key take-outs from the earnings release include;
- Core earnings per share increased by 23.7% to Kshs 0.5, from Kshs 0.4 in Q1’2020, not in line with our expectation of a decline to Kshs 0.3. The performance was driven by a 5.9% increase in Net Interest Income to Kshs 6.0 bn, from Kshs 5.6 bn recorded in Q1’2020 due to the decline in the net interest expense,
- Interest income declined by 0.3% to Kshs 7.60 bn, from Kshs 7.62 bn in Q1’2020, attributable to the 1.8% decline in interest income from government securities to Kshs 2.0 bn, from Kshs 2.1 bn in Q1’2020 and an 88.2% decline in interest income from placements to Kshs 12.5 mn, from Kshs 69.4 mn in Q1’2020. Interest income from Loans and Advances remained relatively unchanged at Kshs 5.5 bn.
- The Yield on Interest-Earning Assets (YIEA) declined to 9.3%, from 9.9% in Q1’2020, attributable to the faster 5.3% y/y increase in average interest earning assets to Kshs 87.0 bn, from Kshs 82.6 bn in Q1’2020 that outpaced the 0.6% growth in trailing interest income. Trailing Interest Income refers to the performance of the interest income for the past 12 consecutive months,
- Interest expenses declined by 17.6% to Kshs 1.6 bn, from Kshs 2.0 bn in Q1’2020, following a 58.8% decline in placement liabilities to Kshs 0.2 bn, from Kshs 0.4 bn in Q1’2020, coupled with a 6.3% decline in interest expense on customer deposits to Kshs 1.4 bn, from Kshs 1.5 bn in Q1’2020. Cost of funds declined marginally by 0.3% points to 3.0%, from 3.3% in Q1’2020, owing to an 8.0% growth in average interest-bearing liabilities, against a 1.3% decline in trailing interest expense. Trailing interest expense refers to the performance of the interest expense for the past 12 consecutive months,
- Total operating expenses rose by 4.6% to Kshs 5.4 bn, from Kshs 5.2 bn in Q1’2020, largely driven by a 24.9% increase in Loan Loss Provisions (LLP) to Kshs 1.4 bn in Q1’2021, from Kshs 1.1 bn in Q1’2020. The increased provisions is attributed to the bank adopting a cautious stance on the back of the expectations of increase in defaults due to the subdued operating environment. The rise in operating expenses was however mitigated by a 7.6% decline in staff costs to Kshs 2.3 bn in Q1’2021, from Kshs 2.5 bn in Q1’2020,
- The balance sheet recorded an expansion as total assets rose by 0.7% to Kshs 384.1 bn, from Kshs 381.5 bn in Q1’2020. This growth was largely driven by a 7.5% growth in the loan book to Kshs 218.3 bn, from Kshs 203.0 bn in Q1’2020, coupled with a 1.1% increase in government securities to Kshs 126.7 bn, from Kshs 125.0 bn in Q1’2020. However, the growth was weighed down by a 30.8% decline in other assets to Kshs 17.6 bn, from Kshs 25.5 bn in Q1’2020,
- Total liabilities declined by 1.1% to Kshs 335.4 bn, from Kshs 339.2 bn in Q1’2020, driven by a 21.3% decline in other liabilities to Kshs 75.2 bn, from Kshs 95.6 bn in Q1’2020. On the other hand, customer deposits increased by 7.7% to Kshs 257.1 bn, from Kshs 238.7 bn in Q1’2020,
- Deposits per branch increased by 12.8% to Kshs 3.1 bn, from Kshs 2.7 bn in Q1’2020, with the number of branches having reduced to 84 in Q1’202021, from 88 in Q1’2020,
- Gross Non-Performing Loans (NPLs) remained relatively unchanged at Kshs 17.3 bn as was recorded in Q1’2020. The NPL ratio thus improved to 7.5% in Q1’2021, from 8.1% in Q1’2020, owing to the faster 7.8% growth in gross loans (after adding back interest suspense), which outpaced the flat growth in gross NPLs. General Loan Loss Provisions rose by 24.9% to Kshs 10.2 bn, from Kshs 8.8 bn in Q1’2020,
- The NPL coverage increased to 73.4% in Q1’2021, from 64.5% in Q1’2020, owing to a 24.9% increase in General Loan Loss Provisions, which outpaced the flat growth in gross non-performing loans, and,
- ABSA Bank Kenya is currently sufficiently capitalized with a core capital to risk-weighted assets ratio of 14.4%, 3.9% points above the 10.5% statutory requirement. In addition, the total capital to risk-weighted assets ratio was 17.0%, exceeding the 14.5% statutory requirement by 2.5% points. Adjusting for IFRS 9, the core capital to risk weighted assets stood at 14.5%, while total capital to risk-weighted assets came in at 17.1%.
For a comprehensive analysis, please see our ABSA Bank Q1’2021 Earnings Note
- Stanbic Bank Kenya
|
Stanbic Bank Kenya Q1’2021 Key Highlights |
|||
|
Balance Sheet |
|||
|
Balance Sheet items |
Q1’2020 (Kshs bns) |
Q1’2021 (Kshs bns) |
y/y change |
|
Net Loans and Advances |
161.8 |
157.9 |
(2.4%) |
|
Government Securities |
53.8 |
37.8 |
42.3% |
|
Total Assets |
309.7 |
317.0 |
2.6% |
|
Customer Deposits |
205.0 |
226.6 |
10.5% |
|
Deposits per Branch |
7.9 |
8.7 |
10.1% |
|
Total Liabilities |
269.1 |
273.5 |
1.6% |
|
Shareholders’ Funds |
40.6 |
43.5 |
7.2% |
|
Income Statement |
|||
|
Income Statement Items |
Q1’2020 (Kshs bns) |
Q1’2021 (Kshs bns) |
y/y change |
|
Net Interest Income |
3.0 |
3.2 |
5.0% |
|
Net non-Interest Income |
2.3 |
2.8 |
19.3% |
|
Total Operating income |
5.4 |
6.0 |
11.2% |
|
Loan Loss provision |
(0.6) |
(0.6) |
(1.2%) |
|
Total Operating expenses |
(3.2) |
(3.4) |
4.8% |
|
Profit before tax |
2.1 |
2.6 |
21.0% |
|
Profit after tax |
1.5 |
1.9 |
23.1% |
|
Key Ratios |
|||
|
Ratios |
Q1’2020 |
Q1’2021 |
% point change |
|
Yield from interest-earning assets |
5.4% |
6.1% |
0.7% |
|
Cost of funding |
0.8% |
0.7% |
0.1% |
|
Net Interest Margin |
5.4% |
6.1% |
0.7% |
|
Non- Performing Loans (NPL) Ratio |
12.1% |
15.1% |
0.3% |
|
NPL Coverage |
59.3% |
63.9% |
4.6% |
|
Cost to Income with LLP |
56.8% |
53.7% |
(3.1%) |
|
Loan to Deposit Ratio |
78.9% |
69.5% |
(9.4%) |
|
Return on Average Assets |
1.8% |
1.8% |
0.0% |
|
Return on Average Equity |
12.8% |
13.2% |
0.4% |
|
Equity to Assets |
13.1% |
14.4% |
1.3% |
|
Capital Adequacy Ratios |
|||
|
Ratios |
Q1'2020 |
Q1'2021 |
% point change |
|
Core Capital/Total Liabilities |
17.7% |
18.3% |
0.6% |
|
Minimum Statutory ratio |
8.0% |
8.0% |
0.0% |
|
Excess |
9.7% |
10.3% |
0.6% |
|
Core Capital/Total Risk Weighted Assets |
14.8% |
15.8% |
1.0% |
|
Minimum Statutory ratio |
10.5% |
10.5% |
0.0% |
|
Excess |
4.3% |
5.3% |
1.0% |
|
Total Capital/Total Risk Weighted Assets |
17.8% |
17.8% |
0.0% |
|
Minimum Statutory ratio |
14.5% |
14.5% |
0.0% |
|
Excess |
3.3% |
3.3% |
0.0% |
Key take-outs from the earnings release include;
- Profit after tax increased by 23.1% to Kshs 1.9 bn in Q1’2021, from Kshs 1.5 bn in Q1’2020. The performance was driven by an 11.2% increase in total operating income to Kshs 6.0 bn in Q1’2021, from Kshs 5.4 bn in Q1’2020. The increase was however weighed down by the 4.8% increase in total operating expenses to Kshs 3.4 bn, from Kshs 3.2 bn in Q1’2020,
- Interest income grew by 0.5% to Kshs 4.81 bn in Q1’2021, from Kshs 4.79 bn in Q1’2020. This was largely due to a 36.9% increase on interest income on government securities to Kshs 1.2 bn, from Kshs 0.9 bn in Q1’2020. The growth in interest income was however weighed down by a 2.2% decline in interest income from loans and advances to Kshs 3.55 bn, from Kshs 3.63 bn in Q1’2020,
- The Yield on Interest-Earning Assets declined to 9.3%, from 9.8% in Q1’2020, following the 1.5% decline in trailing interest income, which was outpaced by the 4.1% growth in the average interest earning assets,
- Interest expense declined by 7.3% to Kshs 1.6 bn, from Kshs 1.7 bn in Q1’2020, following a 15.9% decline in interest expenses on Deposits and placements to Kshs 0.1 bn, from Kshs 0.2 bn in Q1’2020. The decline was however weighed down by the 3.0% increase in the interest expense on customer deposits to Kshs 1.4 bn, from Kshs 1.3 bn in Q1’2020. Cost of funds, on the other hand, declined marginally to 0.7%, from 0.8% in Q1’2020, owing to the faster 6.8% growth in average interest-bearing liabilities, despite a 7.3% decline in interest expense,
- Total operating expenses increased by 4.8% to Kshs 3.4 bn in Q1’2021, from Kshs 3.2 bn in Q1’2020, largely driven by a 6.2% increase in the staff costs to Kshs 2.8 bn, from Kshs 2.6 bn in Q1’2020. Notably, Loan loss provisions decreased by 1.2% Kshs 609.5 mn, from Kshs 617.0 mn in Q1’2020,
- The balance sheet recorded an expansion as total assets rose by 2.4% to Kshs 317.0 bn, from Kshs 309.7 bn in Q1’2020. This growth was largely driven by a 42.3% increase in the government securities to Kshs 53.8 bn, from Kshs 37.8 bn in Q1’2020. The growth was however slowed down by a sharp decline in placements of 85.1% to Kshs 1.8 bn, from Kshs 12.1 bn in Q1’2020, coupled with a 2.4% decline in the loan book to Kshs 158.0 bn, from Kshs 161.8 bn in Q1’2020,
- Total liabilities rose by 1.6% to Kshs 273.5 bn, from Kshs 269.1 bn in Q1’2020, largely driven by a 10.6% increase in customer deposits Kshs 226.6 bn in Q1’2021, from Kshs 205.0 bn in Q1’2020.
- Deposits per branch increased by 10.6% to Kshs 8.7 bn, from Kshs 7.9 bn in Q’2020and the number of branches remained unchanged at 26,
- Gross Non-Performing Loans (NPLs) increased by 25.5% to Kshs 26.4 bn in Q1’2021, from Kshs 21.1 bn in Q1’2020. The NPL ratio thus increased to 15.1% in Q1’2021, from 12.1% in Q1’2020, attributable to the faster 25.5% growth in Gross Non-Performing Loans (NPLs), which outpaced the 0.3% increase in Gross Loans,
- General Loan Loss Provisions increased by 41.2% to Kshs 11.0 bn, from Kshs 7.8 bn in Q1’2020. The NPL coverage ratio improved to 63.9% in Q1’2021, from 59.3% in Q1’2020, due to the faster 41.2% growth in General Loan Loss Provisions which was outpaced by the 25.5% growth in Gross Non-Performing Loans (NPLs), and,
- Stanbic Bank is currently sufficiently capitalized with a core capital to risk weighted assets ratio of 15.8%, 5.3% points above the statutory requirement of 10.5%. In addition, the total capital to risk weighted assets ratio was 17.8%, exceeding the statutory requirement of 14.5% by 3.3% points.
For a comprehensive analysis, please see our Stanbic Bank Q1’2021 Earnings Note
Asset Quality
The table below is a summary of the asset quality for the companies that have released
|
Bank |
Q1'2020 NPL Ratio |
Q1'2021 NPL Ratio |
Q1'2020 NPL Coverage |
Q1'2021 NPL Coverage |
% Points Change in NPL Ratio |
% Points Change in NPL Coverage |
|
Stanbic Bank |
12.1% |
15.1% |
59.3% |
63.9% |
3.0% |
4.6% |
|
Co-operative Bank of Kenya |
10.8% |
16.9% |
54.8% |
58.4% |
6.1% |
3.6% |
|
ABSA Bank Kenya |
8.1% |
7.5% |
64.5% |
74.3% |
(0.6%) |
9.8% |
|
Mkt Weighted Average* |
11.4% |
13.5% |
57.4% |
64.7% |
2.1% |
7.3% |
|
*Market cap weighted as at 21/05/2021 **Market cap weighted as at 02/06/2020 |
||||||
Key take-outs from the table include;
- Asset quality for the 3 listed banks that have released their Q1’2021 results deteriorated during the period of review, with the weighted average NPL ratio rising by 2.1% points to a market cap weighted average of 13.5%, from 11.4% in Q1’2020. The deterioration in asset quality was as a result increased non-performing loans due to the increased credit risk as the economy slowed down due the Covid-19 pandemic. and,
- NPL Coverage for the 3 banks increased to a market cap weighted average of 64.7% in Q1’2021, from 57.4% recorded in Q1’2020, as the banks increased their provisioning levels to proactively manage risks given the tough economic conditions occasioned by the pandemic. We expect higher provisional requirements to subdue profitability in the medium term across the banking sector on account of the tough business environment. Additionally, we expect banks to continue over-provisioning, albeit at a slower rate than in 2020.
Summary Performance
The table below highlights the performance of the banks that have released so far, showing the performance using several metrics, and the key take-outs of the performance;
|
Bank |
Core EPS Growth |
Interest Income Growth |
Interest Expense Growth |
Net Interest Income Growth |
Net Interest Margin |
Non-Funded Income Growth |
NFI to Total Operating Income |
Growth in Total Fees & Commissions |
Deposit Growth |
Growth in Government Securities |
Loan to Deposit Ratio |
Loan Growth |
Return on Average Equity |
|
Stanbic |
23.1% |
0.5% |
(7.3%) |
5.0% |
6.1% |
19.3% |
46.7% |
(8.5%) |
10.6% |
42.3% |
69.5% |
(2.4%) |
13.2% |
|
Co-op |
(3.7%) |
27.6% |
19.8% |
30.7% |
8.6% |
(9.2%) |
32.0% |
(15.7%) |
16.0% |
43.4% |
75.7% |
8.0% |
12.3% |
|
ABSA |
23.7% |
(0.3%) |
17.6% |
5.9% |
7.0% |
(3.9%) |
32.0% |
7.4% |
7.7% |
1.1% |
84.9% |
7.5% |
13.6% |
|
Q1'21 Mkt Weighted Average* |
10.7% |
12.9% |
13.4% |
17.3% |
7.6% |
(1.5%) |
35.1% |
(6.7%) |
12.2% |
29.5% |
77.4% |
5.7% |
12.9% |
|
Q1’20 Mkt Weighted Average** |
(7.4%) |
8.2% |
11.4% |
7.4% |
7.2% |
15.9% |
22.7% |
24.5% |
14.3% |
14.9% |
74.1% |
14.1% |
17.2% |
|
*Market cap weighted as at 21/05/2021 **Market cap weighted as at 02/06/2020 |
|||||||||||||
Key takeaways from the table above include:
- For the three listed banks that have released, they have recorded a 10.7% weighted average growth in core Earnings Per Share (EPS), compared to a weighted average decline of 7.4% in Q1’2020 for the entire listed banking sector. The commendable performance is mainly attributable to the recovery in the sector’s net interest income during the period,
- The Banks have recorded a weighted average deposit growth of 12.2%, slower than the 14.3% growth recorded in Q1’2020,
- Interest expense grew at a faster pace, by 13.4%, compared to the 11.4% growth in Q1’2020 while cost of funds declined, coming in at a weighted average of 1.5% in Q1’2021, from 3.20% in Q1’2020, owing to the faster growth in average interest-bearing liabilities, an indication that the listed banks were able to mobilize cheaper deposits,
- Average loan growth came in at 5.7%, lower than the 14.1% growth recorded in Q1’2020. The loan growth was also slower than the 29.5% growth in government securities, an indication of the banks’ preference of investing in Government securities as opposed to lending due to the elevated credit risk occasioned by the pandemic. The faster growth in government securities could also be attributed to cautious lending by banks in a bid to reduce cost of risk as well as mitigate further deterioration of the asset quality,
- Interest income grew by 12.9%, compared to a growth of 8.2% recorded in Q1’2020. Notably, the Yield on Interest Earning Assets (YIEA) increased to 10.4%, from the 9.8% recorded in Q1’2020, an indication of the increased allocation to higher-yielding government securities by the sector during the period. Consequently, the Net Interest Margin (NIM) now stands at 7.6%, 0.4% points higher than the 7.2% recorded in Q1’2020 for the whole listed banking sector, and,
- Non-Funded Income growth declined by 1.5% compared to the 15.9% growth recorded in Q1’2020. This can be attributable to a slower growth in the fees and commission which declined by 6.7% compared to a growth of 24.5% in Q1’2020.
Universe of Coverage
Below is a summary of our universe of coverage and the recommendations:
|
Company |
Price at 13/5/2021 |
Price at 21/5/2021 |
w/w change |
YTD Change |
Year Open 2021 |
Target Price* |
Dividend Yield |
Upside/ Downside** |
P/TBv Multiple |
Recommendation |
|
I&M Holdings*** |
24.3 |
23.4 |
(3.9%) |
(47.9%) |
44.9 |
29.9 |
9.6% |
37.7% |
0.3x |
Buy |
|
Standard Chartered*** |
132.0 |
131.5 |
(0.4%) |
(9.0%) |
144.5 |
164.4 |
8.0% |
33.0% |
0.9x |
Buy |
|
Diamond Trust Bank*** |
65.0 |
63.8 |
(1.9%) |
(16.9%) |
76.8 |
84.3 |
0.0% |
32.2% |
0.3x |
Buy |
|
Stanbic Holdings |
83.0 |
81.0 |
(2.4%) |
(4.7%) |
85.0 |
99.4 |
4.7% |
27.4% |
0.8x |
Buy |
|
KCB Group*** |
42.0 |
41.0 |
(2.3%) |
6.8% |
38.4 |
49.8 |
2.4% |
23.9% |
1.0x |
Buy |
|
NCBA*** |
24.7 |
24.9 |
0.8% |
(6.6%) |
26.6 |
28.4 |
6.0% |
20.3% |
0.6x |
Buy |
|
Equity Group*** |
41.0 |
41.5 |
1.3% |
14.5% |
36.3 |
49.5 |
0.0% |
19.3% |
1.3x |
Accumulate |
|
Co-op Bank*** |
12.5 |
12.3 |
(1.6%) |
(2.4%) |
12.6 |
13.6 |
8.2% |
19.2% |
0.9x |
Accumulate |
|
ABSA Bank*** |
8.8 |
9.1 |
3.4% |
(4.4%) |
9.5 |
10.2 |
0.0% |
12.1% |
1.0x |
Accumulate |
|
HF Group |
4.0 |
3.6 |
(9.5%) |
15.3% |
3.1 |
3.8 |
0.0% |
5.0% |
0.2x |
Hold |
|
*Target Price as per Cytonn Analyst estimates **Upside/ (Downside) is adjusted for Dividend Yield ***For Disclosure, these are stocks in which Cytonn and/or its affiliates are invested in. Key to note, I&M Holdings YTD share price change is mainly attributable to counter trading ex-bonus issue. |
||||||||||
We are “Neutral” on the Equities markets in the short term. With the market currently trading at a premium to its future growth (PEG Ratio at 1.4x), we believe that investors should reposition towards companies with a strong earnings growth and are trading at discounts to their intrinsic value. Additionally, we expect the recent discovery of new strains of COVID-19 coupled with the introduction of strict lockdown measures in major economies to continue dampening the economic outlook.
- Retail Sector
During the week, Naivas supermarket, a local retail chain, opened a new store in Zion Mall, Eldoret, in addition to signing a lease agreement with Greenspan Mall in Donholm to become the anchor tenant taking up 57,000 SQFT of space. With addition of the two outlets previously occupied by Tuskys Supermarket, this will bring Naivas’ operational outlets to 72 having already opened 2 other stores so far this year in Nakuru and Kilifi. The retailer has been on an aggressive expansion spree taking up space vacated by troubled retailers supported by an increase in its financial strength after signing an agreement with a France-based private equity fund, Amethis Finance, of which it sold to a 30.0% stake in January 2020. Naivas’ aggressive expansion drive in the two locations is supported by i) positive demographics increasing the need for formal retail space with Kenya’s high urbanization and population growth rates at 4.0% and 2.2%, respectively, compared to the global average of 1.9% and 1.1%, respectively according to World bank, ii) growing middle class with increased purchasing power, iii) changing consumer tastes and preferences, and, iv) exit by troubled retailers leaving prime retail spaces.
In terms of performance, according to our Kenya Retail Report 2020, Eldoret recorded the highest occupancy rates at 80.2%, 3.6% points higher than the market average of 76.6%, showing the area’s high demand for retail spaces hence presenting a good investment opportunity for Naivas.
The table below shows a summary of the performance of the retail sector in key urban cities in Kenya.
|
Summary Performance of Key Urban Cities in Kenya |
|||
|
Region |
Rent/SQFT 2020 |
Occupancy% 2020 |
Rental Yield |
|
Mount Kenya |
125.0 |
78.0% |
7.7% |
|
Nairobi |
168.5 |
74.5% |
7.5% |
|
Mombasa |
114.4 |
76.3% |
6.6% |
|
Kisumu |
97.2 |
74.0% |
6.3% |
|
Eldoret |
130.0 |
80.2% |
5.9% |
|
Nakuru |
55.7 |
76.6% |
5.9% |
|
Average |
115.1 |
76.6% |
6.7% |
Source: Cytonn Research 2020
In the Nairobi Metropolitan Area, according to according to our Cytonn Q1’ 2021 Markets Review, Eastlands recorded the lowest rental rates of Kshs 132, against the average market rent price of Kshs 166, therefore encouraging space uptake by the retailer due to affordability.
|
Nairobi Metropolitan Area Retail Market Performance Q1’2021 |
|||
|
Area |
Rent (Kshs) /SQFT Q1'2021 |
Occupancy% Q1'2021 |
Rental Yield Q1'2021 |
|
Westlands |
205 |
84.5% |
10.1% |
|
Karen |
219 |
82.6% |
10.1% |
|
Kilimani |
173 |
83.8% |
8.7% |
|
Ngong Road |
178 |
75.0% |
7.6% |
|
Kiambu Road |
163 |
70.8% |
6.7% |
|
Mombasa Road |
139 |
73.0% |
6.0% |
|
Satelite Towns |
138 |
72.4% |
6.0% |
|
Thika Road |
148 |
66.8% |
5.6% |
|
Eastlands |
132 |
66.0% |
5.5% |
|
Average |
166 |
75.0% |
7.4% |
Source: Cytonn Research 2021
Naivas also aims to open three more branches next month; along Muindi Mbingu Street in Nairobi’s Central Business District (CBD), in Kisumu at Simba Club Hall and in Githurai 44 along Kamiti Road as it continues on its aggressive expansion drive in order to gain more market share relative to its competitors QuickMart and Carrefour who have each opened 4 stores so far this year.
The table below shows the summary of the number of stores of the key local and international retail supermarket chains in Kenya;
|
Main Local and International Retail Supermarket Chains |
|||||||||
|
Name of Retailer |
Category |
Highest number of branches that have ever existed as at FY’2018 |
Highest number of branches that have ever existed as at FY’2019 |
Highest number of branches that have ever existed as at FY’2020 |
Number of branches opened in 2021 |
Closed branches |
Current number of Branches |
Number of branches expected to be opened |
Projected number of branches FY’2021 |
|
Naivas |
Local |
46 |
61 |
69 |
3 |
0 |
72 |
3 |
75 |
|
QuickMart |
Local |
10 |
29 |
37 |
4 |
0 |
41 |
4 |
45 |
|
Chandarana Foodplus |
Local |
14 |
19 |
20 |
0 |
0 |
20 |
0 |
20 |
|
Carrefour |
International |
6 |
7 |
9 |
4 |
0 |
13 |
0 |
13 |
|
Cleanshelf |
Local |
9 |
10 |
11 |
1 |
0 |
12 |
0 |
12 |
|
Tuskys |
Local |
53 |
64 |
64 |
0 |
61 |
3 |
0 |
3 |
|
Game Stores |
International |
2 |
2 |
3 |
0 |
0 |
3 |
0 |
3 |
|
Uchumi |
Local |
37 |
37 |
37 |
0 |
35 |
2 |
0 |
2 |
|
Choppies |
International |
13 |
15 |
15 |
0 |
13 |
2 |
0 |
2 |
|
Shoprite |
International |
2 |
4 |
4 |
0 |
3 |
1 |
0 |
1 |
|
Nakumatt |
Local |
65 |
65 |
65 |
0 |
65 |
0 |
0 |
0 |
|
Total |
257 |
313 |
334 |
12 |
177 |
169 |
7 |
176 |
|
Source: Online Research
Despite the expansion of some retailers, the real estate retail sector performance continues to be affected by factors such as; i) oversupply which is currently at 2.0mn SQFT in the Kenyan retail market and 3.1mn SQFT in Nairobi Metropolitan Areas (NMA), ii) shift to online shopping leading reduced demand for physical space, and, iii) reduced consumer spending power among consumers resulting from a tough financial environment. We however expect performance of the retail sector to be cushioned by; i) continuous expansions by local and international retailors taking up prime retail spaces, ii) positive demographics in Kenya owing to a growing middle class, iii) improving infrastructure in various areas opening up areas to investment, and, iv) investor confidence with Kenya having been ranked position #56 by World Bank.
- Infrastructure
During the week, Uganda signed a Public-Private Partnership (PPP) deal worth Kshs 5.0 bn with China Roads and Bridge Corporation (CRBC) to renovate its century-old meter gauge railway line between Malaba and Kampala. The 260.0 km railway line will be linked to the Standard Gauge Railway (SGR) track in Kenya, through Naivasha to Malaba old railway, which the government of Kenya is currently upgrading. The upgrade of the railway line is expected to be completed within a year, by China Roads and Bridge Corporation (CRBC), and once completed, it will open up surrounding areas to trade and tourism activities, as well as provide seamless transport of goods from the Mombasa port to Uganda through the SGR. Moreover, it will enhance real estate investment opportunities in the surrounding areas.
Additionally, during the week, President Uhuru Kenyatta launched the first berth of the Lamu Port-South Sudan-Ethiopia-Transport (LAPSSET) corridor, a project that targets to link Kenya to South Sudan, Ethiopia and the middle belt of Africa. The 2,500.0 km project worth Kshs 2.5 tn kicked off in March 2012 as a PPP project between Kenya, Ethiopia and South Sudan, and Development Bank of South Africa, European Union and African Development Bank. However, it has been stalling due to limited finances, fraudulent land transactions, as well as the government’s failure to compensate land owners who in return refused to vacate their lands thus causing property access difficulties resulting to the project delays. The government has been raising finances through infrastructure bonds and equity participation and now has started the process by even compensating the land owner. The second and third berth of the projects are expected to be completed by December 2021 which makes the implementation extremely ambitious. Once the project is completed, it will enhance easier and faster transport of goods and also open up surrounding areas to trade and tourism activities, as well as boost property prices and investment opportunities such as construction of residential units within Lamu and its environs.
The government continues to support and implement select infrastructural projects through public-private partnerships which have proven to have benefits such as large scale investment and developments, access to finance for projects, and government access to private sector efficiencies, among many others. For more details on the Private Public partnership read our Public-Private Partnerships in the Real Estate Industry in Kenya report.
The graph below shows the budget allocation to the infrastructure sector over the last nine financial years and it’s clear from the table below that the allocations have been erratic and have reduced over the last two financial years;
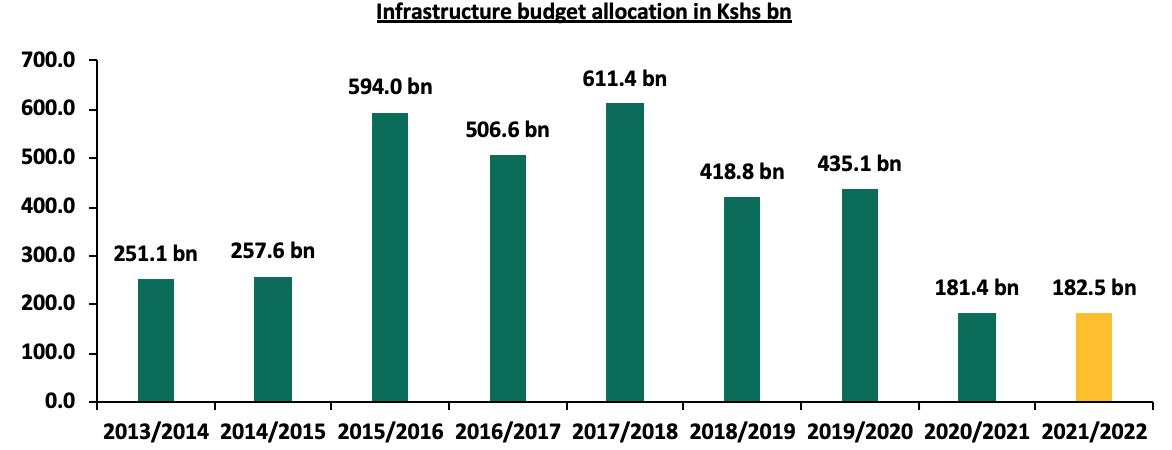
Source: National Treasury
We expect performance of the real estate sector to continue recording increased activities supported by the expansion of local and international retailers taking up space previously occupied by trouble tenants such as Tuskys and Nakumatt, as well as the aggressive implementation of infrastructural projects by the government despite the pandemic.
In March 2021, Kenya saw its sovereign rating downgraded by all the major rating agencies; Standard & Poor’s , Fitch Rating and Moody’s. The lowering of the credit rating was mainly on the back of Kenya’s high fiscal deficit coupled with the economic shocks occasioned by the challenges brought about from the impact of the COVID-19 pandemic. With the downgrading and the constant increase in the fiscal deficit we have seen some pressure on the local bonds yield curve which has resulted to 1.4% decline in the FTSE NSE Bond Index. Despite the challenges that have been facing the economy the shilling has held stable this year having appreciated by 0.5% YTD following a 7.7% depreciation in 2020. The main support that the shilling has been having is the lower demand from imports and the decline in dividend payments, we have seen increased inflows to the bond market, increased diaspora remittances, inflows from the IMF in support of the economy and the higher forex reserves held by the Central bank. This week we shall be focusing in detail the factors that are expected to drive the performance of the Kenya shilling and the interest rates and thereafter give our outlook for 2021;
In our Currency and Interest Rates Outlook which was covered in May 2020, our outlook on the currency was a 5.5% depreciation by the end of 2020, driven by the reduced exports earning due to the lockdown measures put in place by Kenya’s trade partners coupled with the high fiscal deficit seen during the period. On the interest rates, we expected a slight upward readjustment on the yield curve due to the increased pressure on the government to plunge in the budget deficit coupled with the increased demand by investors for higher yields due to the perceived risk in the country.
With the shilling having appreciated by 0.5% on a YTD basis and the upward readjustment seen on the yield curve since the year began, we saw the need to revisit the topic on currency and interest rates outlook, in order to shed some light on how the shilling and the interest rates are expected to behave in 2021.
In this note, we shall be focusing in detail the factors that are expected to drive the performance of the Kenya shilling and the interest rates and thereafter give our outlook for 2021 based on these factors. We shall cover the following:
- Historical Performance of the Kenyan Shilling,
- Evolution of the Interest Rate Environment,
- Factors Expected to Drive Currency Performance,
- Underlying Factors Expected to Drive The Interest Rate Environment, and,
- Conclusion and Our View Going Forward
Section I: Historical Performance of the Kenyan Shilling
Over the past 8 years, the Kenya Shilling has been relatively stable against the US Dollar as can be seen from the chart below.
Source: Central Bank of Kenya
Below are some of the factors that has been supporting the shilling
- The high reserves held by the Central bank which was above the statutory target of 4.0-months import cover, having averaged USD 8.1 bn equivalent to 5.2 months average import cover.
The chart below shows the trend of the evolution of the forex reserves:
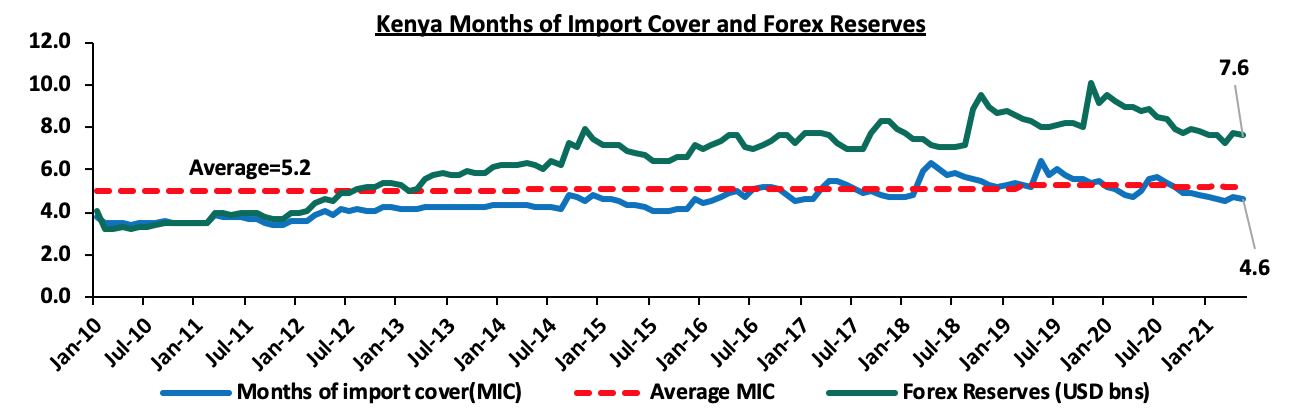
Source: Central Bank of Kenya
Since the onset of the pandemic, forex reserves have been dwindling with the lowest reserves being recorded on the week ended 26th March 2021 of USD 7.3 bn (4.5 months of import cover). The decline is largely attributable to reduced tourism and foreign travel inflows due to Covid-19 constraints, as well as increased debt service obligations due to the shilling depreciating by 7.7% in 2020.
- Strong diaspora remittances, which have grown by a 10-year CAGR of 15.6% to USD 299.3 mn, in April 2021 from USD 71.6 mn recorded in April 2011 attributable to the increasing Kenyan population in the diaspora and advancing technology that makes transfer of money easier. The chart below shows the trend of the evolution of the Diaspora Remittances:
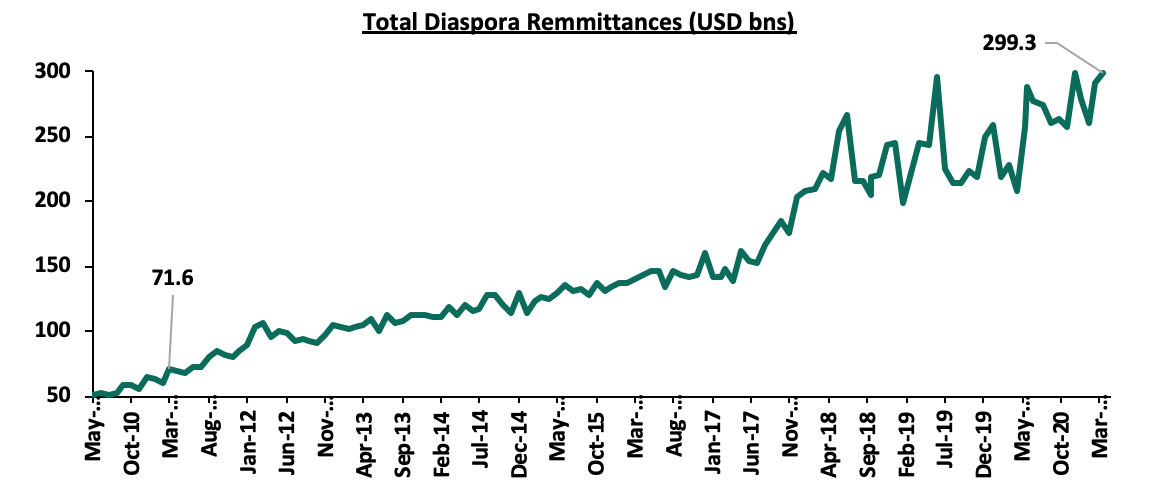
Source: Central Bank of Kenya
- The narrowing of the current account due to the increased value of the country’s principal exports with a key focus on the value of tea exports which have grown by a 10-year CAGR of 3.8% to an estimate of Kshs 11.4 bn in January 2021, from Kshs 7.8 bn recorded in January 2011, Below is a chart showing the trend of the current account on a quarterly basis:
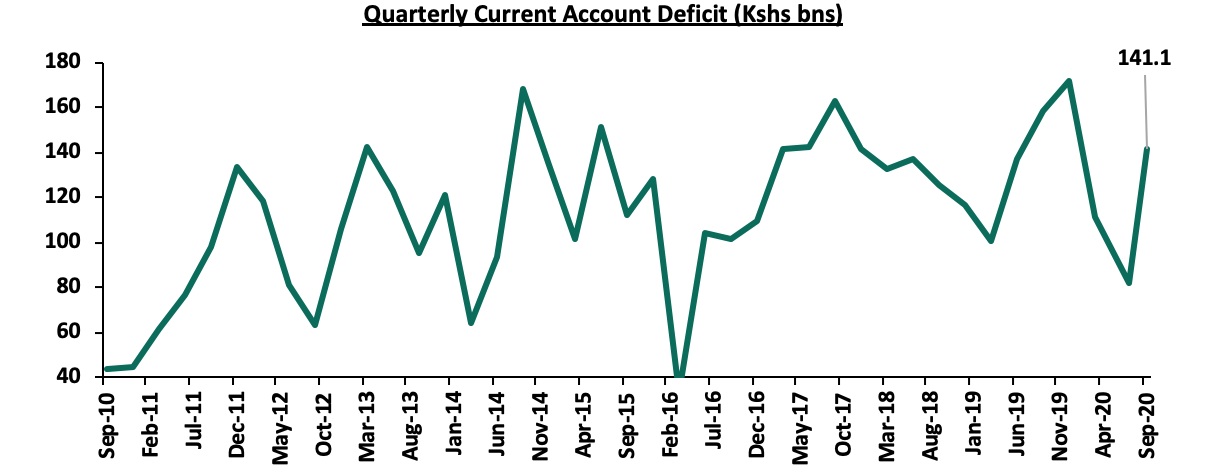
Source: Reuters
- The increased flow of business especially from the tourism sector pre-COVID period evidenced by the 3.9% growth in tourist arrivals to 2.1 mn in 2019 from 2.0 mn tourists in 2018 after recording a 37.3% increase from 1.5 mn in 2017. However, tourist arrivals declined by 85.5% to 1.1 mn in 2020 as COVID-19 took a toll on the economy, and,
- Improved investment into the country as measured by the FDI flows into the country which had grown significantly by 115.0% to USD 1.3 bn in 2019 from USD 0.6 bn in 2015.
Last year due to the pandemic the shilling depreciated significantly up to 7.7% in 2020 as compared to the 0.5% appreciation in 2019. The shilling recorded an all-time low of Kshs 111.6 against the dollar on December 17th 2020, which was mainly attributable to the reduced dollar inflows as foreigners exited the market and companies closed for the holiday season leading to a reduction in exports of other commodities.
We have however seen a recovery and stability of the shilling this year with the total shilling having appreciated by 0.5% on a YTD basis to close at Kshs 108.2 on 21st May 2021.
The current appreciation of the shilling is mainly attributable to:
- The Forex reserves, currently at USD 7.5 bn (equivalent to 4.6-months of import cover), which is above the statutory requirement of maintaining at least 4.0-months of import cover, and the EAC region’s convergence criteria of 4.5-months of import cover,
- The improving current account position which narrowed to 4.8% of GDP in the 12 months to December 2020 compared to 5.8% of GDP during a similar period in 2019, and,
- Improving diaspora remittances evidenced by a 43.8% y/y increase to USD 299.3 mn in April 2021, from USD 208.2 mn recorded over the same period in 2020, has cushioned the shilling against further depreciation.
Section II: Evolution of the Interest Rate environment in Kenya
Kenya’s interest rate environment has witnessed high volatility more so in the periods between 2011 and 2015. During this period, the yields on government papers increased, with the 91-day paper’s yield coming in at 21.7% in October 2015, a 3-year high from the last recorded high yields of 20.6% recorded in January 2012. Key to note, yields on government papers largely follow what is happening in the economy and in times of expected high borrowing, lending rates tend to shoot up.
Since 2016, the yield on government papers have remained relatively stable despite the continuous high budget deficit which has averaged about 8.0% over the last 10 years and is currently projected to come in at 8.7% of the GDP as per the FY’2020/21 supplementary Budget I. In order to see how the entire yield curve has performed over the last 10 years the chart below summarizes the key shifts. It is clear that yields have been stable and this can be attributed to
- The continuous improvement in the fiscal deficit
- The improved revenue collections. This has registered a 10 year CAGR of
- The diversification of funding sources by the government
- The discipline in rejecting expensive bids by the CBK
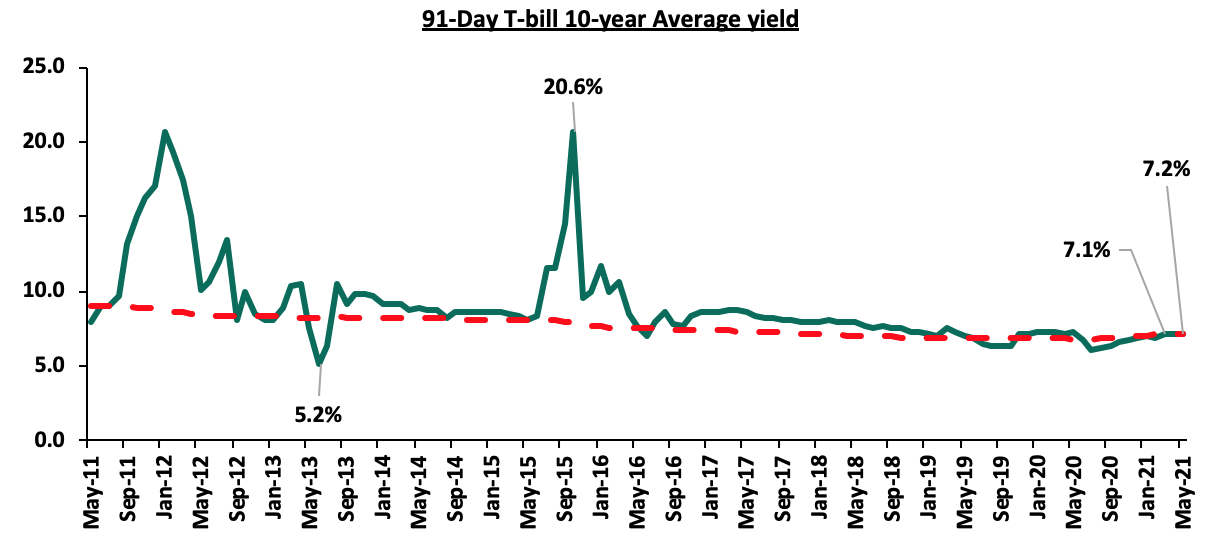
Source: Central Bank of Kenya
Given the adverse effects emanating from the COVID-19 pandemic and the lowering of Kenya’s Credit rating by various rating agencies, we expect the government to borrow aggressively in the local market as it seeks to plug in the fiscal deficit and consequently create uncertainty in the interest rate environment. For the first nine months of FY’2021/2021, the government has continued to fall short of its revenue collection, collecting cumulatively only Kshs 1.9 tn (63.6% of its revised annual target of Kshs 2.9 tn) as at March 2021. The shortfall in the revenue collection stems from the tax incentives that were seen in 2020 as the government tried to cushion its citizens from the pandemic. However, the reversal of these tax incentives has seen an improvement in tax collections with KRA reporting that it had surpassed its revenue target collection for the month of April 2021 by collecting Kshs 176.7 bn, against a target of Kshs 170.2 bn.
We believe that in order for the government to ease pressure on the interest rate, they should:
- Continue implementing measures to reduce debt service to revenue ratio which was estimated at 41.4% at the end of 2020, 11.4% points higher than the recommended threshold of 30.0% but 15.4% points lower than FY’ 2019’s debt service ratio of 56.8%, attributable to reduced debt service obligations during the year,
- Contain the government expenditure. With the new devolved system of governance, there needs to be a check on the government spending, both at the county and Central government level. The current aggression in borrowing by the government is aimed at financing its operations at both levels and it would be important to limit expenditure to the core activity of the government as well as reduce wasteful spending, and,
- Shift financing strategies to prioritize concessional financing, and to use commercial borrowing in limited amounts.
Section III: Factors expected to drive currency performance
In this section, we will analyze the key factors expected to drive the performance of the Kenyan Shilling:
- Balance of payments
According to the Q3’2020 Balance of Payments report released by the Kenya National Bureau of Statistics (KNBS), Kenya’s current account deficit narrowed by 10.6% (equivalent to 11.5% of GDP) in Q3’2020, to Kshs 141.1 bn, from Kshs 157.9 bn (equivalent to 12.7% of GDP) recorded in a similar period of review in 2019. This was attributed to an 11.1% increase in the value of exports to Kshs 163.7 bn in Q3’2020, from Kshs 147.3 bn in Q3’2019, while imports reduced by 6.6% to Kshs 392.7 bn in Q3’2020. Towards the end of 2020, the export sector witnessed slight improvement evidenced by the increase in merchandise exports mainly on account of increased earnings from horticulture as well as tea and coffee. As the Corona virus restriction measures continue to ease, we expect the demand in Kenya’s export markets to normalize as accelerated vaccination continues in many countries. This will support movement of both commodities and people globally. However, the business environment will still have a sluggish growth as key sectors like tourism continue to suffer losses occasioned by the third wave of the virus that has seen bans on several international travels. Also, the high fuel prices currently witnessed in the country are likely to increase the import bill. The high import bill will weigh on the improving current account balance and as such, we expect the shilling to stabilize against other currencies.
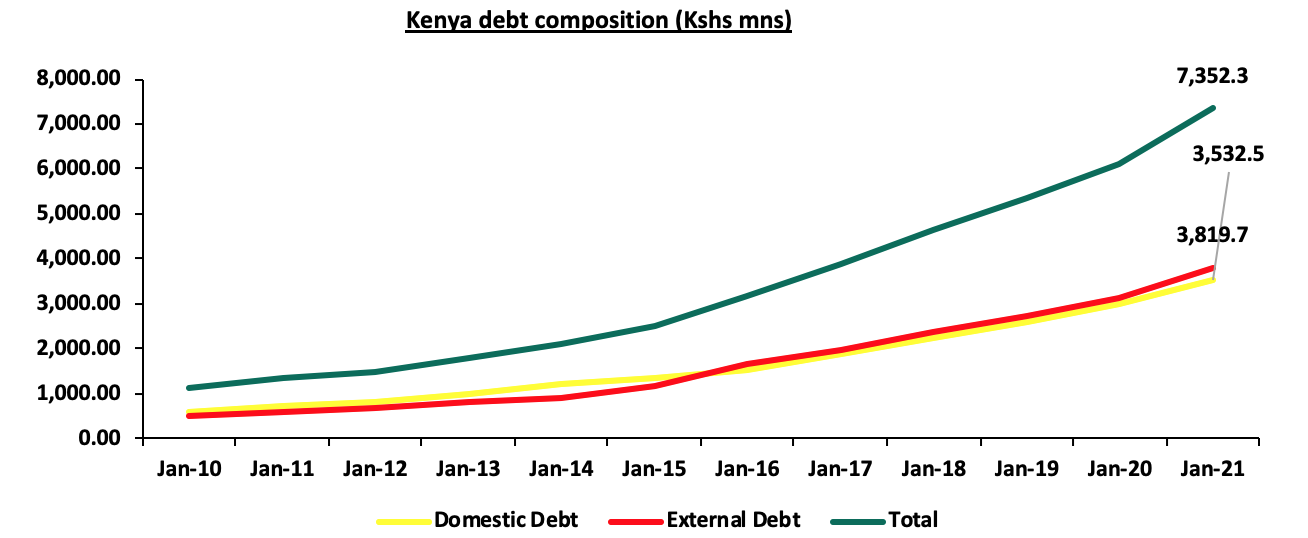
- Government debt
We expect the shilling to experience pressure due to the repayment of the government debt. The projected amounts that is expected to be used for foreign debt servicing stands at Kshs 427.0 bn. Currently, Kenya’s debt stands at Kshs 7.4 tn of which Kshs 3.8 tn is external debt as highlighted in the chart below:
- Forex Reserves
Since the onset of the pandemic, Kenya’s Forex Reserves have been dwindling with May 2021 recording a 9.4% decline to USD 7.5 bn (4.6- months import cover), from USD 8.3 bn (5.2-months imports cover) in May 2020. The dwindling forex reserves seen during the period can be attributed to low inflows from key sectors like tourism amid government obligations of debt servicing. However, the USD 314.0 mn disbursement from the International Monetary Fund (IMF) to the government earlier in April, has supported the reserves as evidenced by the 4.4% increase to USD 7.7 bn (4.8-months imports cover) in April 2021 from USD 7.3 bn (4.5-months imports cover) in March 2021. Going forward, we expect the reserves to be supported by increasing diaspora remittance inflows, continued investor capital inflows with hope for an economic recovery and increasing exports as the key trading partners continue to contain the virus and re-open their economies. However, the elevated debt levels witnessed in the country are likely to put forex reserves under pressure as most of it will be used to repay the debts. As a consequence, the Kenyan shilling will be exposed to foreign exchange volatility causing it to weaken.
- Monetary Policy
In 2021 the Central Bank Rate (CBR) was revised down to 7% from 8.25% in January 2020. As a result, domestic investment activities have declined as Kenya’s financial and capital assets have become less appealing to investors on account of their lower real rate of return. Consequently, the shilling saw significant depreciation up to 7.7% in 2020, as the demand for the dollar continued increasing. However, on a YTD basis the shilling has appreciated by 0.5% to close the week ended 21st May 2021 at Kshs 108.2. The interest rates have been stable and any further declines in the rates would lead to more depreciation of the shilling. It is therefore important that the monetary policy committee is cautious on the next moves. On the other hand, the Inflation rates have remained within the government’s target of 2.5% - 7.5% despite the high fuel prices and as such, we do not expect the CBK to increase the rates as the Central Bank is mainly focused on reviving the economy.
Outlook:
|
Driver |
Outlook |
Effect on the currency |
|
Balance of Payments |
|
Positive |
|
Government Debt |
|
Negative |
|
Forex Reserves |
|
Neutral |
|
Monetary Policy |
|
Neutral |
From the above currency drivers, 1 is Positive (balance of payment), 1 is negative (Government Debt), while 2 are neutral (Forex Reserves and Monetary Policy) indicating a neutral outlook for the currency.
Section IV: Underlying factors expected to drive the Interest Rate environment
- Fiscal Policies
The country has been running a fiscal deficit which is expected to continue growing in the short term as the overall budget grows but the revenue collections struggle to keep pace. The government has introduced more measure to increase revenue collections and we have already seen those bear fruits. The Finance Act 2020 that introduced the minimum tax and digital services tax, will play an instrumental role in enhancing revenue collection through tax amendments meant to broaden the tax base. Due to the continued increase in the deficit we expect the government to borrow heavily in the market. The projected total borrowings in the next fiscal year stands at 952.9 mn which is a projected deficit of 7.7% of the GDP. Below is a chart showing the revenue collections and domestic borrowings over the last 10 years:
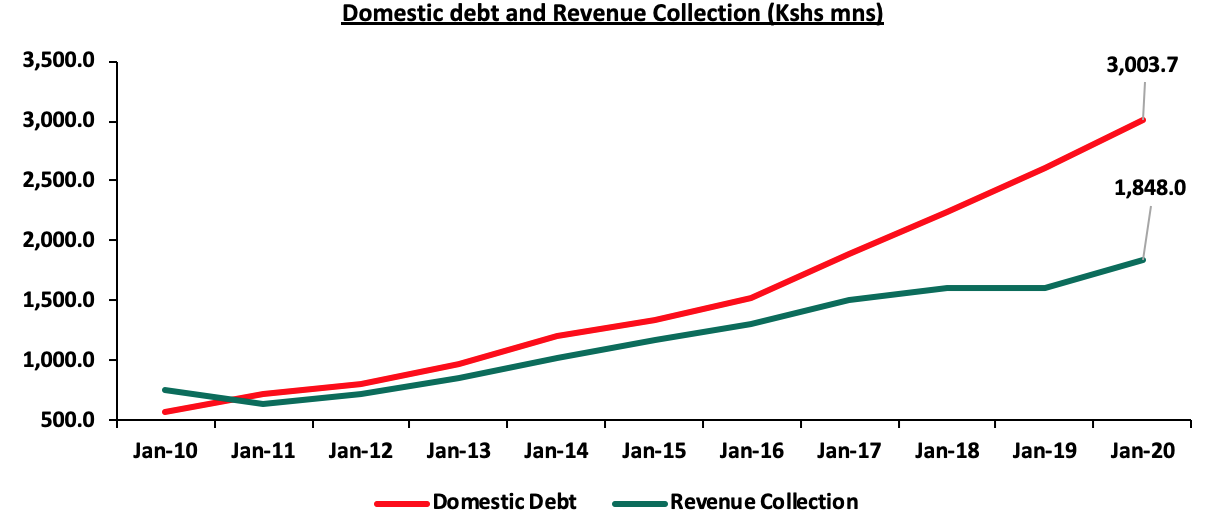
Liquidity
The MPC lowered the Cash Reserve to Ratio (CRR) to 4.25% from 5.25% in their March 2020 sitting and increased the maximum tenor of Repurchase Agreements (Repos) to 90 days from 28 days so as to enable banks to access long-term liquidity secured in their holdings in government papers. The CBK also availed Kshs 35.2 bn to commercial banks, in a bid to support borrowers affected by the Coronavirus pandemic. As a result, liquidity in the money market has remained favorable though volatile as evidenced by the interbank rates averaging between 6.2% and 1.8% since the pandemic started. In an ideal situation, ample liquidity in the money market, the lowering of commercial banks’ lending, and deposit rates would lead to increased money supply in the economy and an increase in consumers’ purchasing power.
We believe that the lower CRR has played a big role in maintaining favorable liquidity in the money market and as the effects of the Coronavirus continue to be felt in the economy, banks are still finding it difficult to lend to businesses and individuals as the levels of uncertainty and credit risk increases. Consequently, more money is expected to flow into government securities, which will provide some relief on government yields due to decreased credit competition from the private sector. However, liquidity in the money market might tighten as the Central Bank looks to settle the T-bill maturities worth Kshs 165.0 bn for the FY’2020/21. Moreover, increased balance sheet activity ahead of half year reporting could sustain some pricing pressure especially on deposits. On the other hand, increased government payments ahead of the fiscal year end could help offset the relative squeeze.
- Monetary Policy
Since April 2020, the MPC has retained the CBR at 7.00% in a bid to promote stability in the financial markets and mitigate the economic and financial disruptions brought about by the virus. Over the same period up until 2021, Inflation rates have remained stable and within the 2.5%-7.5% target range despite the recent increases in fuel prices.
Outlook:
|
Driver |
Outlook |
Effect on Interest Rates |
|
Fiscal Policies |
|
Negative |
|
Monetary Policy |
|
Neutral |
|
Liquidity |
|
Neutral |
From the above basis, 1 of the drivers is negative (fiscal policies), and 2 are neutral (Monetary policies and liquidity). We therefore believe that the interest rate environment remains uncertain and will likely adjust upwards.
Section V: Conclusion and our view going forward
Based on the factors discussed above and factoring in the continued efforts to contain the Corona Virus outbreak;
- We expect the Kenyan shilling to remain stable within a range of Kshs 107.5 and Kshs 110.1 against the USD in 2021 based on the purchasing power parity (PPP) and interest rate parity (IRP) approach respectively, with a bias of a 0.6% appreciation on account of:
- Gradual improvement in the export sector as Kenya’s trading partners continue to reopen their economies which will support the narrowing of the current account deficit, and,
- Stable forex reserves on the back of increasing diaspora remittance inflows, continued investor capital inflows and debt relief from other institutions. However, these will be weighed down by the elevated government borrowings, reduced domestic investment on the back of low real returns and the high import bills brought about by high fuel prices.
- We expect an upward readjustment on the yield curve with our sentiments being on the back of:
- Increased pressure on the government to meet its budget deficit by borrowing more domestically. The government is likely to accept expensive bids and in turn destabilize the interest rate environment, and,
- Muted lending to businesses and individuals on the back of elevated risk levels as the effects of the Coronavirus continue to be felt in the economy and ahead of the 2022 August election, despite lowering of the credit reserve ratio.
Disclaimer: The views expressed in this publication are those of the writers where particulars are not warranted. This publication, which is in compliance with Section 2 of the Capital Markets Authority Act Cap 485A, is meant for general information only and is not a warranty, representation, advice or solicitation of any nature. Readers are advised in all circumstances to seek the advice of a registered investment advisor.

- Talk to us
- Kenya
- P.O Box 20695 - 00200, Nairobi, Kenya
- Cell +254709101200
- Tel +254709101200
- WhatsApp +254741676635
- United States
- +254709101200
- DOWNLOAD OUR APP
-


- Kenya
- 8th Floor, Pinetree Plaza, Kaburu Drive, Ngong Road, Nairobi, Kenya
- USA
- Suite 1150, 1775 Eye Street NW, USA, Washington DC 20006, USA
- Investments
- High Yield
- Private Equity
- Real Estate
- Real Estate
- RiverRun Estates
- Cytonn Towers
- The Ridge
- Taraji Heights
- The Alma