Cytonn 2026 Markets Outlook
By research team, Jan 18, 2026
Executive Summary
Global Markets
According to the World Bank’s Global Economic Prospects Report, global economic growth is expected to remain subdued, slowing down to 2.6%, from the estimated 2.7% growth rate in 2025. The expected economic slowdown is driven by the weakening of trade growth driven by trade tensions and policy uncertainty from higher tariffs. Tariffs have significantly risen since January 2025 and are further expected to rise in 2026, which could further weaken exports and demand. The 2026 inflation rate is expected to ease to 2.6% as compared to the 3.2% estimate in 2025, mainly attributable to weaker labor markets, lower demand for tradable goods, and declining energy prices. However, despite the expected easing in inflation, global inflation remains at risk due to higher tariffs, which could increase the cost of imported goods and production inputs, and businesses are likely to pass these additional costs on to consumers, therefore fueling further inflationary pressures. Moreover, the growth in the Emerging Markets and Developing Economies (EMDEs) is expected to ease by 4.0% in 2026, 0.2% points decrease from the estimated growth of 4.2% in 2025;
Sub-Saharan Africa Regional Market
According to the World Bank’s Global Economic Prospects , growth in the Sub-Saharan Africa region is expected to rebound to 4.3% in 2026, from the estimated growth rate of 4.0% recorded in 2025 mainly attributable to the easing inflationary policies, ongoing reforms in some countries, improved fiscal support and domestic investment growth. However, the projections remain subject to key downward risks such as high debt levels in the region as borrowing persists due to the ever-present fiscal deficits in the region. Additionally, the increased debt servicing costs are expected to put more pressure on the region’s growth, despite most of the Sub-Saharan African currencies appreciating against the U.S. dollar since the United States’ announcement of tariffs;
Kenya Macro Economic
GDP Growth – Our outlook for 2026 is Positive on GDP Growth. We are projecting the economy to register a growth within the range of 5.2%-5.5% in 2026 supported by continued recovery of business activity, expected strong growth in the agricultural sector, and robust performance in the services sector driven by growth in information and technology as well as accommodation and food services as a result of increased tourism. The key downside to this growth shall be the persistent high debt burden, potential global economic headwinds, and domestic political uncertainties;
Inflation - Our outlook for 2026 is Neutral on Inflation. We expect the annual average inflation rate to remain within the government’s target of 2.5%-7.5% coming in at an average of 5.0% as compared to 4.1% in 2025. We expect the inflation rate to remain relatively stable in the short term, but face upward pressure in the medium to long term during 2026, driven by the lagged effects of monetary policy easing, high electricity and fuel prices and potential depreciation of the Kenyan Shilling;
Currency - Our outlook for 2026 is Neutral on Currency. We project the Kenya Shilling to trade against the US dollar within a range of Kshs 129.0 and Kshs 132.0 by the end of 2026, with a bias of 2.3% depreciation against the USD in 2026. We expect the shilling to remain largely stable, supported by record-high forex reserves of USD 12.5 billion (equivalent to 5.4 months of import cover, significantly above the policy target minimum of 4.0 months), effective CBK liquidity management through open market operations, improving diaspora remittances and enhanced export performance. The CBK's demonstrated ability to maintain exchange rate stability through strategic dollar purchases and liquidity management provides a strong foundation for currency stability in 2026;
Interest Rates Our outlook for 2026 is Positive on Interest Rates. We expect the Central Bank to maintain a balanced monetary policy stance in 2026, with potential for modest further easing in the first half of 2026 if inflation remains anchored and the shilling remains stable. Furthermore, we expect the yield curve to continue normalizing as the government adopts a more disciplined approach to domestic borrowing, increasingly rejecting highly-priced bids in Treasury bill and bond auctions, thereby forcing yields downward and reducing the government's domestic borrowing costs;
Government borrowing – Our outlook for 2026 is Negative on Government Borrowing. We expect the government to borrow aggressively from both the domestic and foreign markets to plug in the fiscal deficit, which is projected to come in at Kshs 923.2 bn, equivalent to 4.8% of the GDP. On revenue collection, we expect continued improvement in 2026 due to the raft of measures the administration has put in place to boost tax collection such implementation of the Finance Act 2025which is geared towards expanding the tax base and increasing revenues through sealing revenue leakages to meet the government’s budget for the fiscal year 2025/2026 of Kshs 4.2 tn, as well as reduce the budget deficit and borrowing;
Investor Sentiment – Our outlook for 2026 is Positive on Investor Sentiment. We expect positive investor sentiments to strengthen in 2026, driven by anchored inflation, improved currency stability, ongoing infrastructure developments, and the government's commitment to fiscal consolidation. The successful implementation of public-private partnerships and continued digital economy growth will bolster confidence. However, political developments, debt sustainability concerns, and global economic conditions remain a key risk to the investors’ confidence;
Security and political environment– Our outlook for 2026 is Negative on Security and Political Environment. We expect 2026 to be characterized by heightened political activity and tensions as the country enters the pre-election period ahead of the August 2027 general elections. Political positioning, coalition building, early campaign activities, and intensified competition among political actors are expected to create significant uncertainty and potential disruptions to the business environment;
Fixed Income
We expect interest rates to stabilize, particularly at the short end of the curve, as the yield curve continues to normalize, supported by easing inflationary pressures, improved liquidity conditions in the money markets, and the government’s rejection of highly priced bids. This is expected to enable cheaper borrowing for budgetary support, infrastructure financing, and the repayment of domestic maturities. We expect the yield curve to continue normalizing over the short to medium term as inflationary pressures moderate further and borrowing costs adjust downward. In this environment, investors should maintain a bias toward LONG-TERM FIXED INCOME INSTRUMENTS to lock in current relatively elevated interest rates.
Equities
We have a BULLISH outlook on the Kenyan Equities market in the short term but “NEUTRAL” in the medium to long term. We expect a continued improvement in the listed sector’s earnings growth in 2026, largely driven by the expected 5.2%-5.5% GDP growth, decreased yields in the fixed income markets and the improvement of the country’s business environment. The business environment showed signs of improvement in the last quarter of 2025, with the Purchasing Manager’s Index (PMI) averaging at 53.7 in Q4’2025, higher than the year’s average of 51.0. Additionally, the Kenyan currency appreciated against the major select currencies, gaining 0.2% against the USD dollar in 2025 indicating a stability. Strong foreign investor inflows expected in the early weeks of the year may, further, support and accelerate the growth of the equities market in the short term
Real Estate
Residential sector: Our outlook for the residential sector in 2026 is NEUTRAL, reflecting a balance between supply and demand dynamics. On the supply side, ongoing and pipeline developments in 2026 are expected to be driven by the government’s continued rollout of the Affordable Housing Programme, targeting the delivery of 200,000 housing units annually, alongside sustained private sector participation to help bridge the housing deficit and continued infrastructure development across key urban and peri-urban areas. On the demand side, the outlook for 2026 is neutral, as high taxes, elevated construction costs and cautious lending standards are expected to constrain buyers’ purchasing power and limit uptake, even as inflation and the Central Bank Rate have eased modestly and the ongoing urbanisation. In terms of investment opportunities, detached units remain attractive in Kitengela, Ngong, and South B & C, while apartments continue to offer relatively higher returns in Kahawa West, Westlands, and Dagoretti, supported by resilient rental demand and favourable occupancy levels;
Commercial Office Sector: Our overall outlook for the Nairobi Metropolitan Area commercial office sector is POSITIVE. We expect the sector to remain stable with a slight improvement by 0.2% in rental yields recorded in FY’2026, attributable to an expected increase in overall rental rates by 0.5% in FY’2026. The improved performance may be supported by; i) the increasing presence of multinational companies in Kenya is likely to drive up occupancy levels, ii) co-working spaces are gaining in popularity in the region iii) the gradual return to “working from office” after the Covid-19 pandemic, iv) more start-ups are expected to drive demand for commercial spaces, and v) a considerable uptake of prevailing commercial office spaces. However, the sector continues to face challenges due to a significant oversupply of office space, currently standing at 5.7 mn SQFT as at FY’2025. Despite these challenges, investment opportunity lies in areas such as Westlands, Gigiri, and Kilimani, which offer rental yields of 9.3%, 8.5% and 8.2%, compared to the market average of 7.8%;
Retail Sector: We maintain a NEUTRAL outlook on the retail sector’s performance for 2026, influenced by several factors; i) continued expansion by local and international retailers, driven by evolving consumer preferences and market trends, ii) infrastructure improvements, including ongoing road and railway projects, are set to increase accessibility to key retail zones, unlocking further investment opportunities, and iii) favorable demographic trends, such as a growing urban population, will sustain demand for retail goods and services. However, growth could face challenges from: i) oversupply issues, with around 3.6 mn SQFT of retail space available in Nairobi and an additional 1.9 mn SQFT countrywide, leading to low occupancy rates and rental yields, ii) e-commerce adoption, increasingly shifting retail demand online, pushing brick-and-mortar outlets to adapt, and iii) limited financing options for retail developments, along with high costs, are likely to hinder investment, especially for small and medium-sized enterprises (SMEs) that need to adopt technology to stay competitive;
Hospitality Sector: We maintain a POSITIVE outlook for the hospitality sector, supported by several key drivers: i) aggressive marketing campaigns promoting Kenya’s tourism, expected to boost tourist arrivals and improve occupancy rates at hospitality venues, ii) continued international recognition of Kenya’s tourism industry, enhancing its status as a leading tourist destination and drawing more global visitors, iii) strategic partnerships within the tourism sector, fostering innovation and collaboration to capitalize on new opportunities, iv) events and initiatives aimed at increasing tourism activity and improving guest experiences. However, while the sector demonstrated resilience in its overall performance in 2025, the outlook remains cautiously optimistic due to i) Kenya continues to face significant competition from neighboring markets, such as Rwanda, which employs aggressive promotional strategies, alongside Zanzibar, Tanzania, and South Africa, these regions actively position themselves as attractive alternatives, challenging Kenya's market share in the region, ii) difficulty in accessing finance as lenders demand more collateral to cushion themselves owing to elevated credit risk, and iii) occasional release of cautionary statements by governments like Australia to their citizens advising them against travelling to Kenya due to threats like terrorism and elevated crime rates;
Land Sector: We maintain a POSITIVE outlook for the land sector in the Nairobi Metropolitan Area (NMA), We expect the performance to be further boosted by factors driving demand for development land such as; i) Increased infrastructure developments which has improved and opened up areas for investment, ii) Roll out of numerous affordable housing projects by both the public and private sectors, iii) Affordability of land in the satellite towns, iv) Limited supply of land especially in urban areas which has contributed to exorbitant prices, and, v) Positive demographics driving demand for land upwards, facilitated by high population growth and urbanization rates of 2.0% p.a and 3.7% p.a, respectively against the global averages 1.0% p.a and 1.7% p.a, respectively;
Infrastructure Sector: We maintain a POSITIVE outlook in the infrastructural sector. We anticipate the government will continue with its aggressive efforts to; i) construct and rehabilitate roads, bridges, railways, airports, and affordable housing units, among others, ii) increase its diplomacy and partnerships in development among neighbouring nations, and, iii) step up on the competition for attracting regional and international investors against other countries in Eastern Africa like Tanzania through railway connections and ports infrastructure. However, the sector may face challenges such as fiscal constraints, execution delays, land disputes, cost overruns, and climate risks. Although the government acknowledges the importance of Public-Private Partnerships (PPPs) in tackling financing challenges, we believe that prioritizing PPPs is fundamental in addressing funding shortfalls. By leveraging the resources and expertise of the private sector, PPPs can support sustainable infrastructure development and stimulate economic growth;
Industrial Sector: We maintain a NEUTRAL outlook on the industrial sector’s performance. We expect slight growth in the sector as investors continue to respond to the growing demand for industrial spaces both in Nairobi and around the country. Data centres, cold rooms, growth in e-commerce, and rising demand for fast-moving consumer goods will continue to foster growth in the industrial sector. In 2026, we expect a slight increase in development activities in the industrial sector through government support in line with its Bottom Up Economic Transformation Agenda (BETA) which aims to tap into the manufacturing sector to create wealth, employment and reduce poverty levels among Kenyan citizens. However, optimal performance in this sector may be weighed down by factors like high development costs for industrial facilities, low technological adoption and inadequate infrastructure to support operation of these facilities. Going forward, we expect the sector to continue on an upward trajectory driven by: i) the rising demand for data centers in the country, ii) an increasing demand for cold rooms, especially in the Nairobi Metropolitan Area, iii) demand for quality warehouses due to the growing e-commerce business in the country, iv) support from the government, as evidenced by the establishment of Special Economic Zones (SEZ) and Export Processing Zones (EPZ), v) increased development activities by industry players such as ALP Africa Logistics & Devki steel mills, vi) Kenya’s continued recognition as a regional hub, hence attracting international investors, and, vii) efforts by the government to support agricultural and horticultural products in the international market Viii) continued improvement in infrastructure through projects such as the Standard Gauge Railway (SGR), the Eastern and Northern Bypasses connecting Jomo Kenyatta International Airport (JKIA) and other regions in the Nairobi Metropolitan Area, among other key infrastructural improvements which we expect will increase the output of Special Economic Zones and Inland Container Depots (ICDs);
Real Estate Investment Trusts : We maintain NEUTRAL outlook for the REITs sector and we expect Kenya’s Real Estate sector to remain on a growth trend, supported by: i) demand for housing sustained by positive demographics, such as urbanization and population growth rates of 3.7% p.a and 2.0% p.a, respectively, against the global average of 1.7% p.a and 1.0% p.a, respectively, as at 2024, ii) activities by the government under the Affordable Housing Program (AHP) iii) heightened activities by private players in the residential sector. However, challenges such as rising construction costs, strain on infrastructure development (including drainage systems), high capital requirements for REITs, and existing oversupply in select Real Estate sectors will continue to hinder the sector’s optimal performance by limiting developments and investments;
Investment Updates:
- Weekly Rates: Cytonn Money Market Fund closed the week at a yield of 11.6% p.a. To invest, dial *809# or download the Cytonn App from Google Play store here or from the Appstore here;
- We continue to offer Wealth Management Training every Tuesday, from 7:00 pm to 8:00 pm. The training aims to grow financial literacy among the general public. To register for any of our Wealth Management Trainings, click here;
- If interested in our Private Wealth Management Training for your employees or investment group, please get in touch with us through wmt@cytonn.com;
- Cytonn Insurance Agency acts as an intermediary for those looking to secure their assets and loved ones’ future through insurance namely; Motor, Medical, Life, Property, WIBA, Credit and Fire and Burglary insurance covers. For assistance, get in touch with us through insuranceagency@cytonn.com;
- Cytonn Asset Managers Limited (CAML) continues to offer pension products to meet the needs of both individual clients who want to save for their retirement during their working years and Institutional clients that want to contribute on behalf of their employees to help them build their retirement pot. To more about our pension schemes, kindly get in touch with us through pensions@cytonn.com;
Hospitality Updates:
- We currently have promotions for Staycations. Visit cysuites.com/offers for details or email us at sales@cysuites.com;
- Global Economic Growth:
According to the World Bank’s Global Economic Prospects Report, global economic growth is expected to remain subdued, slowing down to 2.6%, from the estimated 2.7% growth rate in 2025. The expected economic slowdown is driven by the weakening of trade growth driven by trade tensions and policy uncertainty from higher tariffs. Tariffs have significantly risen since January 2025 and are further expected to rise in 2026, which could further weaken exports and demand. The 2026 inflation rate is expected to ease to 2.6% as compared to the 3.2% estimate in 2025, mainly attributable to weaker labor markets, lower demand for tradable goods, and declining energy prices However, despite the expected easing in inflation, global inflation remains at risk due to higher tariffs, which could increase the cost of imported goods and production inputs, and businesses are likely to pass these additional costs on to consumers, therefore fueling further inflationary pressures. Moreover, the growth in the Emerging Markets and Developing Economies (EMDEs) is expected to ease by 4.0% in 2026, 0.2% points decrease from the estimated growth of 4.2% in 2025;
Growth in 2026 shall be shaped by the following four key themes:
- Global Trade
The World Bank projects the global trade growth to slow down to 2.2% in 2026 from the 3.4% growth rate in 2025 as the effects of higher tariffs are fully realized over the course of the year. In March 2025, the U.S. implemented country‑ and sector‑specific tariffs, which led major economies such as Canada, China, and the European Union to respond with retaliatory measures. This triggered a global rise in tariffs and heightened uncertainty around trade policies. The full impact of these higher tariffs will emerge gradually, since they initially excluded goods already in transit to the United States. Additionally, the tariff levels introduced in late 2025 are expected to remain in place throughout the year. However, nations with more diversified export markets are projected to see relatively stronger trade growth. In our view, global trade growth will remain constrained in the near term as the temporary boost from stockpiling and front‑loading fades, while the full impact of higher tariffs and weaker demand in major economies increasingly weighs on global goods and services trade.
- Easing Inflation and Monetary Policies
Inflation is expected to ease in 2026 to 2.6% from the estimated 3.2% in 2025, with global inflation moving closer to the targets set by central banks in most economies. In line with inflation-targeting strategies, central banks are expected to continue easing monetary policies in 2026, reducing interest rates to stimulate economic activity as inflationary pressures subside. Since 2024, major central banks in advanced economies have cut their policy rates, moving their policy stance towards neutral. Notably, as of December 2025, advanced economies, including the Euro Area, the UK, and the US cumulatively cut their rates by 1.0%, 1.0%, and 0.75%, respectively, compared to the same period in 2024. The change in global monetary conditions is easing the pressure on emerging market economies, with their currencies strengthening against the US dollar and financial conditions improving. This will help reduce imported inflation pressures, allowing these countries to pursue more easily their own disinflation path.
In their latest meeting on 10th December 2025, the USA Federal Reserve cut their policy rates by 25.0 bps to a range of 3.50%-3.75% from a range of 3.75%-4.00%, marking the third consecutive cut. The Fed’s decision to lower rates was driven by the need to support stable economic activity amid modest wage pressures, rising costs, and growing financial strains on households, while anticipating tariff‑related cost increases in 2026. As of December 2025, the y/y inflation rate stood at 2.7%, unchanged from November 2025. The Fed noted that inflation remains somewhat elevated above the target of 2.0%, and stable economic activity. Additionally, in their most recent sittings, other major economies such as the UK also cut their monetary policy rates by 0.25 bps to 3.75% from 4.00%. On the other hand, in their most recent sittings, Canada, China, Malaysia, Australia and the Euro Area also kept their monetary policy rates unchanged. While lowering rates could stimulate domestic growth and ease financial conditions, they must balance this with the risk of inflationary pressures, currency devaluation, and capital outflows. In our view, upcoming rate cuts are expected to be measured and cautious, given that policy rates have already been declining since 2024. Central banks are therefore likely to ease gradually to support economic activity while avoiding a resurgence of inflationary pressures.
The table below highlights the policy stance adopted by the Central Banks of major economies
|
Cytonn Report: Monetary Policy Stance Adopted by Central Banks in Select Economies |
|||||||
|
No |
Country |
Central Bank |
Last meeting date |
Previous Rate |
Current Rate |
Margin |
|
|
1 |
Canada |
Bank of Canada |
10-Dec-25 |
2.25% |
2.25% |
Unchanged |
|
|
2 |
USA |
Federal Reserve |
10-Dec-25 |
3.75%-4.00% |
3.50%-3.75% |
(0.25%) |
|
|
3 |
Euro Area |
European Central Bank |
18-Dec-25 |
2.15% |
2.15% |
Unchanged |
|
|
4 |
China |
Bank of China |
22-Dec-25 |
3.00% |
3.00% |
Unchanged |
|
|
5 |
England |
Bank of England |
17-Dec-25 |
4.00% |
3.75% |
(0.25%) |
|
|
6 |
Malaysia |
Bank Negara Malaysia |
06-Nov-25 |
2.75% |
2.75% |
Unchanged |
|
|
7 |
Australia |
Reserve Bank of Australia |
09-Dec-25 |
3.60% |
3.60% |
Unchanged |
|
Data Source: Cytonn Research
- Easing Commodity Prices
In 2025, most of the commodity prices were on an upward trajectory. However, the energy prices pulled down the aggregate index. The commodity prices are projected to ease in 2026. According to the World Bank’s Commodity Markets Outlookreport, commodity prices are expected to decrease by 7.0% percent in 2026, after softening 6.5% in 2025. This would lead aggregate commodity prices to their lowest levels since 2020. The projected declines are led by an oversupply in the global oil market, a subdued economic growth and a stable outlook for agricultural and metal commodities. The table below shows select commodity price indices:
|
Cytonn Report: Average Commodity Prices (USD) |
||||||
|
Commodity Index |
2024 |
2025 |
Average y/y change |
Jun-25 |
Dec-25 |
Half-year Change |
|
Precious metals |
180.2 |
258.6 |
43.5% |
243.0 |
317.9 |
30.8% |
|
Agriculture |
115.0 |
115.4 |
0.3% |
116.6 |
111.4 |
(4.5%) |
|
Metals & Minerals |
106.7 |
112.2 |
5.2% |
106.5 |
121.8 |
14.4% |
|
Non-energy commodities |
112.5 |
115.2 |
2.4% |
114.0 |
115.6 |
1.4% |
|
Energy prices |
101.5 |
90.0 |
(11.3%) |
88.0 |
83.7 |
(4.9%) |
|
Fertilizers |
117.6 |
138.7 |
17.9% |
135.1 |
137.6 |
1.9% |
|
Aggregate index |
105.1 |
98.3 |
(6.5%) |
96.6 |
94.3 |
(2.4%) |
Data Source: World Bank
Oil prices have been under downward pressure declining by 11.3% in 2025, higher than the 5.1% decrease which was recorded in 2024, due to weak demand growth in China, the continued rapid adoption of electric and hybrid vehicles, and a further increase in global oil supply. As a result, excess supply in the global oil market expanded significantly in 2025. Oil prices are expected to decline further in 2026 but remain above the pre-pandemic levels as rising non-OPEC+ production, particularly from U.S. shale, alongside the potential for higher-than-expected OPEC+ output, is likely to result in a significantly oversupplied global oil market. In 2026, fertilizer prices are projected to decline by 2.7%, from the 17.9% increase recorded in 2025. This decline is attributed to elevated input costs, ongoing export restrictions, and sanctions, including China’s limits on nitrogen and phosphate fertilizer exports and continued EU sanctions and tariffs affecting major suppliers such as Belarus and Russia. Similarly, food prices, which represent the largest component of the World Bank Agriculture Commodity Index, are expected to fall by 2.3% in 2026. This decline is driven by improved supply conditions for key crops, including expanded soybean acreage in Brazil and better coffee and cocoa production, while U.S. soybean exports are redirected at lower costs. These trends are likely to reduce agricultural input costs, easing inflationary pressures in food-dependent economies. However, risks such as unpredictable weather patterns or trade restrictions could still impact price stability and agricultural output.
- Public Debt
High debt levels especially in Emerging Markets and developing economies (EMDEs) are expected to persist in 2026 mainly on the back of declining aid from advanced economies, limited progress on debt restructuring and surging debt service costs due to declining global trade and currency depreciation in most economies, coupled with tighter financial conditions undermining economic growth. According to the Global Debt Monitor by (IMF), the global debt (public and non-financial private debt stocks) came in at 235.5% of the GDP, (USD 251.0 tn) in 2024, translating to 0.1% points decline from 235.6% of the GDP (USD 250.0 tn) recorded in 2023. Conversely, public debt stock as a percentage of GDP increased by 1.0% points to 92.8% in 2024 from 91.8% in 2023. However, given the perceived interest cuts in 2025, especially in developed economies such as the US, global debt levels may experience mixed impacts. While reduced borrowing costs could ease the debt servicing burden for some nations, the elevated refinancing costs for long-term debt and the persistent structural challenges, including fiscal deficits and weak revenue collection, are likely to counteract these benefits. Additionally, geopolitical risks and inflationary pressures, although moderating, remain key concerns that could strain fiscal positions, particularly in EMDEs. In our view, global debt is projected to remain elevated, with governments and corporations facing continued pressure to manage their liabilities amidst a challenging economic and financial landscape.
Below is a summary of the regional growth rates by country as per the World Bank:
</thead.
|
Cytonn Report: World GDP Growth Rates |
||||||
|
Region |
2022 |
2023 |
2024 |
2025e |
2026f |
|
|
1. |
India |
7.6% |
9.2% |
6.5% |
7.2% |
6.5% |
|
2. |
Kenya |
4.9% |
5.7% |
4.7% |
4.9% |
4.9% |
|
3. |
China |
3.1% |
5.4% |
5.0% |
4.9% |
4.4% |
|
4. |
Sub-Saharan Africa |
3.9% |
3.0% |
3.7% |
4.0% |
4.3% |
|
5. |
Middle-East, North Africa |
5.4% |
2.1% |
2.6% |
3.1% |
3.6% |
|
6. |
United States |
2.5% |
2.9% |
2.8% |
2.1% |
2.2% |
|
7. |
Brazil |
3.0% |
3.2% |
3.4% |
2.3% |
2.0% |
|
8. |
South Africa |
2.1% |
0.7% |
0.6% |
1.3% |
1.4% |
|
9. |
Euro Area |
3.5% |
0.5% |
0.9% |
1.4% |
0.9% |
|
10. |
Japan |
0.9% |
0.7% |
(0.2%) |
1.3% |
0.8% |
|
|
Global Growth Rate |
3.3% |
2.8% |
2.8% |
2.7% |
2.6% |
Data Source: World Bank
According to the World Bank’s Global Economic Prospects , growth in the Sub-Saharan Africa region is expected to rebound to 4.3% in 2026, from the estimated growth rate of 4.0% recorded in 2025 mainly attributable to the easing inflationary policies, ongoing reforms in some countries, improved fiscal support and domestic investment growth.
However, the projections remain subject to key downward risks such as:
- If trade barriers and related uncertainty increase further, adverse shifts in trade policy may slow global growth, reduce demand for commodities like minerals and metals, and particularly affect countries heavily reliant on exports to the U.S., such as Côte d’Ivoire, Kenya, Lesotho, Madagascar, Mauritius, and South Africa
- Persistent global inflationary pressures, which may lead to the deterioration of financial conditions in the region and high cost of living due to the high prices necessitating aggressive policy rate hikes in the region,
- The high debt levels in the region as borrowing persists in the region due to the ever-present fiscal deficits and high debt-servicing costs in the region, especially due to reduced donor support, high long-term interest rates and limited fiscal headroom, and,
- Further rise in global or regional instability, such as the possible escalation of the conflict in Sudan and DRC, which could heighten humanitarian emergencies and growing food insecurity, potentially affecting other nations.
In Nigeria, the region's largest economy, growth is projected to accelerate to 4.4% in 2026 from an estimated 4.2% in 2025. This improvement is attributed to increased non-oil sector activity, particularly in agriculture and services, supported by reforms to address structural economic challenges. Additionally, growth in South Africa is expected to increase slightly to 1.4% in 2026, from the estimated growth of 1.3% in 2025. The growth in South Africa is attributable to growth in private consumption and investment driven by ongoing reforms in the business environment and the public sector. However, growth in the region is expected to be hampered by the high debt levels, rising trade barriers and uncertainty, slow reform implementation, persistent or worsening conflicts, intensified weather shocks, declining development assistance, weaker global growth, falling commodity prices, as well as the increased cases of corruption in the region as indicated by the Corruption Perceptions Index. Growth in the Eastern African region is expected to remain subdued due to the witnessed political clashes in Sudan, South Sudan and the Democratic Republic of Congo, coupled with persistent unfavourable weather conditions which continue to stifle agricultural production.
The table below highlights the real GDP forecasts of select Sub - Saharan Africa countries;
|
Cytonn Report: Real GDP Forecasts of Select Sub-Saharan Africa countries |
||
|
Country |
2025e |
2026f |
|
Rwanda |
7.0% |
7.2% |
|
Ethiopia |
7.2% |
7.1% |
|
Uganda |
6.3% |
6.4% |
|
Tanzania |
6.0% |
6.2% |
|
Kenya |
4.9% |
4.9% |
|
Ghana |
4.3% |
4.6% |
|
Nigeria |
4.2% |
4.4% |
|
Senegal |
6.4% |
4.1% |
|
Mauritius |
3.0% |
3.4% |
|
Angola |
2.3% |
2.6% |
|
South Africa |
1.3% |
1.4% |
|
Sub-Saharan Africa Growth Rate |
4.0% |
4.3% |
Data Source: World Bank
- Economic Growth:
According to the Kenya National Bureau of Statistics (KNBS) Q3’2025 Gross Domestic Product Report, the Kenyan economy recorded a 4.9% growth in Q3’2025, higher than the 4.2% growth recorded in Q3’2024. The improved performance was largely driven by accelerated growth in key sectors, with Mining and Quarrying rebounding to 16.6% in Q3’2025 from a 12.2% contraction in Q3’2024, Construction expanding by 6.7% in Q3’2025 from a 2.6% contraction in Q3’2024, and Electricity and Water Supply growing by 3.6% in Q3’2025 from 0.9% in Q3’2024. Consequently, the economy recorded an average growth of 4.9% in the first three quarters of 2025, an improvement from the 4.5% average growth recorded in a similar period in 2024. The average GDP growth rate for 2024 is expected to come in at an average of 5.0%, an improvement from the 4.7% expansion witnessed in 2024.
In 2026, we expect the economy to continue its recovery trajectory with the projected GDP growth to come in at a range of 5.2% - 5.5%.
The key factors that shall support growth include:
- Continued growth in Services and Agricultural sectors: The steady performance in the agricultural sector witnessed in 2025 is expected to continue into 2026 following continued support by the government through fertilizer subsidy program. In the FY’2025/2026 budget, the government allocated Kshs 8.0 bn for the fertilizer subsidy program aimed at lowering the cost of farm inputs and enhancing food supply in the country, despite a reduction from Kshs 10.0 bn in FY’2024/2025. Additionally, the favorable weather conditions and sufficient rainfall experienced in the country is set to continue supporting the sector. The service sector is expected to register robust performance driven by growth in information and technology as internet connectivity increases, as well as accommodation and food services as a result of increased tourism,
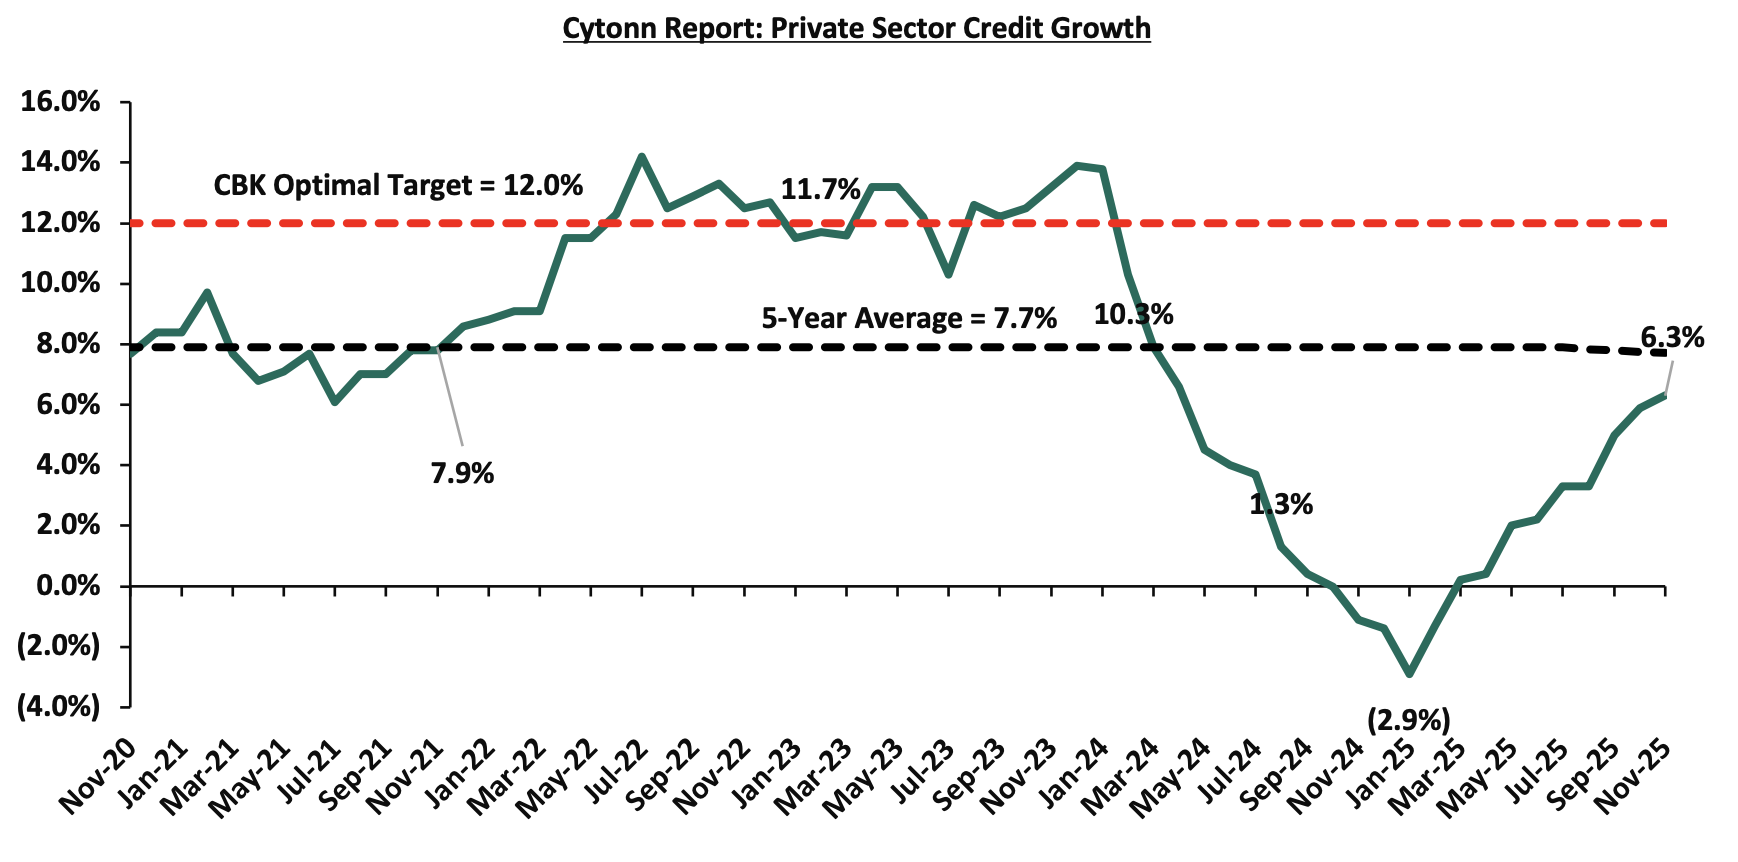
- Eased monetary policy – In 2025, the Monetary Policy Committee (MPC) lowered the Central Bank Rate (CBR) by a total of 175.0 bps from 10.75% in February to 9.00% in December in a bid to support the economy, noting that its previous measures had successfully reduced overall inflation to below the mid-point of the target range of 2.5% - 7.5%, stabilized the exchange rate, and anchored inflationary pressures. We expect the MPC to continue lowering the rates gradually in the short to medium term therefore lowering borrowing costs, leading to increased spending and an uptick in the business environment. Further, this is expected to support private sector credit growth, which, despite recent improvements, has remained in single digits, at 6.3% in November 2025, after recording negative growth rates from November 2024 to February 2025. The low CBR is also expected to support overall economic growth, and,
- Gradual increase in access to credit: During the first 11 months of 2025, private sector credit growth rate averaged 2.2%, significantly lower than the 4.7% average growth rate recorded over the same period in 2024. This decline occurred despite the CBK's aggressive monetary easing, with the CBR cut to 9.0% from 13.0% through nine consecutive reductions since August 2024. The weak credit growth reflects the lagged transmission of monetary policy to actual lending rates, with commercial banks slow to reduce their lending rates in line with CBR cuts, as well as lingering caution from the higher interest rate environment that prevailed through much of 2024. Despite this decline, we anticipate an expansion of credit to the private sector driven by, the expansionary monetary policy stance by the Central Bank of Kenya, policy initiatives such as the MSMEs Credit Guarantee Scheme and the ongoing economic revival. Additionally, we expect the renewed focus on Public-private Partnerships (PPP) to finance commercially viable projects to spur growth in the private sector. Furthermore, with the expected reduction in credit risk and a decline in yields in the short-term government papers, we expect the banking sector to increase its lending to the private sector in search of better yields following the adoption of risk-based lending. The chart below shows 5-year private sector credit growth:
Source: CBK
However, key risks threaten economic growth including:
- High Risk of Debt Distress: According to International Monetary Fund and the World Bank, Kenya is currently at risk of high debt distress with the country’s debt to GDP ratio coming in at 67.7% as at June 2025, 17.7% points above the recommended IMF threshold of 50.0% for developing countries. Additionally, Kenya’s debt stood at Kshs 12.3 tn as of November 2025, 12.8% higher than the Kshs 10.9 tn debt recorded over a similar period in 2024. Consequently, the government will face significant pressure to service the existing debt with the debt service to revenue ratio standing at 75.3% as of December 2025, 45.3% points above the 30.0% threshold recommended by the IMF. Economic growth potential diminishes when debt levels are high because a significant part of the revenue is allocated towards servicing the existing debt, leaving less for developmental spending, and,
- Rising Inflationary Pressures – The country’s inflation rate averaged 4.1% in 2025, remaining within and falling below the mid-point of the CBK’s target range of 2.5%-7.5%. Despite the improvement recorded in 2025, we expect the inflation rate to remain relatively stable in the short term, but face upward pressure in the medium to long term during 2026, weighing down the business environment.
- Currency:
The Kenya Shilling appreciated by 0.2% against the US Dollar to close at Kshs 129.0 in 2025, compared to Kshs 129.3 at the end of 2024 a significant moderation from the 17.4% appreciation recorded in 2024. This stability has been achieved despite significant global shocks including US trade tariffs and Middle East conflicts, underscoring the strength of Kenya's foreign exchange management framework.
Going forward, we expect the shilling to trade against the US dollar within a range of Kshs 129.0 and Kshs 132.0 by the end of 2026.
The Kenyan shilling will be supported by:
- Improving diaspora remittances standing at a cumulative USD 5,036.7 mn in the 12 months to December 2025, 1.9% higher than the USD 4,945.2 mn recorded over the same period in 2024. In the December 2025 diaspora remittances figures, North America remained the largest source of remittances to Kenya accounting for 53.3% in the period. In 2026, diaspora remittances are set to improve further, mainly driven by the recovery of the global economy, increasing Kenyan population in the diaspora, and advancing technology that has facilitated easier transfer of money,
- Improving forex reserves currently at USD 12.5 bn (equivalent to 5.4-months of import cover), which is above the statutory requirement of maintaining at least 4.0-months of import cover and the EAC region’s convergence criteria of 4.5-months of import cover. Forex reserves improved by a significant 32.3% to USD 12.5 bn (equivalent to 5.4 months of import cover) in January 2026, from USD 9.2 bn (equivalent to 4.0 months of import cover) in a similar period in 2024. The rise is largely attributed to the Eurobond buyback program of the USD 900.0 mn tranche maturing in 2027 in February 2025, which alleviated the country’s credit risk and increased dollar supply in the market. This was further supported by reduced debt service obligations, aided by the stability of the Kenyan shilling, and,
- The Central Bank has demonstrated exceptional capability in managing liquidity conditions to support exchange rate stability. In 2025, the CBK mopped up a cumulative Kshs 9.2 tn in liquidity from the banking sector through repurchase agreements (repos) and term auction deposits (TADs). This strategic liquidity management came at a time when the CBK was actively purchasing dollars from the market to build reserves, with the liquidity mop-up preventing excess shilling supply that could have weakened the currency. The CBK's sophisticated use of open market operations, including repos, reverse repos, and TADs, demonstrates its ability to maintain optimal liquidity conditions that support currency stability.
The Kenyan shilling will however face the following challenges:
- An ever-present current account deficit which came in at 2.2% of GDP in the twelve months to October 2025, a deterioration from the 1.5% deficit recorded in a similar period in 2024. The persistent current account deficit reflects the country’s reliance on imports which has resulted in increased demand for foreign currency which continues to put more strain on the local currency,
- The low interest rates, with the Monetary Policy Committee reducing the CBR to 9.00% in its last sitting, extending its expansionary monetary policy stance, noting that its previous measures had successfully reduced overall inflation to below the mid-point of the target range of 2.5% - 7.5% and stabilized the exchange rate. The lower rates pose a challenge to the Kenyan Shilling, increasing pressure on the currency’s stability due to reduced attractiveness for foreign investors, especially in the face of sustained external borrowing needs and global market fluctuations,
- Elevated risk of increase in global crude oil prices as a result of supply chain constraints following the rising geopolitical tension in South America. Consequently, the possible rise in global oil prices is set to increase demand for the US Dollar by oil and energy importers, as well as manufacturers against a low supply of US Dollar currency, and,
- The high debt servicing costs which continue to put pressure on forex reserves. Notably, the debt service to revenue ratio stood at 75.3% as of December 2025, 60.3% points above the 30.0% threshold recommended by the IMF, and 59.7% of Kenya’s external debt is US Dollar-denominated as of June 2025.
- Ever since the Covid-19 pandemic, Kenya had benefited from near-continuous financing from the IMF and World Bank, supporting fiscal stability and reforms. However, in 2025, both lenders froze funding, USD 750.0 mn in World Bank DPO financing was suspended, and the IMF terminated its multi-year programme, due to Kenya’s failure to meet key prior actions, including amendments to the Competition Act, Treasury Single Account, e-procurement, and other policy reforms. Despite this, the outlook for 2026 is more positive, as Kenya is actively engaging with both institutions to unlock funding, progress has been made on reforms, and record-high forex reserves of USD 12.5 bn provide a strong buffer against liquidity pressures, improving the likelihood of IMF and World Bank support compared to 2025.
We expect the shilling to remain within a range of Kshs 129.0 and Kshs 132.0 against the USD by the end of 2026 with a bias towards a 2.3% depreciation by the end of the year.
- Inflation:
In 2025, the average inflation rate in the country was 4.1%, marking 0.4% points decrease from the average inflation rate of 4.5% witnessed in 2024. Notably, the y/y inflation rate remained unchanged in December 2025 at the 4.5% recorded in November 2025. Key to note, the overall inflation rates throughout 2025, remained within the Central Bank’s target range of 2.5% and 7.5%, hitting its lowest in January 2025 at 3.3%. Despite the improvement recorded in 2025, we expect the inflation rate to remain relatively stable in the short term, but face upward pressure in the medium to long term during 2026, given that the current fiscal measures do not address the cost-driven inflation, in addition to a ripple effect of the current expansionary monetary stance.
We expect inflation to average 5.0% in 2026, within the government target range of 2.5% - 7.5%. Key risks driving inflationary pressure are the high electricity prices, fuel costs, and exchange rate fluctuations on the Kenyan shilling.
- Interest Rates:
The Central Bank of Kenya (CBK) is expected to continue with the expansionary monetary policy stance in the short-to-medium term attributable to a stronger and stable currency and the eased inflation currently below the mid-point of the CBK’s preferred target of a range of 2.5% - 7.5%. The 9.00% Central Bank Rate (CBR) set in December 2025 marks the lowest level since January 2023. In the short term, we anticipate the Central Bank of Kenya (CBK) will adopt a more cautious approach to rate adjustments as it evaluates the performance of the local currency and inflation trends. However, in the medium term, there is potential for further reductions in the CBR to stimulate private sector credit growth, which, despite recent improvements, has remained in single digits, at 6.3% in November 2025, after recording negative growth rates from November 2024 to February 2025.
Despite the projected marginal increase in borrowing by 1.6% to Kshs 901.0 bn in FY’2025/2026 from Kshs 887.2 bn in FY’2024/25, Kenya still has an ever-present fiscal deficit, projected at 4.8% of GDP in FY’2025/26. As such, we expect the government to continue borrowing aggressively from both the domestic and foreign markets, given that the government is already ahead of its total net domestic borrowing target of Kshs 634.8 bn in FY’2025/26. The escalating debt service due to further borrowing will persistently burden the government, compelling it to borrow more to cover the maturing debts. However, the interest rate environment is expected to stabilize in the medium term as the government receives a boost from concessional loans from the IMF and the World Bank, improving the country’s credit outlook.
The table below summarizes the various macroeconomic factors and their possible impact on the business environment in 2026. With two indicators assessed as negative, two as neutral, and three as positive, the general outlook for the macroeconomic environment in 2026 is NEUTRAL.
|
|
Cytonn Report: Macro-Economic & Business Environment Outlook |
|
|
|
Macro-Economic Indicators |
2026 Outlook |
2026 Outlook |
Previous Outlook (2025)
|
|
Government Borrowing |
· On the domestic front, we expect the government to borrow aggressively from the domestic market as it aims to plug in the fiscal deficit, which is projected to come in at Kshs 923.3 bn in the FY’2025/26 budget, 4.8% of the GDP. The government intends to plug this fiscal deficit through Kshs 287.7 bn in external financing and Kshs 635.5 bn in domestic borrowing. Borrowing domestically is less costly for the government than acquiring debt denominated in foreign currencies, which not only carry higher interest rates but also come with the added risk of currency fluctuations. · In our view, the level of foreign borrowing is likely to remain elevated in 2026 due to several key factors: (i) the continued need to service and refinance external obligations, including upcoming maturities such as the USD 1.0 bn Eurobond due in February 2028, even after partial buybacks of 2027 and 2028 bonds in 2025 that helped ease near‑term refinancing pressures and extend maturities; (ii) ongoing negotiations and prospects for additional financing from the International Monetary Fund (IMF), as Kenya has requested a new IMF support programme following the expiration of its previous ECF/EFF arrangements, which could provide much‑needed concessional funds to support macroeconomic stability and external obligations; and (iii) planned disbursements and new commitments from multilateral lenders, including the World Bank Development Policy Operations and commercial financing arrangements, as well as innovative instruments such as sustainability‑linked bonds and debt‑for‑food‑security swaps that are expected to be executed by early 2026 to diversify external funding sources and support development priorities. · On revenue collection, we expect continued improvement in 2026 due to the raft of measures the new administration has put in place to boost tax collection such implementation of the Finance Act 2025 which is geared towards expanding the tax base and increasing revenues through sealing revenue leakages to meet the government’s budget for the fiscal year 2025/2026 of Kshs 4.2 tn, as well as reduce the budget deficit and borrowing. · In 2026, the government’s revenue outlook is expected to remain constrained, reflecting limited scope for further tax hikes amid political pressures ahead of the August 2027 General Election and the lingering impact of youth-led protests. The National Treasury has revised down its tax revenue target, acknowledging subdued tax performance driven by compliance gaps, administrative challenges, and revenue-reducing measures under the Finance Act, 2025. Consequently, revenue mobilisation efforts are likely to lean more heavily on non-tax measures, enhanced tax administration, and asset disposals, even as easing the tax burden to placate the electorate risks widening the fiscal deficit and weighing on overall revenue growth. |
Negative |
Negative |
|
Exchange Rate |
• We expect the Kenyan shilling to trade within a range of KSh 129.0 to KSh 132.0 against the USD by the end of 2026, reflecting a moderate depreciation bias amid ongoing external and domestic pressures. The currency is likely to remain under pressure due to several factors. (i), a persistent current account deficit continues to generate strong demand for foreign currency, placing sustained strain on the shilling. (ii) external debt obligations, including upcoming Eurobond maturities in 2027 and 2028, even after the partial buybacks conducted in 2025, continue to weigh on foreign exchange reserves, requiring careful management of inflows and outflows. (iii) Kenya remains vulnerable to global commodity price shocks, particularly crude oil, as geopolitical tensions in key oil-producing regions could lead to sudden price spikes that increase import costs and strain reserves. (iv) while U.S. interest rates are easing, the dollar’s continued strength against emerging market currencies has sustained pressure on the shilling • On the positive side, strong diaspora remittances remain a key stabilizing factor, providing a steady source of foreign currency inflows that support domestic liquidity. These inflows are likely to moderate depreciation pressures and help maintain relative stability in the currency. While short-term volatility may persist due to external shocks and market sentiment, the overall outlook for the shilling in 2026 remains cautiously stable, reflecting a balance between persistent external pressures and supportive inflows from remittances and external financing. |
Neutral |
Neutral |
|
Interest Rates |
• Given the expansionary monetary policy stance maintained in 2025, we expect the Monetary Policy Committee (MPC) to continue accommodative measures in 2026, aimed at supporting economic growth and stimulating private sector activity while carefully monitoring inflation and the shilling’s performance. The yield curve is expected to remain relatively stable, as lower policy rates reduce short-term borrowing costs, encouraging investment and consumption without triggering excessive inflationary pressures • On the macroeconomic front, expansionary monetary policy is likely to bolster domestic demand, particularly in the manufacturing and services sectors, while providing liquidity to credit-constrained businesses. However, external vulnerabilities, including currency pressures from persistent current account deficits and potential commodity price shocks (notably crude oil), may continue to pose risks to inflation and reserves. The combination of accommodative monetary policy, prudent debt management, and supportive external financing is therefore expected to maintain a balanced environment, encouraging growth and investment while containing external and inflationary pressures. Overall, the outlook suggests a predictable interest rate environment, improved credit conditions, and continued resilience in Kenya’s macroeconomic framework throughout 2026. |
Positive |
Positive |
|
Inflation |
• We expect inflation to average 5.0% in 2026, remaining comfortably within the government’s target range of 2.5%–7.5%. The primary drivers of inflation are high electricity tariffs and elevated fuel costs, which increase production and transport expenses across the economy. In addition, the Central Bank of Kenya’s (CBK) accommodative monetary policy stance is contributing to inflationary pressures by sustaining domestic demand and increasing liquidity in the financial system. Overall, the combination of persistent cost-push factors and a demand-supportive monetary environment is expected to keep inflation moderately elevated, though still within the target range, allowing policymakers to balance growth objectives with price stability throughout 2026. |
Neutral |
Neutral |
|
GDP |
• We anticipate the economic growth to continue on its recovery trajectory in 2026, with the GDP growth rate ranging between 5.2% - 5.5%. We expect the GDP growth to be supported by the continued recovery of the agricultural sector and a robust performance in the services sector driven by growth in information and technology as well as accommodation and food services as a result of increased tourism. However, there are several risks could potentially hinder this growth such as the high risk of debt distress, elevated inflationary pressures and currency depreciation. |
Positive |
Neutral |
|
Investor Sentiment |
• We expect the high positive investor sentiments witnessed in 2025 to persist through the short to medium term of 2026, mainly due to; i) Anchored inflationary pressures driven by reduced fuel costs, ii) Stability of the Kenyan currency as a result of decreased dollar demand from importers, especially for oil and energy sectors, and iii) Recovery of the private sector as the low interest rate environment reduces borrowing costs leading to an uptick in the business environment. |
Positive |
Positive |
|
Security |
• We expect 2026 to be characterized by heightened political activity and tensions as the country enters the pre-election period ahead of the August 2027 general elections. Political positioning, coalition building, early campaign activities, and intensified competition among political actors are expected to create significant uncertainty and potential disruptions to the business environment |
Negative |
Negative |
The change from last year’s outlook is:
- GDP outlook revised to Positive from Neutral, supported by stronger-than-expected economic performance in 2025, easing monetary conditions following cumulative policy rate cuts, and improving macroeconomic stability marked by anchored inflation and a stable Kenyan shilling. These factors are expected to enhance private sector credit uptake and sustain the recovery momentum into 2026.
Out of the seven metrics that we track, two have a neutral outlook, two have a negative outlook, and three have a positive outlook, compared with last year when three were neutral, two were negative, and two were positive. While the number of positive metrics has increased, our general outlook for the macroeconomic environment remains NEUTRAL for 2026, unchanged from 2025. The composition of the outlook remains balanced, with improvements in currency stability and interest rate normalization being offset by persistent challenges, including elevated debt levels, constrained multilateral financing, and heightened political uncertainty as the country enters the pre-election period ahead of the August 2027 general elections
The government is currently 112.9% ahead its prorated domestic borrowing target, having a net borrowing of Kshs 750.1 bn domestically, against the pro-rated target of Kshs 352.3 bn, and 18.2% ahead of the total net domestic borrowing target of Kshs 634.8 bn for FY’2025/26, suggesting aggressive borrowing from the local market mainly on the back of the high debt maturities. We expect a moderate downward pressure on the interest rates, supported by the Central Bank of Kenya’s accommodative monetary policy stance and general economic improvement. While the international capital markets remain challenging, the reduced inflationary environment, easing global interest rates is expected to alleviate investor demands for high yields, though elevated debt servicing costs could still weigh on fiscal sustainability.
Below is a summary of treasury bills and bond maturities and the expected borrowings over the same period. The government will need to borrow Kshs 111.1 bn on average each month for the rest of the fiscal year to meet the domestic borrowing target of Kshs 634.8 bn for the FY’2025/2026, and cover T-bill and T-bond maturities, as illustrated in the graph below:
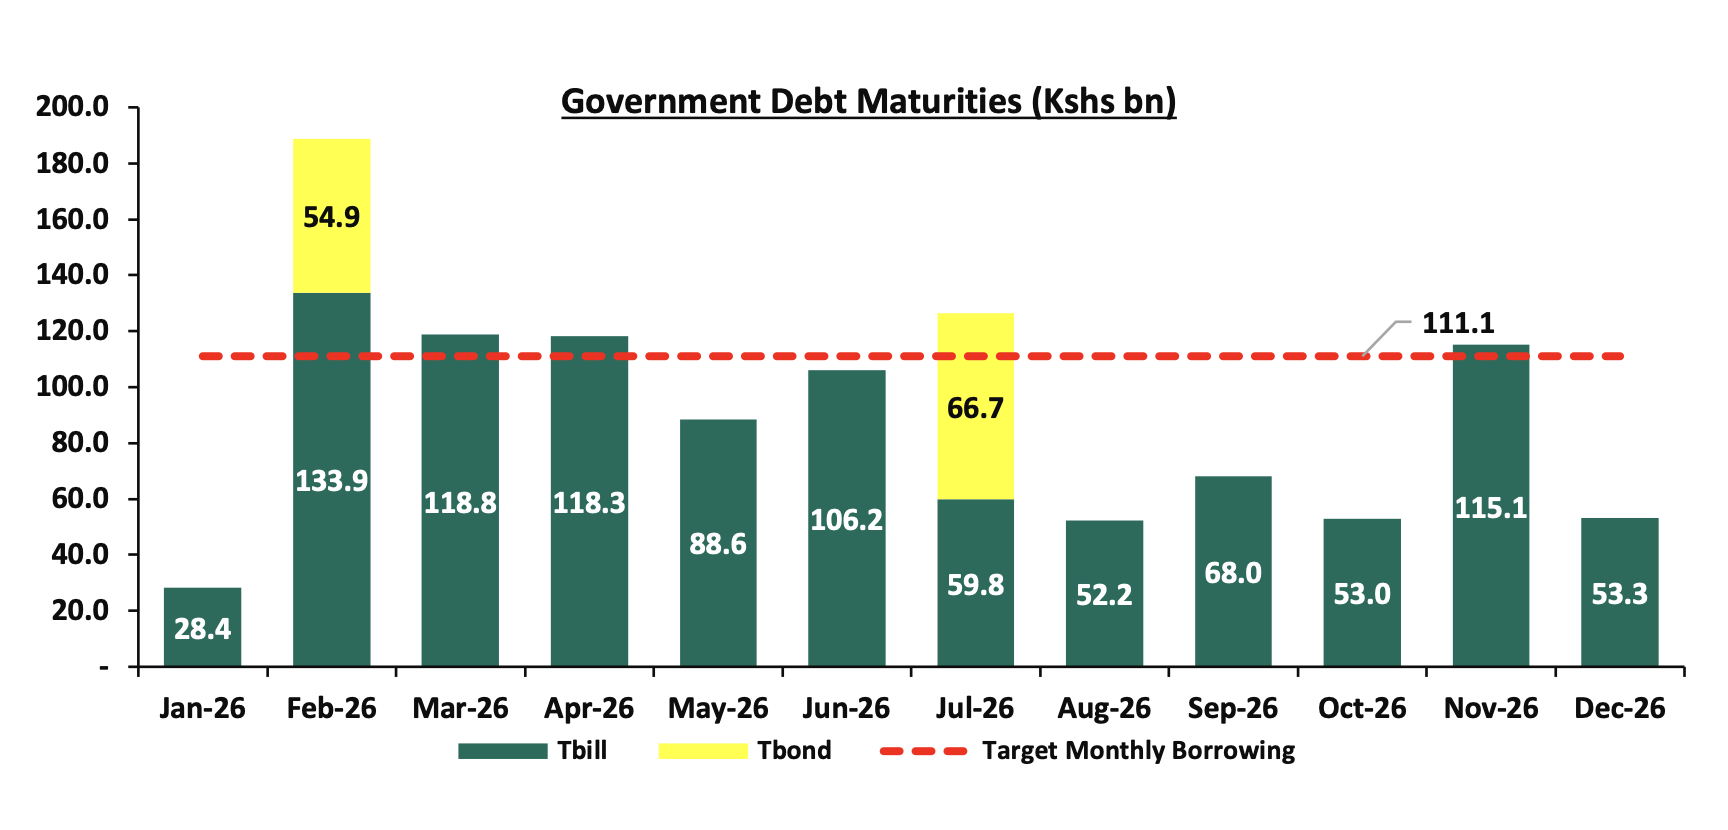
Fig: Schedule of Treasury bills and bonds maturities and the expected target borrowings in the 2025-2026 fiscal year to cater for the maturities and additional government borrowing.
Weekly Market Performance:
Money Markets, T-Bills Primary Auction:
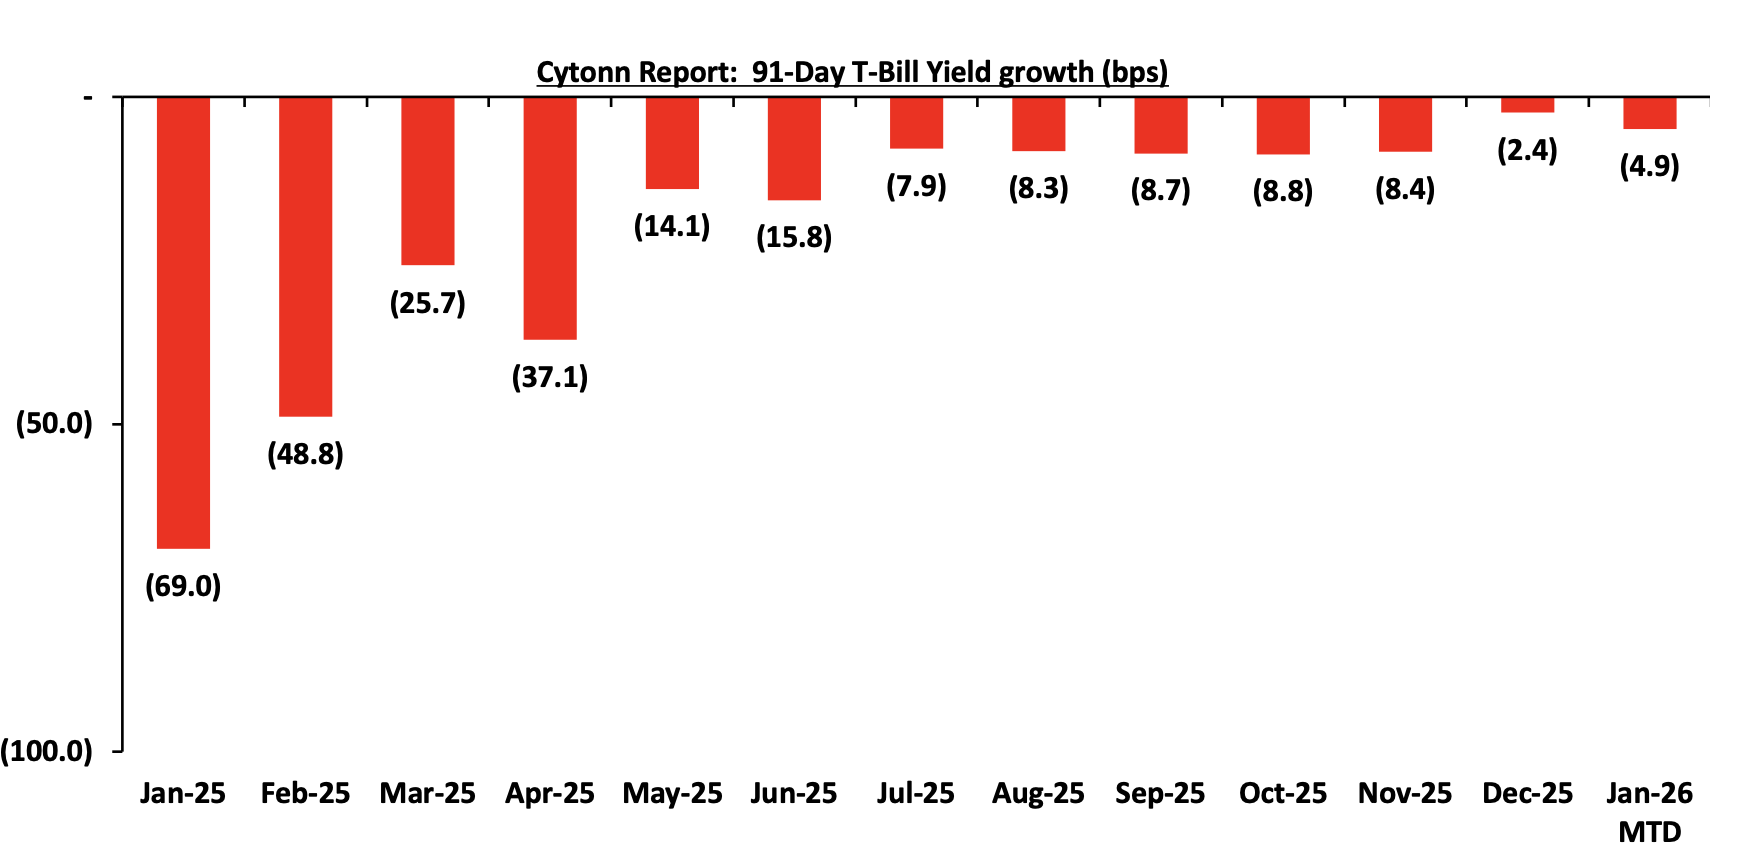
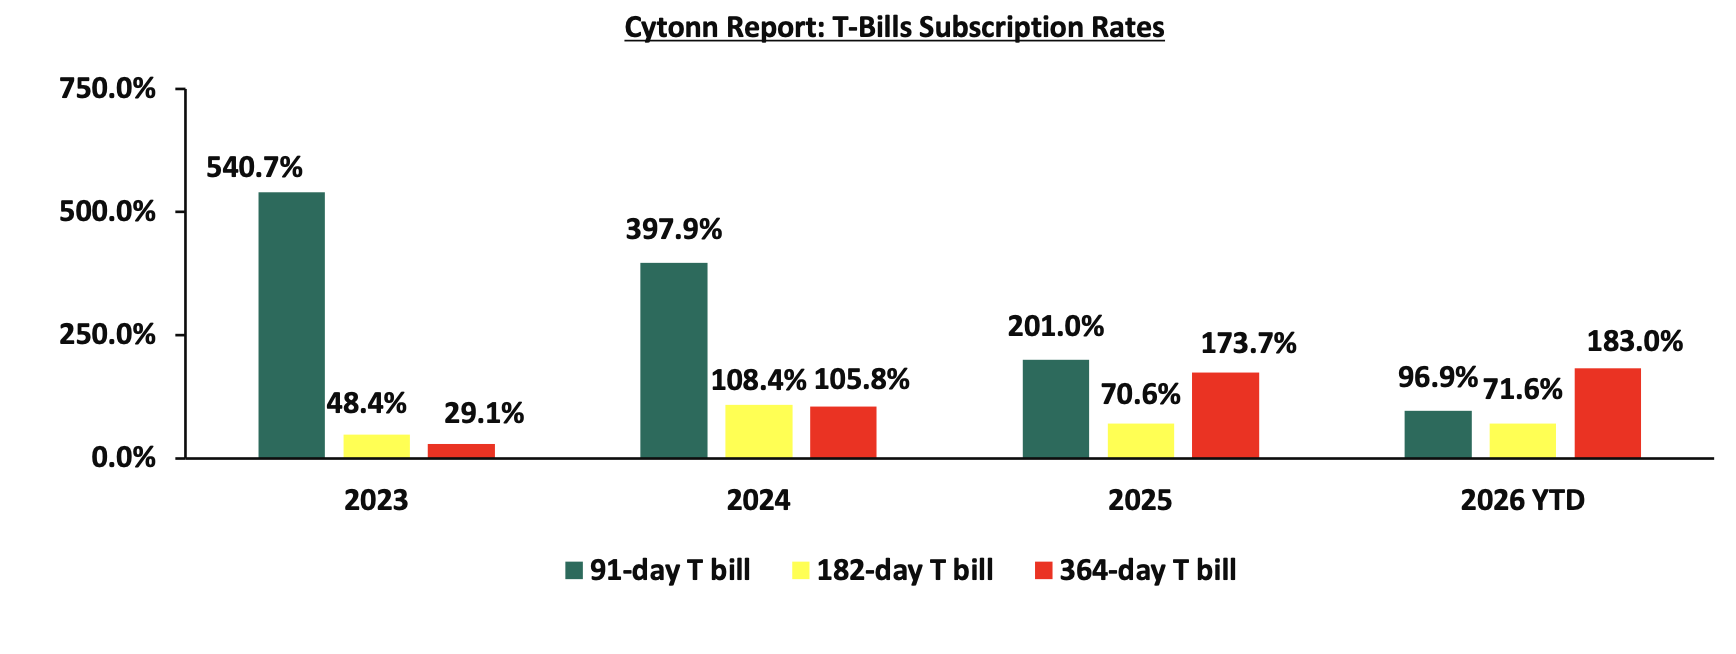
This week, T-bills were oversubscribed for the third consecutive week, with the overall subscription rate coming in at 128.4%, albeit lower than the subscription rate of 130.3% recorded the previous week. Investors’ preference for the shorter 91-day paper waned, with the paper receiving bids worth Kshs 1.0 bn against the offered Kshs 4.0 bn, translating to a subscription rate of 24.0%, significantly lower than the subscription rate of 108.5%, recorded the previous week. The subscription rate for the 182-day paper decreased to 5.8% from the 96.1% recorded the previous week, while that of the 364-day papers increased to 292.8% from 173.2% recorded the previous week. The government accepted a total of Kshs 28.5 bn worth of bids out of Kshs 30.8 bn bids received, translating to an acceptance rate of 92.5%. The yields on the government papers showed mixed performance with the yield on the 182-day paper remaining unchanged at 7.8% compared to the previous week, while the yields on the 91-day and 364-day paper decreased by 2.7 bps and 0.1 bps to remain relatively unchanged at 9.2% and 7.7% respectively compared to last week. The chart below shows the yield growth rate for the 91-day paper over the period:
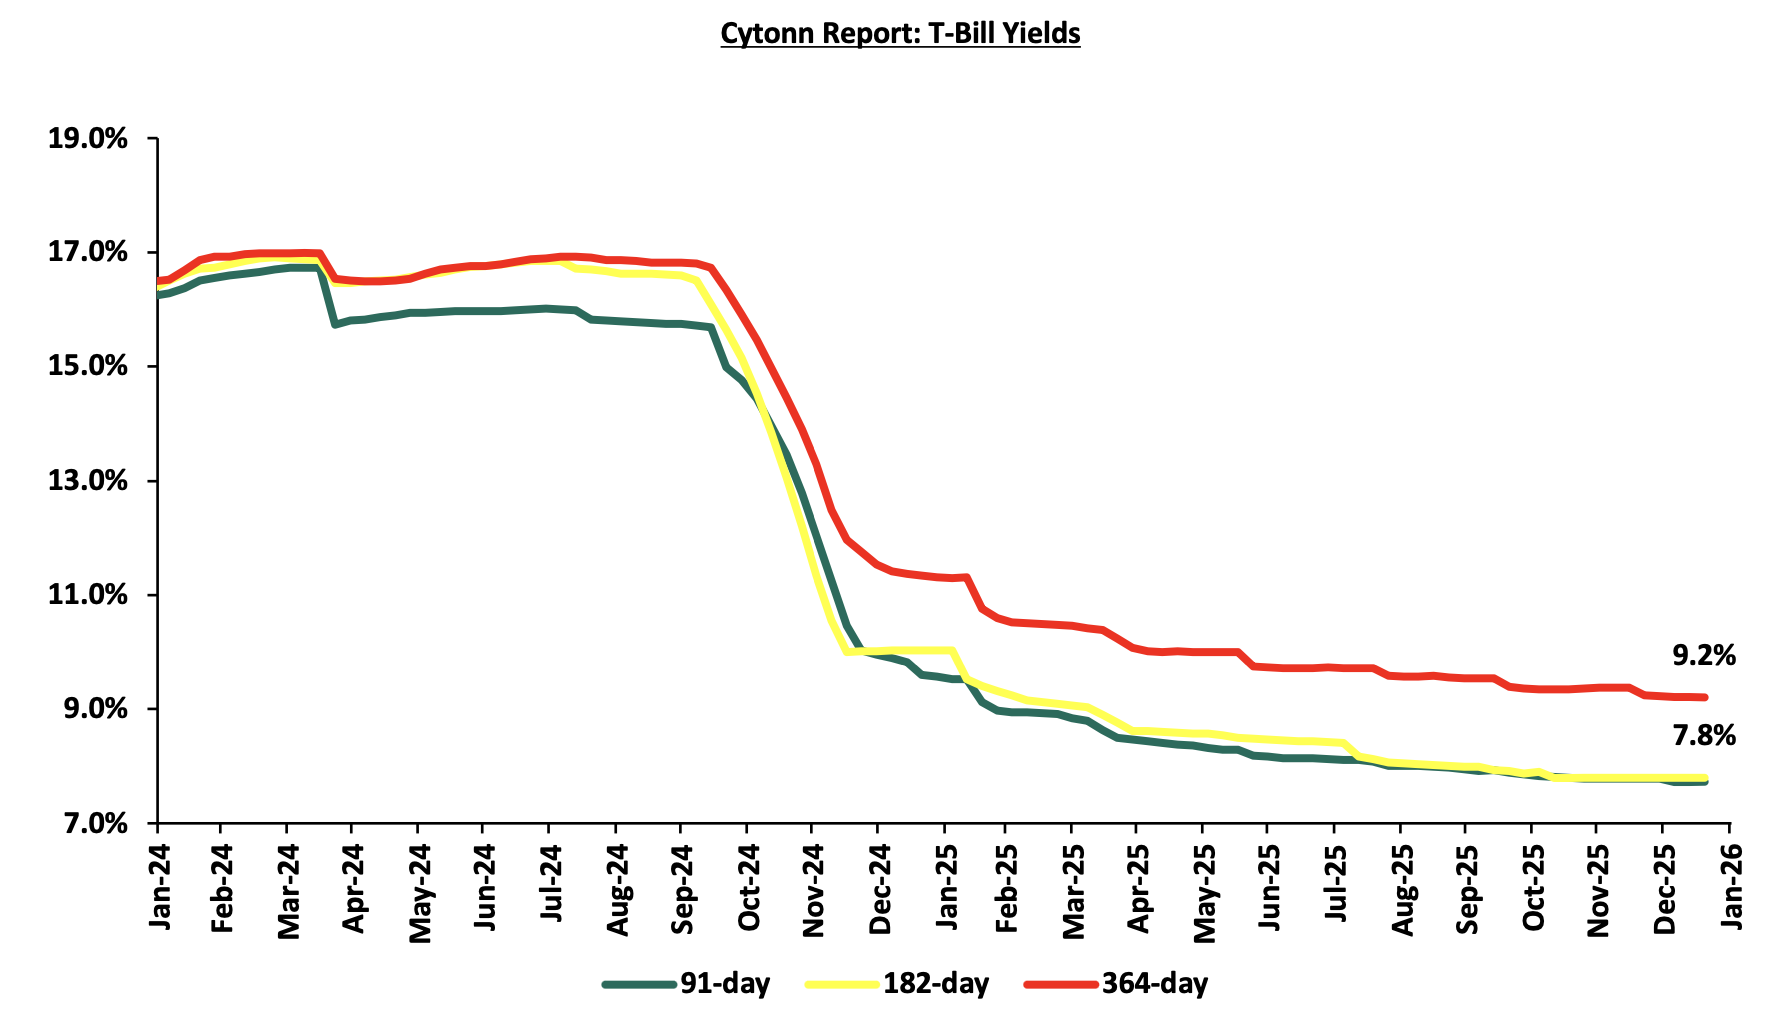
The chart below shows the performance of the 91-day, 182-day and 364-day papers from January 2024 to January 2026;
The chart below compares the overall average T-bill subscription rates obtained in 2023, 2024, 2025 and 2026 Year-to-date (YTD);
Money Market Performance:
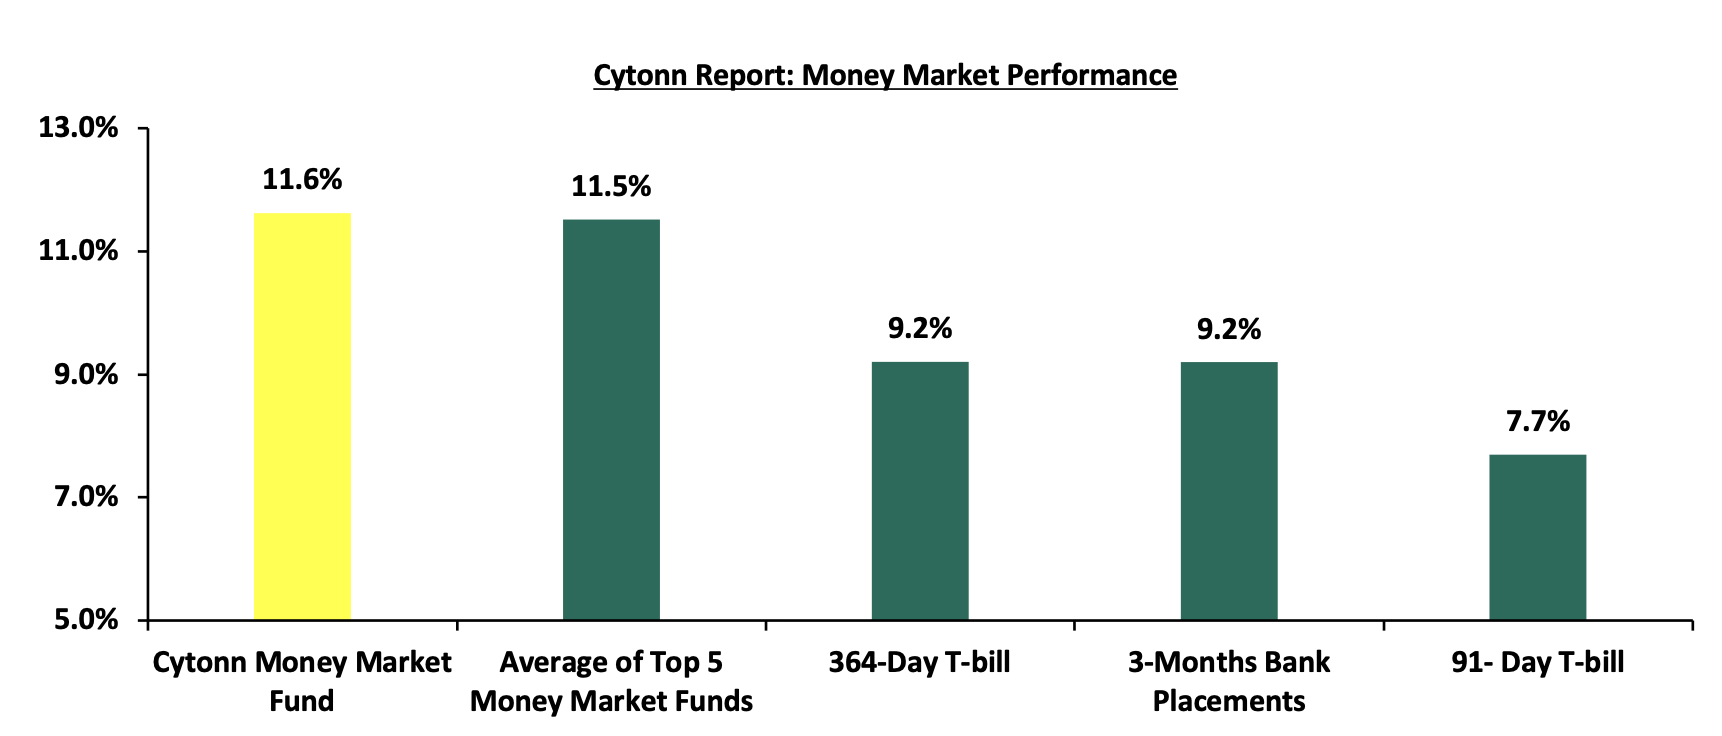
In the money markets, 3-month bank placements ended the week at 9.2% (based on what we have been offered by various banks), and yields on the government papers decreased, with the yields on the 91-day and 364-day paper decreased by 2.7 bps and 0.1 bps to remain relatively unchanged at 9.2% and 7.7% respectively compared to the previous week. The yield on the Cytonn Money Market Fund declined by 6.0 bps to 11.6% from the 11.7% recorded the previous week, while the average yields on the Top 5 Money Market Funds increased marginally by 2.4 bps to remain relatively unchanged at 11.5% in comparison to the previous week.
The table below shows the Money Market Fund Yields for Kenyan Fund Managers as published on 16th January 2026:
|
Money Market Fund Yield for Fund Managers as published on 16th January 2026 |
||
|
Rank |
Fund Manager |
Effective Annual Rate |
|
1 |
Arvocap Money Market Fund |
12.2% |
|
2 |
Cytonn Money Market Fund (Dial *809# or download Cytonn App) |
11.6% |
|
3 |
Nabo Africa Money Market Fund |
11.6% |
|
4 |
Etica Money Market Fund |
11.1% |
|
5 |
Enwealth Money Market Fund |
11.1% |
|
6 |
Ndovu Money Market Fund |
11.1% |
|
7 |
Lofty-Corban Money Market Fund |
11.0% |
|
8 |
Gulfcap Money Market Fund |
10.8% |
|
9 |
Kuza Money Market fund |
10.4% |
|
10 |
Jubilee Money Market Fund |
10.4% |
|
11 |
Old Mutual Money Market Fund |
10.3% |
|
12 |
British-American Money Market Fund |
10.1% |
|
13 |
Orient Kasha Money Market Fund |
10.0% |
|
14 |
Madison Money Market Fund |
9.7% |
|
15 |
Dry Associates Money Market Fund |
9.6% |
|
16 |
SanlamAllianz Money Market Fund |
9.5% |
|
17 |
Apollo Money Market Fund |
9.5% |
|
18 |
KCB Money Market Fund |
9.5% |
|
19 |
GenAfrica Money Market Fund |
9.3% |
|
20 |
Faulu Money Market Fund |
9.1% |
|
21 |
Genghis Money Market Fund |
8.6% |
|
22 |
CIC Money Market Fund |
8.5% |
|
23 |
Mali Money Market Fund |
8.3% |
|
24 |
ICEA Lion Money Market Fund |
8.3% |
|
25 |
CPF Money Market Fund |
8.3% |
|
26 |
Co-op Money Market Fund |
8.2% |
|
27 |
Absa Shilling Money Market Fund |
7.5% |
|
28 |
Mayfair Money Market Fund |
7.0% |
|
29 |
AA Kenya Shillings Fund |
6.1% |
|
30 |
Ziidi Money Market Fund |
6.1% |
|
31 |
Stanbic Money Market Fund |
5.8% |
|
32 |
Equity Money Market Fund |
4.9% |
Source: Business Daily
Liquidity:
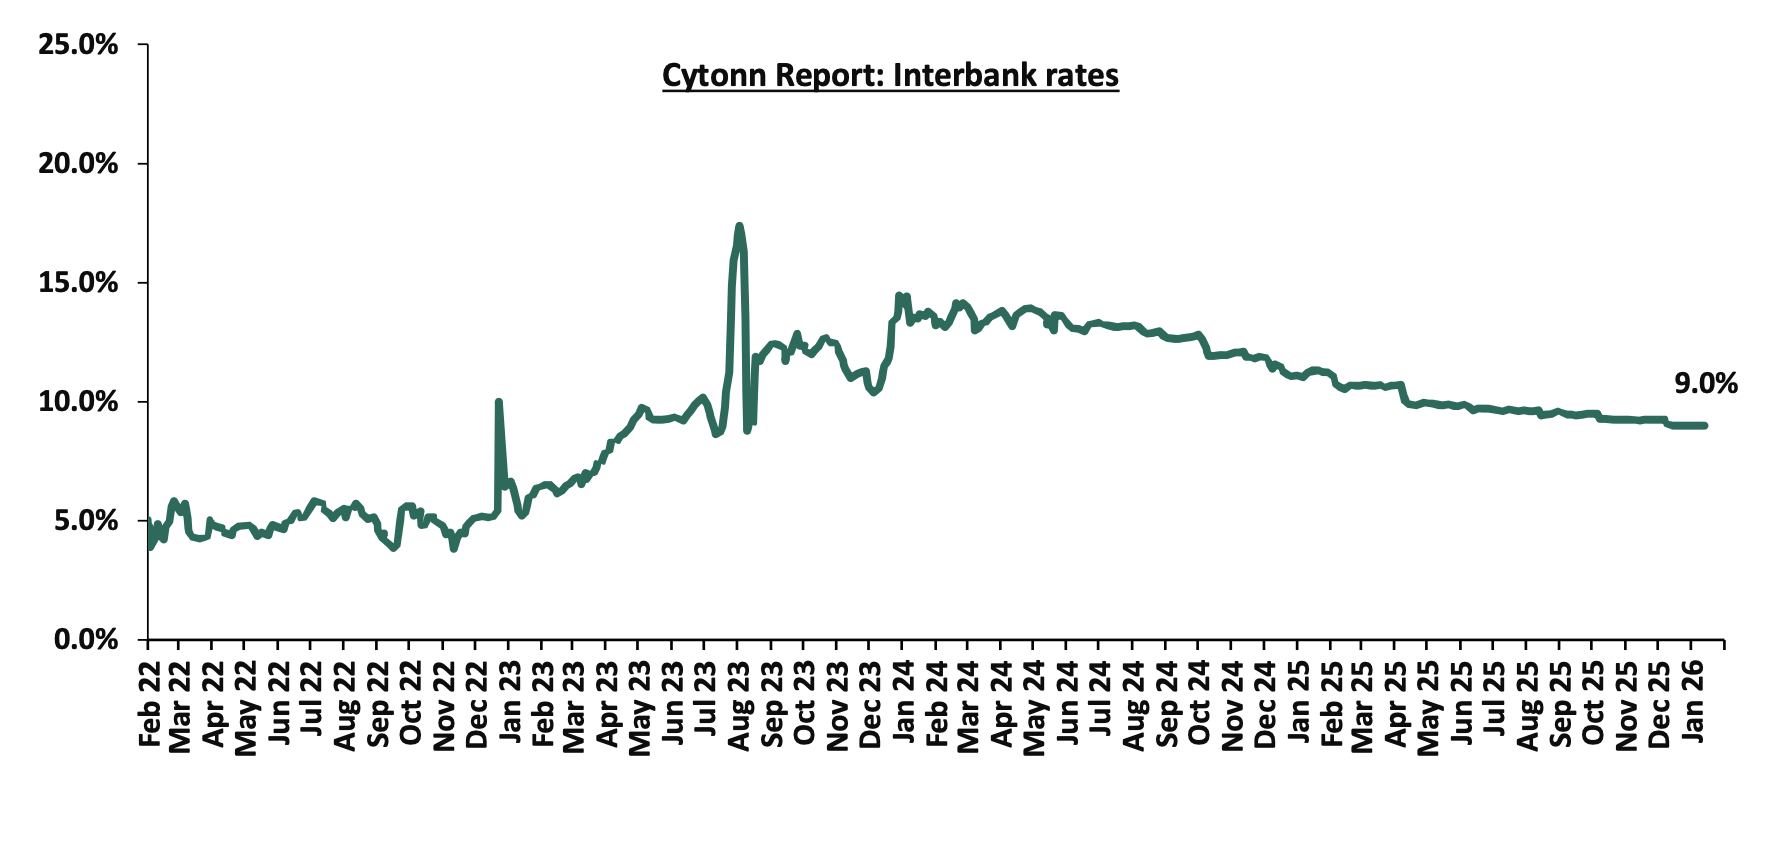
During the week, liquidity in the money markets marginally tightened, with the average interbank rate increasing by 0.7 bps remaining relatively unchanged at 9.0% compared to the previous week, partly attributable to the tax remittances that offset government payments. The average interbank volumes traded increased by 103.4% to Kshs 15.2 bn from Kshs 7.5 bn recorded the previous week. The chart below shows the interbank rates in the market over the years:
Kenya Eurobonds:
During the week, the yields on Eurobonds were on a downward trajectory, with the yields on the 7-year Eurobond issued in 2024 decreasing the most by 31.9 bps to 7.0% from 7.3% recorded the previous week. The table below shows the summary of the performance of the Kenyan Eurobonds as of 15th January 2026:
|
Cytonn Report: Kenya Eurobond Performance |
|||||||
|
|
2018 |
2019 |
2021 |
2024 |
2025 |
||
|
Tenor |
10-year issue |
30-year issue |
7-year issue |
12-year issue |
13-year issue |
7-year issue |
11-year issue |
|
Amount Issued (USD) |
1.0 bn |
1.0 bn |
0.9 bn |
1.2 bn |
1.0 bn |
1.5 bn |
1.5 bn |
|
Years to Maturity |
2.5 |
22.5 |
1.7 |
6.7 |
8.8 |
.5.5 |
10.5 |
|
Yields at Issue |
7.3% |
8.3% |
7.0% |
7.9% |
6.2% |
10.4% |
9.9% |
|
2-Jan-26 |
6.1% |
8.8% |
0.0% |
7.2% |
7.8% |
7.1% |
|
|
8-Jan-26 |
6.2% |
9.1% |
0.0% |
7.4% |
8.1% |
7.3% |
|
|
9-Jan-26 |
6.2% |
9.0% |
0.0% |
7.4% |
8.1% |
7.2% |
|
|
12-Jan-26 |
6.2% |
9.0% |
0.0% |
7.4% |
8.1% |
7.3% |
|
|
13-Jan-26 |
6.2% |
9.0% |
0.0% |
7.4% |
8.1% |
7.2% |
|
|
14-Jan-26 |
6.2% |
9.0% |
0.0% |
7.4% |
8.0% |
7.2% |
10.0% |
|
15-Jan-26 |
6.2% |
8.9% |
0.0% |
7.2% |
7.9% |
7.0% |
|
|
Weekly Change |
(0.1%) |
(0.2%) |
- |
(0.2%) |
(0.2%) |
(0.3%) |
0.0% |
|
MTD Change |
0.1% |
0.1% |
- |
0.1% |
0.1% |
(0.1%) |
0.0% |
|
YTD Change |
0.1% |
0.1% |
- |
0.1% |
0.1% |
(0.1%) |
0.0% |
Source: Central Bank of Kenya (CBK)
Africa’s return to the Eurobond market in 2025 has been marked by strong investor appetite and improving sentiment. Ivory Coast, Benin, Kenya, Senegal, and Cameroon collectively raised over USD 6.3 bn, with all issuances oversubscribed, driven by yield-seeking investors and positive regional recovery prospects. Notable deals included Ivory Coast’s USD 2.6 bn dual-tranche bond and Kenya’s USD 1.5 billion Eurobond used for a 2027 buy-back. Cameroon’s USD 550.0 mn issuance in July 2024 became the most expensive in recent years, with a 10.8% yield. By June 2025, bond yields declined across most issuers, including Kenya, Benin and Ivory Coast reflecting easing inflation, currency stability, and stronger investor confidence. This trend highlights improved market access for African sovereigns, though borrowing costs remain high for fiscally risky nations like Nigeria, where the yield edged up slightly to 9.1%. The table below shows the SSA countries that have issued Eurobonds and their respective risk of debt distress:
|
Cytonn Report: Sub-Saharan Africa Eurobond Countries |
|||||
|
COUNTRY |
Debt to GDP (IMF 2025) |
Debt to GDP (IMF Forecasted) |
Debt Service to Revenue Ratio |
Risk of Overall debt distress (Joint IMF and World Bank DSA |
Current Situation |
|
Senegal |
122.9% |
124.3% |
30.5% |
In debt distress |
No debt restructuring ongoing |
|
Zambia |
114.9% |
114.9% |
14.0% |
In debt distress |
External debt restructuring ongoing |
|
Gabon |
76.2% |
82.0% |
48.9% |
High risk of debt distress |
No debt restructuring ongoing |
|
South Africa |
77.3% |
79.5% |
21.3% |
High risk of debt distress |
No debt restructuring ongoing |
|
Rwanda |
73.2% |
74.8% |
15.9% |
Moderate risk of debt distress |
No debt restructuring ongoing |
|
Kenya |
68.0% |
70.1% |
62.6% |
High risk of debt distress |
No debt restructuring ongoing |
|
Namibia |
63.6% |
63.3% |
13.8% |
High risk of debt distress |
No debt restructuring ongoing |
|
Angola |
62.4% |
63.2% |
19.5% |
High risk of debt distress |
No debt restructuring ongoing |
|
Seychelles |
56.7% |
58.4% |
- |
High risk of debt distress |
No debt restructuring ongoing |
|
Ghana |
59.1% |
56.1% |
43.5% |
High risk of debt distress |
External and domestic debt restructuring ongoing |
|
Côte d'Ivoire |
55.6% |
54.1% |
34.0% |
Moderate risk of debt distress |
No debt restructuring ongoing |
|
Benin |
50.7% |
49.6% |
64.7% |
Moderate risk of debt distress |
No debt restructuring ongoing |
|
Tanzania |
49.6% |
48.3% |
44.6% |
Moderate risk of debt distress |
No debt restructuring ongoing |
|
Ethiopia |
46.7% |
41.1% |
31.0% |
In debt distress |
External debt restructuring ongoing |
|
Cameroon |
37.9% |
36.3% |
51.6% |
High risk of debt distress |
No debt restructuring ongoing |
|
Nigeria |
36.4% |
35.0% |
66.9% |
Moderate risk of debt distress |
Domestic debt restructuring |
|
Average |
65.7% |
65.7% |
35.2% |
||
Sources: International Monetary Fund (IMF) 2025 economic outlook & Joint Debt Sustainability Analysis (DSA), World Bank
Key take-outs in the table include
- Three countries already defaulted on their debt: Senegal, Zambia and Ethiopia are already in debt distress, and have already initiated different forms of debt restructuring, especially at the G20,
- The average debt servicing consumes above 35.2% of the total revenue collected, translating to less allocation for development purposes, and,
- Although Kenya’s debt to GDP ratio is projected to increase to 70.1% in 2026 from 68.0% in 2025, the government’s reduced debt appetite might push the ratio lower, having recorded a debt to GDP ratio of 68.3% as of June 2025, due to the current administration’s initiatives towards fiscal consolidation
Kenya Shilling:
During the week, the Kenya Shilling depreciated marginally against the US Dollar by 1.6 bps, to remain unchanged from Kshs 129.0 recorded the previous week. On a year-to-date basis, the shilling has appreciated marginally by 1.5 bps against the dollar, compared to the 22.9 bps appreciation recorded in 2025.
We expect the shilling to be supported by:
- Diaspora remittances standing at a cumulative USD 5,036.7 mn in the 12 months to December 2025, 1.9% higher than the USD 4,945.2 mn recorded over the same period in 2024. In the December 2025 diaspora remittances figures, North America remained the largest source of remittances to Kenya accounting for 53.3% in the period, and,
- Tourism inflows, which strengthened significantly. Tourism receipts reached Kshs 560.0 billion in 2025, up from Kshs 452.2 billion in 2024, representing a 23.9% increase, supported by improved international arrivals through the country’s major airports, and,
- Improved forex reserves currently at USD 12.5 bn (equivalent to 5.4-months of import cover), which is above the statutory requirement of maintaining at least 4.0-months of import cover and the EAC region’s convergence criteria of 4.5-months of import cover.
The shilling is however expected to remain under pressure in 2026 as a result of:
- An ever-present current account deficit which came at 2.2% of GDP in the twelve months to October 2025, and,
- Elevated government debt servicing obligations, which continue to exert pressure on foreign exchange reserves, given that 59.7% of Kenya’s external debt is US Dollar-denominated as of June 2025, sustaining demand for hard currency in 2026.
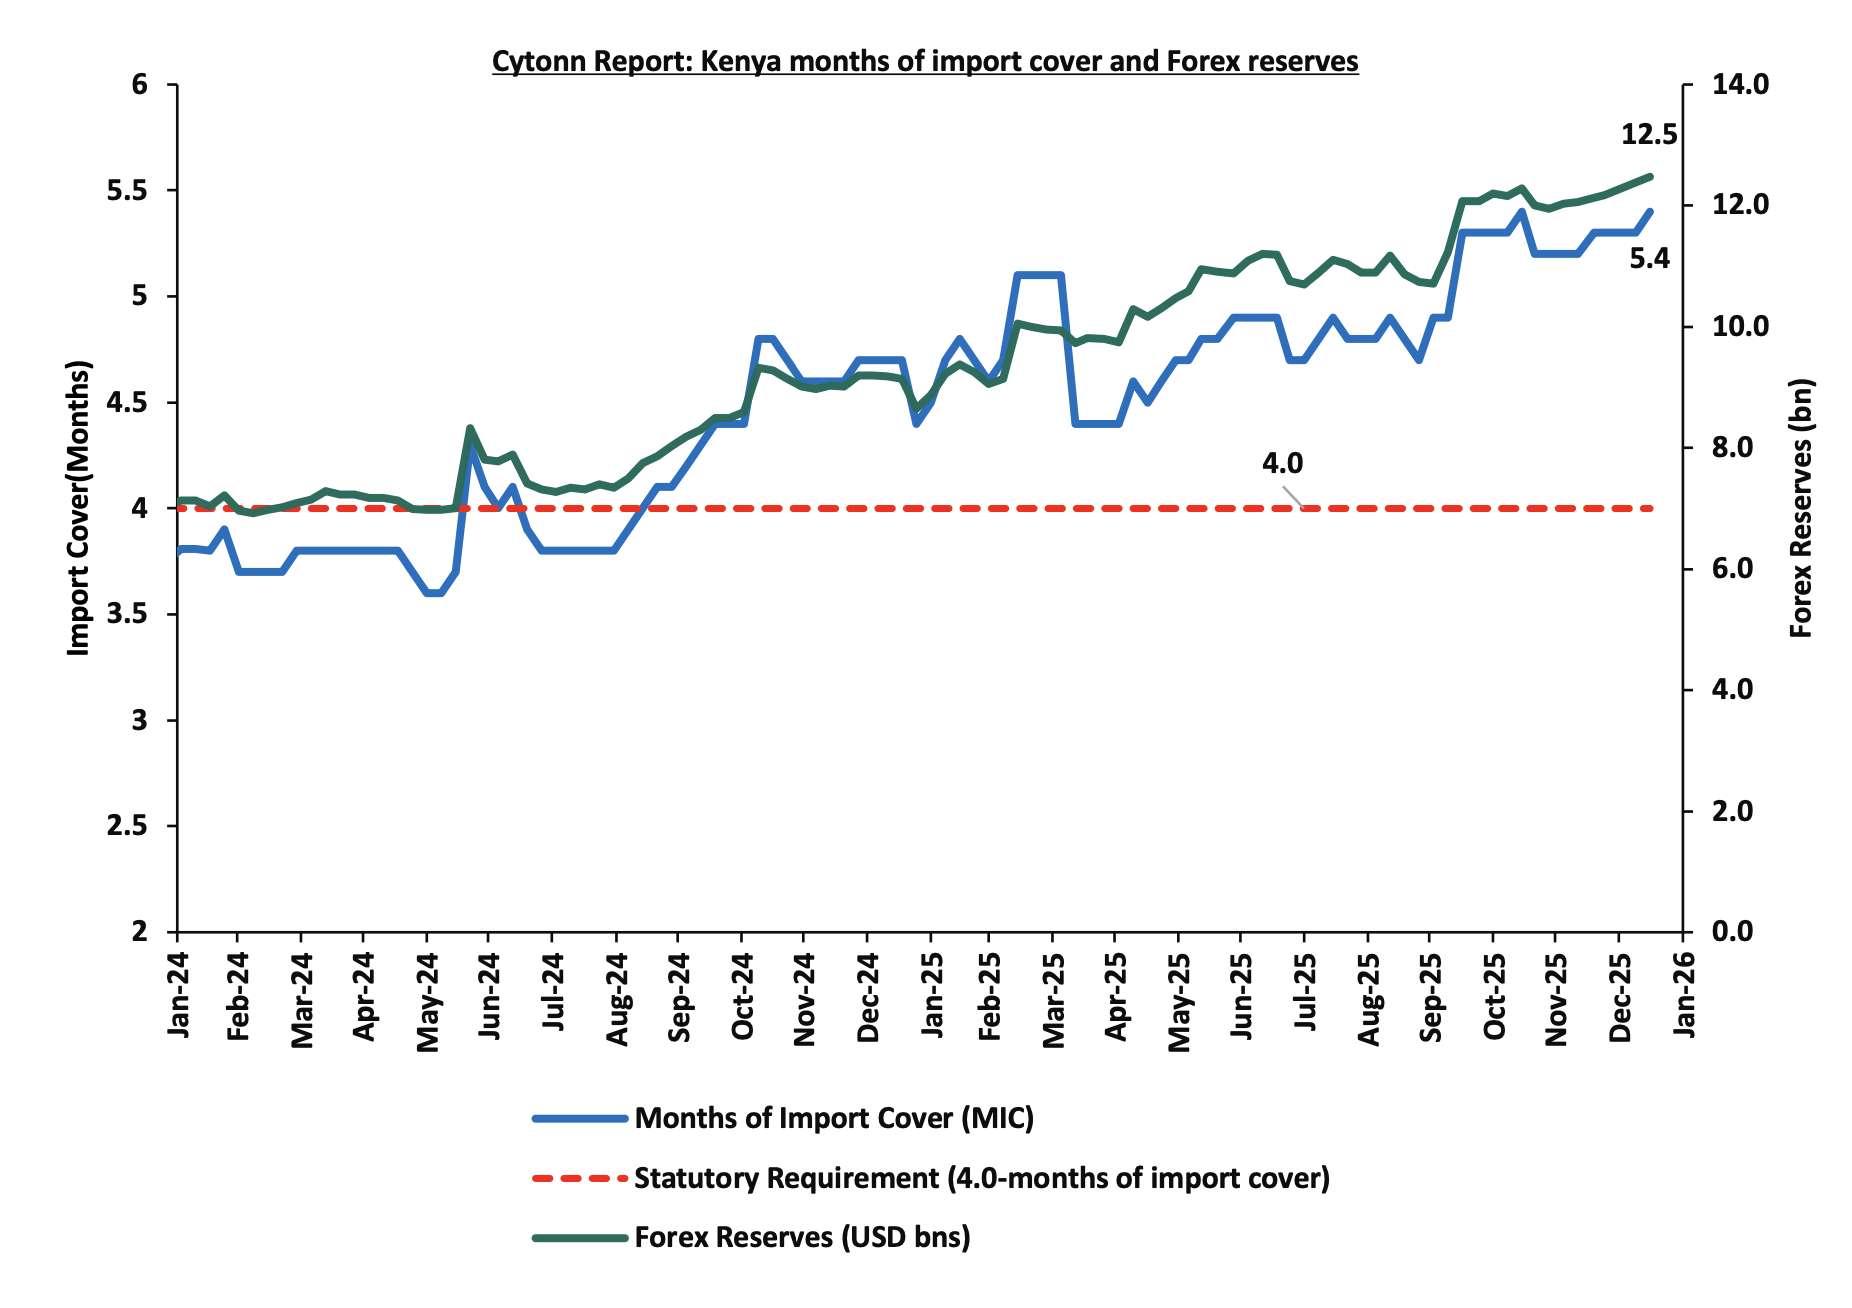
Kenya’s forex reserves increased by 0.8% during the week to 12.5 bn from the USD 12.4 bn recorded the previous week, equivalent to 5.4 months of import cover, and above the statutory requirement of maintaining at least 4.0-months of import cover.
The chart below summarizes the evolution of Kenya's months of import cover over the years:
Weekly Highlights:
- Fuel Prices effective 15th January – 14th February 2026
During the week, The Energy and Petroleum Regulatory Authority (EPRA) released their monthly statement on the maximum retail fuel prices in Kenya, effective from 15th January 2026 to 14th February 2026. Notably, the maximum allowed prices for Super Petrol, Diesel and Kerosene decreased by Kshs 2.0, Kshs 1.0 and Kshs 1.0 per litre to Kshs 182.5, Kshs 170.5 and Kshs 153.8 per litre from Kshs 184.5, Kshs 171.5 and Kshs 171.5 per litre respectively in December 2025, the first decrease in 4 months, with the last being on September 2025.
Other key take-outs from the performance include,
- The average landing cost per cubic metre of Kerosene, Diesel and Super Petrol decreased by 8.9%, 4.2% and 0.1% to USD 607.6, USD 626.8 and USD 592.2 in December 2025 from USD 667.1, USD 654.2 and USD 592.8 recorded in November 2025.
- The Kenyan Shilling appreciated against the US Dollar by 0.4 bps to Kshs 129.3 in December 2025 from the Kshs 129.8 recorded in November 2025.
We note that fuel prices in the country have stabilized in recent months largely due to the government's efforts to stabilize pump prices through the petroleum pump price stabilization mechanism which expended Kshs 13.7 bn in the FY’2024/25 to cushion the increases applied to the petroleum pump prices, coupled with the stabilization of the Kenyan Shilling against the dollar and other major currencies. Additionally, the government increased spending through the price stabilization mechanism, subsidizing Kshs 1.6 per litre for Petrol, compared to Kshs 5.7 and Kshs 9.1 deficits for Diesel and Kerosene in December saw a reduction in fuel prices for the period under review.
Going forward, we expect that fuel prices will stabilize in the coming months as a result of the government's efforts to mitigate the cost of petroleum through the pump price stabilization mechanism and a stable exchange rate. As such, we expect the business environment in the country to improve as fuel is a major input cost, as well as continued stability in inflationary pressures, with the inflation rate expected to remain within the CBK’s preferred target range of 2.5%-7.5% in the short to medium term.
- Exchequer Highlight December 2025
The National Treasury gazetted the revenue and net expenditures for the sixth month of FY’2025/2026, ending 31stDecember 2025. Below is a summary of the performance:
|
Item |
12-months Original Estimates |
Actual Receipts/Release |
Percentage Achieved |
Prorated |
% achieved of the Prorated |
|
Opening Balance |
|
6.4 |
|
|
|
|
Tax Revenue |
2,627.1 |
1,161.3 |
44.2% |
1,313.5 |
88.4% |
|
Non-Tax Revenue |
127.6 |
82.1 |
64.3% |
63.8 |
128.7% |
|
Total Revenue |
2,754.7 |
1,249.8 |
45.4% |
1,377.4 |
90.7% |
|
External Loans & Grants |
569.8 |
227.0 |
39.8% |
284.9 |
79.7% |
|
Domestic Borrowings |
1,098.3 |
670.4 |
61.0% |
549.1 |
122.1% |
|
Other Domestic Financing |
10.8 |
21.6 |
199.8% |
5.4 |
399.7% |
|
Total Financing |
1,678.9 |
919.0 |
54.7% |
839.4 |
109.5% |
|
Recurrent Exchequer issues |
1,470.4 |
809.2 |
55.0% |
735.2 |
110.1% |
|
CFS Exchequer Issues |
2,141.0 |
1,017.2 |
47.5% |
1,070.5 |
95.0% |
|
Development Expenditure & Net Lending |
407.1 |
145.0 |
35.6% |
203.5 |
71.3% |
|
County Governments + Contingencies |
415.0 |
172.2 |
41.5% |
207.5 |
83.0% |
|
Total Expenditure |
4,433.6 |
2,143.7 |
48.4% |
2,216.8 |
96.7% |
|
Fiscal Deficit excluding Grants |
1,678.9 |
893.8 |
53.2% |
839.4 |
106.5% |
|
Total Borrowing |
1,668.1 |
897.4 |
53.8% |
834.0 |
107.6% |
|
Public Debt |
1,901.4 |
941.6 |
49.5% |
950.7 |
99.0% |
The key take-outs from the release include;
- Total revenue collected as at the end of December 2025 amounted to Kshs 1,249.8 bn, equivalent to 45.4% of the original estimates of Kshs 2,754.7 bn for FY’2025/2026 and is 90.7% of the prorated estimates of Kshs 1,377.4 bn. Cumulatively, tax revenues amounted to Kshs 1,161.3 bn, equivalent to 44.2% of the original estimates of Kshs 2,627.1 bn and 88.4% of the prorated estimates of Kshs 1,313.5 bn,
- Total financing amounted to Kshs 919.0 bn, equivalent to 54.7% of the original estimates of Kshs 1,678.9 bn and is equivalent to 109.5% of the prorated estimates of Kshs 839.4 bn. Additionally, domestic borrowing amounted to Kshs 670.4 bn, equivalent to 61.0% of the original estimates of Kshs 1,098.3 bn and is 122.1% of the prorated estimates of Kshs 549.1 bn,
- The total expenditure amounted to Kshs 2,143.7 bn, equivalent to 48.4% of the original estimates of Kshs 4,433.6 bn, and is 96.7% of the prorated target expenditure estimates of Kshs 2,216.8 bn. Additionally, the net disbursements to recurrent expenditures came in at Kshs 809.2 bn, equivalent to 55.0% of the original estimates of Kshs 1,470.4 and are equivalent to 110.1% of the prorated estimates of Kshs 735.2 bn,
- Consolidated Fund Services (CFS) Exchequer issues came in at Kshs 1,017.2 bn, equivalent to 47.5% of the original estimates of Kshs 2,141.0 bn, and are 95.0% of the prorated amount of Kshs 1,070.5 bn. The cumulative public debt servicing cost amounted to Kshs 941.6 bn which is 49.5% of the original estimates of Kshs 1,901.4 bn and is 99.0% of the prorated estimates of Kshs 950.7 bn. Additionally, the Kshs 941.6 bn debt servicing cost is equivalent to 75.3% of the actual cumulative revenues collected as at the end of December 2025. The chart below shows the debt servicing cost to revenue ratio over the period;
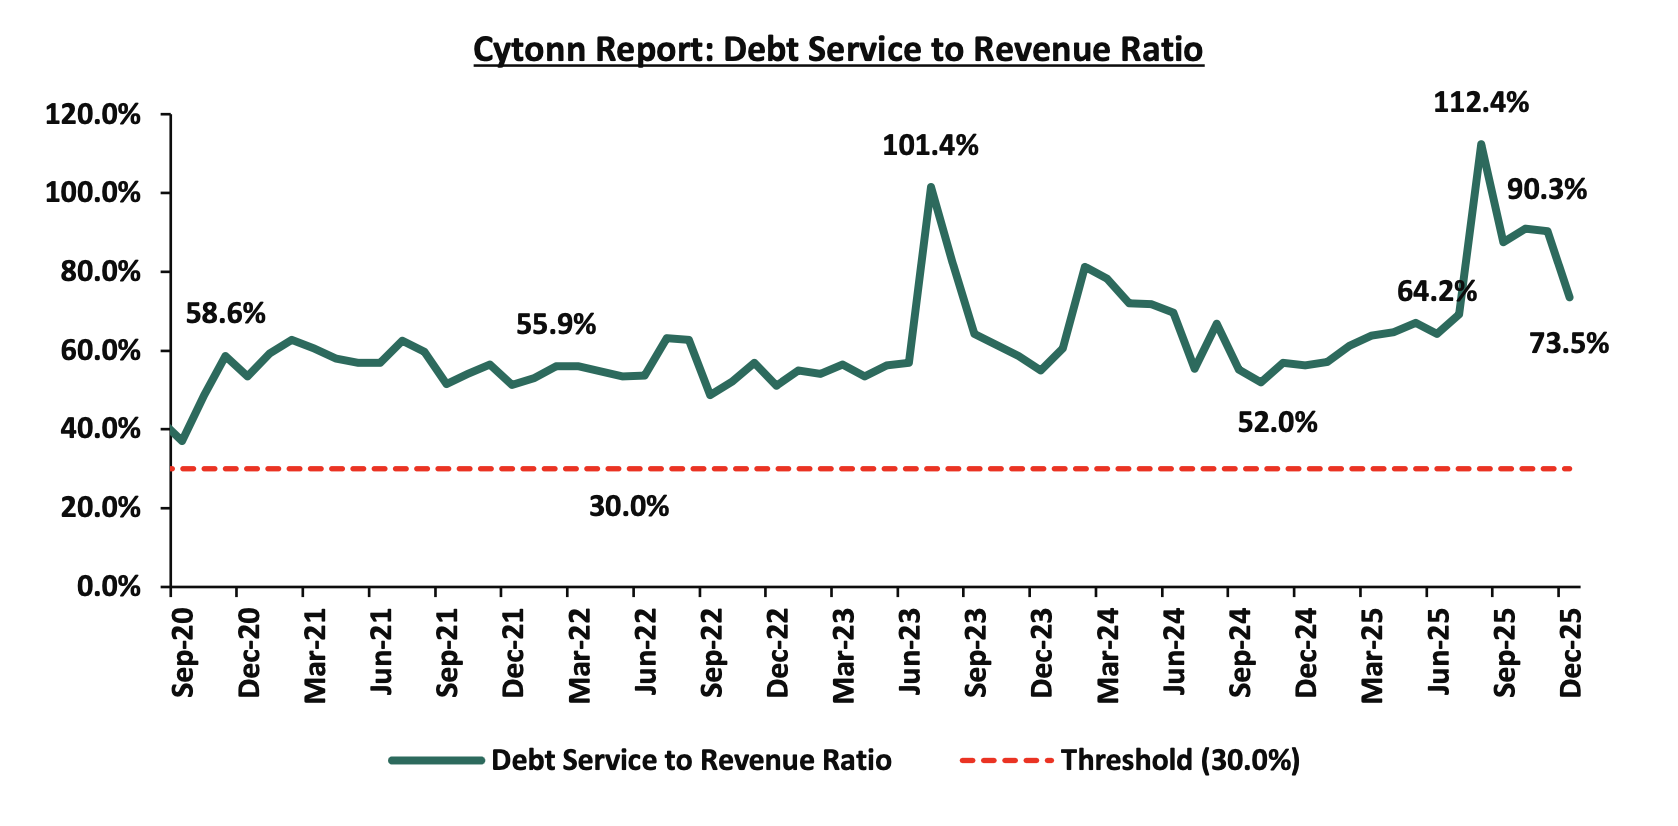
- Total Borrowings as at the end of December 2025 amounted to Kshs 897.4 bn, equivalent to 53.8% of the original estimates of Kshs 1,668.1 bn for FY’2025/2026 and are 107.6% of the prorated estimates of Kshs 834.0 bn. The cumulative domestic borrowing of Kshs 1,098.3 bn comprises of Net Domestic Borrowing Kshs 634.8 bn and Internal Debt Redemptions (Rollovers) Kshs 463.5 bn.
The government underachieved its prorated revenue targets for the sixth month of the FY’2025/2026, achieving 90.7% of the prorated revenue targets in December 2025, higher than the 83.5% recorded in November 2025. This was driven by shortfall in both tax revenues, which stood at 88.4% of prorated levels, respectively. External loans and grants remained significantly below target at 39.8%, increasing reliance on domestic borrowing, which came in at 122.1% of the prorated target. The business environment, however, showed signs of recovery, with the Purchasing Managers’ Index (PMI) standing at 53.7 in December 2025, despite dropping from 55.0 in November 2025, remaining over the 50.0 neutral mark and signaling a slowdown in the contraction of business activity. Expenditure absorption stood at 96.7% of prorated levels, with development spending still lagging at 71.3%, reflecting slow implementation of capital projects. Future revenue performance will depend on how quickly private sector activity strengthens, supported by a stable Shilling, easing credit conditions following the 25.0 bps reduction in the Central Bank Rate to 9.00% from 9.25% in December 2025, and continued efforts to broaden the tax base, curb evasion, and stimulate economic growth.
Rates in the Fixed Income market have been on a downward trend due to easing inflation, strong money market liquidity, and the government’s rejection of high-priced bids supporting yield curve normalization. The government is 112.9% ahead of its prorated net domestic borrowing target of Kshs 352.3 bn, having a net borrowing position of Kshs 634.8 bn (inclusive of T-bills). Going forward, we anticipate stabilization across the short to medium end of the yield curve as the government increasingly turns to external borrowing to sustain its fiscal position, thereby easing pressure on the domestic market. In this environment, investors are expected to shift towards longer-dated securities to lock in the prevailing high yields.
We have a BULLISH outlook on the Kenyan Equities market in the short term but “NEUTRAL” in the medium to long term. We expect a continued improvement in the listed sector’s earnings growth in 2026, largely driven by the expected 5.2%-5.5% GDP growth, decreased yields in the fixed income markets and the improvement of the country’s business environment. The business environment showed signs of improvement in the last quarter of 2025, with the Purchasing Manager’s Index (PMI) averaging at 53.7 in Q4’2025, higher than the year’s average of 51.0. Additionally, the Kenyan currency appreciated against the major select currencies, gaining 0.2% against the USD dollar in 2025 indicating a stability. Strong foreign investor inflows expected in the early weeks of the year may, further, support and accelerate the growth of the equities market in the short term
In 2025, the Kenyan equities market was on an upward trajectory, with NSE 20 gaining the most by 52.5%, while NASI, NSE 10 and NSE 25 gained by 48.9%, 48.0% and 47.4% respectively. The equities market performance was driven by gains recorded by large-cap stocks such as DTBK, Safaricom, NCBA, KCB, EABL, Stanbic, Equity, Co-operative, ABSA and BAT of 71.5%, 64.8%, 64.7%, 55.1%, 49.9%, 41.5%, 39.1%, 37.2% 31.0% and 22.0% respectively. The performance was, however, marginally weighed down by losses by large-cap stocks such as Bamburi of 1.8%.
Following the good performance in the equities market in 2025, the market valuation closed the year at a price-to-earnings ratio (P/E) of 7.4x, and is 34.8% below the 15-year historical average of 11.3x. On the other hand, the equities market closed the year at a dividend yield of 5.3%, 0.6% points above the historical average of 4.7%. Additionally, equities turnover increased by 40.6% to close the year at USD 1.1 bn, from USD 0.8 bn recorded in 2024. Foreign investors remained net sellers, with a net outflow of USD 92.9 mn, compared to net outflows of USD 16.9 mn recorded in 2024. The year saw 8 companies issue profit warnings, as compared to 9 companies in 2024, and 15 companies in 2023. The decrease in the number of companies that issued profit warnings in 2024 highlights the improving macroeconomic environment occasioned by the continued stability of the Kenyan Shilling against the USD and eased inflationary pressures which increased the purchasing power of consumers. However, the improved economic conditions were weighed down by increased taxes in addition to disruption of the global supply chain due to the challenging geopolitics resulting in high production costs. Key to note, companies are required to issue profit warnings if they project a more than 25.0% decline in profits year-on-year. For more information, see our Cytonn Annual Markets Review - 2025.
Kenyan 2026 Equities Outlook
In 2026, we project the following factors to affect the direction of the Kenyan equities market:
- Corporate Earnings Growth: We expect a further improvement in the listed sector’s earnings growth in 2026, largely driven by the expected 5.2%-5.5% GDP growth and the improvement of the country’s business environment. The business environment showed signs of improvement in the last quarter of 2024, with the Purchasing Manager’s Index (PMI) averaging at 53.7 in Q4’2025, higher than the year’s average of 51.0. Additionally, the growth in Corporate Earnings is expected to be broad-based, boosted by the continued expansion of operations, easing cost pressures following the decline in interest rates and improved consumer demand. Further, we anticipate growth in the banking sector’s earnings following the 7.6% weighted growth in earnings in Q3’2025, as well as stronger performance in counters in telecommunication and manufacturing sectors,
- Attractive Valuations: The market valuations remained below the historical average, the market valuation closed the year at a price-to-earnings ratio (P/E) of 7.4x, and is 34.8% below the 15-year historical average of 11.3x and a dividend yield of 5.3%, 0.6% points above the historical average of 4.7%. Given these comparative cheap valuations and higher yields, we expect investors to take advantage of this and buy into the market,
- Capital Markets Investor Sentiment: We anticipate increased foreign interest in the equities market in 2026, driven by the relatively more stable Kenya’s macroeconomic conditions, particularly the stabilization of the currency against the dollar and eased inflationary pressures. Additionally, there are still opportunities for value in the equities with NASI currently trading below its historical average. However, Kenya's macroeconomic conditions is expected to be challenged by the occasional political instability, particularly ahead of the August 2027 elections,
- Diversification of Capital Markets: We anticipate increased activity by the Nairobi Securities Exchange (NSE) in 2026 driven by (i)the introduction of Alternative Investment Funds (AIFs) allows investors to access a broader range of assets, including property, infrastructure, and hedge funds, moving beyond traditional equities and bonds (ii) the approval of new Collective Investment Schemes (CIS), multi-asset funds, including foreign currency-denominated options and the Capital Markets Authority’s approval of Safaricom and Airtel Money as Investment Service Provider Platforms (ISPPs) in December 2025 provides greater product variety and investment flexibility. (iii) market accessibility reforms, such as the NSE’s reduction of the minimum trading unit to one share, enable more retail investors to participate, democratizing market access.
- Monetary Policy Direction: In 2025, the Monetary Policy Committee (MPC) lowered the Central Bank Rate (CBR) by a cumulative 175.0 bps from 10.75% in February to 9.0% in December, in a bid to support the economy, following anchored inflation rate falling to within the CBK’s target range of 2.5%-7.5%, registering a 4.1% average in 2025 from the 4.5% average in 2024, as well as a stable exchange rate. The decrease in CBR has driven the yields on short-term government papers downwards, which is expected to make equities more attractive compared to government papers. Additionally, the improved liquidity will help support the equities market. We expect the MPC to continue lowering the CBR rates in the coming meetings in a bid to continue supporting the private sector, while also keeping an eye on the effect on the inflation and exchange rate.
Below, we summarize the metrics used in coming up with our 2026 Equities Outlook;
|
Cytonn Report: Equities Outlook Summary |
|
||
|
Equities Market Indicators |
Outlook for 2026 |
Current View |
2025 Outlook |
|
Macro-Economic Environment |
· We expect the GDP to grow within a range of 5.2%-5.5% in 2026, driven by the ongoing recovery of business activity, a projected rebound in the agricultural sector, and strong performance in the services sector, particularly in information technology and accommodation and food services, fueled by increased tourism. Furthermore, the Central Bank of Kenya's Monetary Policy Committee’s decision to lower the Central Bank Rate (CBR) is expected to support economic growth. · The key upside to this growth shall be the expansionary monetary policy,anchored inflation, and local currency stability against major currencies. Additionally, we expect the agricultural sector to be supported by the rains witnessed across the country at the end of the year, coupled with recent fiscal policies such as subsidizing costs of crucial farm inputs such as fertilizers that will enhance growth in the sector · Kenya’s macroeconomic environment in 2026 may face several headwinds, including elevated public debt levels that continue to strain fiscal space through high debt-servicing costs, alongside weak revenue growth that could sustain wide budget deficits and increase borrowing needs |
Neutral |
Positive |
|
Corporate Earnings Growth |
· We expect an improvement in the listed sector’s earnings growth in 2026, largely driven by the expected 5.2%-5.5% GDP growth, eased inflation, stable Shilling and the improvement of the country’s business environment. Corporate earnings growth is projected to come in at 17.5% for 2026 compared to the projected 15.0% growth in 2025, · We also expect growth in the banking sector's earnings, driven by an anticipated rise in lending supported by the ongoing adoption of risk-based lending practices and banks' efforts to diversify their revenue streams. |
Positive |
Positive |
|
Valuations |
· With the market closing 2025 at a price-to-earnings ratio (P/E) of 7.4x, and is 34.8% below the 15-year historical average of 11.3x and a dividend yield of 5.3%, 0.6% points above the historical average of 4.7%. These comparative cheap valuations and higher yields present selective value opportunities, attracting domestic and foreign capital in the near term. |
Positive |
Positive |
|
Investor Sentiment and Security |
· We anticipate a high foreign interest in the equities market in 2026, driven by the improved Kenya's macroeconomic conditions, despite the occasional political instability · Additionally, we believe there are still opportunities for value in the equities market, despite NASI being fairly valued, it is currently trading below its historical average. |
Neutral |
Neutral |
Out of the four metrics that we track, two have a “positive” and two have “neutral” outlook. Compared to 2025, we have maintained our positive outlook on the valuations of the market. In consideration of the above, we have a ‘’BULLISH” outlook on the Kenyan Equities market in the short term, with the expectations of improved growth in corporate earnings and the cheap valuations currently in the market and “NEUTRAL” in the medium to long term.
Weekly market performance
During the week, the equities market was on an upward trajectory, with NASI gaining the most by 1.0%, while NSE 20, NSE 25 and NSE 10 gained by 0.7%, 0.7% and 0.6% respectively taking the YTD performance to gains of 3.7%, 3.5%, 3.1% and 3.0% of NSE 20, NASI, NSE 25 and NSE 10 respectively. The equities market performance was mainly driven by gains recorded by large cap stocks such as Cooperative Bank, Safaricom and DTBK of 3.9%, 2.1% and 1.3% respectively. However, the performance was weighed down by losses recorded by large cap stocks such as EABL and Equity of 2.2% and 0.7% respectively;
Also, during the week, the banking sector index gained by 0.9% to 213.6 from 211.7 recorded the previous week. This is attributable to gains recorded by stocks such as Cooperative Bank, DTBK and SCBK of 3.9%, 1.3% and 1.1% respectively. However, the performance was weighed down by losses recorded by stocks such as Equity of 0.7%;
During the week, equities turnover decreased by 19.3% to USD 21.8 mn from USD 27.1 mn recorded the previous week, taking the YTD total turnover to USD 49.7 mn. Foreign investors became net sellers for the first time in three weeks with a net selling position of USD 8.6 mn, from a net buying position of USD 0.5 mn recorded the previous week, taking the YTD foreign net selling position to USD 8.1 mn, compared to a net selling position of USD 92.9 mn recorded in 2025.
The market is currently trading at a price to earnings ratio (P/E) of 7.8x, 31.5% below the historical average of 11.3x. The dividend yield stands at 5.1%, 0.4% points above the historical average of 4.7%. Key to note, NASI’s PEG ratio currently stands at 1.0x, an indication that the market is fairly valued relative to its future growth. A PEG ratio greater than 1.0x indicates the market may be overvalued while a PEG ratio less than 1.0x indicates that the market is undervalued.
The charts below indicate the historical P/E and dividend yields of the market;
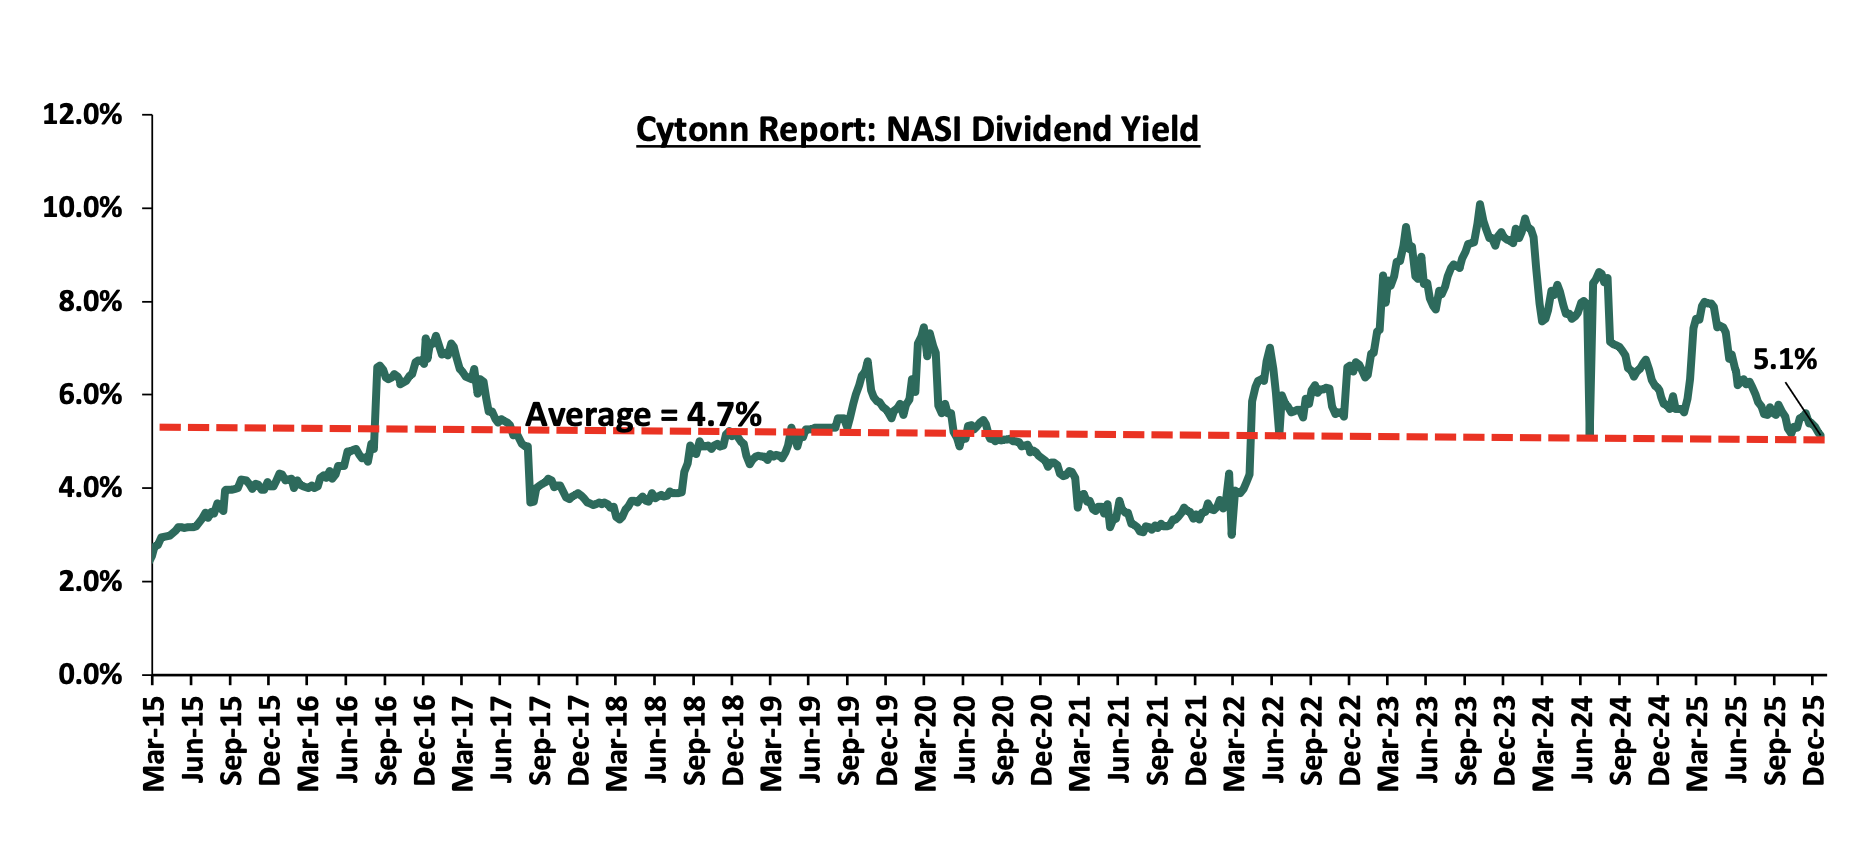
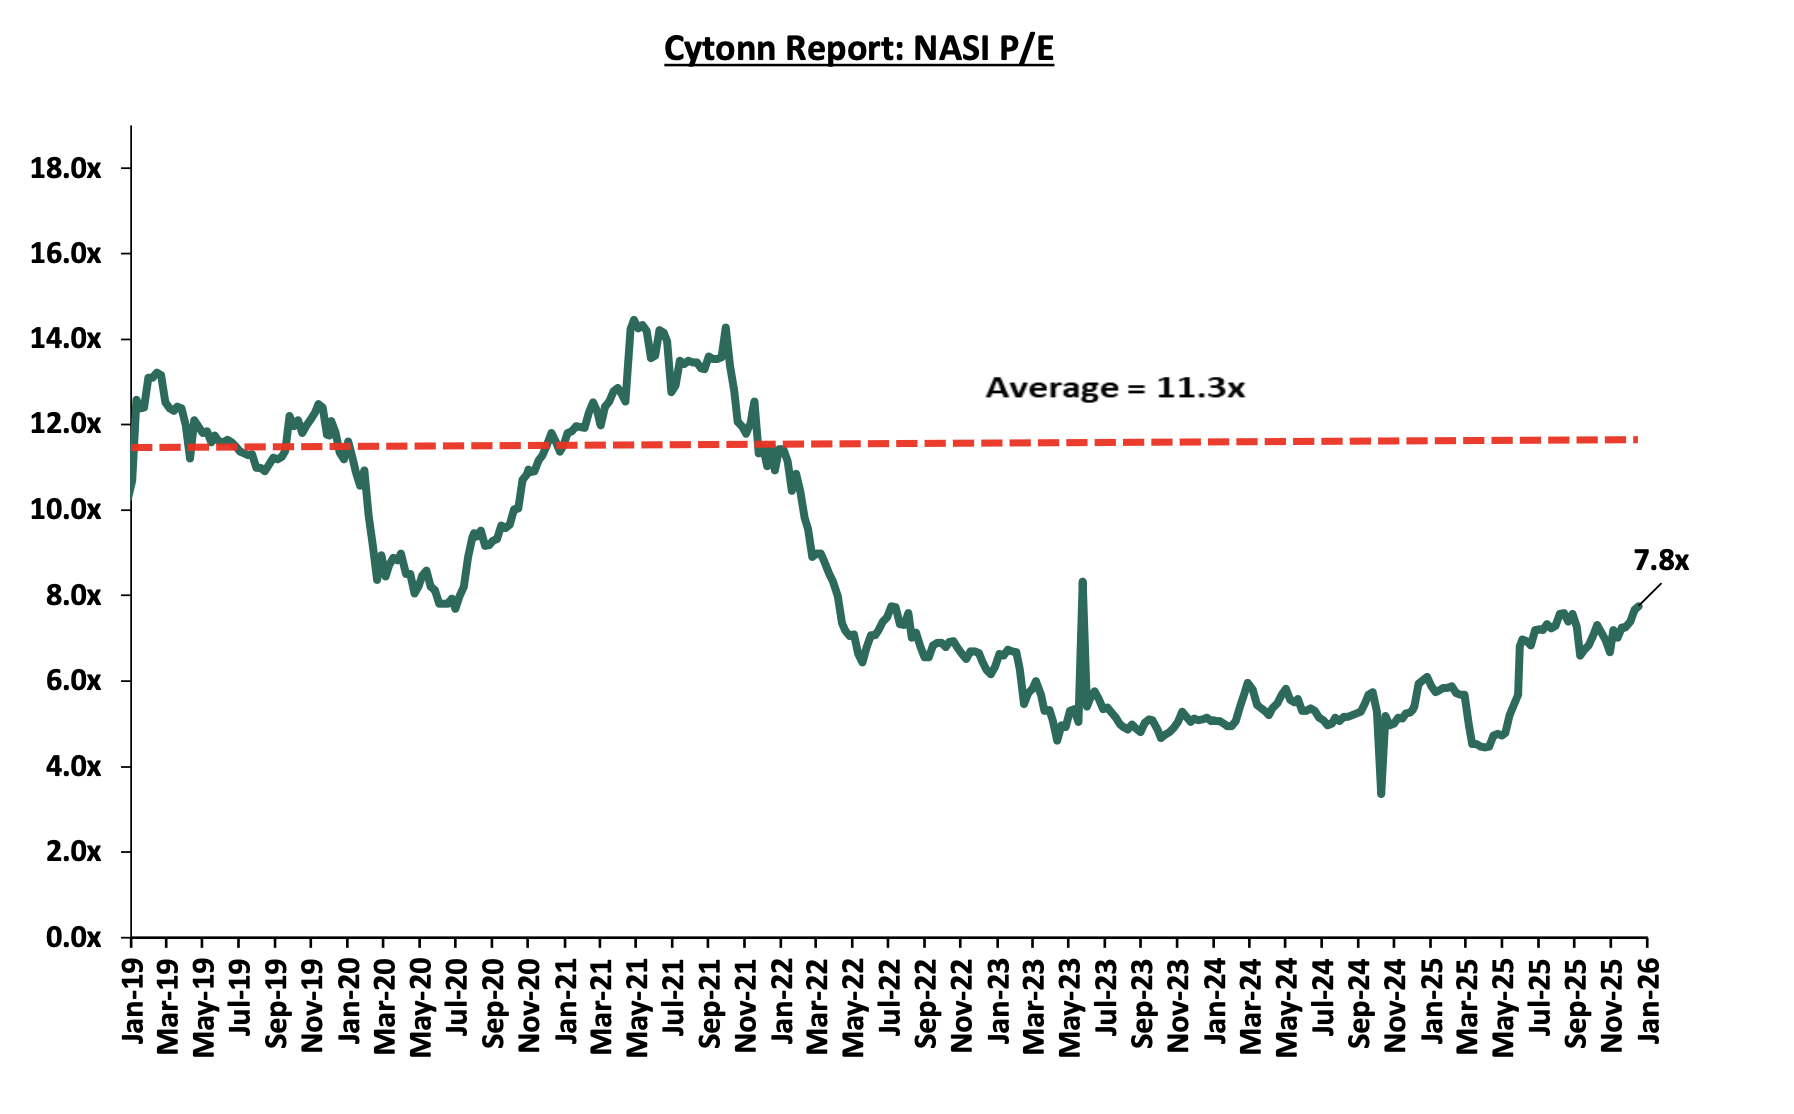
Universe of Coverage:
|
Cytonn Report: Equities Universe of Coverage |
|||||||||||
|
Company |
Price as at 9/1/2026 |
Price as at 16/1/2026 |
w/w change |
YTD Change |
Year Open 2026 |
Target Price* |
Dividend Yield |
Upside/ Downside** |
P/TBv Multiple |
Recommendation |
|
|
Standard Chartered Bank |
305.8 |
309.3 |
1.1% |
3.2% |
299.8 |
354.6 |
14.6% |
29.2% |
1.8x |
Buy |
|
|
I&M Group |
44.9 |
45.0 |
0.1% |
5.0% |
42.8 |
53.1 |
6.7% |
24.8% |
0.8x |
Buy |
|
|
Co-op Bank |
26.0 |
27.0 |
3.9% |
12.8% |
23.9 |
31.5 |
5.6% |
22.4% |
1.0x |
Buy |
|
|
NCBA |
89.0 |
90.0 |
1.1% |
5.9% |
85.0 |
101.3 |
6.1% |
18.7% |
1.5x |
Accumulate |
|
|
ABSA Bank |
25.6 |
25.8 |
0.8% |
3.6% |
24.9 |
28.3 |
6.8% |
16.7% |
1.7x |
Accumulate |
|
|
Diamond Trust Bank |
116.5 |
118.0 |
1.3% |
2.8% |
114.8 |
129.4 |
5.9% |
15.6% |
0.4x |
Accumulate |
|
|
Equity Group |
69.5 |
69.0 |
(0.7%) |
3.0% |
67.0 |
75.2 |
6.2% |
15.1% |
1.2x |
Accumulate |
|
|
Stanbic Holdings |
197.8 |
200.0 |
1.1% |
1.1% |
197.8 |
205.5 |
10.4% |
13.1% |
1.2x |
Accumulate |
|
|
Jubilee Holdings |
345.8 |
334.8 |
(3.2%) |
3.8% |
322.5 |
354.3 |
4.0% |
9.9% |
0.5x |
Hold |
|
|
KCB Group |
67.0 |
67.5 |
0.7% |
2.7% |
65.8 |
71.0 |
4.4% |
9.6% |
0.8x |
Hold |
|
|
CIC Group |
4.6 |
4.6 |
1.5% |
2.0% |
4.5 |
4.8 |
2.8% |
5.4% |
1.3x |
Hold |
|
|
Britam |
9.2 |
9.3 |
0.9% |
2.9% |
9.1 |
9.5 |
0.0% |
2.1% |
0.9x |
Lighten |
|
|
*Target Price as per Cytonn Analyst estimates **Upside/ (Downside) is adjusted for Dividend Yield ***Dividend Yield is calculated using FY’2024 Dividends |
|
||||||||||
We have a ‘’BULLISH” outlook on the Kenyan Equities market in the short term, with the expectations of improved growth in corporate earnings and the cheap valuations currently in the market and “NEUTRAL” in the medium to long term. With the market currently trading at par to its future growth (PEG Ratio at 1.0x), we believe that investors should reposition towards value stocks with strong earnings growth and that are trading at discounts to their intrinsic value.
In 2025, the general Real Estate sector continued to witness considerable growth in activity in terms of property transactions and development activities. Consequently, the sector’s activity contribution to Gross Domestic Product (GDP) grew by 5.0 % to Kshs 298.1 bn in Q3’2025, from Kshs 283.8 bn recorded during the same period in 2024. In addition, the sector contributed 10.4% to the country’s GDP, 0.4% points decrease from 10.8% recorded in Q3’2024. Cumulatively, the Real Estate and construction sectors contributed 8.6% to GDP, 0.2% points decrease from 8.8% in Q3’2024, contributable to decline in construction contribution to GDP by 0.2% points, to 5.5% in Q3’2025, from 5.7% recorded in Q3’2024. The graph below highlights the Real Estate and Construction sectors’ contribution to GDP from 2020 to Q3’2025;
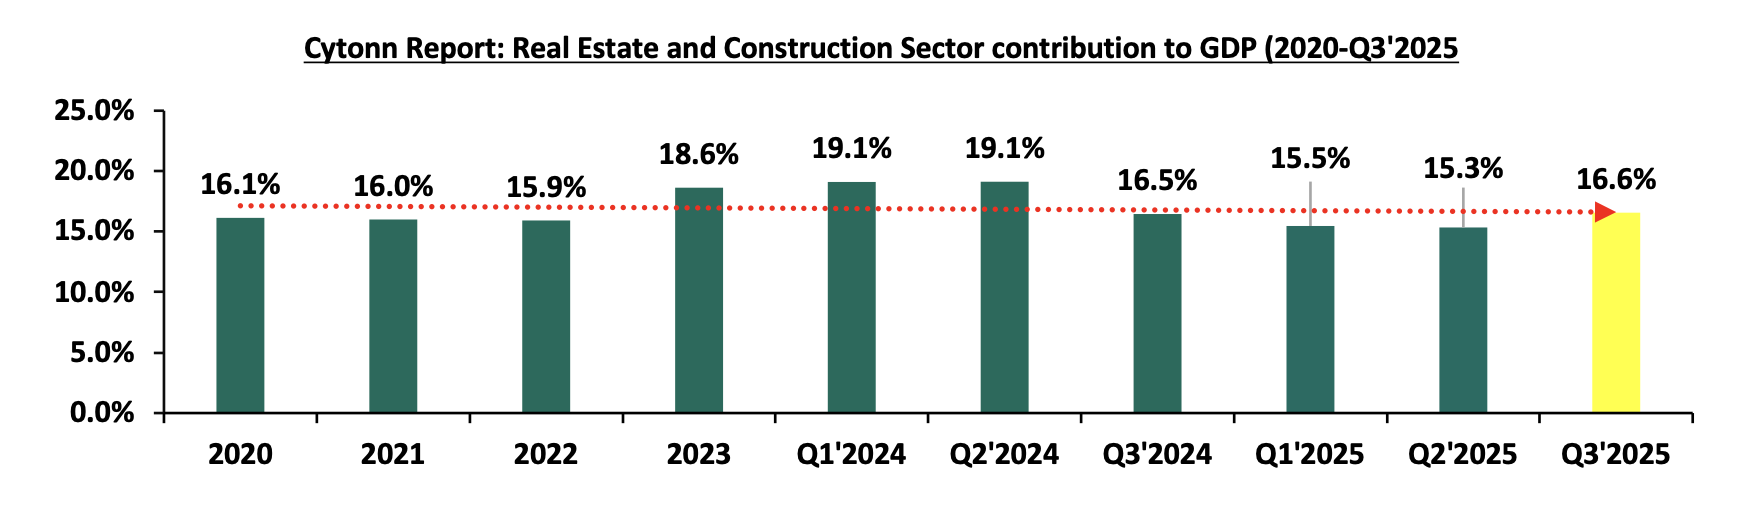
Source: Kenya National Bureau of Statistics (KNBS)
In terms of performance the NMA residential sector recorded a marginal increase in performance, with the average total returns to investors coming in at 6.6%, a 0.8%-point increase from 5.8% recorded in FY’2024. The performance was attributed to an increase in the residential average y/y price appreciation which came in at 0.8% in FY’2025, 0.4%-points higher than the 0.4% appreciation recorded in FY’2024, driven by increased property transactions during the year. On the other hand, the average rental yield came in at 5.9% in FY’2025, recording a 0.5%-points increase from the 5.4% rental yield recorded in FY’2024. This was driven by an increase in the average rent per SQM by 9.7% to Kshs 622, from Kshs 567 recorded in FY’2024. The table below shows the annual Real Estate rental yields for existing properties in all the sectors from FY’2020 to FY’2025;
|
Cytonn Report: Annual Real Estate Rental Yields Summary Table, for Existing Properties |
|||||||
|
|
FY’2020 |
FY’2021 |
FY’2022 |
FY’2023 |
FY’2024 |
FY’2025 |
Y/Y Change (% Points) |
|
Average Rental Yield |
6.1% |
6.5% |
6.8% |
6.1% |
7.5% |
7.8% |
0.3% |
Source: Cytonn Research
We retain a NEUTRAL outlook for the overall Kenyan Real Estate sector in 2026, as market performance is expected to be supported by several structural and cyclical factors, including: i) steadily growing demand for real estate driven by Kenya’s favourable demographics and rapid urbanisation, ii) the government’s continued focus on the delivery of affordable housing under the Affordable Housing Programme, iii) ongoing initiation and implementation of key infrastructure projects that are opening up new investment nodes and supporting property values, iv) improved investor confidence in the hospitality sector supported by continued recovery in tourism and rising international arrivals, v) sustained efforts by the government through the Kenya Mortgage Refinance Company (KMRC) to enhance access to affordable home financing, vi) aggressive expansion by both local and international retailers in select, well-performing nodes, and vii) Kenya’s continued positioning as a regional business and investment hub, which continues to attract foreign capital inflows. However, the sector’s performance in 2026 is expected to be constrained by elevated construction costs, persistent oversupply in the commercial office and retail segments, slower-than-anticipated delivery of affordable housing units, travel advisories issued by several countries affecting tourism sentiment, a challenging business environment, and subdued investor appetite for Real Estate Investment Trusts (REITs), which continues to limit capital market participation in the sector
For a detailed review of the sector’s performance during 2025, see our Cytonn Annual Markets Review – 2025.
In 2026, we expect the key drivers of Real Estate to be as follows:
- Government’s continued focus on Affordable Housing: the Kenyan government has sustained its strong commitment to the Affordable Housing Program (AHP), a key pillar under the Bottom-Up Economic Transformation Agenda (BETA). According to the Architectural Association of Kenya’s (AAK) Status of the Built Environment Report 2025, there are 307 ongoing projects across the country, comprising 214,057 housing units. Of these, 77.0% are Affordable Housing Programme units, 10.0% are student housing, 7.0% are institutional staff housing and 6.0% are private projects benefitting from VAT exemptions. The program continues to gain momentum following the operationalization of the Affordable Housing Act, 2024, which introduced the Affordable Housing Levy, a dedicated funding mechanism now actively supporting project financing. The government has also expanded collaborations with county governments and private developers to unlock land and fast-track approvals, further accelerating housing delivery across the country;
- Infrastructural development: Kenya sustained momentum in infrastructure development, with focus shifting to ongoing government and public-private partnership (PPP) projects aimed at improving connectivity and supporting Real Estate activity. Key highlights in the quarter included progress on Phase II of the Dongo Kundu Bypass, particularly works on the Mwache and Mteza bridges, and continued upgrades of road networks under the Kenya Urban Roads Authority (KURA) in Nairobi and other urban centres. Additionally, reports pointed to new disbursements under the Roads Annuity Program and ongoing construction under the Affordable Housing supporting infrastructure initiative, which includes feeder roads, water and sewer systems in housing project sites. These developments underline the state’s prioritization of infrastructure as a catalyst for economic growth, even as challenges such as high construction costs and delayed contractor payments remain constraints to faster implementation,
- Provision of affordable mortgage financing: Kenya Mortgage Refinance Company (KMRC) has continued to play a critical role in expanding access to affordable housing finance by offering single- digit fixed-rate, long-term refinancing to Primary Mortgage Lenders (PMLs) such as banks, SACCOs, and microfinance institutions. In Q3’2025, KMRC advanced the implementation of its widened eligibility framework to include non-shareholder SACCOs and microfinance banks, aimed at enabling more institutions to offer low-cost mortgages to underserved segments, particularly low- and middle- income earners. This initiative aligns with the government’s affordable housing agenda by enhancing the availability of sustainable mortgage products. KMRC also sustained its capital-raising efforts through bond issuances to support continued liquidity for mortgage lenders, reinforcing its mandate to deepen Kenya’s mortgage market;
- Aggressive expansion pursued by retailers: The retail landscape has seen a surge in growth, with both domestic and international retailers like Naivas, QuickMart, China Square, Panda Mart, and Carrefour aggressively expanding their market presence. These retailers are capitalizing on the opportunities created by the exit of distressed chains like Choppies, Nakumatt, Tuskys, and Uchumi,
- Kenya’s recognition as a regional business hub: Kenya continues to enjoy recognition as a regional business hub. As a result, foreign entities have continued to open business operations in Kenya, boosting the demand for both commercial and residential Real Estate. Increased business activity has driven up demand for office space, apartments, and housing near business hubs, leading to the development of new projects, increased property values, and job creation in the construction sector,
- Positive Demographics: with relatively high urbanization and population growth rates of 3.7% p.a and 2.0% p.a, respectively, against the global average of 1.7% p.a and 1.0% p.a, respectively, as at 2024, there is a sustained demand for more housing units in the country,
- Increasing Investor Confidence: Increase in investor confidence has greatly influenced hospitality sector and this is evident through mergers, acquisitions and expansions of hotels. Furthermore, Kenya National Bureau of Statistics’ Leading Economic Indicators – September 2025 report highlighted that arrivals through Jomo Kenyatta International Airport (JKIA) and Moi International Airport (MIA) registered an increase of 52.2% to 745,720 visitors in Q3’2025 from 489,831 visitors recorded in Q3’2024. Notably, the Hotel Chain Development Pipelines in Africa 2025 Report ranked Nairobi at 6thposition by planned number rooms with 26 hotels and 4,344 rooms in the pipeline,
- Special Built Developments: There has been an increased popularity of purpose-built properties to host Student housing, medical centers, Diplomatic residentials, data centers which offer potential for growth to the Real Estate sector through alternative markets. Due to these assets classes, the industry remains resilient despite the rapidly changing technological and economic environments, and,
Despite the above drivers, the sector’s optimal performance is expected to be hampered by the following factors in 2026:
- Existing oversupply of physical space in select sectors: With approximately 5.7 mn SQFT in the NMA commercial office market, approximately 0 mn SQFT in the Nairobi Metropolitan Area (NMA) retail market, with the rest of the Kenyan retail market having an oversupply of approximately 1.7 mn SQFT. This has led to prolonged vacancy rates in the respective Real Estate sectoral themes,
- Subdued REITs Market: The REITs market in Kenya continues to be subdued owing to various challenges such as the large capital requirements of Kshs 100.0 mn for trustees compared to Kshs. 10 mn for pension fund Trustees, which limits the role to banks, prolonged approval process for REITs, only a few legal entities capable of incorporating REITs, high minimum subscription amounts or offer parcels set at Kshs 1 mn for D-REITs and 5.0 mn for restricted I-REITs and lack of adequate knowledge of the financial asset class by investors,
- Constrained financing to developers: Financing for real estate developers remains constrained due to elevated borrowing costs and increased lending caution, with lenders demanding more collateral given the heightened credit risk in the Recent data points to a worsening of overall bank asset quality: the gross non-performing loans (NPL) ratio in the banking sector worsened to 17.6% by June 2025, up from 17.4% in March 2025. Among listed banks, the weighted average NPL ratio also deteriorated, rising to 14.0% in Q1’2025 from 13.5% a in 2024. Elevated non-performing loans squeeze banks’ capacity to extend credit, tighten lending standards and heighten risk perceptions, all of which exacerbate financing constraints for real estate developers.
- Construction Costs: Construction costs in Kenya showed modest growth in Q3’2025, supported by relatively stable input prices and subdued inflation of 7% y/y. According to the KNBS Q3’2025 Construction Input Price Indices report, the Building Cost Index (BCI) rose to 121.3, up from 119.3 in Q2’2025, representing a 1.7% quarter-on-quarter increase. The increase was driven by higher prices for steel, reinforced bars, sand, ballast, and roofing materials, while some inputs such as cement and timber recorded slight declines. Overall, the data indicate a moderation in construction cost growth compared to previous periods, although developers continue to face upward pressure on select materials, highlighting ongoing cost considerations for real estate projects.
- Underdeveloped capital markets: It is difficult to develop pools of capital focused on projects, particularly in the private markets, to supplement government efforts in providing housing. Banks in Kenya are the primary source of funding for real estate developers, providing nearly 95.0% of funding as opposed to 40.0% in developed countries. This means that capital markets contribute only 5.0% of Real Estate development funding, compared to 60.0% in developed countries as shown below;
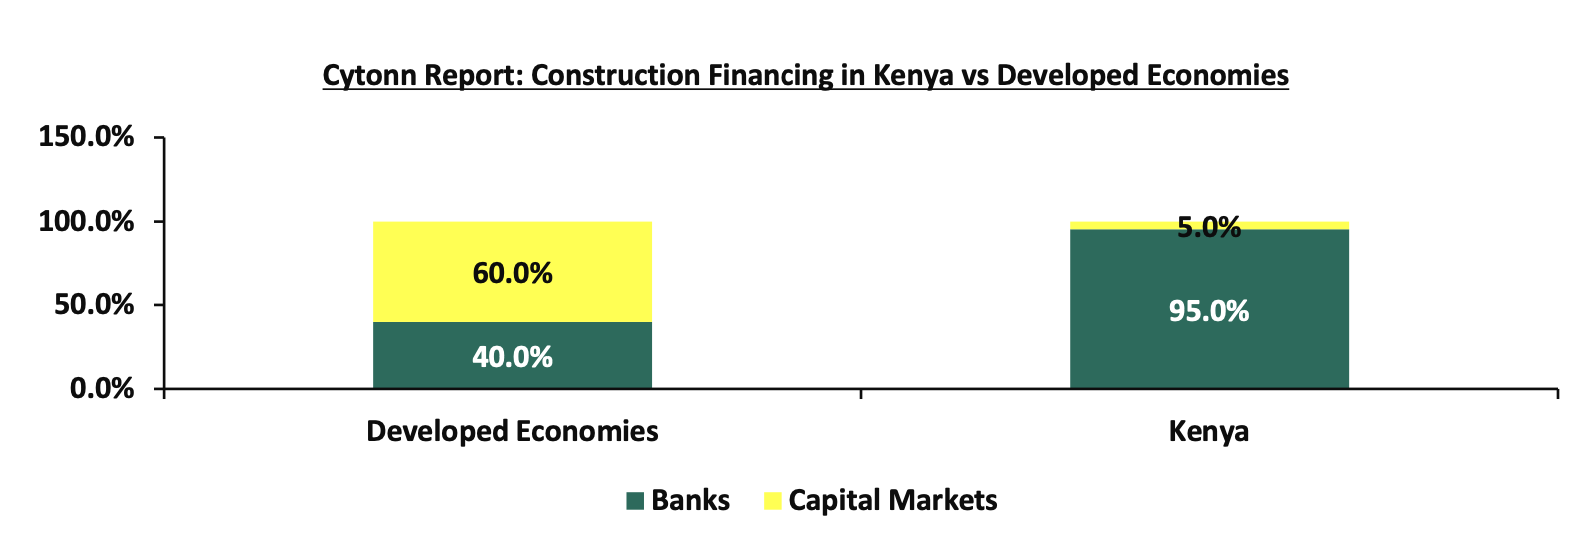
Source: World Bank, Capital Markets Authority
The table below summarizes our outlook on the various Real Estate themes and the possible impact on the business environment in 2026;
Thematic Performance Review and Outlook
|
Cytonn Report: Thematic Performance Review and Outlook |
|
|||
|
Theme |
2025 Performance |
2026 Outlook |
2026 Effect |
2025 Outlook |
|
Residential Sector |
· The demand for housing is anticipated to remain strong in 2025, fueled by favorable population demographics. The government's increased focus on executing its affordable housing agenda is likely to stimulate further growth in the sector. Moreover, the expansion and development of infrastructure projects are expected to boost the sector, along with government initiatives to provide low-cost loans to Kenyans through the Kenya Mortgage Refinance Company (KMRC), which aims to improve homeownership opportunities. · Conversely, we expect the sector to be weighed down by the prevailing tough economic environment such as the low penetration of mortgages, soaring cost of building materials and land prices affecting construction cost in the long run · For detached units, investment opportunity lies in areas such as Kitengela, Ngong, and, South B&C, while for apartments, investment opportunity lies in Kahawa West, westlands and Dagorreti, due to their remarkable returns driven by relatively high returns to investors |
· Housing demand is expected to remain resilient in 2026, supported by Kenya’s favourable population demographics and continued urbanisation. The government’s sustained focus on implementing the Affordable Housing Programme is expected to support sector growth, while ongoing and planned infrastructure developments are likely to enhance accessibility and unlock new residential investment nodes. In addition, continued government initiatives through the Kenya Mortgage Refinance Company (KMRC) are expected to improve access to relatively affordable home financing, supporting homeownership over the medium term. · • However, sector performance in 2026 is expected to face headwinds from a challenging macroeconomic environment, characterized by low mortgage penetration, elevated interest rates, rising construction costs driven by high prices of building materials, and escalating land prices, which are expected to exert upward pressure on development costs and limit supply in the long term. · • In terms of investment opportunities in 2026, detached housing remains attractive in Kitengela, Ngong, and South B & C, supported by affordability and improving infrastructure, while apartments continue to offer relatively higher returns in Kahawa West, Westlands, and Dagoretti, driven by strong rental demand and favourable returns to investors.
|
Neutral |
|
|
Commercial Office Sector |
· In FY’2025, the average rental yields showed resilience with 0.02%-points increase, coming at 7.82% in FY’2025 from 7.80% in FY’2024. This is attributable to an increase in occupancy by 1.6% during the period under review. · The improvement in performance was mainly driven by; high number of Grade A offices which are highly preferred especially by multinational companies, high demand for quality offices by embassies, international organizations and multinational companies in prime areas that are have ease of access to the capital |
· We expect the sector to remain stable with a slight improvement by 0.2% in rental yields recorded in FY’2026, attributable to an expected increase in overall rental rates by 0.5% in FY’2026. The improved performance may be supported by; i) the increasing presence of multinational companies in Kenya is likely to drive up occupancy levels, ii) co-working spaces are gaining in popularity in the region iii) the gradual return to “working from office” after the Covid-19 pandemic, iv) more start-ups are expected to drive demand for commercial spaces, and v) a considerable uptake of prevailing commercial office spaces. However, the sector continues to face challenges due to a significant oversupply of office space, currently standing at 5.7 mn SQFT as at FY’2025. · Investment opportunity lies in areas such as Westlands, Gigiri, and Kilimani, which offer rental yields of 9.3%,8.5% and 8.2%, compared to the market average of 7.8%; |
Positive |
|
|
Retail Sector |
· The sector occupancy rates increased by 3.3% points to 85.5% in FY’2025, from 82.2% recorded in FY’2024. The average rental rates per SQFT surged by 0.8% to Kshs 183.5 in FY’2025 from the Kshs 182.5 recorded in FY’2024. The average rental yield for the NMA retail sector improved by 0.4% points to 8.8% in FY’2025, from 8.4% in FY’2024, as a result of improved asking rents and occupancy rates. · The improved performance was due to; i) aggressive growth strategies implemented by both domestic and international retailers such as Naivas, QuickMart, China square and Carrefour, and, ii) continuous demand for consumer goods and services supported by positive demographics, encouraging further expansions from current retailers, |
· We expect a slight increase in rental yields by 0.3% points due to rising rental costs for retail spaces and the aggressive expansion of retailers into new and previously occupied areas. Additionally, infrastructure developments that open up new investment opportunities, along with favorable demographics, are expected to bolster sector performance. However, challenges such as oversupply, the growing adoption of e-commerce, a challenging economic environment for businesses, and the presence of informal retail spaces are likely to undermine the sector's performance, ultimately impacting rental yields. · Investment opportunity lies in areas such as Westlands, Karen, and Kilimani which continue to record impressive returns. This is in addition to the undersupplied regions of the country such as Mount Kenya, western and the Coast |
Neutral |
Neutral |
|
Hospitality Sector |
· In 2025, serviced apartments’ year-on-year (y/y) performance improved, with the occupancy rates coming in at 74.7% in 2025, a 2.5%-points increase from the 72.2% recorded in 2024. The average monthly charges for 2025 increased by 6.7% to Kshs 3,366 per SQM from 3,155 recorded in 2024. Consequently, the average rental yield increased to 7.4% in 2025, 0.1% points increase from the 7.3% recorded in 2024.
· The sector’s overall performance improved attributable to increasing number of visitor arrivals in the country by 52.2% to 745,720 visitors in Q3’2025 from 489,831 visitors recorded in Q3’2024, which increased the number of hotels in operation, hotel bookings and bed occupancies during the year, in addition to aggressive local and international marketing of Kenya’s tourism industry |
· We expect the sector to continue registering improved performance moving forward in terms of overall hotels in operation, hotel bookings, and hotel occupancies supported by; i) aggressive marketing campaigns promoting Kenya’s tourism, expected to boost tourist arrivals and improve occupancy rates at hospitality venues, ii) continued international recognition of Kenya’s tourism industry, enhancing its status as a leading tourist destination and drawing more global visitors, iii) strategic partnerships within the tourism sector, fostering innovation and collaboration to capitalize on new opportunities, iv) events and initiatives aimed at increasing tourism activity and improving guest experiences. · However, while the sector demonstrated resilience in its overall performance in 2025, the outlook remains cautiously optimistic due to i) Kenya continues to face significant competition from neighboring markets, such as Rwanda, which employs aggressive promotional strategies, alongside Zanzibar, Tanzania, and South Africa, these regions actively position themselves as attractive alternatives, challenging Kenya's market share in the region, ii) difficulty in accessing finance as lenders demand more collateral to cushion themselves owing to elevated credit risk, and iii) occasional release of cautionary statements by governments like Australia to their citizens advising them against travelling to Kenya due to threats like terrorism and elevated crime rates; · Prime investment prospects lie in Westlands, Limuru Road, and Kilimani, where average rental yields stood at 11.4%, 9.2%, and 8.6%, respectively, surpassing the market average of 7.4% in 2024. This was due to their proximity to the CBD, the existence of top-tier serviced apartments commanding premium rates, convenient accessibility, and their closeness to international organizations, fostering a robust demand for serviced apartments in these areas |
Positive |
|
|
Land Sector |
· The land sector in Nairobi Metropolitan Area (NMA) recorded a price appreciation of 3.4% to Kshs 136.7 mn from 132.9 mn. · Unserviced land in the satellite towns of Nairobi recorded an average YoY capital price appreciation of 3.3%, with average asking prices coming in at Kshs 17.6 mn in FY’2024/25, from the Kshs 17.0 mn recorded in FY’2023/24. Additionally, the performance grew by a 14-year average CAGR of 12.4%, to average asking prices of Kshs 17.6 mn in FY’2024/25 from the Kshs 3.6 mn recorded in 2011 · The performance was supported by; i) Ongoing and planned infrastructure improvements, such as the Western, South and Eastern bypass, commuter railways and other utilities have made satellite towns more accessible and appealing for investment, and, ii) Investors looking for capital gains have been buying land in these towns, anticipating future appreciation as the areas develop and urbanize. |
· We maintain a POSITIVE outlook for the land sector in the Nairobi Metropolitan Area (NMA), considering it a dependable investment opportunity that has shown improving performance year on year. Going forward, we expect the sector's performance to be driven by several factors: i) Increased infrastructure developments which has improved and opened up areas for investment, ii) Roll out of numerous affordable housing projects by both the public and private sectors, iii) Affordability of land in the satellite towns, iv) Limited supply of land especially in urban areas which has contributed to exorbitant prices, and, v) Positive demographics driving demand for land upwards, facilitated by high population growth and urbanization rates of 2.0% p.a and 3.7% p.a, respectively against the global averages 1.0% p.a and 1.7% p.a, respectively. · The investment opportunity lies in Juja, Limuru and Utawala for unserviced land, which recorded annualized capital appreciations of 5.0%, 3.2% and 4.6% respectively compared to market average of 3.3%. For serviced land, Syokimau Ruiru&Juja and Athiriver recorded the highest annualized capital appreciations of 4.3% 4.0% and 3.6%, respectively against the serviced average of 3.0%; |
Positive |
|
|
Infrastructure Sector |
· The government continued to make considerable efforts in advancing infrastructural developments across the country amid focus on achieving the Vision 2030 and Big Four Agenda. · In the FY’2025/26, the total budget allocation for infrastructure, energy and ICT stood at a substantial Kshs 535.6bn, recording a 12.2% increase from the Kshs 477.2bn recorded for the preceding FY’2024/25. · Some of the key projects implemented in 2025; Miritini Meter Gauge Railway (MGR) Station and Makupa Causeway bridge among other several notable projects.. |
· In 2026, We anticipate the government will continue with its aggressive efforts to; i) construct and rehabilitate roads, bridges, railways, airports, and affordable housing units, among others, ii) increase its diplomacy and partnerships in development among neighbouring nations, and, iii) step up on the competition for attracting regional and international investors against other countries in Eastern Africa like Tanzania through railway connections and ports infrastructure. · However, the sector may face challenges such as fiscal constraints, execution delays, land disputes, cost overruns, and climate risks. Although the government acknowledges the importance of Public-Private Partnerships (PPPs) in tackling financing challenges, we believe that prioritizing PPPs is fundamental in addressing funding shortfalls. By leveraging the resources and expertise of the private sector, PPPs can support sustainable infrastructure development and stimulate economic growth. · |
Positive
|
|
|
Industrial Sector |
· In 2025, the Nairobi Metropolitan Area has been on the front line and a major contributor to the Industrial Real Estate Sector accounting for approximately 90.0% of the country’s industrial space. It is known for its high concentration of industrial projects in areas like Nairobi, Kiambu, Machakos and Kajiado; with Nairobi County holding the largest share at 66.0%, largely due to its status as the capital city. Kiambu follows, housing key industrial investments such as Tatu City, Nairobi Gate Industrial Park (NGIP), Tilisi, and Northlands City. These areas have attracted major industrial projects like Africa Logistics Property (ALP) West in Tilisi and ALP North in Tatu City, bolstering Kiambu’s market share. The growth in the area has been driven by several factors such as the surge in e-commerce, demand for high-quality facilities, favorable demographics, enhanced infrastructure, government-led initiatives aligned with Vision 2030 and Nairobi’s role as East Africa’s business hub which has attracted foreign investments.
|
· In 2026, we expect a slight increase in development activities in the industrial sector through government support in line with its Bottom Up Economic Transformation Agenda (BETA) which aims to tap into the manufacturing sector to create wealth, employment and reduce poverty levels among Kenyan citizens. However, optimal performance in this sector may be weighed down by factors like high development costs for industrial facilities, low technological adoption and inadequate infrastructure to support operation of these facilities. · In 2026, we expect the sector to continue on an upward trajectory driven by: i) the rising demand for data centers in the country, ii) an increasing demand for cold rooms, especially in the Nairobi Metropolitan Area, iii) demand for quality warehouses due to the growing e-commerce business in the country, iv) support from the government, as evidenced by the establishment of Special Economic Zones (SEZ) and Export Processing Zones (EPZ), v) increased development activities by industry players such as ALP Africa Logistics, vi) Kenya’s continued recognition as a regional hub, hence attracting international investors, and, vii) efforts by the government to support agricultural and horticultural products in the international market. viii) continued improvement in infrastructure through projects such as the Standard Gauge Railway (SGR), the Eastern and Northern Bypasses connecting Jomo Kenyatta International Airport (JKIA) and other regions in the Nairobi Metropolitan Area, among other key infrastructural improvements which we expect will increase the output of Special Economic Zones and Inland Container Depots (ICDs). |
Neutral |
Neutral |
|
Listed Real Estate |
· The underperformance of the Kenyan REIT sector is attributable to various factors such as; i) Insufficient understanding of the investment instrument among investors leading to a slower uptake of REIT products, ii) Lengthy approval processes for REIT creation, iii) High minimum capital requirements of Kshs 100.0 mn for REIT trustees compared to Kshs 10.0 mn for pension funds Trustees, essentially limiting the licensed REIT Trustee to banks only, iv) The rigidity of choice between either a D-REIT or and I-REIT forces managers to form two REITs, rather than having one Hybrid REIT that can allocate between development and income earning properties, v) Limiting the type of legal entity that can form a REIT to only a trust company, as opposed to allowing other entities such as partnerships, and companies, vi) We need to give time before REITS are required to list – they would be allowed to stay private for a few years before the requirement to list given that not all companies maybe comfortable with listing on day one, and, vii) Minimum subscription amounts or offer parcels set at Kshs 0.1 mn for D-REITs and Kshs 5.0 mn for restricted I-REITs. The significant capital requirements still make REITs relatively inaccessible to smaller retail investors compared to other investment vehicles like unit trusts or government bonds, all of which continue to limit the performance of Kenyan REITs. On the Unquoted Securities Platform, Acorn D-REIT and I-REIT traded at Kshs 27.4 and Kshs 23.2 per unit, respectively, as per the last updated data on 5th December 2025. The performance represented a 33.4% and 14.5% gain for the D-REIT and I-REIT, respectively, from the Kshs 20.0 inception price. The volumes traded for the D-REIT and I-REIT came in at Kshs 12.8 mn and Kshs 40.6 mn shares, respectively, with a turnover of Kshs 323.5 mn and Kshs 791.5 mn, respectively, since inception in February 2021. Additionally, ILAM Fahari I-REIT traded at Kshs 11.0 per share as of 5th December 2025, representing a45.0% loss from the Kshs 20.0 inception price. The volume traded to date came in at 1.2 mn shares for the I-REIT, with a turnover of Kshs 1.5 mn since inception in November 2015 |
· In 2026 we expect REITS to gain popularity as developers such as Africa Logistics Properties being licenced to offer an Industrial I-REIT by the Capital Market Authority. Centum Real Estate are looking forward to launch a dollar based Income REIT in 2026 and we expect that the dollar based I-REIT will: i) increase foreign investments by boosting investors’ confidence against local currency uncertainties, ,ii) dollar-denominated REITs provide an alternative for investors seeking more liquid and globally recognized investment options, iii) the dollar based move is likely to set a precedent for other players in the market, encouraging the development of more innovative and investor-centric financial products, and, iv) the fund could force policy regulatory framework improvement to ensure transparency and investments protection. · In addition, we expect the sector will continue to lag behind in comparison to other African countries such as South Africa, attributable to several challenges facing the sector such as; i) lack of sufficient investor awareness regarding the potential of REITs as an investment tool, ii) lengthy approval procedures for establishing REITs have hindered their formation and deployment in the market, iii) high minimum capital requirement of Kshs Kshs 100.0 mn for REIT trustees compared to Kshs 10.0 mn for pension funds Trustees, essentially limiting the licensed REIT Trustee to banks only,, and, iv) steep minimum subscription amounts or offer parcels set at Kshs 0.1 mn for D-REITs and Kshs 5.0 mn for restricted I-REITs. · However, we also expect the trend of strategic acquisitions to persist, with REITs actively seeking opportunities to broaden and diversify their portfolios, cater to evolving market demands and also set standards in promoting environmental sustainability such as execution of green bonds by Acorn holding. |
Neutral |
|
With 4 themes recording a positive outlook and 4 remaining neutral, the general outlook for the sector remains NEUTRAL. The sector’s performance is expected to be supported by: i) continued infrastructural development, ii) sustained government and private sector focus on affordable housing delivery, iii) increased emphasis on mortgage financing through the Kenya Mortgage Refinance Company (KMRC), iv) improving investor confidence supported by the ongoing recovery of the hospitality sector, v) aggressive expansion by both local and international retailers seeking to maintain and grow market presence, and vi) Kenya’s favourable demographic profile, which continues to drive housing demand. However, the sector’s performance is expected to be constrained by rising construction costs driven by inflation, limited access to financing for developers amid underdeveloped capital markets, oversupply in select real estate segments, and persistently low investor appetite for Real Estate Investment Trusts (REITs), which continue to weigh on overall sector performance.
For the detailed real estate market outlook report, see our Real Estate Sector 2026 Markets Outlook Note.
Key Highlights during the Week:
- Hospitality Sector
- Azamara Journey Cruise Ship Arrives at the Port of Mombasa
During the week, the Azamara Journey’s arrival followed previous cruise calls, including those by the SH Diana and Crystal Symphony, reflecting a growing trend of cruise tourism activity at the Port of Mombasa. According to government announcements, cruise tourism recorded a 140% surge in sea arrivals in 2024, contributing to a record Kshs 452.2 bn in tourism earnings, which signals strong momentum for the sector.
The rise in cruise ship calls has been supported by measures such as the introduction of a Multiple-Entry Electronic Travel Authorisation (ETA) system, which simplifies the entry process for cruise passengers and has been credited with encouraging higher numbers of international visitors. This week alone, the Port of Mombasa received more than 2,000.0 international tourists from consecutive cruise ship visits, underlining the growing importance of maritime tourism.
We expect increased cruise tourism activity to influence coastal markets by enhancing demand for hospitality‑oriented Real Estate assets, including hotels, serviced apartments, short‑term rentals, retail space, and tourism support services in and around Mombasa and neighbouring coastal towns. The consistent arrival of cruise ships helps diversify demand drivers and supports occupancy trends in the hospitality subsector, which can in turn influence investor confidence in coastal real estate developments.
- Infrastructure Sector
- Government Allocated Funds for Land Compensation Under SGR Naivasha–Malaba Extension
During the week, updates on the Naivasha–Malaba SGR project indicated progress in preparation for the extension, with funding arrangements and compensation processes advancing after feasibility and environmental studies were completed. The broader Naivasha–Kisumu–Malaba project, estimated to cost Kshs 645.7 bn aims to enhance regional connectivity, linking Kenya’s rail network to Uganda and beyond, and is positioned as a key component of East Africa’s transport infrastructure.
Land acquisition and compensation remain critical elements of the project’s early stages, with authorities engaging affected landowners and preparing for transparent compensation processes. While specific figures for this week’s allocation were not publicly detailed, the ongoing compensation efforts are part of broader preparatory work for the SGR extension’s construction phase, expected to begin in earnest in 2026.
We expect that major infrastructure initiatives like the SGR extension will typically influence land values and development activity along the corridor. Enhanced connectivity often leads to appreciation in land prices, increased interest from industrial and logistics developers, and higher demand for residential and commercial properties in towns such as Naivasha, Eldoret, Kisumu and Malaba as accessibility and transport efficiencies improve. These dynamics underscore the role of transport infrastructure in shaping real estate investment patterns across secondary cities and peri‑urban areas.
- Real Estate Investments Trusts (REITs)
On the Unquoted Securities Platform, Acorn D-REIT and I-REIT traded at Kshs 27.4 and Kshs 23.2 per unit, respectively, as per the last updated data on 5th December 2025. The performance represented a 33.4% and 14.5% gain for the D-REIT and I-REIT, respectively, from the Kshs 20.0 inception price. The volumes traded for the D-REIT and I-REIT came in at 12.8 mn and 41.2 mn shares, respectively, with a turnover of Kshs 323.5 mn and Kshs 791.5 mn, respectively, since inception in February 2021. Additionally, ILAM Fahari I-REIT traded at Kshs 11.0 per share as of 5th December 2025, representing a 45.0% loss from the Kshs 20.0 inception price. The volume traded to date came in at 1.2 mn shares for the I-REIT, with a turnover of Kshs 1.5 mn since inception in November 2015.
REITs offer various benefits, such as tax exemptions, diversified portfolios, and stable long-term profits. However, the ongoing decline in the performance of Kenyan REITs and the restructuring of their business portfolios are hindering significant previous investments. Additional general challenges include:
- Insufficient understanding of the investment instrument among investors leading to a slower uptake of REIT products,
- Lengthy approval processes for REIT creation,
- High minimum capital requirements of Kshs 100.0 mn for REIT trustees compared to Kshs 10.0 mn for pension funds Trustees, essentially limiting the licensed REIT Trustee to banks only
- The rigidity of choice between either a D-REIT or and I-REIT forces managers to form two REITs, rather than having one Hybrid REIT that can allocate between development and income earning properties
- Limiting the type of legal entity that can form a REIT to only a trust company, as opposed to allowing other entities such as partnerships, and companies,
- We need to give time before REITS are required to list – they would be allowed to stay private for a few years before the requirement to list given that not all companies maybe comfortable with listing on day one, and,
- Minimum subscription amounts or offer parcels set at Kshs 0.1 mn for D-REITs and Kshs 5.0 mn for restricted I-REITs. The significant capital requirements still make REITs relatively inaccessible to smaller retail investors compared to other investment vehicles like unit trusts or government bonds, all of which continue to limit the performance of Kenyan REITs.
We expect Kenya’s Real Estate sector to remain on an upward trajectory, supported by: i) an increase in the number of international arrivals in the hospitality sector, ii) the initiation and completion of major infrastructure projects, opening up areas for development, iii) demand for housing sustained by positive demographics, such as urbanization and population growth rates of 3.7% p.a and 2.0% p.a, respectively, against the global average of 1.7% p.a and 1.0% p.a, respectively, as at 2024, iv) activities by the government under the Affordable Housing Agenda (AHP), v) heightened activities by private players in the residential sector, and, vi) increased investment by local and international investors in the retail sector vii) increasing presence of multinationals and start-ups driving demand for commercial office spaces. However, challenges such as rising construction costs, strain on infrastructure development, high capital requirements for REITs, and existing oversupply in select Real Estate sectors will continue to hinder the sector’s optimal performance by limiting developments and investments.
|
Cytonn Report: Real Estate Outlook Summary for 2026 |
|
|
Real Estate Sector |
The overall outlook for the real estate sector is NEUTRAL, supported by; i) infrastructural development, ii) government and private sector focus on affordable housing, iii) focus on mortgage financing through the KMRC, iv) improved investor confidence amid recovery of the hospitality sector, v) aggressive expansion by both local and international retailers in a bid to maintain market dominance, and, vi) Kenya's positive demographics driving housing demand. |
Disclaimer: The views expressed in this publication are those of the writers where particulars are not warranted. This publication, which is in compliance with Section 2 of the Capital Markets Authority Act Cap 485A, is meant for general information only and is not a warranty, representation, advice or solicitation of any nature. Readers are advised in all circumstances to seek the advice of a registered investment advisor.

- Talk to us
- Kenya
- P.O Box 20695 - 00200, Nairobi, Kenya
- Cell +254709101200
- Tel +254709101200
- WhatsApp +254741676635
- United States
- +254709101200
- DOWNLOAD OUR APP
-


- Kenya
- 8th Floor, Pinetree Plaza, Kaburu Drive, Ngong Road, Nairobi, Kenya
- USA
- Suite 1150, 1775 Eye Street NW, USA, Washington DC 20006, USA
- Investments
- High Yield
- Private Equity
- Real Estate
- Real Estate
- RiverRun Estates
- Cytonn Towers
- The Ridge
- Taraji Heights
- The Alma