Cytonn Corporate Governance Report - 2018, & Cytonn Weekly #39/2018
By Cytonn Research Team, Oct 14, 2018
Executive Summary
Fixed Income
T-bills were under-subscribed during the week, with the overall subscription rate coming in at 63.7%, a decrease from 120.9% recorded the previous week. The yields on the 91-day and 364-day papers remained unchanged at 7.6% and 9.6%, respectively, while the yield on the 182-day paper declined by 10 bps to 8.5%, from 8.6% the previous week. According to the October 2018 Kenya Economic Update released by the World Bank during the week, Kenya's GDP growth is projected to rise to 5.7% in 2018, an upward revision by 0.2% points from 5.5% projected in the April 2018 Economic Update; and an improvement from the 4.9% growth Kenya recorded in 2017. This is expected to be supported by recovery in agriculture owing to favorable rains and stronger domestic demand, particularly from the recovery in private consumption and investment;
Equities
During the week, the equities market was on downward trend with NASI, NSE 20 and NSE 25 declining by 4.4%, 2.0% and 4.3%, respectively, taking their YTD performance to declines of 15.7%, 24.4% and 17.5%, respectively. The Central Bank of Kenya (CBK) released the Kenya Financial Sector Stability Report 2017, highlighting the stability of the banking sector over the period between January to December 2017
Private Equity
In the financial services sector, Filimbi Limited, an investment vehicle associated with investor Peter Munga, has reduced its investment in Britam Holdings to 18.9 mn shares, from 58.4 mn shares in the eight-months ended August 2018, implying that the investment vehicle sold 39.5 mn shares. Using the average share price for the last eight-months ended August 2018, which is Kshs 13.5 per share, the implied value of the sale transaction is Kshs 533.2 mn. In fundraising, AfricInvest’s FIVE (Financial Inclusion Vehicle) has announced its second close that brought in EUR 31.0 mn (Kshs 3.6 bn). The contributors for the second close include Norfund (the Norwegian Development Finance Institution), IFU, (the Danish investment fund for investing in Developing Countries), and the Central Bank of Kenya Pension Fund, bringing the total commitments into the FIVE Fund to EUR 61 mn (Kshs 7.1 bn)
Real Estate
According to Central Bank of Kenya’s Financial Stability Report 2017, banks and pension schemes were the leading sources of credit for the real estate sector in 2017, with funding from each increasing by 30.8% and 27.1%, respectively. In the hospitality sector, (i) international hotel group, Radisson Hotel Group is expected to open three more hotel brands in Kenya bringing its total local portfolio to five, and (ii) Kenya’s tourism and hospitality sector gained global recognition bagging several awards for the Leading Airline, Leading Beach Destination, Leading National Park, among others, during the World Travel Awards (WTA) held recently in Durban, South Africa. In the retail sector, local retailer, Naivas Supermarket, announced plans of shutting down one of its Kitengela branches following its recent launch of Lang’ata branch at Freedom Heights Mall;
Focus of the Week
With the “Code of Corporate Governance Practices for Issuers of Securities to the Public, 2015” by the Capital Markets Authority (CMA) having come into full effect in April 2018, listed companies in Kenya complied by improving their corporate governance reporting, and increasing their levels of disclosure compared to previous years. Having compiled this information and other corporate governance metrics, this week we rank the 47 listed companies with a market cap of above Kshs 1.0 bn, as at 31st July, 2018, on their corporate governance structure to arrive at a composite score, and provide an analysis of how compliance with the Code has improved the corporate governance and disclosures in these companies.
- Kevin Maina, Clerk of Works for Cytonn Real Estate, was on Njata TV to discuss real estate in Kenya and what Cytonn Real Estate offers. See Kevin Maina here;
- The Show Houses for The Ridge, our Kshs. 12 billion development in Ridgeways, will be open for viewing from October 27th, 2018. To subscribe, please register here;
- We continue to hold weekly workshops and site visits on how to build wealth through real estate investments. The weekly workshops and site visits target both investors looking to invest in real estate directly and those interested in high yield investment products to familiarize themselves with how we support our high yields. Watch progress videos and pictures of The Alma, Amara Ridge, The Ridge, and Taraji Heights. Key to note is that our cost of capital is priced off the loan markets, where all-in pricing ranges from 16.0% to 20.0%, and our yield on real estate developments ranges from 23.0% to 25.0%, hence our top-line gross spread is about 6.0%. If interested in attending the site visits, kindly register here;
- We continue to see very strong interest in our weekly Private Wealth Management Training (largely covering financial planning and structured products). The training is at no cost and is open only to pre-screened participants. We also continue to see institutions and investment groups interested in the training for their teams. The Wealth Management Training is run by the Cytonn Foundation under its financial literacy pillar. If interested in our Private Wealth Management Training for your employees or investment group, please get in touch with us through wmt@cytonn.com. To view the Wealth Management Training topics, click here;
- For recent news about the company, see our news section here;
- We have 10 investment-ready projects, offering attractive development and buyer targeted returns of around 23.0% to 25.0% p.a. See further details here: Summary of Investment-Ready Projects; and
- We continue to beef up the team with ongoing hires for Financial and Real Estate Advisors for our offices in Nairobi, Nakuru, Kisumu, and Nyeri. Visit the Careers section on our website to apply.
T-Bills & T-Bonds Primary Auction:
T-bills were under-subscribed during the week, with the overall subscription rate coming in at 63.7%, a decline from 120.9% recorded the previous week. The subdued uptake of T-bills this week was despite improved liquidity during the week, as evidenced by the declined interbank rate, which hit a 3-month low at 3.4% as at 9th October, 2018. We attribute the low uptake to investors eyeing the ongoing 15-year tenor primary bond sale that closes this coming week on 16th October 2018. The yields on the 91-day and 364-day papers remained unchanged at 7.6% and 9.6%, respectively, while the yield on the 182-day paper declined by 10 bps to 8.5%, from 8.6% the previous week. The acceptance rate for T-bills improved to 99.3%, from 80.8% the previous week, with the government accepting Kshs 15.2 bn of the Kshs 15.3 bn worth of bids received, against the Kshs 24.0 bn on offer. The subscription rate for the 91-day paper increased to 157.6%, from 98.5% the previous week, while the subscription rate for the 182-day and 364-day papers declined to 26.4% and 63.4%, from 65.4% and 185.3% recorded the previous week, respectively.
For the month of October, the Kenyan Government has issued a new bond; issue no FXD 2/2018/15, with 15.0-years to maturity, and a coupon rate of 12.75%. The government will be seeking to raise Kshs 40.0 bn for budgetary support. The issuing of the longer-term bond is in a bid to lengthen the average time to maturity for the Kenyan Government’s debt portfolio. The Central Bank of Kenya (CBK), in their Financial Sector Stability Report 2017, identified the continued shortening of debt maturities as posing potential rollover risks in the medium term if the trend is not reversed, having reduced to 4.1-years as at the end of 2017, from 4.5-years at the end of 2016, and highs of 8.9-years as at 2010. We are of the view that the continued issuance of medium to long-term domestic securities is well guided as lengthening the average maturity will reduce the pressures on the domestic debt market. The issuance of medium to long-term securities have however been having a lackluster performance, which we attribute to the saturation of long end offers, with the last relatively shorter paper with a 5-year tenor having been offered in March, leading to a relatively flat yield curve on the long-end. Given that the Treasury bonds with the same tenor are currently trading at a yield of 12.6%, we expect bids to come in at between 12.6% and 12.8%.
Liquidity:
The average interbank rate declined to 3.7%, from 5.4% the previous week, while the average volumes traded in the interbank market remained stable, increasing marginally by 1.0% to Kshs 14.3 bn, from Kshs 14.2 bn the previous week. The interbank rate, which hit a 3-month low at 3.4% as at 9th October, 2018, points to improved liquidity, which the CBK attributed to government payments.
Kenya Eurobonds:
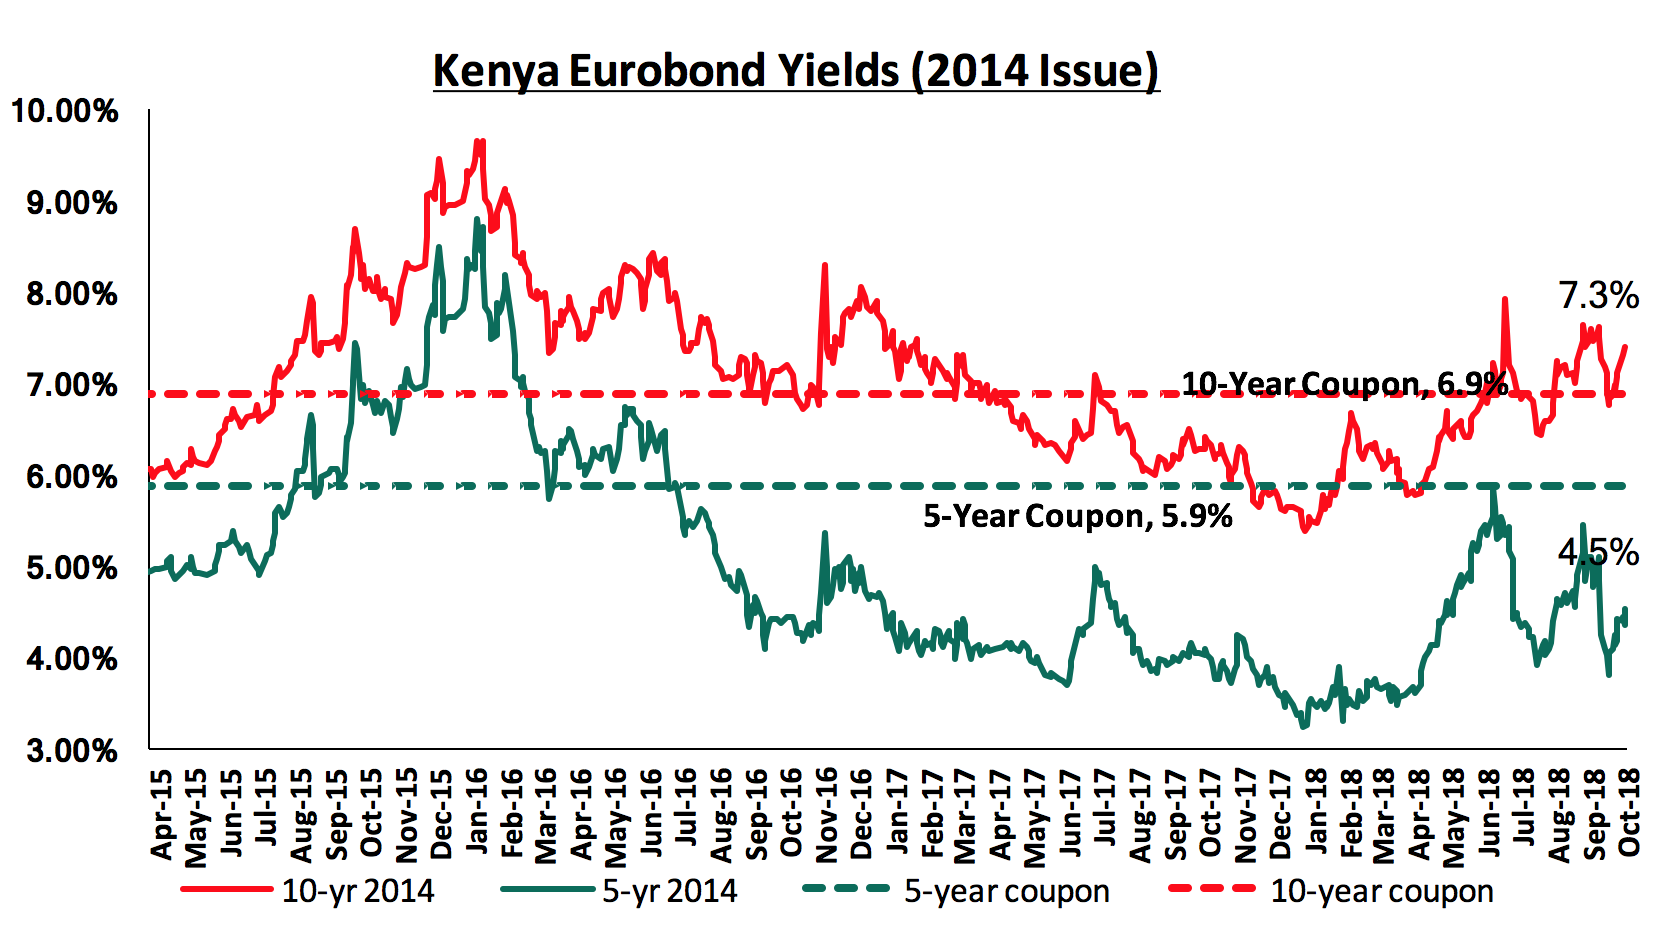
According to Bloomberg, the yields on the 10-year and 5-year Eurobonds issued in 2014 gained by 0.2% points and 0.1% points to 7.3% and 4.5% from 7.1% and 4.4%, the previous week, respectively. Since the mid-January 2016 peak, yields on the Kenyan Eurobonds have declined by 2.3% points and 4.3% points for the 5-year and 10-year Eurobonds, respectively, an indication of the relatively stable macroeconomic conditions in the country. Key to note is that these bonds have 0.7-years and 5.7-years to maturity for the 5-year and 10-year, respectively.
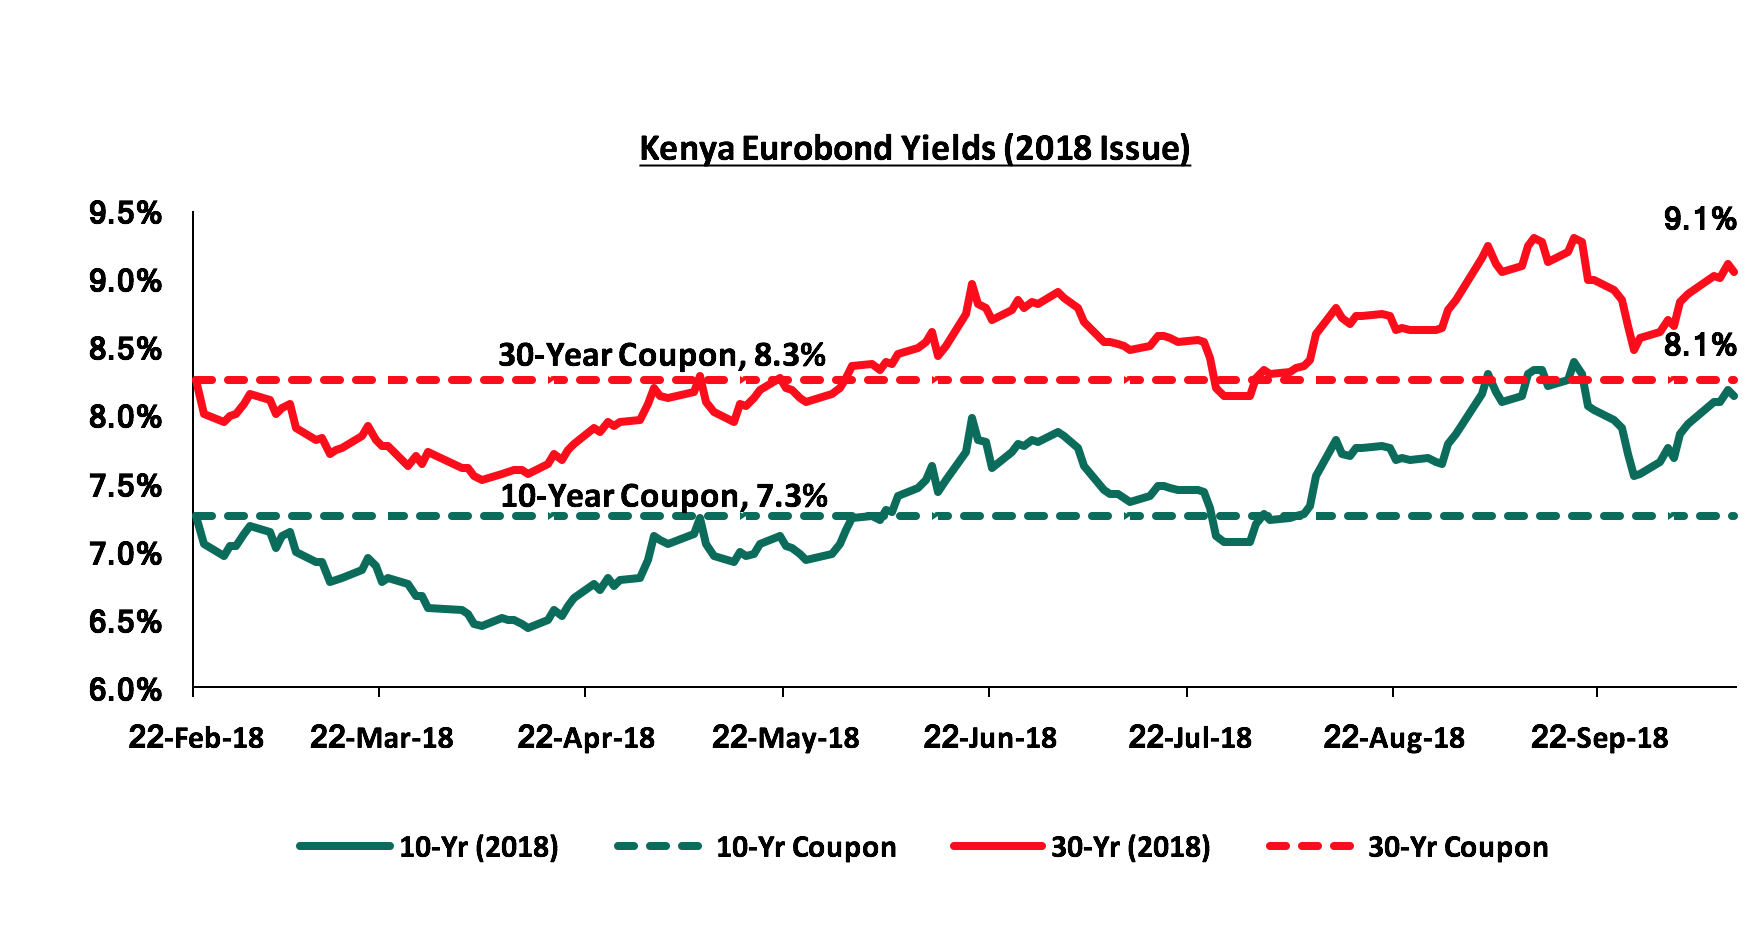
For the February 2018 Eurobond issue, during the week, the yields on both the 10-year and 30-year Eurobonds both gained by 0.2% points to 8.1% and 9.1% from 7.9% and 8.9%, the previous week, respectively. Since the issue date, the yields on the 10-year and 30-year Eurobonds have both increased by 0.9% and 0.8% points, respectively.
Kenya Shilling:
During the week, the Kenya Shilling remained stable against the US Dollar, gaining marginally by 0.03% from Kshs 101.0 to Kshs 100.9, supported by inflows from diaspora remittances and reduced dollar demand from importers, which is countering the excess liquidity in the money markets. The Kenya Shilling has appreciated by 2.2% year to date, and in our view the shilling should remain relatively stable to the dollar in the short term, supported by:
- The narrowing of the current account deficit to 5.8% in the 12-months to June 2018, from 6.3% in March 2018, attributed to improved agriculture exports, and lower capital goods imports following the completion of Phase I of the Standard Gauge Railway (SGR) project,
- Stronger inflows from principal exports, which include coffee, tea, and horticulture, which increased by 1.7% during the month of July to Kshs 24.7 bn, from Kshs 24.3 bn in June, with the exports from horticulture improving by 9.1%,
- Improving diaspora remittances, which increased by 71.9% y/y to USD 266.2 mn in June 2018 from USD 154.9 mn in June 2017 and by 4.9% m/m, from USD 253.7 mn in May 2018, with the largest contributor being North America at USD 130.1 mn, attributed to; (a) recovery of the global economy, (b) increased uptake of financial products by the diaspora due to financial services firms, particularly banks, targeting the diaspora, and (c) new partnerships between international money remittance providers and local commercial banks making the process more convenient, and,
- High levels of forex reserves, currently at USD 8.4 bn, equivalent to 5.6-months of import cover, compared to the one-year average of 5.4-months.
Highlights of the Week:
During the week, the World Bank released the Kenya Economic Update, October 2018. Below are the key take-outs from the report:
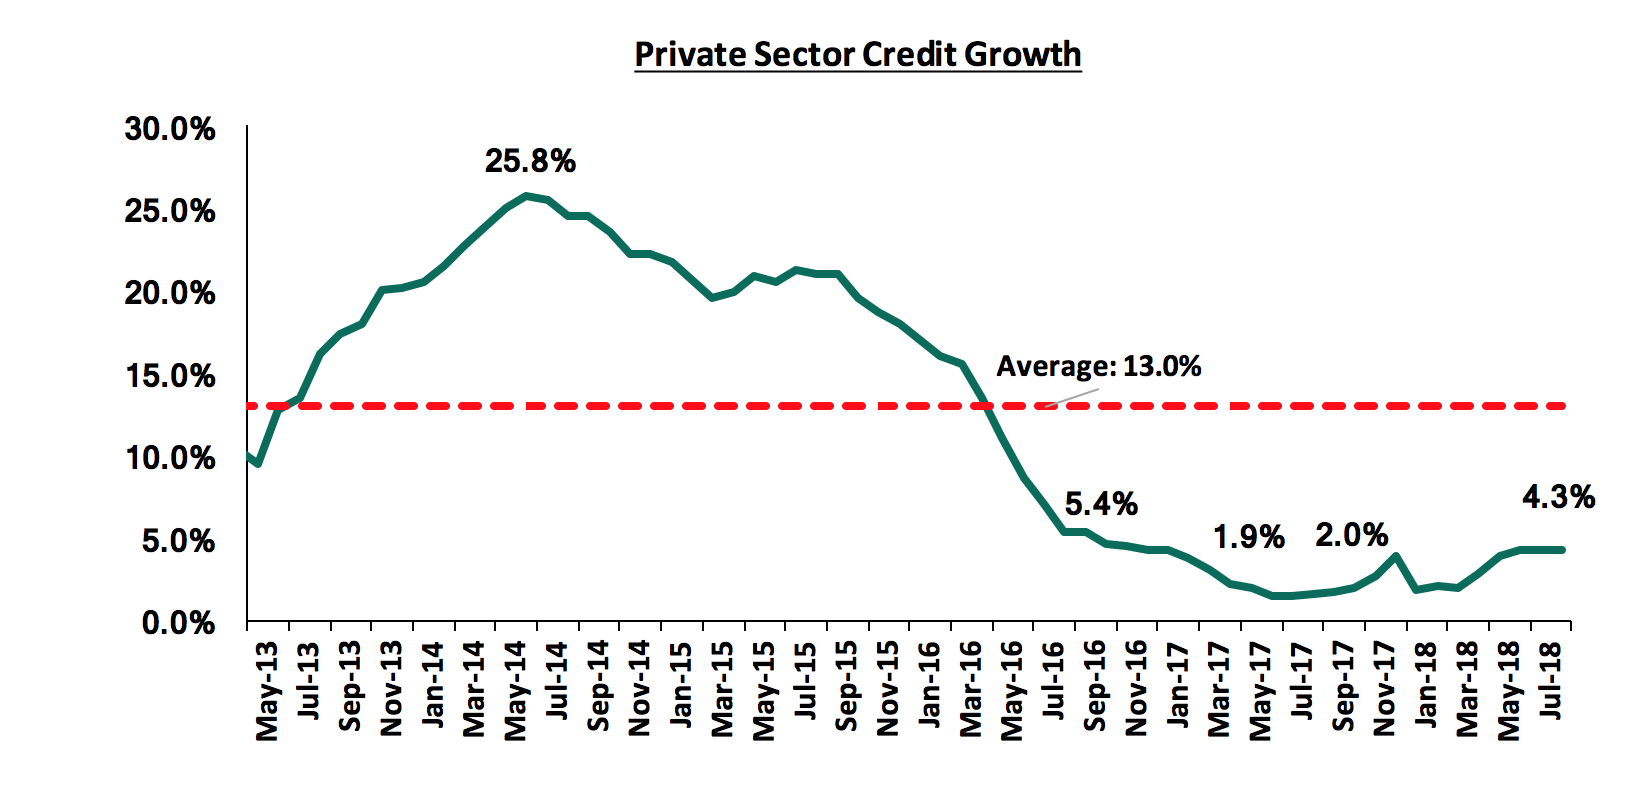
- Kenya's GDP growth is projected to rise to 5.7% in 2018, an upward revision from 5.5% projected in April 2018 - Citing improved rains, better business sentiment and easing of political uncertainty, the World Bank Revised their projected 2018 GDP growth for Kenya upwards by 0.2% points to 5.7%, from 5.5% in the April 2018 Economic Update. Growth in H2'2018 is expected to remain strong supported by recovery in agriculture owing to favorable rains and stronger domestic demand, particularly from the recovery in private consumption and investment. The country’s external position is also expected to remain favorable as evidenced by the current account deficit improvement in Q2’2018, coming in at Kshs 85.8 bn, from Kshs 130.4 bn in Q2’2017, a decline of 34.2%, equivalent to 7.1% of GDP from 11.4% recorded in Q2’2017. This was mainly due to the 57.1% increase in the Secondary Income (Transfers) Balance, largely attributed to a 56.9% increase in diaspora inflows to Kshs 74.7 bn from Kshs 47.6 bn in Q2’2017. However, partially mitigating economic growth during the year will be the effects from the government’s fiscal consolidation efforts, the recent uptick in oil prices and sub-optimal private sector credit growth that has improved to 4.3% as at August 2018, but still remains well below the 5-year historical average of 13.0%. Below is a table showing that the Kenyan economy is expected to grow by 5.5% to 5.6% in 2018 according to projections by the organizations that we track. We shall continue to update this table as these organizations release their updated 2018 projections:
|
Kenya 2018 Annual GDP Growth Outlook |
|||||
|
No. |
Organization |
Q1'2018 |
Q2'2018 |
Q3'2018 |
Q4'2018 |
|
1. |
Central Bank of Kenya |
6.2% |
6.2% |
6.2% |
|
|
2. |
Kenya National Treasury |
5.8% |
5.8% |
6.0% |
|
|
3. |
Oxford Economics |
5.7% |
5.7% |
5.7% |
|
|
4. |
African Development Bank (AfDB) |
5.6% |
5.6% |
5.6% |
|
|
5. |
Stanbic Bank |
5.6% |
5.6% |
5.6% |
|
|
6. |
Citibank |
5.6% |
5.6% |
5.6% |
|
|
7. |
International Monetary Fund (IMF) |
5.5% |
5.5% |
5.5% |
|
|
8. |
World Bank |
5.5% |
5.5% |
5.5% |
5.7% |
|
9. |
Fitch Ratings |
5.5% |
5.5% |
5.5% |
|
|
10. |
Barclays Africa Group Limited |
5.5% |
5.5% |
5.5% |
|
|
11. |
Cytonn Investments Management Plc |
5.4% |
5.5% |
5.5% |
5.5% |
|
12. |
Focus Economics |
5.3% |
5.3% |
5.3% |
|
|
13. |
BMI Research |
5.3% |
5.2% |
5.2% |
|
|
14. |
The Institute of Chartered Accountants in England and Wales |
5.6% |
5.6% |
||
|
15. |
Standard Chartered |
4.6% |
4.6% |
4.6% |
|
|
Average |
5.5% |
5.5% |
5.5% |
5.6% |
|
- Private consumption and investment are driving recovery in economic growth – Private consumption remains the largest demand component of GDP, accounting for 75.0% of total GDP. The recent pickup in private consumption having grown by 7.0% in 2017, up from 4.7% in 2016 has been attributed to favorable agricultural harvests, low inflation and remittance inflows. We expect the effects of the assent of the Finance Bill 2018, which has led to the introduction of an 8.0% VAT on petroleum products, as well as other tax policy measures to be passed on to final consumer prices, moderating growth in private consumption in 2018.
- Fiscal consolidation is gathering momentum – According to the National Treasury’s FY’2017/2018 budgetary review, Kenya’s overall fiscal deficit (including grants) reduced to 6.8% of GDP, from 8.9% recorded in FY’2016/2017. The largest share of fiscal consolidation was however, shouldered by a 24.8% contraction in development spending, from Kshs 645.8 bn in FY’2016/2017 to Kshs 485.7 bn in FY’2017/2018. This prompted the concern by the World Bank on the quality of fiscal consolidation over the past year citing that it was not friendly considering that the majority cuts to government expenditure fell on development spending, which could potentially compromise the growth potential of the economy.
- The upward trend in Kenya’s overall public debt moderated in FY’2017/18 - After a steady climb from about 42.1% of GDP in June 2013 to 57.5% of GDP as at June 2017, debt moderated to 57.0% of GDP as of June 2018. The drop is partly attributed to a narrowing of the fiscal deficit in FY’2017/18 as well as the resilient growth in GDP and a relatively stable exchange rate. The World Bank noted that Kenya's debt remains below the low-income countries Debt Sustainability Analysis (DSA) debt thresholds of 74.0% of GDP in present value terms, with Kenya’s debt to GDP in present value terms at 57.0%.
- Private sector credit growth has picked up in recent months - Private sector credit growth has improved from 2.0% in March to 4.3% in August 2018, signifying a slow but steady pick up, but remains subdued and well below the 5-year historical average of 13.0%, which is mainly attributed to the implementation of the interest rate cap. The World Bank noted that the recent removal of the floor rate on deposit could increase banks profitability without necessarily increasing lending to SMEs, as it would lead to reduced cost of funding. Whether the amendment will translate to higher lending will be dependent on the "risk free" rate of government securities. If yields on government securities remain high, banks will continue to be incentivized to lend to the government rather than customers perceived to be riskier, and with lower cost of funds for the banks, return on equity could be higher. However, were yields on government securities to decline, the combination of greater spreads from the lower funding costs and diminished attractiveness of government securities could reignite lending to the private sector.
In summary, the report paints the picture that the country’s macro-economic fundamentals are still stable and the outlook going forward is positive with the World Bank projecting the GDP growth to come in at 5.7% from the 4.9% recorded in 2017. The Kenyan Government’s fiscal consolidation strategy has resulted in the narrowing of the country’s fiscal deficit and is still one of the key agendas in FY’2018/2019. This is as outlined in the FY’2018/2019 budget where the government is aiming at narrowing the deficit to 5.7% of GDP, with strengthening revenues through tax policy measures and other revenue administrative measures at the core of achieving this target. Private sector credit growth however still remains a key concern, due to the retaining of the interest rate, which has constrained the effectiveness of monetary policy to influence private sector credit access, with the National Assembly having only removed the floor rate on deposit rates. We also expect the introduction of the various tax policy measures under the Finance Bill 2018 to have a negative effect on private consumption, which has been identified as a major driver to the country’s economic growth. This is because consumers will have to rationalize their consumption on goods and services due to the dilution of their purchasing power, which effectively means a reduction in the quantity of goods and services a single unit of currency can buy as the cost burden will be passed on to final consumer, raising prices of commodities and services.
Rates in the fixed income market have been on a declining trend, as the government continues to reject expensive bids, as it is currently 74.6% ahead of its pro-rated borrowing target for the current financial year, having borrowed Kshs 146.1 bn against a pro-rated target of Kshs 83.7 bn. The 2018/19 budget had given a domestic borrowing target of Kshs 271.9 bn, 8.6% lower than the 2017/2018 fiscal year’s target of Kshs 297.6 bn, which may result in reduced pressure on domestic borrowing. With the rate cap still in place, with the president having assented to the Finance Bill 2018, we maintain our expectation of stability in the interest rate environment. With the expectation of a relatively stable interest rate environment, our view is that investors should be biased towards medium-term fixed-income instrument.
Market Performance:
During the week, the equities market was on downward trend with NASI, NSE 20 and NSE 25 declining by 4.4%, 2.0% and 4.3%, respectively, taking their YTD performance to declines of 15.7%, 24.4% and 17.5%, respectively. This week’s performance was driven by declines in large cap counters such as Safaricom, Equity Group, KCB Group, Barclays Bank of Kenya and Standard Chartered Bank, which declined by 7.1%, 6.2%, 5.2%, 2.8% and 2.1%, respectively. For the last twelve months (LTM), NASI, NSE 20 and NSE 25 have declined by 9.3%, 22.9% and 11.9%, respectively.
Equities turnover decreased by 66.7% to USD 11.3 mn from USD 34.0 mn the previous week, bringing the YTD turnover to USD 1.5 bn. Foreign investors remained net sellers, with net weekly outflows decreasing by 12.5% to USD 7.0 mn, from USD 8.0 mn previously. We expect the market to remain subdued in the near-term as international investors exit the broader emerging markets due to the expectation of rising US interest rates coupled with the strengthening US Dollar.
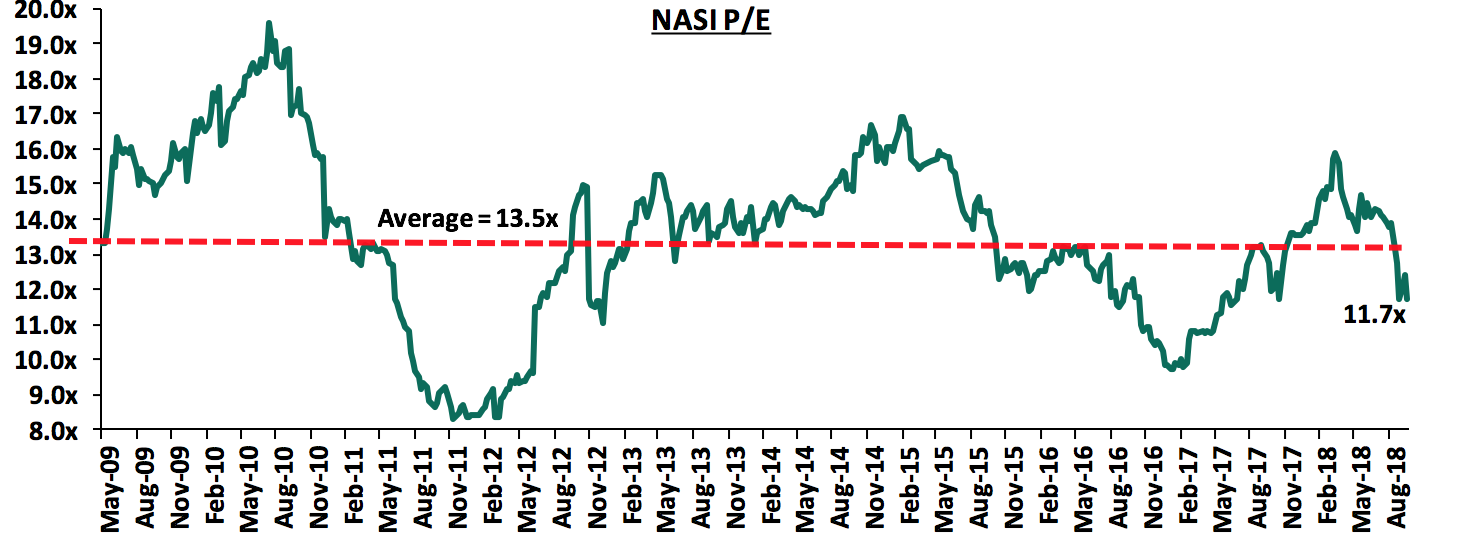
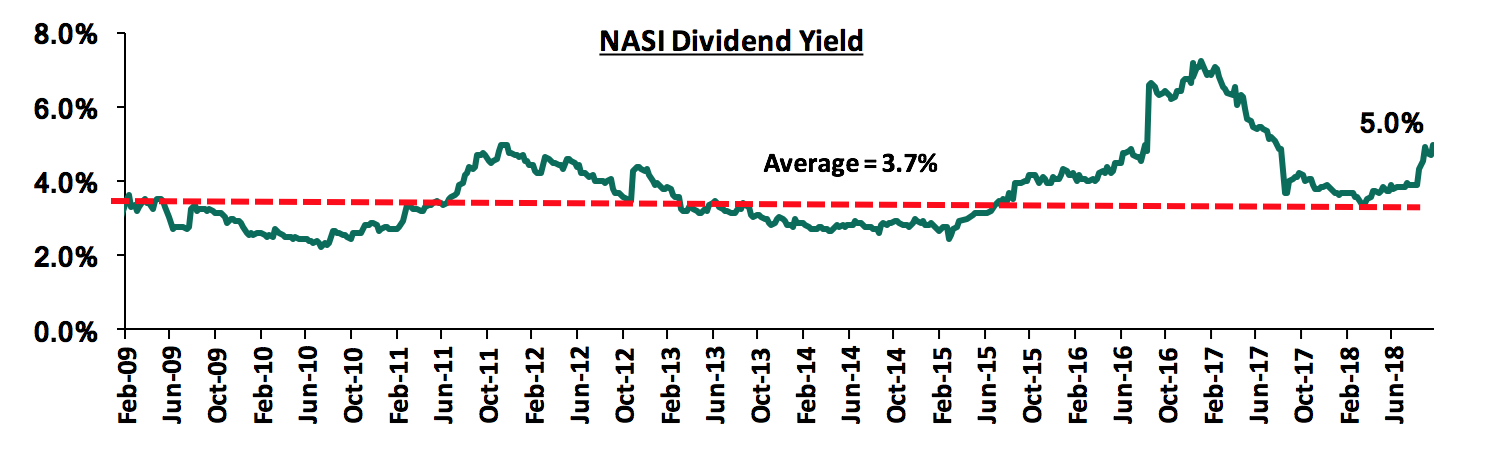
The market is currently trading at a price to earnings ratio (P/E) of 11.7x, which is 12.8% below the historical average of 13.5x, and a dividend yield of 5.0%, higher than the historical average of 3.7%. The current P/E valuation of 11.7x is 19.8% above the most recent trough valuation of 9.8x experienced in the first week of February 2017, and 41.3% above the previous trough valuation of 8.3x experienced in December 2011. The charts below indicate the historical P/E and dividend yields of the market:
Weekly Highlights:
The Central Bank of Kenya (CBK) released the Kenya Financial Sector Stability Report 2017, highlighting the stability of the banking sector over the period between January to December 2017. Key highlights for the banking sector in the period covered in the report include:
- The banking industry comprised 42 commercial banks, 1 mortgage finance company, 13 microfinance banks, 8 representative offices of foreign banks, 73 foreign exchange bureaus, 19 money remittance providers, 8 non-operating bank holding companies and 3 credit reference bureaus in 2017. DIB (Dubai Islamic Bank) Bank Kenya Limited and Mayfair Bank Limited were licensed to operate banking businesses in Kenya, while Société Générale of France opened a Representative Office in Kenya, while Central Bank of India (CBI) closed down its Representative Office;
- Three acquisitions were completed in the period; Fidelity Commercial Bank Ltd was acquired by SBM Holdings Ltd, Giro Commercial Bank Ltd was also acquired by I&M Holdings Ltd, while Habib Bank (K) Ltd was acquired by Diamond Trust Bank Kenya Ltd. Below is a summary of the completed deals in the last 5 years;
|
Summary of Acquisition Transactions |
||||||
|
Acquirer |
Bank Acquired |
Book Value at Acquisition (Kshs bns) |
Transaction Stake |
Transaction Value (Kshs bns) |
P/Bv Multiple |
Date* |
|
SBM bank Kenya |
Chase Bank ltd |
Unknown |
75.0% |
Undisclosed |
N/A |
Aug-18 |
|
Diamond Trust Bank Kenya |
Habib Bank Limited Kenya |
2.38 |
100.0% |
1.82 |
0.8x |
Mar-17 |
|
SBM Holdings |
Fidelity Commercial Bank |
1.75 |
100.0% |
2.75 |
1.6x |
Nov-16 |
|
M Bank |
Oriental Commercial Bank |
1.80 |
51.0% |
1.30 |
1.4x |
Jun-16 |
|
I&M Holdings |
Giro Commercial Bank |
2.95 |
100.0% |
5.00 |
1.7x |
Jun-16 |
|
Mwalimu SACCO |
Equatorial Commercial Bank |
1.15 |
75.0% |
2.60 |
2.3x |
Mar-15 |
|
Centum |
K-Rep Bank |
2.08 |
66.0% |
2.50 |
1.8x |
Jul-14 |
|
GT Bank |
Fina Bank Group |
3.86 |
70.0% |
8.60 |
3.2x |
Nov-13 |
|
Average |
|
|
80.3% |
|
1.8x |
|
|
*Announcement date |
|
|
|
|
|
|
- Banks were generally well capitalized during the period, with capital adequacy ratios remaining above minimum regulatory requirements. Total Capital to Total Risk Weighted Assets ratio increased to 18.8% as at December 2017, from 16.6% as at March 2017, which was higher than the minimum requirement of 14.5%;
- The aggregate banks’ balance sheet expanded in 2017, with total net assets growing by 8.1% to Kshs 4.0 tn in December 2017 from Kshs 3.2 tn in December 2016. Growth in assets was attributed to increased investment in government securities, which grew by 15.3% to Kshs 998.4 bn in 2017, from Kshs 865.9 bn in 2016. There was slower private-sector credit growth of 2.5% in the period compared to 9.4% in 2016. This was attributed to increased uncertainties during the election period, which limited banks’ ability to price risk appropriately in an interest rate-cap environment. Majority of loans were allocated to Manufacturing, Real Estate, Energy and Water, and Personal/Household sectors;
- Aggressive mobilization of deposits by banks saw a 10.8% growth in deposits to Kshs 2.9 tn in December 2017 from Kshs 2.6 bn in 2016. However, most deposits were local currency deposits from transactional accounts, hence limiting banks’ capacity to finance long-term assets. The faster growth in deposits compared to loans led to a decrease in the loan to deposit ratio (LDR) to 83.1% in December 2017 from 87.4% in December 2016;
- The asset quality, as measured by the non-performing loans ratio, deteriorated to 11.0% in December 2017 from 9.3% in December 2016, signifying increased credit risks in 2017. Gross non-performing loans (NPLs) grew by 23.4% to Kshs 264.6 bn in December 2017 from Kshs 214.4 bn in December 2016. Trade, personal/household, real estate and manufacturing sectors accounted for the largest share of NPLs, at 73.1% of gross NPLs. The decline in asset quality was attributed to sluggish economic growth, occasioned by a prolonged election period, coupled with the effects of drought in 2017. The NPL coverage ratio decreased to 34.5% in December 2017 from 37.6% in December 2016, implying more exposure to credit risks;
- The banking sector’s pre-tax profits decreased by 9.6% to Kshs 133.2 bn in December 2017 from Kshs 147.3 bn in December 2016. Total operating income decreased by 3.1% in 2017 to Kshs 486.3 bn, while total expenses fell by 0.5% to Kshs 353.1 bn in December 2017. The decrease in profitability resulted from reduced lending to the private sector, high cost of deposits and slow economic growth in 2017 compared to 2016. We are of the view that banks’ earnings will increase going forward as banks adjust their business models by lowering the deposit rates to increase their net interest spreads to reflect the scrapping of the floor on deposits, which had been pegged at 70% of the prevailing CBR rate;
- Return on Equity (ROE) and Return on Assets (ROA) of the banking sector have declined since 2016, with ROA declining to 2.6% from 3.2% in December 2016 while ROE declined to 20.6% from 24.4% in December 2016. This indicates a decrease in profitability of the banking sector over the period, with earnings being affected by the interest rates capping legislation that came into law in September 2016;
- Banks’ overall liquidity rose to 43.7% in December 2017 from 41.4% in December 2016, against a minimum ratio of 20.0%. The increase in liquidity is attributed to 16.3% growth in total liquid assets, which were mainly government securities.
The data shows that commercial banks adjusted their business models in favor of lending to large corporate borrowers and purchase of government debt. This in turn reduced lending to small borrowers who were perceived as risky by the lenders. Overall, the banking sector remained resilient despite interest rates caps. As at December 2017, banks were well-capitalized with core and total capital to risk weighted assets averaging 16.5% and 18.8% above the regulatory requirements of 10.5% and 14.5%, respectively.
From our Kenya Listed Banks H1’2018 report, we saw that the banking sector has had an improvement in performance in H1’2018, largely aided by the improving economic conditions and a more conducive operating environment compared to a similar period last year. However, the banking sector continues to be fraught by two main challenges: (i) the deteriorating asset quality brought about by spilled over effects of the challenging operating environment experienced in 2017, and (ii) the capping of interest rates, which has led to subdued growth in the credit extended to the private sector. We believe the key factors banks need to consider going forward are asset quality management, continued revenue diversification, efficiency, and downside regulatory compliance risks amid tighter regulatory requirements. We believe the banking sector is well poised to grow in future and continue to outperform other sectors.
Equities Universe of Coverage:
Below is our Equities Universe of Coverage:
|
Equities Universe of Coverage |
|||||||||
|
Banks |
Price as at 5/10/2018 |
Price as at 12/10/2018 |
w/w change |
YTD Change |
LTM Change |
Target Price* |
Dividend Yield |
Upside/Downside** |
P/TBv Multiple |
|
NIC Bank*** |
24.5 |
24.5 |
0.0% |
(27.4%) |
(25.1%) |
48.8 |
4.1% |
103.3% |
0.6x |
|
KCB Group |
38.8 |
36.8 |
(5.2%) |
(14.0%) |
(1.7%) |
61.3 |
8.2% |
75.0% |
1.2x |
|
Diamond Trust Bank*** |
165.0 |
165.0 |
0.0% |
(14.1%) |
(9.3%) |
283.7 |
1.6% |
73.5% |
0.9x |
|
Union Bank Plc |
5.0 |
5.0 |
(1.0%) |
(36.5%) |
(13.9%) |
8.2 |
0.0% |
64.6% |
0.5x |
|
Zenith Bank*** |
21.6 |
22.2 |
3.0% |
(13.4%) |
(12.1%) |
33.3 |
12.2% |
62.3% |
1.0x |
|
Equity Group |
40.5 |
38.0 |
(6.2%) |
(4.4%) |
7.0% |
56.2 |
5.3% |
53.2% |
1.9x |
|
Ghana Commercial Bank*** |
5.3 |
5.4 |
0.2% |
5.9% |
33.8% |
7.7 |
7.1% |
51.4% |
1.3x |
|
I&M Holdings*** |
91.0 |
95.0 |
4.4% |
(25.2%) |
(21.5%) |
138.6 |
3.7% |
49.6% |
0.9x |
|
UBA Bank |
8.2 |
8.1 |
(1.2%) |
(21.4%) |
(12.0%) |
10.7 |
10.5% |
42.6% |
0.5x |
|
Co-operative Bank |
15.4 |
15.4 |
0.0% |
(4.1%) |
(7.0%) |
19.9 |
5.2% |
34.9% |
1.4x |
|
Ecobank |
8.5 |
8.0 |
(5.3%) |
5.3% |
22.4% |
10.7 |
0.0% |
34.1% |
1.9x |
|
Barclays |
10.7 |
10.4 |
(2.8%) |
7.8% |
6.7% |
12.5 |
9.7% |
30.4% |
1.5x |
|
CRDB |
160.0 |
160.0 |
0.0% |
0.0% |
(8.6%) |
207.7 |
0.0% |
29.8% |
0.5x |
|
Access Bank |
8.1 |
8.0 |
(0.6%) |
(23.4%) |
(17.9%) |
9.5 |
5.0% |
23.8% |
0.5x |
|
CAL Bank |
1.2 |
1.2 |
(0.9%) |
7.4% |
32.6% |
1.4 |
0.0% |
20.7% |
1.0x |
|
Stanbic Bank Uganda |
33.0 |
33.0 |
0.0% |
21.1% |
21.1% |
36.3 |
3.5% |
13.5% |
2.3x |
|
HF Group*** |
5.9 |
6.2 |
4.2% |
(40.9%) |
(37.9%) |
6.6 |
5.7% |
13.0% |
0.2x |
|
Standard Chartered |
190.0 |
186.0 |
(2.1%) |
(10.6%) |
(17.3%) |
196.3 |
6.7% |
12.3% |
1.5x |
|
SBM Holdings |
6.3 |
6.3 |
(0.6%) |
(16.3%) |
(19.1%) |
6.6 |
4.8% |
9.2% |
0.9x |
|
Bank of Kigali |
289.0 |
289.0 |
0.0% |
(3.7%) |
1.4% |
299.9 |
4.8% |
8.6% |
1.6x |
|
Guaranty Trust Bank |
36.4 |
36.5 |
0.4% |
(10.4%) |
(12.5%) |
37.1 |
6.6% |
8.2% |
2.3x |
|
Bank of Baroda |
140.0 |
126.0 |
(10.0%) |
11.5% |
14.5% |
130.6 |
2.0% |
5.6% |
1.2x |
|
Stanbic Holdings |
90.0 |
91.0 |
1.1% |
12.3% |
14.5% |
92.6 |
2.5% |
4.2% |
0.9x |
|
National Bank |
5.2 |
5.2 |
0.0% |
(44.4%) |
(47.2%) |
4.9 |
0.0% |
(5.8%) |
0.4x |
|
Stanbic IBTC Holdings |
42.5 |
45.1 |
6.1% |
8.7% |
9.5% |
37.0 |
1.3% |
(16.6%) |
2.2x |
|
FBN Holdings |
8.9 |
9.1 |
2.2% |
3.4% |
48.9% |
6.6 |
2.7% |
(24.4%) |
0.5x |
|
Standard Chartered |
26.1 |
26.1 |
0.0% |
3.4% |
54.8% |
19.5 |
0.0% |
(25.4%) |
3.3x |
|
Ecobank Transnational |
17.5 |
17.5 |
0.0% |
2.9% |
4.5% |
9.3 |
0.0% |
(47.0%) |
0.6x |
|
*Target Price as per Cytonn Analyst estimates **Upside / (Downside) is adjusted for Dividend Yield ***Banks in which Cytonn and/or its affiliates holds a stake. For full disclosure, Cytonn and/or its affiliates holds a significant stake in NIC Bank, ranking as the 5th largest shareholder **** Stock prices are in respective country currency |
|||||||||
We are “NEUTRAL” on equities since the markets are currently trading below historical P/E averages. However, pockets of value continue to exist, with a number of undervalued sectors like Financial Services, which provide an attractive entry point for medium and long-term investors, and with expectations of higher corporate earnings this year, we are “POSITIVE” for investors with a long-term investment horizon.
Filimbi Limited, an investment vehicle owned by Peter Munga and Jane Njuguna (the wife of Equity Bank’s CEO, James Mwangi), has sold 39.5 mn shares of Britam Holdings, a diversified financial services group with operations in Kenya, Tanzania, South Sudan, Uganda, Rwanda, Malawi and Mozambique, in the eight-months ending August 2018. This has reduced its stake in the insurance company to 18.9 mn shares, worth Kshs 209.8 mn, at the current market price of Kshs 11.1 per share and representing 0.9% of shareholding, from 58.4 mn shares. Using the average share price for the last eight-months ending August 2018, which is Kshs 13.5 per share, the implied value of the transaction is Kshs 533.2 mn. This the second sale of Britam Holdings shares by this investment vehicle, as it initially owned 90.0 mn shares and sold off 31.6 mn in 2013 at a value of Kshs 260.0 mn implying a price of Kshs 8.2 per share at the time.
Investor Peter Munga has been reducing his investment in Britam Holdings, in a series of sales, through his various investment vehicles, in line with his deadline of August 2018 to dispose of the 452.5 mn shares that he acquired in 2016, for an undisclosed price, from the company’s former director Dawood Rawat. The business mogul had acquired these shares through his investment vehicle, Plum LLP, and he was to temporarily hold on to the shares to eliminate investor uncertainty arising from Mr. Dawood’s troubles. Additionally, this would give Britam and its shareholders enough time to identify a suitable investor. Mr. Munga bought these shares from the Mauritius Government, that had seized Mr. Dawood’s assets after he was accused of running a USD 693.0 mn (Kshs 69.3 bn) Ponzi scheme in Mauritius. Earlier this year, June 2018, Mr. Munga’s Plum LLP sold 348.5 mn shares to Swiss Re, a leading reinsurance company based in Zurich, Switzerland. This was all of Plum LLP’s shareholding in Britam Holdings.
Over the last two-years, Britam Holdings has experienced shifts in its shareholding characterised by major transactions. The most notable of these transactions are:
- In March 2017, International Finance Corporation (IFC), the private sector arm of World Bank Group, subscribed for 224.2 mn shares at a price of Kshs 15.9 per share, bringing their total investment to Kshs 3.6 bn, and a stake of 10.4%. For more information, see International Finance Corporation invests in Britam
- In September 2017, AfricInvest III, a Special Purpose Vehicle (SPV) managed by AfricInvest Capital Partners Management II, subscribed for 360.9 mn shares at Kshs 15.9 per share, bringing the total investment to Kshs 5.7 bn and a stake of 14.3%. For more information, see our Cytonn Weekly #21/2018, and AfricInvest III invests in Britam
- In June 2018, Plum LLP sold its 13.8% stake in Britam Holdings to Swiss Re, a reinsurance company with offices in over 25 countries. This transaction saw Swiss Re acquire 348.5 mn shares for Kshs 4.8 bn. For more information, see our Cytonn Weekly #24/2018
The recent transaction in Britam Holdings by IFC, Swiss Re and AfricInvest shows confidence by global investors in the insurance giant’s future prospects and this will help raise its profile internationally.
In fundraising, AfricInvest, a leading Pan-African private equity firm with a focus on agribusiness, financial services, healthcare, education and commercial sectors, has announced the second close of Financial Inclusion Vehicle (FIVE), a platform for investing in financial services in Africa. Its objective is to contribute towards improving access to financial services for the growing population in Africa by investing tier II and tier III financial institutions in Africa, as currently the banking penetration in Africa is still low at 20.0% compared to 69% globally. The close brought in an aggregate commitment of EUR 31.0 mn (Kshs 3.6 bn), bringing the total commitments to EUR 61.0 mn (Kshs 7.1 bn), with the first close having brought in EUR 30.0 mn (Kshs 3.5 bn). Their target commitments for this close was not disclosed. The second close brought in Norfund (the Norwegian Development Finance Institution), IFU, (the Danish investment fund for investing in Developing Countries), and the Central Bank of Kenya Pension Fund. The individual commitments for Norfund, IFU and Central Bank of Kenya Pension Fund were not disclosed.
The first close was announced in December 2017, with Dutch Development Bank (FMO) and Belgian Investment Company for Developing Countries (BIO), the development finance institutions for Netherlands and Belgium, being the anchor investors for the fund with commitments of EUR 20.0 mn (Kshs 2.3 bn), and EUR 10.0 mn (Kshs 1.2 bn), respectively. FMO will increase its investment further by EUR 10.0 mn (Kshs 1.2 bn), once commitments of up to EUR 70.0 mn (Kshs 8.2 bn), have been signed by the Fund.
The Fund targets to raise EUR 200.0 mn (Kshs 23.4 bn), to be attained in the next three to five-years and it aims at a third closing in the next few months that will bring in Africa Development Bank and other institutional investors who have confirmed their commitment to the Fund. AfricInvest has 18 private equity funds with USD 1.2 bn (Kshs 121.1 bn) worth of funds under management. It has made investments in over 140 companies and exited over 80 investments. Some of the investments made by AfricInvest in Kenya include:
|
AfricInvest Private Equity Investments |
||||||
|
No |
Company |
Sector |
Country |
Stake Acquired |
Amount Invested (Kshs bn) |
Status |
|
1. |
UAP Group |
Financial Services |
Kenya |
37.3% |
14.2 |
Realized |
|
2. |
Brookhouse School |
Education |
Kenya |
30.0% |
0.4 |
Realized |
|
3. |
Family Bank |
Financial Services |
Kenya |
Not Disclosed |
1.0 |
Realized |
|
4. |
Silafrica Plastics Packaging Limited |
Plastics and Packaging |
Kenya |
Not Disclosed |
Not Disclosed |
Current |
|
5. |
Britam Holdings |
Financial Services |
Kenya |
14.3% |
5.7 |
Current |
Private equity investments in Africa remains robust as evidenced by the increasing investor interest, which is attributed to; (i) rapid urbanization, a resilient and adapting middle class and increased consumerism, (ii) the attractive valuations in Sub Saharan Africa’s private markets compared to its public markets, (iii) the attractive valuations in Sub Saharan Africa’s markets compared to global markets, and (iv) better economic projections in Sub Sahara Africa compared to global markets. We remain bullish on PE as an asset class in Sub-Saharan Africa. Going forward, the increasing investor interest and a stable macroeconomic environment will continue to boost deal flow into African markets.
- Industry Reports
During the week, the Central Bank of Kenya released its 2018 Financial Stability Report, which tracks the local economy and financial sector in Kenya. Key take-outs from the report were:
- Commercial banks and pension funds remained as the leading sources of credit for real estate developers and homebuyers alike. Bank credit to real estate increased by 30.8% to Kshs 371.7 bn in 2017, from Kshs 284.1 bn in 2016. This is despite the decline in private sector credit growth that stood at 4.3% as at August 2018 compared to a 5-year average of 14.3%. Pensions funds’ portfolio allocated to real estate increased by 27.1% to Kshs 226.7 bn in 2017, from Kshs 178.4 bn in 2016,
- Private equity funding to real estate reduced by 13.3% to Kshs 83.2 bn, from Kshs 95.9 bn over the same period in 2017. This is in comparison to a growth of 412.5% between 2015 and 2016, and,
- Insurance funds retained the least portfolio of Kshs 76.0 bn, having grown by 3.8% in 2017, from Kshs 73.2 bn in 2016. This, however, made up 20.9% of the assets under management, which is 8.1% short of the 30.0% limit allocation for property investments by the Retirements Benefits Authority (RBA).
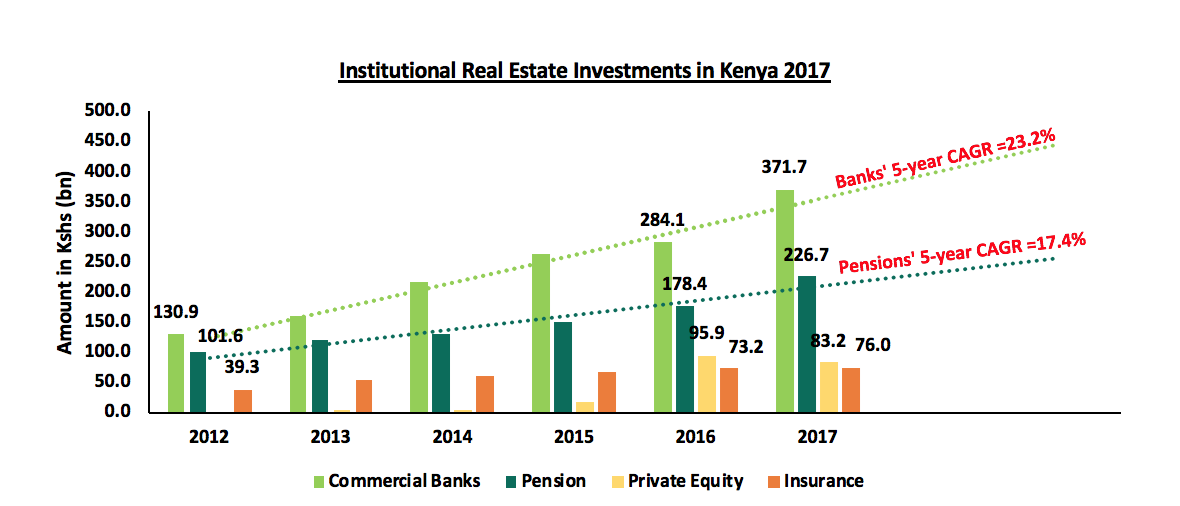
Source: Central Bank of Kenya 2018
In our view, the decline in private equity investments in 2017 is attributable to:
- Political tension in 2017 causing investor wariness,
- The deteriorating financial services sector due to the Bank Amendment Act of 2015, and,
- The decline in the performance of the commercial real estate sector, where most private equity funds tend to focus, due to an oversupply of office and retail supply, especially in Nairobi.
The continued investment by commercial banks and pension funds, on the other hand, is supported by:
- High long-term returns with a five-year average total return to investors of 24.3% compared to traditional asset classes’ average of 13.2%,
- Sustained demand for housing with the nation’s deficit at 2.0 mn units, and,
- The expansion of the middle class creating demand for real estate.
We are, however, of the view that there is still need for increased sources of finances for real estate given the huge housing deficit in the market. Case in point, with a cumulative demand of 2 mn units and assuming a cost of Kshs 2 mn per unit, Kenya has a real estate market size worth at least Kshs 4 tn against a total funding of Kshs 757.6 bn as at 2017 from banks, pension funds, insurance firms and private equity investors. The pension industry, for instance, has the potential to unlock funds for real estate development with assets worth Kshs 963.1 bn as at the end of June 2017 and growing at a CAGR of 13.5% from Kshs 396.7 bn in June 2010, with the current property investment allocation standing at 21.3% only. Other alternative sources of funding that could be explored include the capital markets through structured products such as REIT’s, commercial papers and project notes.
- Hospitality Sector
During the week, global hotelier, Radisson Hotel Group, announced plans to open its first residence in Nairobi’s Arboretum neighborhood in Q2’2019. The property, which shall be under the Radisson Blu brand as Radisson Blu Hotel and Apartments, will have approximately 123 rooms and will add onto its current operational portfolio consisting of the 140-room Park Inn Hotel in Westlands, which opened in April 2017, and the 271-room Radisson Blu Hotel in Upperhill, which opened in November 2015. The international hotel group also plans to introduce three more of its brands, that is, Radisson RED, Radisson Collection, and Radisson (timelines undisclosed), raising its total brand portfolio in Kenya to 5. The heightened appetite for Kenya from international hotel brands attests to the growth and viability of Kenya’s hospitality scene. Some of the other notable international hotel brands in Nairobi include:
|
International Hotel Brands Operating in Nairobi and Hotels in the Pipeline |
||||||
| No | Hotel Group | Current Portfolio | No Of Rooms | Under Construction | No Of Rooms | Estimated Completion Year |
| 1. | Dusit Thani Group | DusitD2, Westlands | 101 | - | ||
| 2. | Hilton |
Hilton Nairobi, CBD Hilton Garden Inn, Msa Rd Double Tree, Hurlingham |
287 171 109 |
Pinnacle, Upperhill |
255 |
2020 |
| 3. | Radisson Hotel Group |
Park Inn, Westlands Radisson Blu, Upperhill |
140 271 |
Radisson Blu Hotel & Apartments, Arboretum |
123 |
2019 |
| 4. |
Kempinski |
Villa Rosa Kempinski, Westlands |
200 |
- |
||
| 5. |
Intercontinental Hotel Group |
Crowne Plaza, Upperhill InterContinental Nairobi, CBD |
206 326 |
- |
||
| 6. |
Marriot International |
Four Points by Sheraton, Kilimani Four Points by Sheraton, JKIA |
96 172 |
JW Marriot, Westlands |
365 250 |
2020 2021 |
| 7. |
Best Western |
Best Western Plus Meridian, CBD |
128 48 |
Best Western, Westlands |
100 |
2019 |
| 8. |
Louvre Hotel Group |
Royal Tulip Canaan, Kilimani Golden Tulip, Westlands |
94 94 |
- |
||
| 9. |
Accor Hotels |
Movenpick Hotel, Westlands Fairmont The Norfolk Hotel, CBDIbis Styles, Westlands |
223 170 |
Pullman Westlands |
340 |
2019 |
| 10. |
Sarova |
Lazizi Premier, Msa Road Heron Portico, Kilimani Portico the Zehneria, Westlands |
144 108 56 |
|
||
|
**Other international brands planning to come into the market include Wyndham, City Blue, and Swiss International **The incoming supply of hotel keys is estimated to be at least 2,945 keys |
||||||
Source: Cytonn Research
We attribute the robust expansion drive by international hoteliers to:
- Improved infrastructure such as airport renovations at the Jomo Kenyatta International Airport (JKIA), and Moi International Airport (MIA), and roads such as the Standard Gauge Railway,
- Availability of express flights such as Nairobi-New York, Rwanda-Mombasa, Italy-Malindi, Paris-Nairobi, Qatar-Mombasa, among others, which have improved the convenience in transport for both business and leisure travelers,
- Aggressive marketing by the Kenya Tourism Board, aided especially by the global recognition awards and positive reviews from travel agencies such as Trip Advisor,
- Reduced visa restrictions and visa on arrival for African nationalities, which was introduced in 2017,
- Nairobi’s regional status as a business hub, thus it is a key destination for business travelers to the Eastern Africa Region, and,
- Increased demand for luxurious hotel accommodation services especially from the international tourists.
Hotels performance has been boosted by increased demand for premium hotel services from both leisure and business travelers. In 2015 and 2016, the sector showed signs of recovery with an Average Daily Rate of Kshs 14,026 and Kshs 13,909, respectively, 4.7% and 3.8% higher than the 5-year average of Kshs 13,395, where lower rates were recorded between 2011 and 2014, on account of insecurity caused by terrorist activities in Kenya. According to Cytonn Hospitality Report 2017, the Average Daily Rate decreased in 2017 due to the protracted electioneering period that caused security concerns.
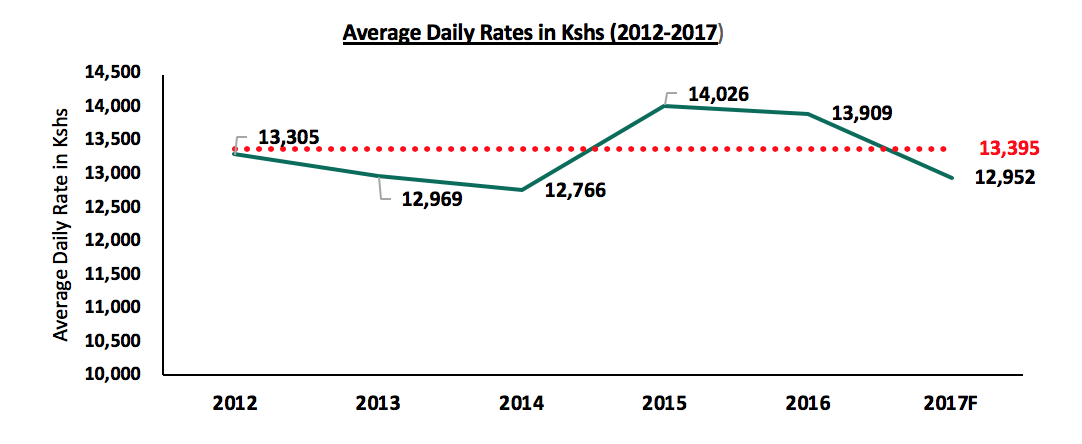
Source: Cytonn Hospitality Report 2017
The sector’s performance has been on a recovery path in 2018 supported by a stable macroeconomic environment, the return of political calm, and increased international tourist arrivals.
Over the January to July period, 2018 recorded an average increase in international arrivals, through the Jomo Kenyatta International Airport (JKIA) and Moi International Airport (MIA) of 12.5%, compared to 5.8% over a similar period in 2017, as shown below:
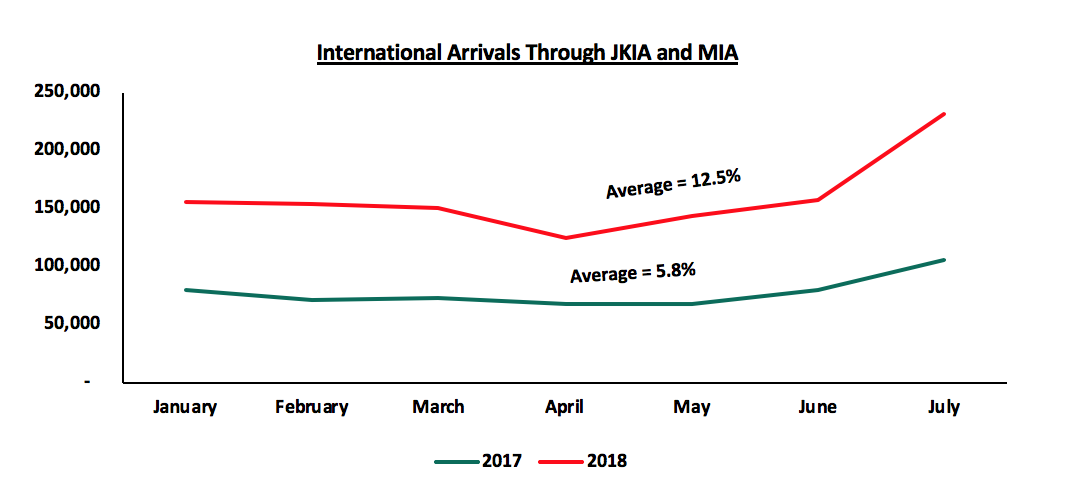
Source: KNBS Leading Economic Indicators
The increase in international hotel brands is bound to boost the Meetings, Incentives, Conferences, and Exhibitions (MICE) industry by availing international quality conferencing facilities, which are a key pull factor for global conferences. Additionally, presence of well-known brands is an attraction for international tourists, due to brand loyalty, and thus is likely to encourage longer or frequent stays leading to increased sector earnings.
Also during the week, Kenya’s tourism and hospitality sector received global accolades during the World Travel Awards (WTA) recently held in Durban, South Africa. The various awards are as shown below:
|
Kenya World Travel Awards 2018 |
|
|
Facility |
Award |
|
Maasai Mara |
Leading National Park |
|
Diani Beach |
Leading Beach Destination |
|
Diani Reef |
Leading Beach Resort |
|
Kenya Airways |
Leading Airline - Business and Economy Class |
|
Aberdare Country Club |
Leading Green Hotel |
|
Palacina Residences and Suites |
Leading Hotel Residences |
|
Villa Rosa Kempinski |
Leading Luxury Hotel |
|
Other facilities that bagged awards include: Ol pejeta Conservancy, Fairmont Mount Kenya Safari Club, Manda Bay, Finch Hattons, Olare Mara Kempinski |
|
Source: Online Sources
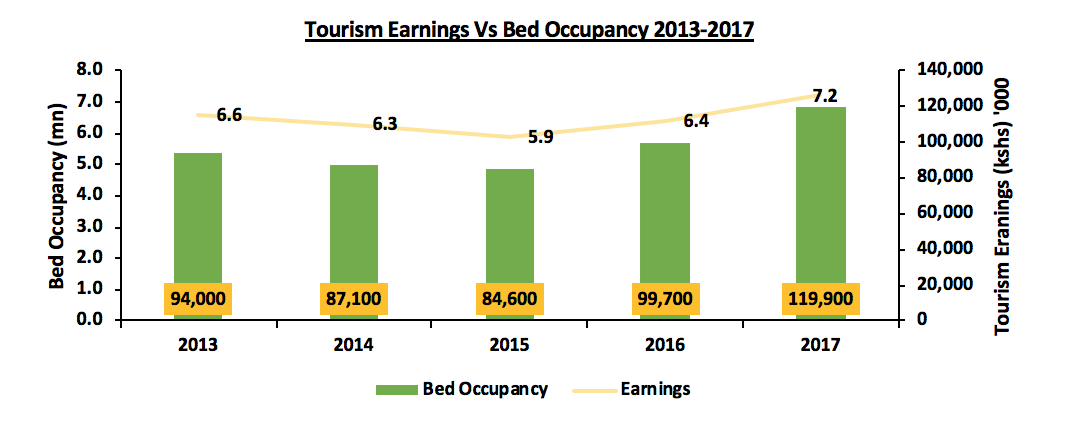
The awards facilitate the performance of the sector and of key to note is that, the Maasai Mara and Diani Beach have won the respective accolades six and five times in a row, respectively, demonstrating Kenya’s position as a global leader in the industry. This is also evidenced by the continued improvement of our hospitality industry, where according to KNBS Economic Survey 2018, tourism earnings increased by 20.3% in 2017 to Kshs 119.9 bn from Kshs 99.7 bn in 2016, whereas hotel occupancy increased by 11.3% to 7.2 mn bed nights in 2017 from 6.4 mn bed nights in 2016, thus indicating sustained demand for hotel beds.
Source: KNBS 2018
We, therefore, expect the hospitality sector to remain on its upward trajectory supported by increased international tourist arrivals, support from the government in the form of international marketing, increased entry of international hotel brands, and enhanced security within the country.
- Retail Sector
Local retailer, Naivas, announced plans of shutting down its Kitengela Mall branch, which was opened in June earlier this year. The retailer will relocate its store merchandise to its recently launched branch at Freedom Heights Mall in Lang’ata where it took up 18,000 SQFT of space. Naivas Supermarkets, one of the leading retail chains in Kenya, has been undertaking a national expansion drive, which has seen its store count rise to 46 countrywide, and 24 in Nairobi. This recent development, however, will see the number of stores reduce to 45 nationwide, and 1 in Kitengela. In our view, this could be due to a challenging business environment at its Kitengela Mall branch, attributable to the stiff competition from the informal retailers in Kitengela, as well as the presence of other formal retailers such as Tuskys and Eastmatt. Previously, we have witnessed local retailers under distress due to financial constraints arising from overambitious expansion drives. Therefore, this is a prudent move by Naivas to avoid bearing unnecessary losses considering the Kitengela Mall branch was only operational for four months.
Other Highlights
- Infrastructure: The Kenyan Government allocated Kshs 10 bn to Kenyan Sub-Counties in a bid to ease communication across counties as well as improve government service delivery to the citizens through the National Optic Fiber Backbone Infrastructure, which will be an extension from the Kenyan Counties to the Sub-Counties. The project is set to take 3-5 years in institutions such as schools, hospitals, and police stations. This in turn is expected to improve monitoring of security, traffic snarl ups, and thus increasing investment opportunities, especially for residential real estate investments,
- Industrial: Electronics manufacturer Toshiba has invested Kshs 500 mn to open its first regional warehouse in Nairobi’s Karen in a bid to serve its East African market more efficiently. Currently, the brand has been operating within the continent from its South African branch.
Listed Real Estate
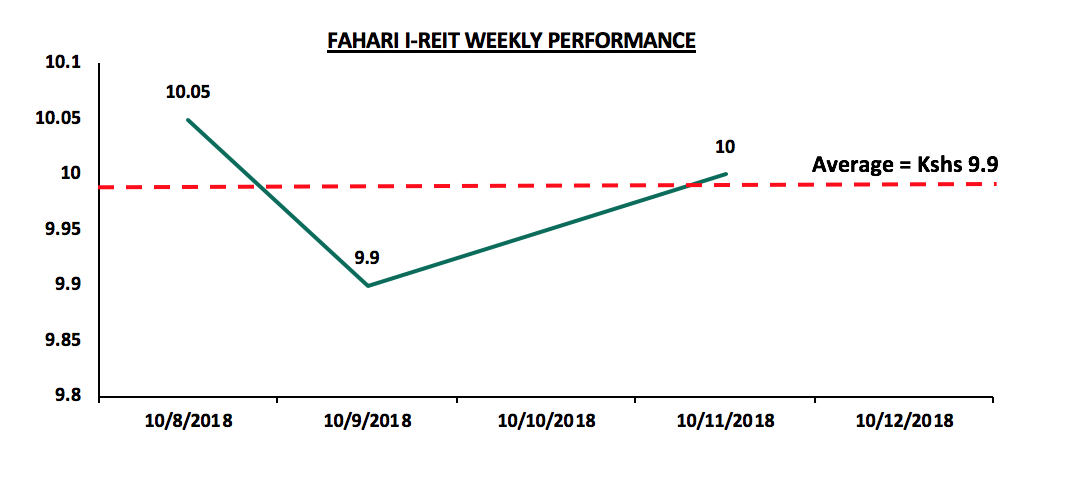
The Fahari I-REIT remained unchanged closing the week at Kshs 10.0 per share (as of Thursday), which was the same as last week’s closing price. Additionally, during the week, it recorded an average price of Kshs 9.9 per share, 2.9% decline from last weeks’ average of Kshs 10.2. The instrument continues to trade at low prices and in low volumes largely due to: (i) the negative sentiments currently engulfing the sector given the poor performance of the Fusion D-REIT (FRED), which failed to raise the minimum capital required to list on the NSE, (ii) inadequate investor knowledge, and (iii) the poor performance of Fahari I-REIT recording a dividend yield of 5.7% compared to brick and mortar office and retail at 9.3% and 9.7%, respectively.
Nigerian I-REIT
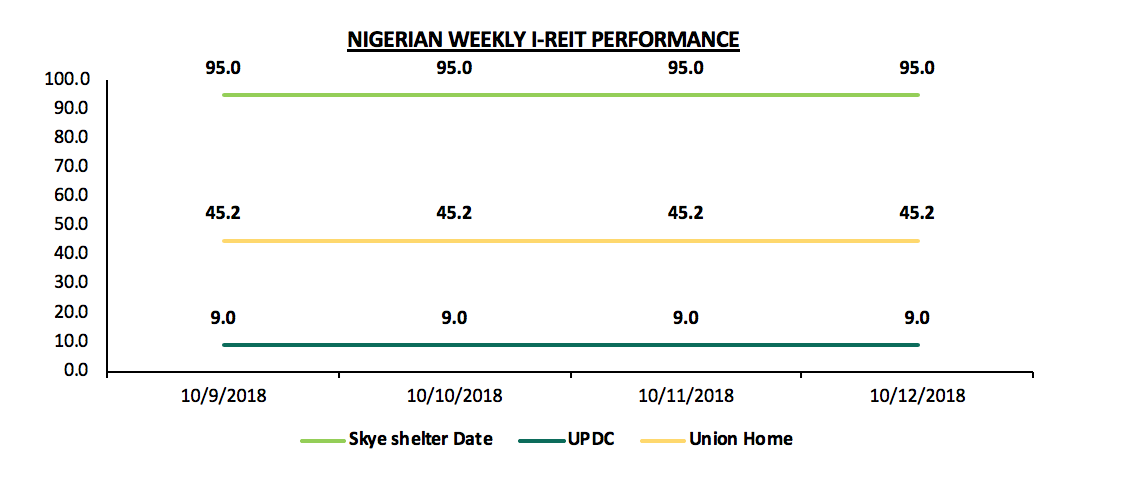
The Nigerian I-REIT market remained unchanged during the week, with, Skye Shelter, Union Homes and UPDC, retaining a price per share of N95, N45.2, and N9, respectively. We attribute the plateaued performance to inadequate investor knowledge about the market hence low investor interest in the instrument.
We remain optimistic about the real estate sector, with its performance boosted by improving macroeconomic environment, increase in tourism and hospitality earnings and increase in infrastructural improvements.
Focus of the Week : Cytonn Corporate Governance Report - 2018 – Improved Corporate Governance Key to Investor Protection
Corporate governance constitutes the mechanisms, processes and relations used to direct and manage the business and affairs of a company. Corporate governance is founded on the pillars that businesses have to practice accountability to stakeholders, fairness, have transparency in business activities, and exhibit independence in decision making. Corporate governance has taken centre stage given the recent bank failures and operational crisis in firms such as:
- ARM Cement, after three-years of incurring heavy losses following an ambitious yet ultimately unsuccessful expansion plan, became the second major company to be placed under administration in 2018. In August 2018, the NSE issued a statement that it had suspended trading of ARM’s shares,
- Chase Bank, which was also placed under receivership in 2016 following cases of unsound banking practices such as large unsecured loans to directors. In 2018, it was acquired by SBM Holdings,
- Uchumi and Nakumatt, which have experienced cash-flow problems due to mismanagement of the retailers, with the latter being put under administration earlier this year,
- Imperial Bank, which was placed under receivership by the CBK in 2015 following what was described as unsound business conditions in the bank,
- Kenya Airways, whose issues around governance came into light following four consecutive years of massive losses resulting from high debt levels after a botched expansion plan, and reduction in passenger numbers, and,
- Other recent investor losses that may be related to failure of corporate governance include: National Bank of Kenya, Mumias Sugar, EA Portland Cement, Home Afrika, and CMC, among others.
The total investor loses that can be associated to failure of corporate governance from the above situations is roughly Kshs. 312.9 bn, consequently demonstrating that improved corporate governance is key to investor protection.
Last year, we released the Cytonn Corporate Governance Report - 2017, in which we highlighted the importance of sound corporate governance in enhancing investor’s confidence that their wealth is secure. Following the significant losses experienced by investors as discussed above, in April this year, ‘The Code of Corporate Governance Practices for Issuers of Securities to the Public, 2015’ by the Capital Markets Authority (CMA) came into full effect. In line with this regulatory effort to increase investor protection, the theme of our report this year is ‘Improved Corporate Governance Key to Investor Protection’. This topical highlights the provisions of the Code as well as the performance from this year’s ranking, covering the following sections:
- The Code of Corporate Governance Practices; A Summary
- Enforcement of the Code by the CMA; Case Study of NBK
- Outlook; Areas That Could be Improved, and
- Cytonn Corporate Governance Report - 2018
Section I: The Code of Corporate Governance Practices; A Summary
In December 2015, CMA issued ‘The Code of Corporate Governance Practices for Issuers of Securities to the Public, 2015’. This Code replaced ‘The Guidelines on Corporate Governance Practices by Public Listed Companies in Kenya, 2002’, as the standard for application by both listed and unlisted public companies in Kenya. It was meant to come into effect in March 2017, however since most listed companies were in the middle of their financial years, the deadline for compliance was pushed to April 2018. The Code advocates for the adoption of standards that go beyond the minimum prescribed by legislation. The implementation approach moved away from the “Comply or Explain” approach to “Apply or Explain”. The new approach is principle-based rather than rule-based, and recognizes that a satisfactory explanation for any non-compliance may be acceptable in certain circumstances. This however requires boards to fully disclose any non-compliance with the Code to relevant stakeholders including CMA with a firm commitment to move towards full compliance. The Code still maintains some mandatory provisions, which are the minimum standards that issuers must implement.
The 2015 Code has significantly enhanced the 2002 Guidelines and addresses some of the shortcomings of the previous guidelines. Key highlights of the new Code are as follows:
- Implementation & Oversight: The Code has become more stringent on implementation and oversight. At the end of every financial year, the board is required to disclose in its Annual Report, a statement of policy on good governance and the status of application of this Code. The board is also required disclose to CMA the reasons for any non-application, and clearly indicate the time frame required and the strategies to be put in place towards full application,
- Stakeholder Engagement: Undefined terms such as conflict of interest and stakeholders are now clearly defined. It also provides for previously unmentioned but important issues such as stakeholder engagement and governance, legal compliance and ethical compliance audits to supplement financial audits,
- Conflict of Interest: It more thoroughly provides for conflict of interest arising at all management levels and the roles and duties of directors. It also requires more disclosure by Issuers improving transparency. It is more comprehensive in the issue of efficiency and effectiveness of boards as it introduces mandatory professional training and development for directors and mandates frequent evaluation of the board across various areas. In addition, it gives guidelines on multiple directorships, independence of directors and restrictions for alternate representatives, and,
- Performance Evaluation: Performance evaluation is also a key issue. The Code requires the board to undertake an annual evaluation of its own performance, the performance of the Chairperson, that of its committees, individual members, the Chief Executive Officer and Company Secretary. In addition, the board is required to disclose in its annual report, its policies for remuneration including incentives for the board members and senior management.
Section II: Enforcement of the Code by the CMA; Case Study of NBK
Management of National Bank of Kenya (NBK) faced allegations of misrepresentation of financial statements for the periods ended 30th June 2015 and 30th September 2015, where profits were allegedly overstated. During the same period, approximately Kshs 1.0 bn was alleged to have been siphoned out of the bank through an embezzlement scheme. The misrepresentation of financial statements was occasioned by premature recognition of sale of assets amounting to Kshs 800.0 mn and under provisioning of loan amounts and wrongful recognition of interest income leading to the overstatement of profit in the respective periods. The bank had published unaudited financial statements reporting profits of Kshs 1.7 bn for the quarter ended 30th June 2015, and Kshs 2.2 bn for the quarter ended 30th September 2015, but subsequently reported a loss of Kshs 1.2 bn in its audited financial statements for the period ended 31st December 2015.
In April 2018, the Board of CMA issued a statement that it had taken administrative action against the NBK Board Members and former Senior Managers who served at the bank as at 31st December 2015 for the alleged misrepresentation of financial statements and embezzlement of funds at NBK. The Authority also recommended to the Office of the Director of Public Prosecutions the prosecution of some of the Senior Managers and further criminal investigations of additional individuals. Based on whistle-blower information, CMA conducted an inquiry into the affairs of the bank leading to the commencement of enforcement proceedings against the then NBK Board Members and its Senior Managers; the Former Managing Director, the Former Chief Credit Officer, the Former Chief Finance Officer, the Former Ag. Chief Finance Officer, the Former Head of Treasury, the Former Director Corporate and Institutional Banking, and the Former Relationship Manager for Business Banking. The following was the outcome of the proceedings:
- CMA disqualified the Former Managing Director from holding a board position in a public issuer of securities or working for a licensed entity for a period of 3-years and imposed a financial penalty of Kshs 5.0 mn for his role in the ineffective management of the bank, his failure to ensure the board was furnished with complete and reliable information, and for the misrepresentation of the financial statements;
- CMA disqualified the Former Head of Treasury and the Former Chief Finance Officer from holding board positions for a period of 10-years and 3-years, respectively, in line with evidence of their active involvement in the embezzlement scheme together with recommending their criminal prosecution to the Director of Public Prosecutions;
- The Former Head of Treasury was fined Kshs 104.8 mn being twice the amounts so far traced to him from the embezzled funds. CMA, in addition, sought restriction on two properties associated with him, which were purchased with the embezzled funds;
- The Former Chief Finance Officer was fined Kshs 1.0 mn for his role in the embezzlement scheme;
- The Former Ag. Chief Finance Officer and the Former Chief Credit Officer were also fined Kshs 1.0 mn each for misrepresentation of financial statements, and failure to relay correct information on provisioning to the board, respectively.
CMA reinforced the importance of board members and key officers in public issuers of securities exercising their fiduciary responsibilities to protect shareholders’ investments and investors interests by putting in place internal controls and improving capacity of board audit committees to ensure financial statements published disclose accurate and complete information.
This is just a case study of recent CMA action on corporate governance issues, The Authority has become much more aggressive in tackling malfeasance, and for that the market needs to applaud them for this positive step. In its Capital Markets Report for 2017, The Authority reported a total of 21 cases of regulatory action against market participants.
Section III: Outlook; Areas That Could be Improved
The Code has had extremely positive results so far as we have witnessed more enforcement actions, better transparency and better corporate governance reporting in annual reports this year; majority of the companies have now included a statement of corporate governance as a standalone section in their reports, providing more details on their corporate governance status. However, there are some issues that the CMA needs to address;
- Enforceability will remain a challenge because some of the provisions of the 2015 Code do not, by their nature, declare themselves enforceable. An example; One provision states that Boards are required to be of a “sufficient size”. The statement remains subject to interpretation and cannot be prescribed as it will vary from company to company depending on several considerations such as the size of the firm and the nature of its business,
- There is also need for clarification on some of the provisions of the 2015 Code. It would be useful for the CMA to provide templates or further guidelines for board policies such as the evaluation toolkit and annual work plan it must adhere to,
- The Authority shall need to clarify the consequences of noncompliance and the instances in which an explanation by a company for noncompliance shall be sufficient,
- There is need to harmonise the various corporate governance guidelines being issued by the various authorities because the Codes have conflicting provisions. For example, the Central bank of Kenya Prudential Guidelines for Institutions Licensed under the Banking Act, 2013 prohibits directors of such institutions from holding more than two (2) concurrent directorships while the 2015 Code allows them to hold three (3) concurrent directorships,
The Authority needs to address the market perception, however false, that some market participants are untouchable. For example, the full market knowledge that Britam irregularly used insurance funds to meet The Authority’s threshold for an IPO gives the appearance of untouchables. The claim by Britam that it lost up to Kshs. 9.0 bn of client funds in its CMA regulated subsidiary, and while at the same time invoking The Authority’s name in reassuring their clients that no money was lost comes across as aiding market mischief. Market manipulation and mischief, in plain sight and in some circumstances invoking the name of The Authority, may be construed as aiding and abetting market manipulation by market participants – a claim of loss of colossal sums by a listed company and a regulated asset manager ought to attract regulatory review. (For full disclosure, we are engaged with Britam in active litigation, however the analysis remains objective.)
In conclusion, good governance is to key to exemplary and sustainable performance of a company. The 2015 Code has moved corporate governance standards in Kenya one step closer to international corporate standards. Companies need to understand the 2015 Code to enable them to implement the necessary processes and policies so as to improve their performance and ensure the sustainability of this performance. This is ultimately in the interest of both the company and the stakeholders.
Section IV: Cytonn Corporate Governance Report 2018
Summary of Methodology: Cytonn’s Corporate Governance Report 2018 ranks 47 listed companies, each with a market cap of above Kshs 1.0 bn, using 24 metrics on their corporate governance structure. The companies are ranked on these 24 metrics to arrive at a composite score that provides a deeper understanding of the level of corporate governance in each firm. The main areas of analysis are in the (i) board composition, (ii) audit functions, (iii) CEO tenure and evaluation, (iv) remuneration, and (v) transparency. The score is a diffusion score with 50.0% as the base, meaning that any score below 50.0% is flagged as having serious corporate governance issues, while any score above 50.0% is skewed towards proper governance. However, the variance from 100% gives the risk associated with corporate governance. We sent the draft analysis and data to all the listed companies for their comments and confirmation. Of the 47 companies, 18 responded.
We are glad to note that 2017/18 has witnessed a notable improvement on corporate governance and corporate governance reporting. This has led to more transparency and better disclosure, which we believe have been as a result of regulation aimed at establishing proper oversight. This increased level of oversight and improved quality of corporate governance reporting informs the theme of our report this year, ‘Improved Corporate Governance Key to Investor Protection’.
Summary of Key Findings:
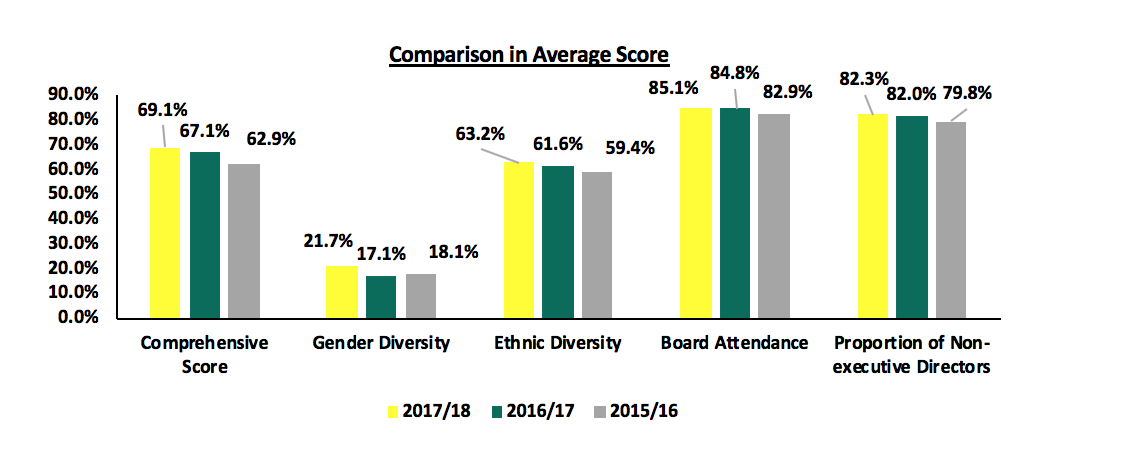
- Improvement in Overall Governance: Compared to last year, the average performance for companies has improved by 2.0% points to an average score of 69.1% from 67.1% in 2017, and by 6.2% points from 62.9% in 2016, mainly driven by better disclosures around governance. This is an indication that Kenyan listed companies are firming up to better governance practices, which is expected to lead to better performance of various companies,
- Improvement in Ethnic Diversity: Companies also registered better performance on ethnic diversity with an average score of 63.2% compared to a score of 61.6% registered last year. A higher score on ethnic diversity indicates better assortment in board composition, which improves the quality of decision making and enhances creativity and innovation translating to better performance by the companies,
- Improvement in Gender Diversity: The average score on gender diversity, also improved to 21.7% from 17.1% in 2017,
- Improvement in Board Attendance: The average board attendance also increased to 85.1% from 84.8% in 2016,
- Improvement in % of Non-Executive Directors: Average proportion of non-executive directors on the board also increased to 82.3% from 82.0% in 2016, and,
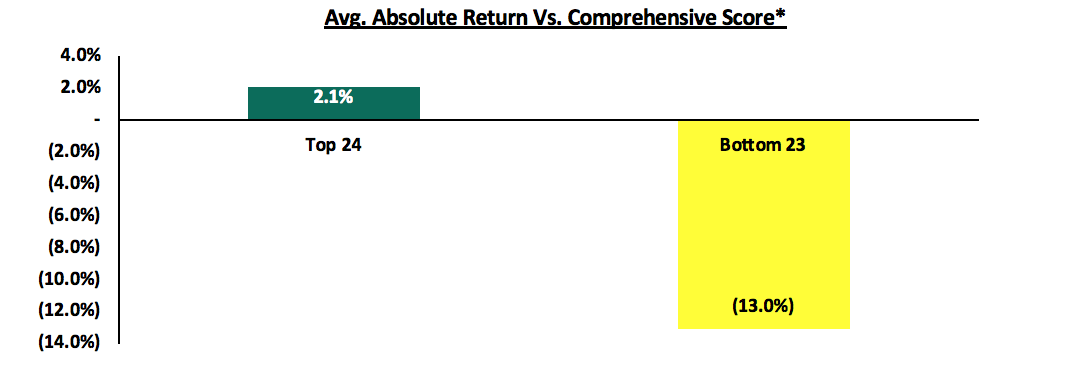
- Strong Correlation Between Governance Score and Returns to Shareholders: The top 24 companies in the Cytonn Corporate Governance Report (CGR) have delivered an absolute return of approximately 2.1% over the last 5-years compared to the bottom 23 companies, which have delivered an absolute return of (13.0%) over the last 5-years.
The improvement across the board is an indication that more companies are on track to full compliance to the CMA’s Code of Corporate Governance Practices, which will be key in achieving this. Below is a graph highlighting the comparison in average score under the comprehensive score, ethnic diversity and gender diversity categories.
Below is a summary of the top 10 companies in the categories cited above;
|
Table 1 - Top 10 by Comprehensive Score |
||||
|
Company |
Current Score |
Previous Score |
Current Position |
Previous Position |
|
KCB |
85.4% |
91.7% |
1 |
1 |
|
NSE |
85.4% |
81.3% |
1 |
5 |
|
Safaricom |
85.4% |
81.3% |
1 |
5 |
|
DTB Bank |
83.3% |
85.4% |
4 |
2 |
|
CIC |
81.3% |
79.2% |
5 |
8 |
|
Standard Chartered |
79.2% |
83.3% |
6 |
3 |
|
NIC |
79.2% |
68.8% |
6 |
21 |
|
Kenya Power & Lighting Co Ltd |
79.2% |
79.2% |
6 |
8 |
|
BAT Kenya |
77.1% |
79.2% |
9 |
8 |
|
East Africa Breweries |
77.1% |
79.2% |
9 |
8 |
|
Table 2 - Top 10 by Ethnic Diversity Ranking |
||||
|
Company |
Current Score |
Previous Score |
Current Position |
Previous Position |
|
Sanlam Kenya |
87.5% |
87.5% |
1 |
1 |
|
ARM** |
87.5% |
77.8% |
1 |
7 |
|
East Africa Breweries |
81.8% |
81.8% |
3 |
3 |
|
Kenya Re |
81.8% |
72.7% |
3 |
15 |
|
Kenol/Kobil |
80.0% |
75.0% |
5 |
9 |
|
National Bank |
80.0% |
75.0% |
5 |
10 |
|
Nation Media Group |
80.0% |
71.4% |
5 |
17 |
|
KCB Group |
77.8% |
81.8% |
8 |
2 |
|
BAT Kenya |
77.8% |
77.8% |
8 |
6 |
|
Standard Group |
77.8% |
75.0% |
8 |
14 |
** ARM Significantly improved it’s score after the recent board reshuffle in an effort to remedy the current ongoing crisis
|
Table 3- Top 10 by Gender Diversity Rank |
||||
|
Company |
Current Score |
Previous Score |
Current Position |
Previous Position |
|
Barclays |
50.0% |
50.0% |
1 |
1 |
|
Mumias Sugar |
44.4% |
40.0% |
2 |
2 |
|
Kenol/Kobil |
40.0% |
0.0% |
3 |
41 |
|
Stanbic Holdings |
40.0% |
18.2% |
3 |
24 |
|
Centum |
40.0% |
27.3% |
3 |
13 |
|
B.O.C Kenya |
37.5% |
37.5% |
6 |
3 |
|
Safaricom |
36.4% |
30.0% |
7 |
7 |
|
Housing Finance |
33.3% |
33.3% |
8 |
4 |
|
Kengen |
33.3% |
27.3% |
8 |
15 |
|
BAT Kenya |
33.3% |
22.2% |
8 |
17 |
In comparison to last year, a number of companies recorded improvement in their comprehensive score due to various reasons, as outlined below:
- Limuru Tea: It was the most improved company with a score of 41.7% from a score of 16.7% in our last report. This was due to (i) increase of board members to an odd number, (ii) introduction of a female board member, and (iii) better disclosure on board member details, work experience, and remuneration.
- Kenya Re: Kenya Re’s score improved to 75.0% from a score of 60.4% last year. This was due to better disclosures around the directors’ ages and CEO’s contract of service and positive correlation between remuneration and earnings.
- Carbacid: The company’s score improved to 75.0% from 60.4% also due to better disclosure on board composition, correlation between remuneration and earnings and an odd number of board members.
Key to note from all these companies is the common improvement in disclosures, which forms an integral part in corporate governance.
On the contrary, a number of companies also recorded declines in their comprehensive score, including:
- ARM Cement: ARM Cement recorded a decline to a comprehensive score of 58.3% from a score of 66.7% in our last report. This was due to lack correlation between board remuneration and earnings, shareholding of the board, and evenness of the board.
- I&M Holdings: The company’s score declined to 66.7% from a score of 75.0% last year attributed to increase in tangible common ratio, change of audit committee composition to include more non-executive directors and increased director’s shareholding.
- Barclays: Barclays saw its score drop to 72.9% from a previous score of 79.2%. This is due to change in composition of the audit committee to include more non-executive board members, and increased loans to directors.
Correlation between governance score and returns: We continue to highlight the strong correlation between corporate governance and returns on stocks of the listed entities.
- The top 24 companies in the Cytonn Corporate Governance Report (CGR) have delivered an absolute return of approximately 2.1% over the last 5-years compared to the bottom 23 companies, which have delivered an absolute return of (13.0%) over the last 5-years, meaning that the advantage to better governance delivered 15.1% better returns to shareholders.
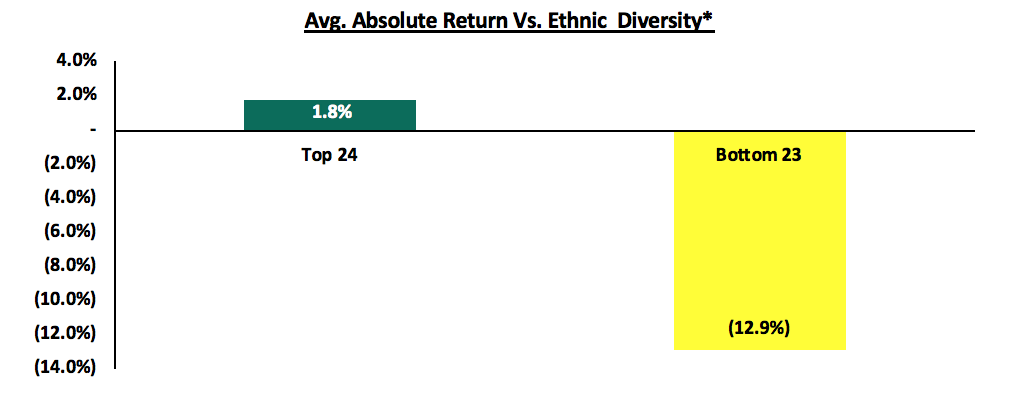
- Top 24 companies under the ethnic diversity criteria recorded a 5-year absolute return of 1.8% compared to a negative return of 12.9% recorded by the bottom 23 companies. This again indicates that the advantage to better governance delivered 14.7% better returns to shareholders as highlighted below:
- Under gender diversity, the top 24 companies delivered a 5-year absolute return of 16.7% compared to a negative return of 29.6% recorded by bottom 23 companies. This metric gave the widest margin with the top companies having outperformed the bottom half by 46.3%.
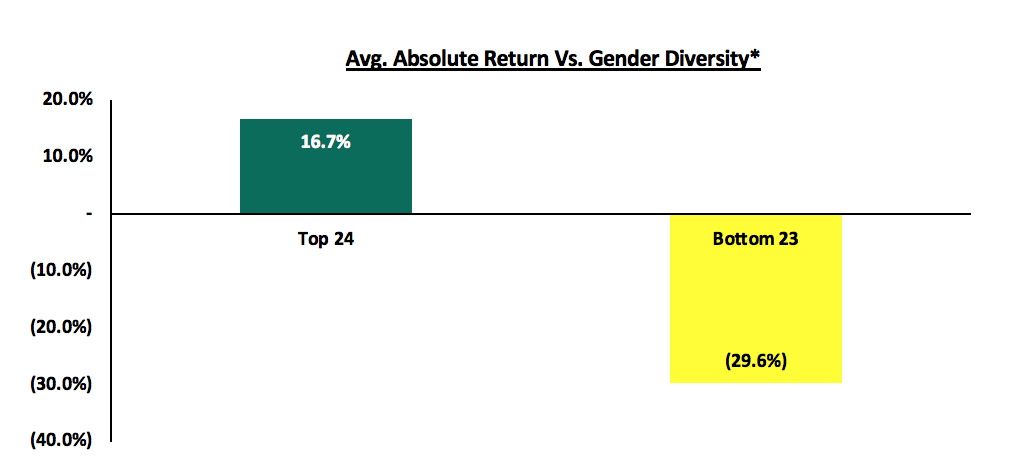
These three graphs indicate the strong correlation between the level of governance in an entity and the investor sentiments on the company as measured by the performance of its stock.
*We have excluded agricultural stocks due to their repricing as they were priced due to their real estate holdings.
As shown in the above graphs, sound corporate governance is essential to well-functioning and vibrant financial markets. Kenyan listed entities are firming up to sound corporate governance practices as shown by overall improvement in market score from 62.9% in 2016 to 69.1% in 2018, the improvement is supported by increased regulation from various bodies and organizations responsible for corporate governance oversight and greater focus on governance, which is essential for stability of the companies and the general market. We therefore hope that the regulations put in place will go a long way in instilling a proper governance culture and ultimately, deepening the capital markets.
For the comprehensive report please see our Cytonn Corporate Governance Report 2018
Appendix: below is a ranking of all the listed entities that we ranked:
|
Cytonn's Corporate Governance Report Comprehensive Score Ranking |
||||||
|
Company |
Current Score |
2017 Score |
2016 Score |
Current Ranking |
2017 Ranking |
2016 Ranking |
|
KCB |
85.4% |
91.7% |
95.8% |
1 |
1 |
1 |
|
NSE |
85.4% |
81.3% |
68.8% |
1 |
5 |
15 |
|
Safaricom |
85.4% |
81.3% |
83.3% |
1 |
5 |
2 |
|
DTB Bank |
83.3% |
85.4% |
75.0% |
4 |
2 |
9 |
|
CIC |
81.3% |
79.2% |
64.6% |
5 |
8 |
25 |
|
Standard Chartered |
79.2% |
83.3% |
83.3% |
6 |
3 |
2 |
|
NIC |
79.2% |
68.8% |
66.7% |
6 |
21 |
18 |
|
Kenya Power & Lighting Co Ltd |
79.2% |
79.2% |
68.8% |
6 |
8 |
15 |
|
BAT Kenya |
77.1% |
79.2% |
77.1% |
9 |
8 |
5 |
|
East Africa Breweries |
77.1% |
79.2% |
77.1% |
9 |
8 |
5 |
|
Liberty |
77.1% |
81.3% |
66.7% |
9 |
5 |
18 |
|
Jubilee Holdings |
77.1% |
83.3% |
77.1% |
9 |
3 |
5 |
|
Kenya Re |
75.0% |
60.4% |
58.3% |
13 |
33 |
32 |
|
Carbacid Investments |
75.0% |
60.4% |
45.8% |
13 |
33 |
44 |
|
Standard Group |
75.0% |
70.8% |
60.4% |
13 |
20 |
28 |
|
Kengen |
75.0% |
75.0% |
79.2% |
13 |
16 |
4 |
|
EQUITY |
75.0% |
75.0% |
72.9% |
13 |
16 |
10 |
|
National Bank |
75.0% |
77.1% |
68.8% |
13 |
14 |
15 |
|
Umeme Ltd Ord 0.50 |
75.0% |
77.1% |
72.9% |
13 |
14 |
10 |
|
COOP |
75.0% |
79.2% |
70.8% |
23 |
8 |
13 |
|
Britam |
72.9% |
60.4% |
54.2% |
21 |
33 |
38 |
|
Sasini |
72.9% |
64.6% |
60.4% |
21 |
27 |
28 |
|
WPP Scan Group |
72.9% |
66.7% |
45.8% |
21 |
27 |
44 |
|
Barclays |
72.9% |
79.2% |
77.1% |
21 |
8 |
5 |
|
Kenya Airways |
70.8% |
60.4% |
66.7% |
25 |
33 |
18 |
|
Nation Media Group |
70.8% |
64.6% |
58.3% |
25 |
27 |
32 |
|
Sanlam Kenya |
68.8% |
72.9% |
70.8% |
27 |
19 |
13 |
|
Centum |
68.8% |
64.6% |
64.6% |
27 |
27 |
18 |
|
Kenol/Kobil |
66.7% |
54.2% |
52.1% |
28 |
42 |
40 |
|
Longhorn Publishers |
66.7% |
72.9% |
67.0% |
28 |
||
|
I&M Holdings |
66.7% |
75.0% |
72.9% |
28 |
16 |
10 |
|
Stanbic Holdings |
64.6% |
58.3% |
56.3% |
32 |
40 |
35 |
|
TPS East Africa |
64.6% |
64.6% |
58.3% |
32 |
27 |
32 |
|
Unga |
64.6% |
64.6% |
66.7% |
32 |
27 |
18 |
|
Total Kenya Ltd Ord 5.00 |
64.6% |
65.2% |
65.2% |
32 |
26 |
24 |
|
Housing Finance |
64.6% |
66.7% |
60.4% |
32 |
22 |
28 |
|
East Africa Portland Cement |
62.5% |
60.4% |
50.0% |
37 |
33 |
42 |
|
B.O.C Kenya |
62.5% |
60.4% |
56.3% |
37 |
33 |
35 |
|
Trans-Century Ltd Ord 0.50 AIM |
62.5% |
62.5% |
56.3% |
37 |
32 |
35 |
|
Bamburi |
62.5% |
66.7% |
66.7% |
47 |
22 |
18 |
|
Mumias Sugar |
60.4% |
52.1% |
52.1% |
41 |
45 |
40 |
|
ARM |
58.3% |
66.7% |
64.6% |
42 |
22 |
25 |
|
Crown Paints |
56.3% |
50.0% |
43.8% |
43 |
47 |
46 |
|
Williamson Tea |
54.2% |
52.1% |
47.9% |
44 |
45 |
43 |
|
Kakuzi |
54.2% |
54.2% |
60.4% |
44 |
42 |
28 |
|
Limuru Tea |
41.7% |
16.7% |
18.8% |
46 |
49 |
49 |
|
Kenya orchards |
10.4% |
10.4% |
10.4% |
47 |
50 |
50 |
|
Average Comprehensive Score |
69.1% |
67.1% |
62.9% |
|
|
|
Disclaimer: The views expressed in this publication, are those of the writers where particulars are not warranted. This publication, which is in compliance with Section 2 of the Capital Markets Authority Act Cap 485A, is meant for general information only, and is not a warranty, representation, advice or solicitation of any nature. Readers are advised in all circumstances to seek the advice of a registered investment advisor.

- Talk to us
- Kenya
- P.O Box 20695 - 00200, Nairobi, Kenya
- Cell +254709101200
- Tel +254709101200
- WhatsApp +254741676635
- United States
- +254709101200
- DOWNLOAD OUR APP
-


- Kenya
- 8th Floor, Pinetree Plaza, Kaburu Drive, Ngong Road, Nairobi, Kenya
- USA
- Suite 1150, 1775 Eye Street NW, USA, Washington DC 20006, USA
- Investments
- High Yield
- Private Equity
- Real Estate
- Real Estate
- RiverRun Estates
- Cytonn Towers
- The Ridge
- Taraji Heights
- The Alma