Kenya Listed Banks Q1’2018 Report, & Cytonn Weekly #24/2018
By Cytonn Research Team, Jun 17, 2018
Executive Summary
Fixed Income
T-bills were oversubscribed during the week, with the subscription rate coming in at 259.5% up from 210.5%, the previous week. Yields on the 91- day, 182-day and 364-day papers declined by 10 bps, 30 bps and 20 bps to 7.8%, 9.8% and 10.7% from 7.9%, 10.1% and 10.9%, respectively, the previous week. The National Treasury officially released the FY 2018/19 Budget Statement. Total expenditure is estimated at Kshs 2.5 tn, revenue target at Kshs 1.9 tn, and the budget deficit at 5.7% of GDP;
Equities
During the week, the equities market recorded mixed performance with NASI gaining 0.9%, while NSE 20 and NSE 25 both declined by 0.1%. For the last twelve months (LTM), NASI and NSE 25 have gained 17.2% and 13.1%, respectively, while NSE 20 has declined by 4.5%. Fitch assigned KCB Group a B+ rating with stable outlook owing to its solid earnings;
Private Equity
In the Financial Services sector, Swiss Re, a reinsurance company based in Zurich Switzerland has entered into a share purchase agreement with a key shareholder of Britam (Plum LLP) to acquire a 13.8% stake in Britam at Kshs 4.8 bn by acquiring 348.5 mn shares at a price of Kshs 13.8 per share;
Real Estate
During the week, the Lands Ministry unveiled the National Land Use Policy (NLUP), Sessional paper No 1 of 2017, which is meant to provide guidance for the management and efficient utilization of land as per the constitution of Kenya. The County Government of Kiambu has called for developers in the wake of its plan of putting up a total of 19,500 housing units in an affordable housing rent-to-own scheme that will target urban residents of Kiambu as well as County Government staff;
Focus of the Week
Following the release of the Q1’2018 results by Kenyan listed banks, we analyse the results of the listed banks for Q1’2018 to determine which banks are the most attractive and stable for investment from a franchise value and from a future growth (intrinsic value) standpoint. The theme for the quarter is “Diversification and efficiency key to growth amidst tighter regulation. Asset quality remains a concern” as we assess what factors will be crucial for sustainable growth and stability of the Kenyan banking sector going forward;
- Our Senior Investment Analyst, Caleb Mugendi, discussed the fiscal year 2018/19 National Budget expectations .Watch Caleb on Citizen TV here and on Lolwe TV here
- Our Senior Finance Associate, Samuel Ng’ang’a, discussed the expectations of the 2018/19 budget and the budget estimates for the Big Four Agenda. Watch Samuel on KTN here
- Our Audit Associate, David Mola, discussed the 2018/19 fiscal year budget. Watch David on Citizen TV here and on KBC here
- Our Senior Investment Manager, Maurice Oduor, engaged in pre-budget discussions. Watch Maurice on Citizen TV here
- Our Investment Analyst, Stephanie Onchwati, discussed expectations for the 2018/19 national budget. Watch Stephanie on CNBC here
- Our Senior Investment Analyst, John Ndua, discussed the actual 2018/19 budget as per the FY 2018/19 Budget Statement read by the Treasury CS. Watch John on KBC here
- We continue to hold weekly workshops and site visits on how to build wealth through real estate investments. The weekly workshops and site visits target both investors looking to invest in real estate directly and those interested in high yield investment products to familiarize themselves with how we support our high yields. Watch progress videos and pictures of The Alma, Amara Ridge, The Ridge, and Taraji Heights. Key to note is that our cost of capital is priced off the loan markets, where all-in pricing ranges from 16.0% to 20.0%, and our yield on real estate developments ranges from 23.0% to 25.0%, hence our top-line gross spread is about 6.0%. If interested in attending the site visits, kindly register here
- We continue to see very strong interest in our weekly Private Wealth Management Training (largely covering financial planning and structured products). The training is at no cost and is open only to pre-screened participants. We also continue to see institutions and investment groups interested in the trainings for their teams. The Wealth Management Trainings are run by the Cytonn Foundation under its financial literacy pillar. If interested in our Private Wealth Management Training for your employees or investment group please get in touch with us through wmt@cytonn.com. To view the Wealth Management Training topics, click here
- For recent news about the company, see our news section here
- We have 10 investment-ready projects, offering attractive development and buyer targeted returns of around 23.0% to 25.0% p.a. See further details here: Summary of Investment-Ready Projects
- We continue to beef up the team with ongoing hires for: Chief Executive Officer Cytonn Education Services (CES), Full Stack Software Engineer, Unit Manager-Nairobi. Visit the Careers section on our website to apply
T-Bills & T-Bonds Primary Auction:
T-bills were oversubscribed during the week, with the subscription rate coming in at 259.5% up from 210.5%, the previous week. The subscription rates for the 91, 182 and 364-day papers came in at 137.9%, 221.6%, and 345.9% compared to 21.9%, 173.5%, and 322.9%, respectively, the previous week. Subscription picked up for the 91 and 182-day papers as investors keep short before the start of the next borrowing cycle where the government will once again be behind borrowing target. Yields on the 91- day, 182-day and 364-day papers declined by 10 bps, 30 bps and 20 bps to 7.8%, 9.8% and 10.7% from 7.9%, 10.1% and 10.9%, respectively, the previous week. The acceptance rate for T-bills declined to 29.5% from 40.5%, the previous week, with the government accepting a total of Kshs 18.3 bn of the Kshs 62.3 bn worth of bids received, against the Kshs 24.0 bn on offer. The acceptance rate continued to decline due to the government cutting down on local borrowing since it is currently 32.9% ahead of its pro-rated domestic borrowing target for the current fiscal year, having borrowed Kshs 380.2 bn, against a target of Kshs 286.2 bn (assuming a pro-rated borrowing target throughout the financial year of Kshs 297.6 bn).
For the month of June 2018, the Kenyan Government has issued a new 25-year Treasury bond (FXD 1/2018/25) with the coupon set at 13.4%, in a bid to raise Kshs 40.0 bn for budgetary support. The issuance of the long tenor bond has been attributed to efforts by the Government to lengthen the maturity profile of local currency denominated debt as the average duration of total domestic government securities stood at 4.2 years as at April. Given that (i) the government is currently 32.9% ahead of its pro-rated domestic borrowing target for the current fiscal year, and has collected 79.1% of its total foreign borrowing target, we don’t expect the government to come under pressure to borrow. We also don’t expect upward pressure on interest rates during the same period due to the decision by the Monetary policy committee to retain the CBR at 9.5% in May 2018. As such, we expect the average yield for the new bond issue to come in between 13.4% and 13.7%.
Liquidity:
The average interbank rate declined to 3.6% from 4.1%, the previous week, while the average volumes traded in the interbank market declined by 33.9% to Kshs 14.4 bn from Kshs 21.8 bn, the previous week. The decline in the average interbank rate also points to improved liquidity, which can be attributed to the government’s reduced borrowing appetite as evidenced by the 29.5% acceptance rate in the T-bill auction this week. The government’s reduced borrowing appetite has resulted in banks holding excess cash, which is likely to trickle down to the private sector before the start of the next fiscal year.
Kenya Eurobonds:
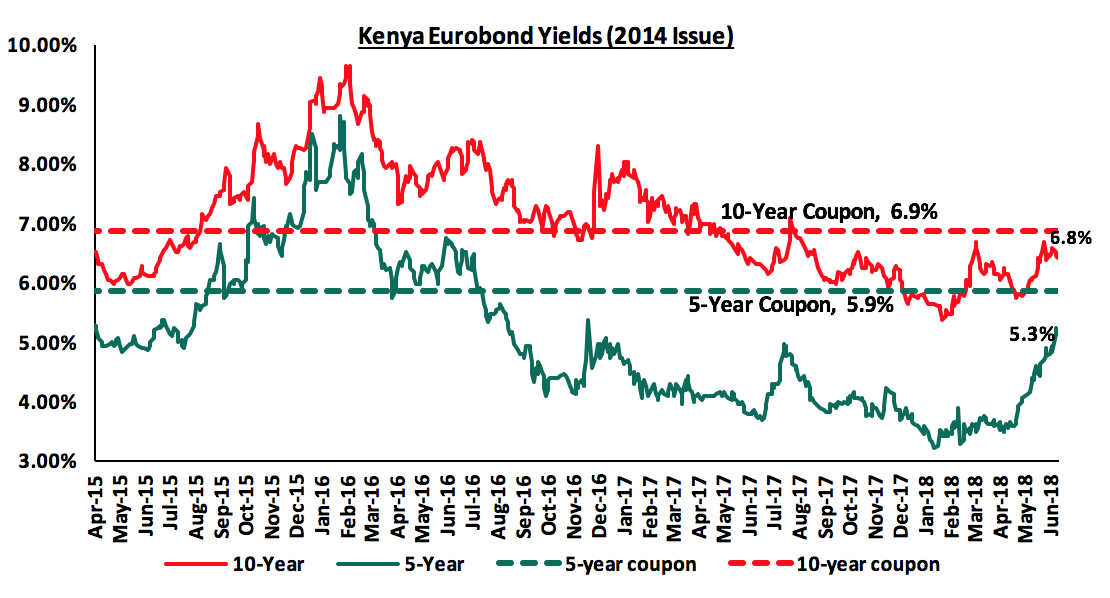
According to Bloomberg, the yield on the 5-year Eurobond issued in 2014 declined by 10 bps to 5.3% from 5.4%, while the 10-year Eurobond remained unchanged at 6.8%, from the previous week. Since the mid-January 2016 peak, yields on the Kenya Eurobonds have declined by 3.5% points and 2.9% points for the 5-year and 10-year Eurobonds, respectively, an indication of relatively stable macroeconomic conditions in the country.
For the February 2018 Eurobond issue, during the week, the yields on the 10-year and 30-year Eurobonds remained unchanged at 7.4% and 8.4%, respectively. Since the issue date, yields on the 10-year and 30-year Eurobonds have both increased by 0.1% points, respectively.
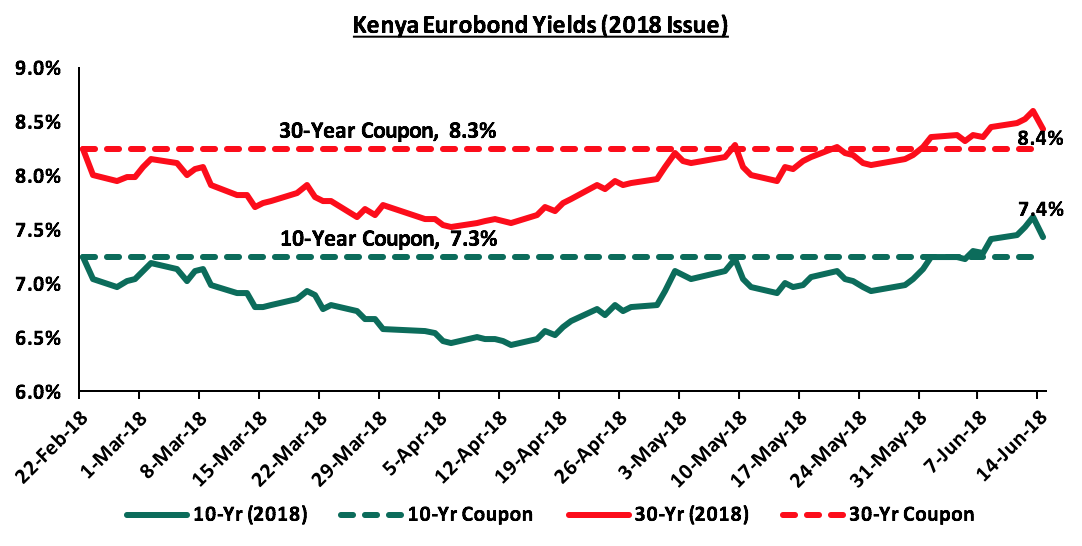
We have noted the recent rise in Kenya Eurobond yields and this may be attributed to the current corruption scandals erupting in the country that seem to have led to varying sentiments across the market.
The Kenya Shilling:
During the week, the Kenya Shilling depreciated by 0.3% to close at Kshs 101.1 from Kshs 100.8, the previous week, due to a surge in dollar demand by oil importers. On a YTD basis, the shilling has gained 2.0% against the USD. In our view, the shilling should remain relatively stable against the dollar in the short term, supported by:
- The narrowing of the current account deficit which stood at 6.1% of GDP as at March 2018 from 6.4% in December 2017,
- Stronger inflows from principal exports which include coffee, tea and horticulture which increased by 9.3% during the month of April to Kshs 21.9 bn from Kshs 20.0 bn in a similar period the previous year, with the exports from coffee, and horticulture increasing by 6.7%, and 25.0% y/y respectively, while tea exports have declined marginally by 1.6% y/y.
- Improving diaspora remittances, which increased by 56.6% to USD 217.1 mn in April 2018 from USD 138.6 mn in April 2017 with the bulk contribution coming from North America at USD 114.0 attributed to (a) recovery of the global economy, (b) increased uptake of financial products by the diaspora due to financial services firms, particularly banks, targeting the diaspora, and (c) new partnerships between international money remittance providers and local commercial banks making the process more convenient, and,
- High forex reserves, currently at USD 9.0 bn (equivalent to 6.0 months of import cover) and the USD 1.5 bn stand-by credit and precautionary facility by the IMF, still available until September 2018.
Weekly Highlights:
During the week, the National Treasury officially read the FY 2018/19 Budget on 14th June 2018. Below are some of the key highlights:
|
Amounts in Kshs tns unless stated otherwise |
|||||||||||
|
Comparison of 2017/18 and 2018/19 Fiscal Year Budgets |
|||||||||||
|
|
2018/19 |
% change 2017/18 to 2018/19 |
2017/18 |
% change 2016/17 to 2017/18 |
2016/17 |
||||||
|
Revenue |
1.9 |
14.5% |
1.7 |
9.6% |
1.5 |
||||||
|
Recurrent expenditure |
1.5 |
7.7% |
1.4 |
13.3% |
1.2 |
||||||
|
Development expenditure |
0.6 |
7.8% |
0.6 |
(27.3%) |
0.8 |
||||||
|
County governments |
0.4 |
7.3% |
0.4 |
16.4% |
0.3 |
||||||
|
Total expenditure |
2.5 |
7.7% |
2.3 |
(0.2%) |
2.3 |
||||||
|
Deficit as % of GDP |
(5.7%) |
1.5% |
(7.2%) |
1.9% |
(9.1%) |
||||||
|
Net foreign borrowing |
0.3 |
(11.2%) |
0.3 |
(30.3%) |
0.5 |
||||||
|
Net domestic borrowing |
0.3 |
(8.6%) |
0.3 |
(14.7%) |
0.3 |
||||||
|
Total borrowing |
0.6 |
(10.0%) |
0.6 |
(23.6%) |
0.8 |
||||||
Key take-outs from the table:
- Total expenditure in the fiscal year 2018/2019 is set to increase by 7.3%, to Kshs 2.5 tn from Kshs 2.3 tn in the fiscal year 2017/18,
- Development expenditure is set to increase at a slightly faster rate than recurrent expenditure; with recurrent increasing by 7.7% to Kshs 1.5 tn from Kshs 1.4 tn, while development will increase by 7.8% to Kshs 625.0 bn from Kshs 579.6 bn in FY 2017/18,
- The budget deficit is projected to decline to 5.7% of GDP from an estimated 7.2% of GDP in the FY 2017/18; in line with the International Monetary Fund’s (IMF’s) recommendation, in a bid to reduce Kenya’s public debt requirements,
- The total borrowing requirement to plug in the deficit is expected to decline to Kshs 558.9 bn from Kshs 620.8 bn, in a bid to reduce Kenya’s public debt burden which is estimated at 55.6% of GDP as at 2017 by the IMF, 5.6% above the East African Community (EAC) Monetary Union Protocol, the World Bank Country Policy and Institutional Assessment Index, and the IMF threshold of 50.0%, but well below the 74.0% mark considered a signal for debt unsustainability, and,
- Debt financing of the 2018/19 budget is split 51:49 between foreign and domestic borrowing, with the foreign and domestic debt being estimated at Kshs 287.0 billion (equivalent to 3.0 percent of GDP) and Kshs 271.9 billion (equivalent to 2.8 percent of GDP), respectively.
Key to note is that the Treasury proposed a repeal of the interest rate cap, subject to passing by the National Assembly, stating that the rate cap had not achieved its intended purpose; this is after failing to mention it in the Draft Financial Markets Conduct Bill, 2018 – see our Focus Note on the Conduct Bill here. In terms of revenue collection, in addition to the expected implementation of the 16.0% VAT on petroleum products from September, the National Treasury has also proposed the widening of the tax base through, (i) the raising of excise duty fee on cellular money transfer services to 12.0% from 10.0%, previously, and (ii) introduction of a robin hood tax of 0.05% on any amount exceeding Kshs 500,000 transferred through financial institutions.
The US Federal Reserve Open Market Committee (FOMC) met during the week, on Wednesday 13th June, 2018 to assess the state of the US economy and agree on a path for the US Monetary Policy. The Fed decided to increase the federal funds rate to a band of 1.75% - 2.00%, from 1.5% - 1.75% previously, being the second hike in 2018. The decision by the Fed to hike rates was based on:
- Economic Growth: economic growth in the US remained relatively stable, growing at 2.3% in Q1’2018, and expected to rise to 2.8% going forward,
- Employment: the US employment rate has improved over the last 12 months, with unemployment in May coming in at 3.8%, an 18- year low as compared to 5.0% which is considered full employment, indicating a strengthening labor market,
- Inflation: core inflation has been increasing, hitting 2.2% in May, a rise from 2.1% in April and a 15-month high since February 2017.
Given the stable economic growth expected in 2018, the Fed is now expected to further hike the federal funds rate two more times this year, up from only one additional hike before the FOMC meeting.
Rates in the fixed income market have remained stable, and even begun on a declining trend as the government rejects expensive bids with the government being under no pressure to borrow for the remaining part of the current fiscal year as: (i) they are currently ahead of their domestic borrowing target by 32.9%, (ii) they have met 79.1% of their total foreign borrowing target and 82.2% of their pro-rated target for the current fiscal year, and (iii) the KRA is not significantly behind target in revenue collection. Come the next fiscal year, the government is likely to remain behind target for the better part of the first half as per historical data. As per the newly released 2018/19 budget, the domestic borrowing target is at Kshs 271.9 bn, 8.6% lower than the current fiscal year’s target, which may result in reduced pressure on domestic borrowing. The National Treasury has also proposed to repeal the interest rate cap, which if repealed can result in upward pressure on interest rates, as banks resume the rate of lending to the private sector who they will be able to price differently based on their risk profiles. However, with the cap still in place and the proposal subject to National Assembly passing, we maintain our expectation of stability in the interest rate environment. With the expectation of a relatively stable interest rate environment, our view is that investors should be biased towards medium to long-term fixed income instruments.
Market Performance:
During the week, the equities market recorded mixed performance with NASI gaining 0.9%, while NSE 20 and NSE 25 both declined by 0.1%. This takes the YTD performance of the NASI, NSE 20 and NSE 25 to 4.1%, (9.8%) and 6.3%, respectively. This week’s performance was mixed, with gains by KCB Group, Safaricom, NIC Group and Bamburi of 1.0%, 0.8%, 0.7% and 0.6%, respectively; being offset by declines in Co-operative Bank, East Africa Breweries, Equity Group of 2.9%, 2.7%, and 1.0%, respectively. For the last twelve months (LTM), NASI and NSE 25 have gained 17.2% and 13.1%, respectively, while NSE 20 has declined by 4.5%.
Equities turnover declined by 4.0% this week to USD 32.3 mn from USD 33.6 mn the previous week, with foreign investors making up the bulk of market activity during the week. We expect the market to remain resilient this year supported by positive investor sentiment, as investors take advantage of the attractive stock valuations in select counters.
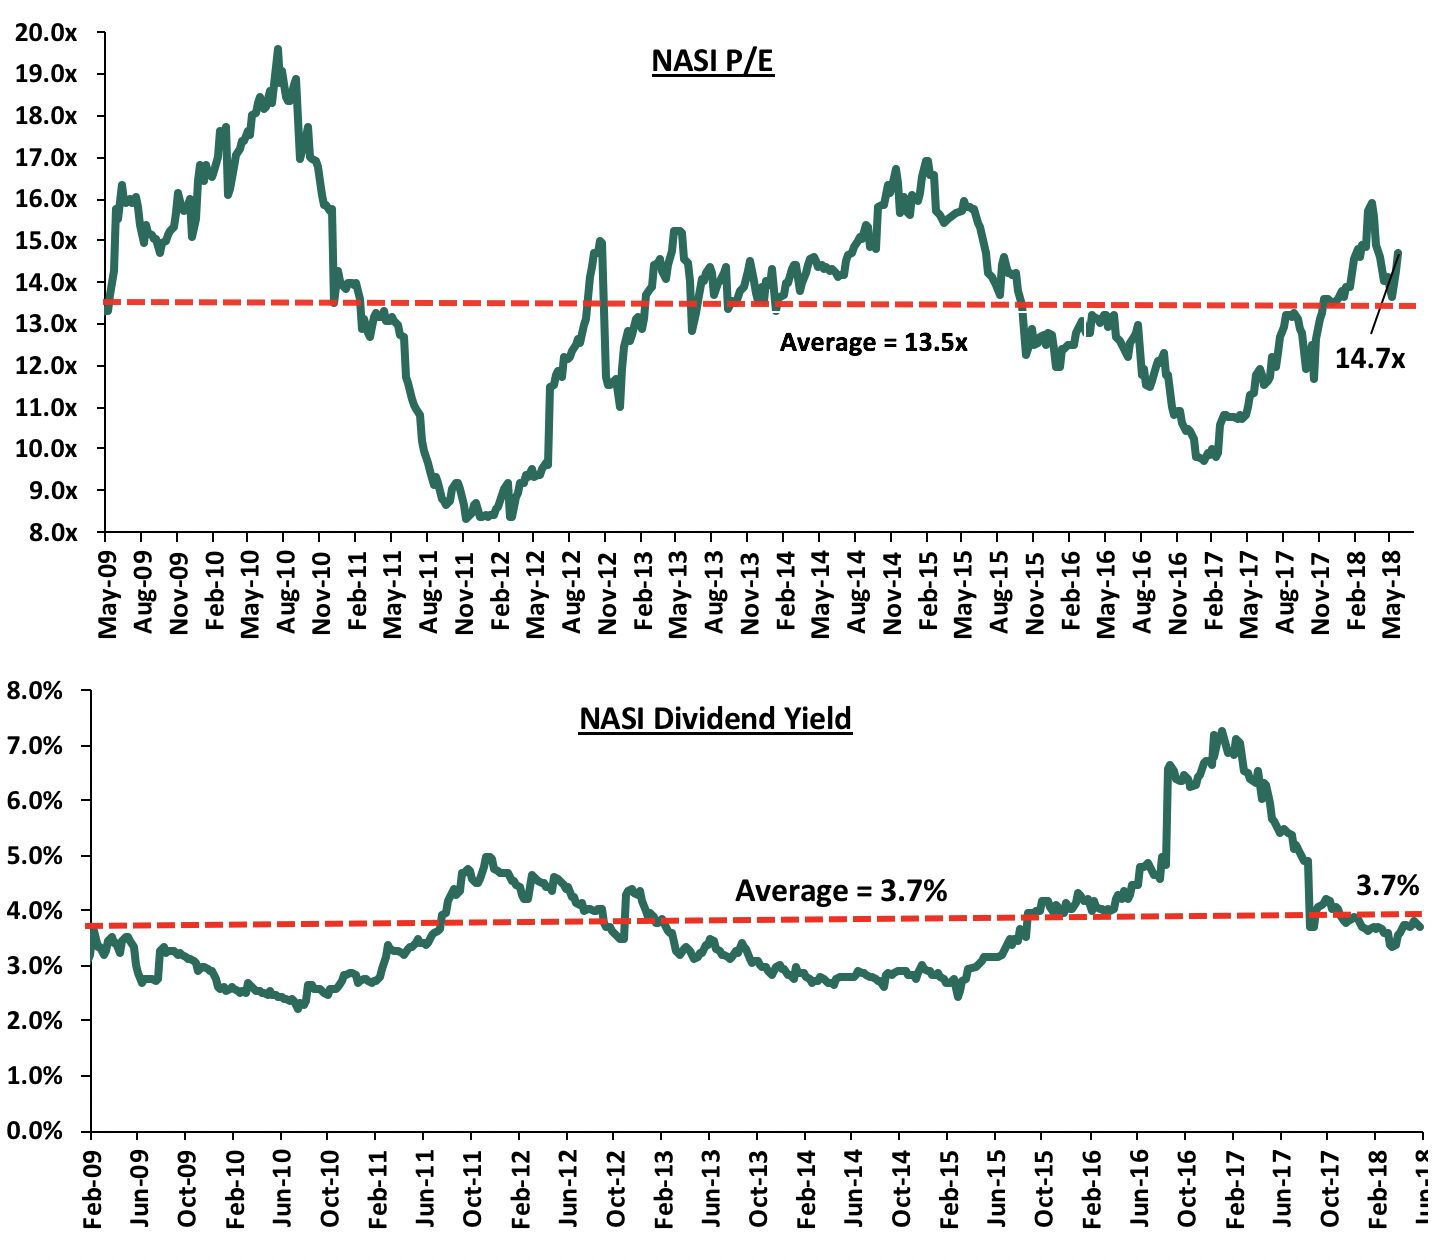
The market is currently trading at a price to earnings ratio (P/E) of 14.7x, which is above the historical average of 13.5x, and a dividend yield of 3.7%, consistent with the historical average of 3.7%. The current P/E valuation of 14.7x is 50.0% above the most recent trough valuation of 9.8x experienced in the first week of February 2017, and 77.1% above the previous trough valuation of 8.3x experienced in December 2011. The charts below indicate the historical P/E and dividend yields of the market.
Weekly Highlights:
Global rating agency Fitch has assigned KCB Group a Long –Term Issuer Default Ratings (IDRs) of B+ with a stable outlook. According to Fitch, the rating comes on the back of the Group’s solid earnings and profitability, and a healthy funding profile characterized by stable, low-cost customer deposits. The agency recognized KCB’s strong company profile, underpinned by its leading retail and corporate franchise in the country, in addition to the bank’s robust management quality. However, Fitch noted the banks' deteriorating asset quality, coupled with a challenging domestic operating environment for the Group. KCB Group’s non-performing loans increased by 36.2% y/y to Kshs 43.8 bn from Kshs 32.2 bn in Q1’2017. Owing to KCB Group’s business activities being concentrated in Kenya, neither KCB Group nor KCB Bank can be rated above Kenya’s (sovereign) rating of (B+). The stable outlook therefore reflects the stable outlook on the Kenyan sovereign rating. KCB’s strategy hinges on consolidating its position in existing markets and growing their customer base by utilizing digital banking channels. The rating underlines the bank’s ability to meet its financial commitments as it focuses on improving its competitive position in key products and services across its subsidiaries in the region.
Equities Universe of Coverage:
Below is our Equities Universe of Coverage:
|
Banks |
Country- Currency |
Price as at 8/06/2018 |
Price as at 14/06/2018 |
w/w change |
YTD Change |
LTM Change |
Target Price* |
Dividend Yield |
Upside/ Downside** |
P/TBv Multiple |
|
Ghana Commercial Bank |
Ghanaian Cedi |
5.9 |
5.2 |
(13.0%) |
2.4% |
(0.6%) |
7.7 |
7.4% |
56.7% |
1.3x |
|
NIC Bank*** |
Kenya Shilling |
35.0 |
35.3 |
0.7% |
4.4% |
25.1% |
54.1 |
2.8% |
56.3% |
0.8x |
|
Diamond Trust Bank |
Kenya Shilling |
195.0 |
195.0 |
0.0% |
1.6% |
30.0% |
280.1 |
1.3% |
45.0% |
1.1x |
|
I&M Holdings |
Kenya Shilling |
120.0 |
120.0 |
0.0% |
(5.5%) |
18.8% |
169.5 |
2.9% |
44.2% |
1.2x |
|
Zenith Bank |
Nigerian Naira |
27.1 |
26.4 |
(2.4%) |
3.0% |
20.6% |
33.3 |
10.2% |
36.4% |
1.1x |
|
Union Bank Plc |
Nigerian Naira |
5.6 |
6.2 |
10.7% |
(20.5%) |
17.6% |
8.2 |
0.0% |
31.5% |
0.6x |
|
CRDB |
Tanzania Shilling |
160.0 |
160.0 |
0.0% |
0.0% |
(5.9%) |
207.7 |
0.0% |
29.8% |
0.5x |
|
KCB Group |
Kenya Shilling |
48.0 |
48.5 |
1.0% |
13.5% |
27.6% |
60.9 |
4.1% |
29.7% |
1.5x |
|
Barclays |
Kenya Shilling |
11.9 |
11.9 |
(0.4%) |
23.4% |
24.7% |
14.0 |
8.4% |
26.6% |
1.5x |
|
HF Group*** |
Kenya Shilling |
8.0 |
8.5 |
6.3% |
(18.3%) |
(7.0%) |
10.2 |
3.8% |
23.8% |
0.3x |
|
Co-operative Bank |
Kenya Shilling |
17.5 |
17.0 |
(2.9%) |
6.3% |
17.2% |
19.7 |
4.7% |
20.6% |
1.5x |
|
Stanbic Bank Uganda |
Uganda Shilling |
32.0 |
31.5 |
(1.6%) |
15.6% |
21.2% |
36.3 |
3.7% |
18.9% |
2.0x |
|
Equity Group |
Kenya Shilling |
49.5 |
49.0 |
(1.0%) |
23.3% |
23.3% |
55.5 |
4.1% |
17.3% |
2.5x |
|
CAL Bank |
Ghanaian Cedi |
1.3 |
1.3 |
(0.8%) |
15.7% |
76.4% |
1.4 |
0.0% |
12.0% |
1.0x |
|
UBA Bank |
Nigerian Naira |
11.0 |
11.0 |
0.5% |
6.8% |
24.6% |
10.7 |
13.6% |
10.9% |
0.7x |
|
Bank of Kigali |
Rwandan Franc |
289.0 |
290.0 |
0.3% |
(3.3%) |
18.4% |
299.9 |
4.8% |
8.2% |
1.6x |
|
Ecobank |
Ghanaian Cedi |
11.3 |
10.2 |
(9.7%) |
34.2% |
60.3% |
10.7 |
0.0% |
5.2% |
2.9x |
|
Stanbic Holdings |
Kenya Shilling |
94.0 |
91.5 |
(2.7%) |
13.0% |
28.0% |
85.9 |
5.7% |
(0.4%) |
1.1x |
|
Standard Chartered |
Kenya Shilling |
200.0 |
200.0 |
0.0% |
(3.8%) |
(3.4%) |
184.3 |
6.3% |
(1.6%) |
1.6x |
|
Guaranty Trust Bank |
Nigerian Naira |
41.2 |
41.5 |
0.9% |
1.8% |
17.2% |
37.2 |
5.8% |
(4.5%) |
2.3x |
|
Access Bank |
Nigerian Naira |
10.7 |
10.6 |
(0.9%) |
1.4% |
4.8% |
9.5 |
3.8% |
(6.6%) |
0.7x |
|
SBM Holdings |
Mauritian Rupee |
7.5 |
7.4 |
(1.1%) |
(1.3%) |
1.1% |
6.6 |
4.1% |
(7.3%) |
1.1x |
|
Bank of Baroda |
Ugandan Shilling |
160.0 |
160.0 |
0.0% |
41.6% |
46.8% |
130.6 |
1.6% |
(16.8%) |
1.4x |
|
Stanbic IBTC Holdings |
Nigerian Naira |
48.2 |
49.0 |
1.7% |
18.1% |
58.0% |
37.0 |
1.2% |
(23.3%) |
2.5x |
|
Standard Chartered |
Ghanaian Cedi |
27.0 |
27.0 |
(0.1%) |
6.9% |
63.6% |
19.5 |
0.0% |
(27.9%) |
3.4x |
|
FBN Holdings |
Nigerian Naira |
10.6 |
10.9 |
2.8% |
23.3% |
54.1% |
6.6 |
2.3% |
(36.6%) |
0.6x |
|
Ecobank Transnational |
Nigerian Naira |
20.0 |
20.0 |
0.0% |
17.6% |
58.1% |
9.3 |
0.0% |
(53.6%) |
0.7x |
|
National Bank |
Kenya Shilling |
6.5 |
6.9 |
7.0% |
(26.2%) |
(18.8%) |
2.8 |
0.0% |
(59.4%) |
0.4x |
|
*Target Price as per Cytonn Analyst estimates, prices in respective local currencies |
||||||||||
|
**Upside / (Downside) is adjusted for Dividend Yield |
||||||||||
|
***Banks in which Cytonn and/or its affiliates holds a stake. For full disclosure, Cytonn and/or its affiliates holds a significant stake in NIC Bank, ranking as the 5th largest shareholder |
||||||||||
We are “NEUTRAL” on equities for investors with a short-term investment horizon since the market has rallied and brought the market P/E slightly above its’ historical average. However, pockets of value exist, with a number of undervalued sectors like Financial Services, which provide an attractive entry point for long-term investors, and with expectations of higher corporate earnings this year, we are “POSITIVE” for investors with a long-term investment horizon.
Swiss Re, a reinsurance company with offices in over 25 countries with a focus on reinsurance services, has acquired a 13.8% stake in Britam for Kshs 4.8 bn. The transaction involved the acquisition of 348.5 mn shares of Plum LLP at a price of Kshs 13.8 per share. Britam’s shares closed the week at Kshs 14.6, 6% above the transaction price. Swiss Re is now the third major international investor in Britam, after IFC acquired a 10.4% stake in 2017, and AfricInvest acquired a 14.3% stake in 2017. The transaction is the second for Swiss Re in Kenya after it acquired a 26.9% stake in Apollo Investments in 2014. The transaction indicates the company’s confidence in the long-term growth and management of Britam, and highlights the opportunity in Kenya’s financial services sector. Britam, which has offices in Kenya, Uganda, Tanzania, Rwanda, South Sudan, Mozambique and Malawi, offers a wide range of financial products and services. The acquisition was carried out at a P/B multiple of 1.3x, which is a 38.0% discount from the average insurance sector transaction P/B multiple of 2.1x over the last seven years, hence a relatively cheaper transaction valuation. The table below highlights the transaction multiples in Kenya’s insurance sector over the last seven years;
|
Insurance Sector Transaction Multiples over the last Seven Years |
|||||||
|
No. |
Acquirer |
Insurance Acquired |
Book Value (bn Kshs) |
Transaction Stake |
Transaction Value (bn Kshs) |
P/B |
Date |
|
1. |
Africa Development Corporation |
Resolution Health East Africa |
N/A |
25.1% |
0.2 |
N/A |
Dec-10 |
|
2. |
Leapfrog Investments |
Apollo Investments |
0.3 |
26.9% |
1.1 |
15.6x |
Dec-11 |
|
3. |
Saham Finances |
Mercantile Insurance |
0.5 |
66.0% |
Undisclosed |
N/A |
Jan-13 |
|
4. |
Swedfund |
AAR |
0.4 |
20.0% |
0.4 |
5.4x |
May-13 |
|
5. |
BAAM |
Continental Re Kenya |
0.7 |
30.0% |
0.3 |
1.4x |
Apr-14 |
|
6. |
Union Insurance of Mauritius |
Phoenix of East Africa |
1.8 |
66.0% |
2.0 |
1.6x |
May-14 |
|
7. |
UK Prudential |
Shield Assurance |
0.1 |
100.0% |
1.5 |
10.2x |
Sep-14 |
|
8. |
Swiss Re |
Apollo Investments |
0.6 |
26.9% |
Undisclosed |
N/A |
Oct-14 |
|
9. |
Britam |
Real Insurance Company |
0.7 |
99.0% |
1.4 |
2.1x |
Nov-14 |
|
10. |
Leap Frog Investments |
Resolution Insurance |
0.2 |
61.2% |
1.6 |
11.7x |
Nov-14 |
|
11. |
Old Mutual Plc |
UAP Holdings |
9.6 |
60.7% |
11.1 |
1.9x* |
Jan-15 |
|
12. |
MMI Holdings |
Cannon Assurance |
1.7 |
75.0% |
2.4 |
1.9x |
Jan-15 |
|
13. |
Pan Africa Insurance Holdings |
Gateway Insurance Company Ltd |
1.0 |
51.0% |
0.6 |
1.1x |
Mar-15 |
|
14. |
Barclays Africa |
First Assurance |
2.0 |
63.3% |
2.9 |
2.2x |
Jun-15 |
|
15. |
IFC |
Britam |
22.5 |
10.4% |
3.6 |
1.5x |
Mar-17 |
|
16. |
Africinvest III |
Britam |
28.5 |
14.3% |
5.7 |
1.4x |
Sep-17 |
|
17. |
Swiss Re Asset Management |
Britam |
22.6 |
13.8% |
4.8 |
1.3x |
Jun-18 |
|
|
Harmonic Mean |
|
|
29.9% |
|
2.1x |
|
|
|
Median |
|
|
55.9% |
|
1.9x |
|
*-Pro-forma transaction multiple
For Swiss Re, they have picked a compelling asset, with a solid regional presence, a strong distribution network and a diversified business strategy at a very attractive valuation of 1.3x P/B compared to a seven-year average of 2.1x, while positioning themselves within the capital markets for easier exit once they realize value. For Britam, they get a sound business partner as a significant shareholder, which will help boost their growth strategies. The lower valuations, coupled with increased capital requirements across the sector and regulatory demand for more discipline in the financial services sector, will most likely lead to more merger and acquisition (M&A) transactions over the coming years.
Private equity investments in Africa remains robust as evidenced by the increasing investor interest, which is attributed to; (i) rapid urbanization, a resilient and adapting middle class and increased consumerism, (ii) the attractive valuations in Sub Saharan Africa’s private markets compared to its public markets, (iii) the attractive valuations in Sub Saharan Africa’s markets compared to global markets, and (iv) better economic projections in Sub Sahara Africa compared to global markets. We remain bullish on PE as an asset class in Sub-Sahara Africa. Going forward, the increasing investor interest and stable macro-economic environment will continue to boost deal flow into African markets
During the week, the residential sector continued to attract activity, especially in line with the Kenya Central Government affordable housing initiative that could see the delivery of 1.0 mn units in the next four years across Kenya. The County Government of Kiambu has called for developers in the wake of its plan of putting up 12,500 housing units in a rent-to-own scheme that will target urban residents of Kiambu. The project is set to take up 50 acres of public land and will comprise of studio units, 1-bedroom, 2-bedroom and 3-bedroom units with a plinth area of 20 SQM, 30 SQM, 40 SQM and 60 SQM, selling at Kshs 0.6 mn, Kshs 0.8 mn, Kshs 2.0 mn and Kshs 3.0 mn, respectively. In addition, the County will have 7,000 units to replace old ones with first priority given to Ruiru, Juja and Kiambu towns making a total of 19,500 units to be delivered by 2022. The project aims at having 240 units per acre and will kick start with the development of 43 units, whose sizes remain undisclosed, for Thika Government Quarters residents at a cost of Kshs 30.0 mn, which translates to Kshs 697,674 per house, exclusive of land costs as it is on public land. Nairobi County also announced plans to have old low-rise units located in prime areas demolished to pave way for its own tenant purchase scheme that will see the development of 36,840 units. The demolishment will take place in public land earmarked in neighborhoods such as Starehe, Muguga Green, Shauri Moyo and Makongeni Estates for the development program. In our view, tenant purchase schemes are a step in the right direction in housing the low middle-income segment. As per the KNBS Kenya Integrated Housing Budget Survey, 89.5% of rural residents own homes in comparison to 26.5% of their urban counterparts, resulting to a huge housing deficit of approximately 2.0 mn, according to the National Housing Corporation, with the problem being more pronounced in urban areas. Affordable and social housing have been a challenge for private developers due to high land costs in Kenya, as well as lack of sufficient infrastructure in areas where land is affordable; on the other hand, public-private partnerships are challenged by: (i) Regulatory hindrances such as lack of a mechanism to transfer public land to a Special Purpose Vehicle (SPV) to facilitate access to private capital through the use of the land as security, (ii) Lack of clarity on returns and revenue-sharing, and (iii) Bureaucracy and slow approval processes. The partnership between the County Governments and private developers will therefore ease development costs and enhance the technical knowhow in the delivery of the units while paving way for more PPP models.
The Lands Ministry launched the Sessional Paper No. 1 of 2017 National Land Use Policy (NLUP), aimed at curbing land grabbing and poor land management. Land use planning puts order and regulates how land within urban cities is utilized, thus promoting efficiency and reducing land use conflicts. This in turn will enhance an orderly disposition of land leading to a methodical approach to developing neighborhoods especially with the relatively high rates of rural to urban migration. The policy is a prerequisite to the National Spatial Plan, County Spatial Planning Guidelines and the Physical Planning Act. In our view, this will especially aid in the delivery of the affordable housing units in the Big 4 Agenda, where availability of land has been a key challenge and will also enhance the efforts to improve the mortgage market, which has been laden with difficulties with property registration and titling. Other initiatives by the lands ministry include the digitization of the lands ministry, scrapping of the NEMA and titling search fees.
Also during the week, Azalea Holdings, the developers of The Hub announced plans to have Japanese retailer Miniso and international retailer Decathlon, setting up shop at the regional mall located in Karen. The mainstream retail sector in Nairobi has been on the decline in terms of performance, recording 9.0% points decline in occupancy to 80.3% in 2017 from 89.3% registered in 2016, mostly attributable to the increased supply of mall space and thus developers have to employ prudent methods of attracting clientele and enhancing footfall, especially by providing a wide variety of products. These methods include attracting retailers, especially international retailers looking to set up shop locally due to increasing demand driven by expansion of the middle-income class. Currently, major malls such as Two Rivers and Garden City have employed strategies such as provision of high quality space and green technology buildings that are known to attract foreign retailers. Notable international retailers that have set up shop include Carrefour, LC Waikiki, Subway and Burger King, among others, and these brands have gained traction as the middle class’ tastes and preferences continue to broaden in line with international trends. Retail developers such as Two Rivers and Garden City who have enhanced their marketing strategies record higher occupancy rates averaging at 86.3% than the market average at 80.3%.
Infrastructure
- The Miritini-Mwache-Kipevu link Road/Dongo-Kundu Bypass in Mombasa was launched by the President of Kenya, H.E Hon. Uhuru Kenyatta. The Kshs 11.5 bn project, which kick started in 2015, is 10.1 km and is part of Mombasa Port Area Road Development Project. It is expected to integrate the Port of Mombasa, Moi International Airport, Standard Gauge Railway Mombasa Terminus, the Nairobi-Mombasa Highway, among other routes, reducing congestion and stimulating tourism in the region by providing easy access to accommodation facilities,
- During the week, the dualling process of the Salgaa-Mau summit highway kicked off with China Railway as the main contractor. The government is set to spend approximately Kshs 500 mn for the 22 km long highway, to be completed by 2019. The upgrade will involve redesigning, construction of emergency runaway truck rumps, repair of guardrails, and installation of the requisite road signs. We expect this to open up the North Rift-located regions for investment activities thus improving the country’s economy.
Other Weekly Highlights:
- Struggling Uchumi has announced plans to franchise its Lang’ata Hyper branch in its franchising model strategy that is aimed at improving its financial muscle following financial constraints and internal operational woes. The retailer is targeting 200 franchise mini-shops across the country,
- Kisumu County announced plans of setting up a Kshs 100 mn ICT Park. In our view, the ICT Park will create numerous employment opportunities thus elevating the face of the county. This in turn will create demand for real estate especially residential sector in the county which currently records 4.8% rental yield on average, as per Cytonn Research,
- Also, a local real estate development firm Exurbia Living launched a new housing project in Gikambura, Kikuyu. The project dubbed Jacob Gardens will be a controlled development of serviced 0.125 acre plots selling at Kshs 2.5 mn per plot. Kikuyu has been hailed as one of the best performing satellite towns with growth enhanced by good infrastructure such as the Southern Bypass, and proximity of key business districts such as CBD and Westlands.
Listed Real Estate
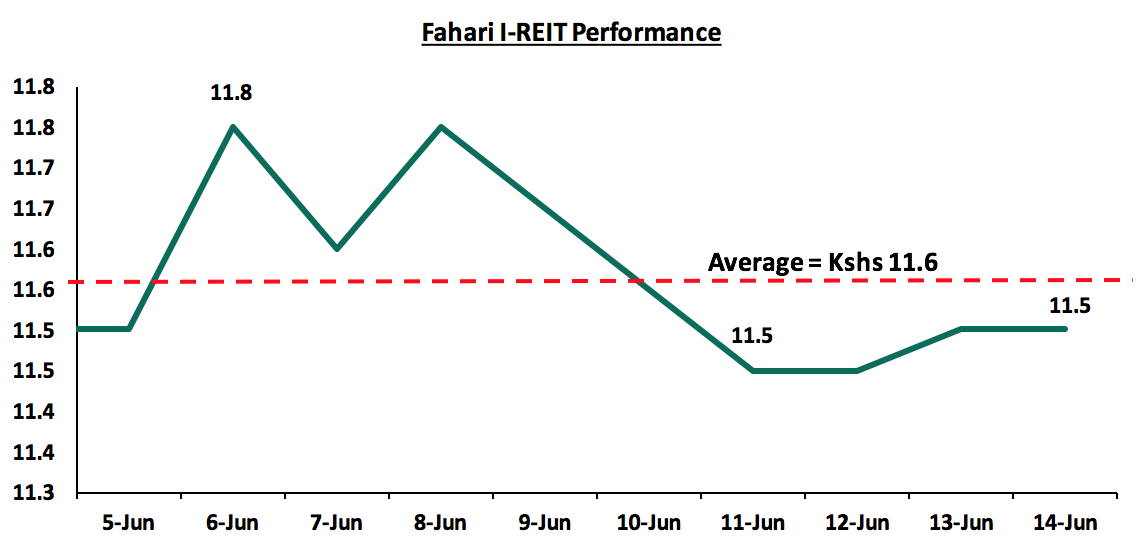
The Fahari I-REIT declined by 2.5% in share price, having closed at Kshs 11.5 during the week from Kshs 11.8 the previous week. The average price is Kshs 11.6, which is 10.6% higher than 2018’s opening price of Kshs 10.5. We attribute the poor and unstable performance to poor investor knowledge and preference for better performing equities and government securities.
We expect the real estate sector to continue on an upward trajectory given (i) continued improvement in infrastructure, (ii) Government efforts in support of the sector in terms of incentives and initiatives such as the Land Sector Reforms and 15.0% reduction of corporate tax for select developers, and (iii) the expanding middle class. However, we expect the sector to continue facing development challenges due to tightened access to funding and thus developers have to come up with innovative ways of alternative funding such as REITs and structured product notes.
Following the release of the Q1’2018 results by Kenyan listed banks, the Cytonn Financial Services Research Team undertook an analysis on the Kenyan Banking Sector to point out any material changes from our FY’2017 Banking Report. In our Q1’2018 Banking Report, we analyze the results of the listed banks in order to determine which banks are the most attractive and stable for investment from a franchise value and from a future growth opportunity perspective.
The report is themed “Diversification and efficiency key to growth amidst tighter regulation. Asset quality remains a concern”, as we assess what factors will be crucial for the sustainable growth and stability of the banking sector, with banks adjusting their business models in an effort to manage tighter regulation and the tough business environment. As a result, we seek to answer the question, “what should banks’ focus on?”, as we look forward to a relatively challenging operating environment for the banking sector due to (i) IFRS 9 having coming into effect in January 2018, and (ii) the interest rate cap. We expect more emphasis on (i) increased focus in asset quality management, and (ii) continued implementation of Non-Funded Income growth strategies.
Below are the key themes that shaped the banking sector in Q1’2018:
- Regulation– The effects of the Banking (Amendment) Act 2015 have continued to be felt in the sector, with banks recording a 2.0% decline in loans and advances to Kshs 1.9 tn in Q1’2018 from Kshs 2.0 tn in FY’2017. This could be attributed to banks’ tightening their credit standards owing to the Banking (Amendment) Act 2015. The amendment stipulates a deposit and loan-pricing framework, with (i) a cap on lending rates at 4.0% above the Central Bank Rate (CBR), and (ii) a floor on the deposit rates at 70% of the CBR. The capping of interest rates constrained banks from lending to SMEs and the private sector, and as a result, they preferred to invest in risk-free government securities that offer higher returns on a risk-adjusted basis. To mitigate the reduced lending, the National Treasury formulated the draft Financial Markets Conduct Bill, which was drafted to assess the whole credit management in the economy. The bill seeks to:
- Ensure better conduct by banks and other lendersin terms of extending credit to retail financial customers. By categorically not defining lenders as banks, this, in our view, might be the introduction of licensing for credit companies that are not banks,
- Provide consumer protection, mainly for retail customers by ensuring their credit contracts are clear and well understood in terms of interest, fees, charges and costs on credit facilities, thereby removing the opacity that has been existent in loan prices.
However, as noted in our focus note The Draft Financial Markets Conduct Bill, 2018, the bill only addresses consumer protection and fails to address the problem of access to credit for the private sector, mainly by SMEs. We are of the view that a lot more still needs to be done to address the fact that banks will most likely still prefer to lend to the risk free government as opposed to lending to a riskier retail customer at the current 13.5%, (4.0% points above the current CBR of 9.5%) as dictated by the Banking (Amendment) Act 2015.
- Revenue Diversification – With banks registering declining interest income and by extension compressed net interest income following the capping of interest rates, much of the focus shifted to diversifying income sources, mainly through non-funded income, as this section of the bank’s revenue is not affected by the interest rate caps. Non-funded income (NFI) grew by 9.5% in Q1’2018, higher than the 5-year average growth of 8.1%, taking its contribution to total income to 37.1%, compared to the 5-year average contribution of 33.4%. We expect this to continue for the rest of the year, as banks seek alternative sources of income to boost profitability under the interest rate cap regime. Banks have been venturing into various NFI growth venture such bancassurance. Notable forays into the bancassurance segment include:
- I&M Holdings having completed a full buyout of Youjays Insurance Brokers for an undisclosed amount,
- Standard Chartered partnering with Sanlam,
- KCB partnering with Liberty Holdings for the education savings plan dubbed Elimisha,
- Barclays acquired First Assurance in 2015 for Kshs 2.2 bn,
- Equity Group Holdings setting up an insurance arm (Equity Insurance Agency) that offers both life and non-life insurance products,
- NIC Group setting up an insurance agency (NIC insurance agency) which provides general insurance products,
- Cooperative Bank’s bancassurance arm that provides Medical insurance, Motor cover, agricultural insurance and life insurance, and
- National Bank of Kenya setting up NBK insurance Agency insurance which provides property insurance, education policies, medical insurance, annuities and agricultural insurance.
We believe revenue expansion by product diversification is one of the core opportunities for the banking sector, in the quest to achieve sustainable growth.
- Asset Quality – The banking sector has witnessed a deterioration in its asset quality over quarter, with the gross non-performing loans ratio rising to 13.9% from 12.5% in FY’2017, much higher than the 5-year average of 8.4%, owing to the challenging operating environment in 2017 whose effects spilled over to the first quarter of 2018 and resulted in an increase in bad loans. The major sectors touted as leading in asset quality deterioration include tourism, manufacturing, retail, agriculture and real estate, all of which were affected by the tough operating environment experienced last year that was occasioned by a volatile political environment and a severe prolonged drought. Owing to deteriorating asset quality, banks have adopted stringent lending policies in a bid to curb the relatively high number of non-performing loans. The stringent lending policies have further contributed to the tightening of the credit standards in the economy. However, banks have also adopted a raft of measures to try to improve their asset qualities. Main strategies include (i) remediation of collapsed businesses and thereby enabling them to service their obligations to the bank, and (ii) Collateralization of bad debt to third parties.
- Efficiency – Banks have focused on improving their operational efficiency, mainly by reducing operation costs, as shown by the cost to income ratio, which improved to 65.4% from 67.3% in FY’2017. A key avenue that banks have been using to reduce their operation costs has been product development centered on leveraging on alternative distribution channels. The use of alternative channels has gained prominence among bank customers due to the convenience it provides. Increased use of alternative channels has also contributed to increased non-funded income in the form of transactional income due to the high number of transactions via these channels. Cost reduction has to be accompanied by revenue expansion for banks to achieve sustainable growth;
- Prudence – With the implementation of IFRS 9, departing from the previous IAS 39, which took effect from 1st January 2018, banks are required to provide for both the non-performing loans and performing loans. This then points to increased provisioning levels by banks. IFRS 9 takes on a forward-looking credit assessment approach. Credit losses under IFRS 9 have to be computed under the Expected Credit Loss (ECL) model, as opposed to the Incurred Credit Loss (ICL) model, that was used under IAS 39 framework. The implementation of IFRS 9 saw the total capital position of banks relative to the risky assets decline by an average of 0.3% after adjusting for IFRS 9, on account of increasing provisions. To operate under this new standard, banks have adopted stringent lending policies, with some banks adopting advanced credit pre-scoring methods. The implementation of IFRS 9 was done to provide the banking sector with additional capital buffers for protection against credit losses thereby improving the stability of the sector as a whole;
- Consolidation – Consolidation in the banking sector picked up at the start of 2017, but slowed as the year progressed. In 2018, only one acquisition deal took place during the quarter. SBM Bank Kenya Ltd completed the acquisition of certain assets and liabilities of Chase Bank Limited, which was under receivership. Following the agreement between the Central Bank of Kenya (CBK), Kenya Deposit Insurance Corporation (KDIC) and SBM Bank Kenya, 75% of the value of all moratorium deposits at Chase Bank will be transferred to SBM Bank Kenya. The remaining 25% will remain with Chase bank Limited. This is a major milestone as this is the first successful instance, in the history of Kenya, of a bank being successfully brought out of receivership. Chase Bank was taken under receivership of the CBK in 2016, with customer deposits in excess of Kshs 100.0 bn. The acquisition will see SBM take control of the 62 Chase Bank branches, significantly increasing the bank’s foothold in the country. SBM Bank has injected Kshs 2.6 bn in Chase Bank, and is planning to inject a further Kshs 6.0 bn after the acquisition to revive the collapsed bank. However, the transaction value is yet to be disclosed. In addition to this, the bank is expected to absorb all the 1,300 former employees of Chase Bank Limited. We shall update with the transaction multiples once the deal is fully finalized and transaction values disclosed. We are however surprised that some of the smaller banks have managed to stay independent this long, as we would have expected weaker banks (that don’t serve a niche, don’t have a clear deposit gathering strategy and have low capital positions), being forced to merge or be acquired as they succumb to sustained effects of the interest rate cap and the implementation of IFRS 9, which affects their profitability and capital levels. Going forward we still expect more consolidation in the industry.
Below is the summary of the transaction metrics of some of the acquisitions that have happened in the banking sector within the last 5 years:
|
Acquirer |
Bank Acquired |
Book Value at Acquisition (Kshs bns) |
Transaction Stake |
Transaction Value (Kshs bns) |
P/Bv Multiple |
Date |
|
Diamond Trust Bank Kenya |
Habib Bank Limited Kenya |
2.38 |
100.0% |
1.82 |
0.8x |
Mar-17 |
|
SBM Holdings |
Fidelity Commercial Bank |
1.75 |
100.0% |
2.75 |
1.6x |
Nov-16 |
|
M Bank |
Oriental Commercial Bank |
1.80 |
51.0% |
1.30 |
1.4x |
Jun-16 |
|
I&M Holdings |
Giro Commercial Bank |
2.95 |
100.0% |
5.00 |
1.7x |
Jun-16 |
|
Mwalimu SACCO |
Equatorial Commercial Bank |
1.15 |
75.0% |
2.60 |
2.3x |
Mar-15 |
|
Centum |
K-Rep Bank |
2.08 |
66.0% |
2.50 |
1.8x |
Jul-14 |
|
GT Bank |
Fina Bank Group |
3.86 |
70.0% |
8.60 |
3.2x |
Nov-13 |
|
Average |
|
|
80.3% |
|
1.8x |
|
Based on the above, we believe the sector is shaping up to a more diversified banking model and prudence in operations, as can be seen through the increase in alternative channels and restructuring in the sector, as banks adjust to the business environment and the current regulatory framework.
Below is a summary of the Q1’2018 results for the eleven listed banks and key take-outs from the results:
|
Bank |
Core EPS Growth |
Interest Income Growth |
Interest Expense Growth |
Cost of Funds |
Net Interest Income Growth |
Net Interest Margin |
Non-Funded Income (NFI) Growth |
NFI to Total Operating Income |
Growth in Total Fees & Commissions |
Deposit Growth |
Loan Growth |
Growth in Govt. Securities |
IFRS 9 Capital Ratios Effect |
|
NBK |
348.0% |
(14.2%) |
(11.7%) |
3.3% |
(15.8%) |
7.1% |
(12.3%) |
31.0% |
91.3% |
(6.3%) |
(12.0%) |
(9.8%) |
(0.6%) |
|
Stanbic |
79.0% |
17.7% |
17.4% |
3.3% |
17.9% |
7.0% |
55.4% |
49.0% |
73.7% |
13.2% |
11.4% |
83.5% |
(0.6%) |
|
Equity Group |
21.7% |
10.5% |
10.5% |
2.7% |
10.5% |
8.4% |
6.3% |
49.0% |
7.2% |
10.0% |
3.5% |
45.5% |
(0.5%) |
|
KCB Group |
14.0% |
10.9% |
13.0% |
3.1% |
10.0% |
8.2% |
(1.1%) |
32.8% |
(2.3%) |
8.7% |
5.8% |
(10.7%) |
(0.8%) |
|
Barlays Bank |
7.7% |
8.1% |
6.8% |
2.9% |
8.5% |
9.6% |
5.0% |
29.2% |
(6.7%) |
8.4% |
(1.9%) |
35.3% |
1.00% |
|
Co-op Bank |
6.8% |
9.1% |
5.0% |
4.0% |
10.8% |
8.6% |
3.8% |
32.0% |
9.6% |
5.7% |
2.8% |
21.3% |
(0.9%) |
|
DTB |
3.0% |
4.9% |
4.2% |
5.1% |
5.4% |
6.4% |
4.4% |
22.0% |
8.3% |
11.6% |
3.0% |
16.0% |
(1.6%) |
|
NIC Group |
2.2% |
8.2% |
35.9% |
5.2% |
(8.3%) |
6.3% |
5.5% |
29.6% |
1.8% |
22.1% |
(0.4%) |
81.2% |
(0.8%) |
|
I&M holdings |
1.8% |
2.5% |
10.9% |
4.8% |
(2.7%) |
7.4% |
43.9% |
37.0% |
45.9% |
3.5% |
7.6% |
(1.7%) |
(0.2%) |
|
Stanchart |
(12.5%) |
7.7% |
16.4% |
3.6% |
4.5% |
7.8% |
6.5% |
32.0% |
27.0% |
13.2% |
(2.6%) |
12.4% |
(0.5%) |
|
HF Group |
(58.4%) |
(12.8%) |
(13.0%) |
7.2% |
(12.6%) |
5.1% |
64.2% |
28.9% |
(62.7%) |
(6.1%) |
(12.5%) |
(41.4%) |
0.0% |
|
Weighted Average Q1'2018 |
14.4% |
9.3% |
11.4% |
3.4% |
8.1% |
8.1% |
9.5% |
37.1% |
12.2% |
9.4% |
3.2% |
25.0% |
(0.3%) |
|
Weighted Average Q1'2017 |
(8.6%) |
(11.6%) |
(10.3%) |
3.0% |
(10.1%) |
9.2% |
18.6% |
37.8% |
8.7% |
11.7% |
7.1% |
43.1% |
- |
Key takeaways from the table above include:
- The listed banks recorded a 14.4% increase in core EPS, compared to a decline of 8.6% decline in Q1’2017. Only Standard Chartered Bank and Housing Finance Group recorded declines in core EPS, registering declines of 12.5% and 58.4% respectively. HF Group recorded the biggest decline at 58.4%, on the back of a 12.6% decline in Net Interest Income (NII);
- Average deposit growth came in at 9.4%. Thus, the interest expense paid on deposits recorded a higher growth of 11.4% on average, indicating that banks are growing deposits by opening more interest earning accounts. This is also reflected by the increase in the cost of funds to 3.4% from 3.0% in Q1’2017;
- Average loan growth was recorded at 3.2%, with interest income increasing by 9.3%, as banks adapted to the interest rate Cap regime, with increased allocations in government securities;
- Investment in government securities has grown by 25.0%, outpacing loan growth of 3.2%, showing increased lending to the government by banks as they avoid the risky borrowers;
- The average Net Interest Margin in the banking sector currently stands at 8.1%, a decline from the 9.2% recorded in Q1’2017, and,
- Non-funded income has grown by 9.5%, which included a Fee and Commissions growth of 12.2%. This shows that banks are charging more fee income to improve their income on loans above the rate cap maximum;
- The sector saw a decline in total capital relative to risky assets by 0.3% due to implementation of IFRS 9, indicating the implementation of the standard affected the sector’s capital position though not as much as expected. We expect this reduction to increase in the future.
Private sector credit growth continues to remain low, coming in at 2.4% in April 2018, way below the 5-year average of 14.0%, as banks channel funds more actively towards government securities, depriving the private sector of credit.
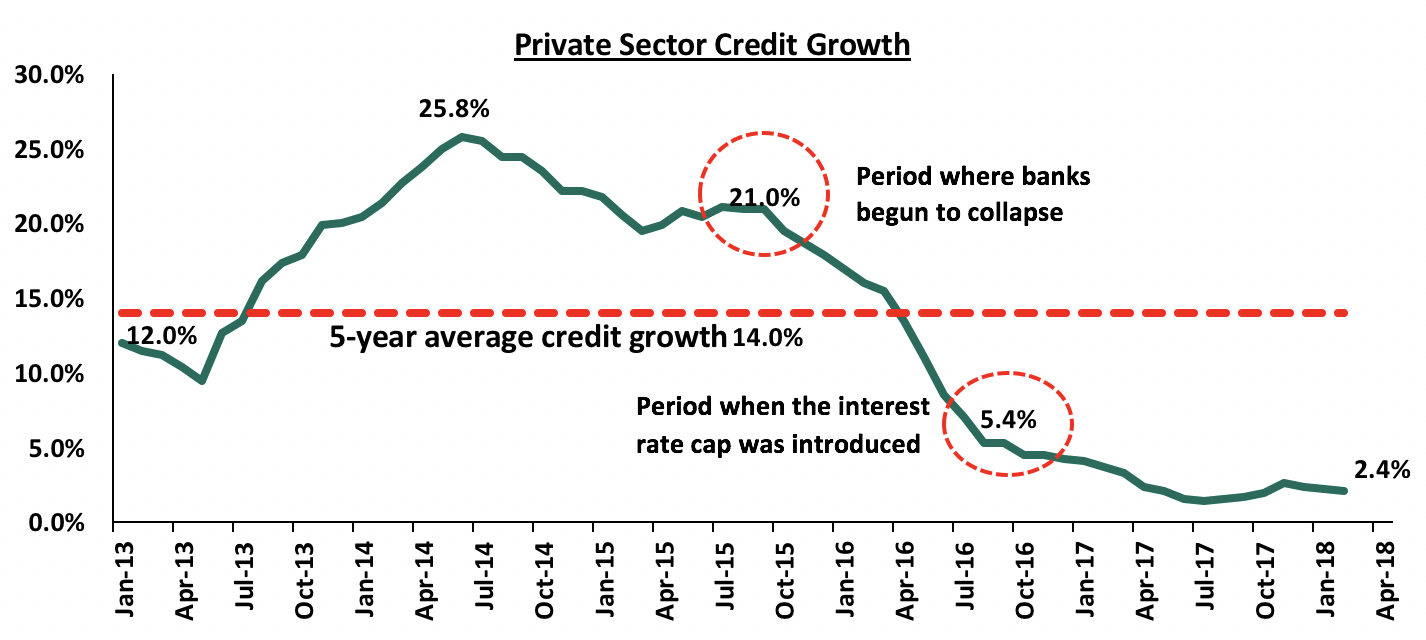
Rate cap came into effect in August 2016 when private sector credit growth was at 5.4% as highlighted above, with the decline before that as a result of a challenging operating environment
The challenges that the banking sector has been facing, primarily (i) the deteriorating asset quality brought about by a challenging operating environment, and (ii) the capping of interest rates, has led to subdued growth in the credit extended to the private sector. We however noted that the sector in general has adapted to operating in the tough environment, posting a 14.4% increase in core EPS. We believe the key factors banks will consider going forwards are asset quality management, revenue diversification, prudence, and efficiency. To grow profitability amidst the tighter regulated environment, banks will:
- Diversify their income sources by growing their fee-income businesses, bancassurance, asset management and advisory services,
- Be more prudent in loan disbursement, as well as enhancing their risk assessment framework to improve asset quality, so as to tame any rising financial impairments arising from implementation of IFRS 9, and,
- Improve efficiency by leveraging on mobile and internet banking, for cost reduction especially on staff numbers and revenue expansion from transaction income, with all these strategies aimed at improving their profit margins.
We believe the banking sector is well poised to grow in the future, but there is still a need to address the slow growth in credit by effectively removing the interest rate cap and countering any effects by spurring competition in the lending market by stimulating the capital markets by increasing the depth of the markets so as to provide avenues for the use of structured products. We highlighted these and other strategies in our topical: Rate Cap Review Should Focus More on Stimulating Capital Markets
As per our analysis on the banking sector, from a franchise value and from a future growth opportunity perspective, we carried out a comprehensive ranking of the listed banks. For the franchise value ranking, we included the earnings and growth metrics in the table above as well as the operating metrics in the table below in order to carry out a comprehensive review of the banks.
|
Listed Banks Q1'2018 Operating Metrics |
|||||||
|
Bank |
LDR |
CIR |
ROACE |
Deposits Per Branch |
Gross NPL Ratio |
NPL Coverage |
Tangible Common Ratio |
|
Co-operative |
85.4% |
55.8% |
17.6% |
1.9 |
10.8% |
30.6% |
16.8% |
|
KCB |
84.3% |
55.9% |
20.3% |
1.9 |
9.9% |
58.6% |
14.6% |
|
DTB |
71.4% |
56.3% |
15.1% |
2.0 |
7.1% |
68.3% |
13.2% |
|
Equity |
70.9% |
49.6% |
24.7% |
1.4 |
6.5% |
48.6% |
14.4% |
|
I&M |
90.0% |
52.8% |
16.9% |
4.1 |
13.8% |
39.5% |
17.0% |
|
NIC |
80.5% |
60.7% |
13.4% |
2.9 |
12.9% |
48.0% |
15.1% |
|
Barclays |
85.6% |
64.8% |
16.0% |
2.2 |
7.2% |
71.7% |
14.9% |
|
Stanchart |
49.1% |
61.0% |
14.5% |
6.4 |
14.0% |
75.2% |
15.1% |
|
Stanbic |
74.1% |
71.7% |
6.2% |
5.7 |
7.8% |
50.3% |
12.9% |
|
HF |
113.1% |
94.6% |
0.7% |
1.6 |
16.6% |
39.2% |
15.6% |
|
National Bank |
58.9% |
95.7% |
2.3% |
1.2 |
42.9% |
56.5% |
5.1% |
|
Weighted Average Q1'2018 |
76.8% |
56.6% |
18.4% |
2.8 |
9.5% |
53.4% |
14.9% |
The overall ranking was based on a weighted average ranking of Franchise value (accounting for 40%) and Intrinsic value (accounting for 60%). The Intrinsic Valuation is computed through a combination of valuation techniques, with a weighting of 75.0% on Discounted Cash-flow Methods and 25.0% on Relative Valuation, while the Franchise ranking is based on banks operating metrics, meant to assess the efficiency, asset quality, diversification, corporate governance and profitability, among other metrics. The overall Q1’2018 ranking is as shown in the table below:
|
CYTONN’S Q1’2018 BANKING REPORT RANKINGS |
|||||
|
Bank |
Franchise Value Total Score |
Intrinsic Value Score |
Weighted Score |
Q1‘2018 Rank |
FY ‘2017 Rank |
|
KCB Group |
53.0 |
4.0 |
23.6 |
1 |
1 |
|
Equity Group |
53.0 |
8.0 |
26.0 |
2 |
2 |
|
I&M Holdings |
62.0 |
3.0 |
26.6 |
3 |
3 |
|
Diamond Trust Bank |
66.0 |
2.0 |
27.6 |
4 |
7 |
|
Barclays Bank |
63.0 |
6.0 |
28.8 |
5 |
6 |
|
Co-operative Bank |
63.0 |
7.0 |
29.4 |
6 |
4 |
|
Stanbic Holdings |
69.0 |
10.0 |
33.6 |
7 |
9 |
|
NIC Group |
83.0 |
1.0 |
33.8 |
8 |
5 |
|
Standard Chartered Bank |
71.0 |
9.0 |
33.8 |
8 |
8 |
|
HF Group |
104.0 |
5.0 |
44.6 |
10 |
11 |
|
National Bank of Kenya |
103.0 |
11.0 |
47.8 |
11 |
10 |
Major changes include:
- Diamond Trust Bank climbed 3 spots to Position 4 from Position 7 in our FY’2017 Banking Sector Report, owing to its good asset quality, with the bank having the second lowest gross NPL ratio at 7.1%, lower than industry average of 9.5%, and good corporate governance structure, ranking second in the Cytonn Corporate Governance Index (CGI),
- NIC Group dropped 3 spots to Position 8 from Position 5 in our FY’2017 Banking Sector Report, due to a low franchise value score caused by low profitability owing to a low Net Interest Margin at 6.3%, and a low Return on Average Common Equity (ROACE) at 13.4%, compared to an industry average of 8.1%, and 18.4%, respectively, and a high Cost to Income Ratio (CIR) of 60.7%, compared to an industry average of 56.6%.
For a comprehensive analysis on the ranking and methodology behind it, see our Cytonn Q1’2018 Banking Sector Report.

- Talk to us
- Kenya
- P.O Box 20695 - 00200, Nairobi, Kenya
- Cell +254709101200
- Tel +254709101200
- WhatsApp +254741676635
- United States
- +254709101200
- DOWNLOAD OUR APP
-


- Kenya
- 8th Floor, Pinetree Plaza, Kaburu Drive, Ngong Road, Nairobi, Kenya
- USA
- Suite 1150, 1775 Eye Street NW, USA, Washington DC 20006, USA
- Investments
- High Yield
- Private Equity
- Real Estate
- Real Estate
- RiverRun Estates
- Cytonn Towers
- The Ridge
- Taraji Heights
- The Alma