Cytonn Monthly – February 2024, & FY’2023 UTF Performance Report
By Research Team, Mar 3, 2024
Executive Summary
Fixed Income
During the month of February 2024, T-bills were oversubscribed, with the overall average oversubscription rate coming in at 150.4%, higher than the oversubscription rate of 133.7% recorded in January 2024. The overall average subscription rates for the 364-day and 182-day papers increased to 90.0% and 63.6%, from 24.9% and 53.1% respectively, while the overall average subscription rates for the 91-day paper decreased to 518.3% from 607.6%, which was recorded in January 2024. The average yields on the government papers were on an upward trajectory in the month, with the 364-day, 182-day, and 91-day papers yields increasing by 51.3 bps, 49.0 bps, and 38.6 bps to 16.9%, 16.7%, and 16.5% respectively from 16.4%, 16.2%, and 16.1 recorded the previous month. For the month of February, the government accepted a total of Kshs 159.1 bn of the Kshs 180.4 bn worth of bids received, translating to an acceptance rate of 88.2%;
Additionally, February 2024 bonds were oversubscribed, with the overall oversubscription rate coming in at 412.4%, higher than the undersubscription rate of 90.6% recorded in January 2024. The newly issued infrastructure bond IFB1/2024/8.5 with a tenor to maturity of 8.5 years received bids worth Kshs 288.7 bn against the offered Kshs 70.0 bn, translating to an oversubscription rate of 412.4%, with the government accepting bids worth Kshs 241.0 bn translating to an acceptance rate of 83.5%. The weighted average yield of accepted bids and the coupon rate were set at 18.5%, 0.6% points higher than that of the previously issued infrastructure bond IFB1/2023/6.5, whose coupon rate was set at 17.9%;
During the week, T-bills were undersubscribed for the first time in nine weeks, with the overall undersubscription rate coming in at 99.5%, a reversal from the oversubscription rate of 154.1% recorded the previous week. Investors’ preference for the shorter 91-day paper persisted, with the paper receiving bids worth Kshs 12.3 bn against the offered Kshs 4.0 bn, translating to an oversubscription rate of 306.5%, higher than the oversubscription rate of 247.6% recorded the previous week. The subscription rates for the 182-day paper and 364-day paper decreased significantly to 20.4% and 95.8% respectively, from 74.2% and 196.5% respectively, recorded the previous week. The government accepted a total of Kshs 22.9 bn worth of bids out of Kshs 23.9 bn of bids received, translating to an acceptance rate of 95.9%. The yields on the government papers continued to rise, with the yields on the 364-day, 182-day, and 91-day papers increasing by 5.3 bps, 5.1 bps, and 3.2 bps to 17.0%, 16.8%, and 16.6%, respectively;
In the primary bond market, the government is seeking to raise an additional Kshs 40.0 bn for budgetary support by issuing three fixed coupon treasury bonds concurrently. FXD1/2024/10, which is a new issue has a tenor to maturity of 10.0 years with a coupon rate of 16.0%, hile the re-opened FXD1/2024/03 and FXDI/2024/05 with a tenor to maturity of 2.9 years and 4.4 years, respectively have their coupon rates set at 18.4% and 16.8%, respectively. To note, bonds with a similar tenor to the FXD1/2024/10 in the secondary market like the FXD1/2019/015 and the FXD2/2019/015, with a tenor to maturity of 10.1 years and 9.9 years respectively, are trading at 15.9% and 15.8% respectively, which is slightly below the new issue. Additionally, the last bond to be issued of a similar tenor was the FXD1/2023/10 in February 2023 at a rate of 14.2%. The bidding process opened on Tuesday 27th February 2024 and will close on 6th March 2024 for the FXD1/2024/03 and on 20th March for the FXD1/2024/05 and FXD1/2024/10. The bonds’ value dates will be 11th March 2024 for the FXD1/2024/03 and 25th March 2024 for the FXD1/2024/05 and FXD1/2024/10, with maturity dates of 11th January 2027, 10th August 2028 and 13th March 2034 respectively;
During the week, the Kenya National Bureau of Statistics (KNBS) released the year-on-year inflation, highlighting that inflation in February 2024 eased by 0.6% points to 6.3%, from the 6.9% recorded in January 2024. This was according to our expectations, but below our projections to within a range of 6.6% to 6.8%;
The National Treasury released the Draft 2024 Budget Policy Statement, in line with section 25 of the Public Finance Management (PFM) Act, 2012 which requires the National Treasury to seek and take into account the views of stakeholders and the public in preparing the Budget Policy Statement (BPS), before submission to Cabinet for approval and the subsequent submission to Parliament. Revenue is projected to increase by 13.6% to Kshs 3.4 tn from Kshs 3.0 tn as per FY’2023/24 revised budget estimates, while total expenditure is projected to increase by 6.5% to Kshs 4.2 tn, from Kshs 3.9 tn FY’2023/24 revised budget estimates;
During the week, the global ratings agency, Moody’s announced its revision of Ivory Coast credit score raising it one level to a Ba2 with a stable outlook from a credit rating of Ba3 with a positive outlook, on the back of the nation's economic resilience and increasing private sector investments;
Equities
During the month of February 2024, the equities market was on an upward trajectory, with NSE 10 gaining the most by 3.4%, while NSE 25, NSE 20, and NASI gained by 2.7%, 1.8% and 0.3% respectively. The equities market performance was driven by gains recorded by large-cap stocks such as ABSA Group, Cooperative Bank, and Equity Group of 9.8%, 7.4%, and 6.6% respectively. The gains were, however, weighed down by losses recorded by large cap stocks such as Safaricom, BAT, and Stanbic of 2.6%, 2.4%, and 1.6% respectively;
During the week, the equities market was on an upward trajectory, with NSE 10 and NSE 25 gaining the most by 0.7%, while NASI and NSE 20 gained by 0.5% and 0.2% respectively, taking the YTD performance to gains of 1.4%, 2.0%, 4.4% and 4.5% for NASI, NSE 20, NSE 25 and NSE 10 respectively. The equities market performance was driven by gains recorded by large-cap stocks such as DTBK, ABSA Group, and NCBA of 7.6%, 5.7%, and 4.0% respectively. The gains were, however, weighed down by losses recorded by large cap stocks such as Equity Group, EABL, and SCBK of 2.4%, 1.4%, and 1.1% respectively;
Also during the week, Kenya Electricity Generating Company (KenGen) released their H1’2023 financial results, recording a 9.2% decline in Profits after Tax (PAT) to Kshs 3.0 bn, from Kshs 3.3 bn recorded in H1’2022. The decline in PAT was majorly attributed to the 16.4% increase in operating expenses to Kshs 10.1 bn from Kshs 8.7 bn, coupled with the 25.7% increase in income tax to Kshs 1.9 bn in H1’2023 from Kshs 1.5 bn recorded in H1’2022;
Real Estate
During the week, the County Government of Nakuru announced that it had received Kshs 580.0 mn from the World Bank to upgrade low-income informal settlements of Kwa-Murogi, London, and Lake View in Nakuru, as well as Karagita in Naivasha. Additionally, Kenya Mortgage Refinance Company (KMRC) announced plans to establish a partial guarantee scheme by the end of this year. This initiative seeks to establish a risk-sharing facility intended to cushion banks and SACCOs by providing a partial guarantee for any mortgage extended to individuals deemed high-risk;
In the retail sector, Naivas Supermarket, a local retailer, opened its most recent store in the Survey area, situated along Thika Road, bringing its total number of outlets countrywide to 103;
In the Unquoted Securities Platform, Acorn D-REIT and I-REIT traded at Kshs 24.4 and Kshs 21.7 per unit, respectively, as of 1st March 2024. The performance represented a 22.0% and 8.3% gain for the D-REIT and I-REIT, respectively, from the Kshs 20.0 inception price;
Focus of the Week
Unit Trust Funds (UTFs) are Collective Investment Schemes that pool funds from different investors and are managed by professional fund managers. The fund managers invest the pooled funds in a portfolio of securities such as equity stocks, bonds, or any authorized financial securities, with the aim of generating returns to meet the specific objectives of the fund. Following the release of the Capital Markets Authority (CMA) Quarterly CIS Report-Q4'2023, we analyze the performance of Unit Trust Funds for the period ending 31st December 2023. During the period under review, Unit Trusts Funds’ Assets under Management grew by 4.1% to Kshs 215.1 bn as at the end of FY’2023, from Kshs 206.7 bn recorded in Q3’2023;
Investment Updates:
- Weekly Rates:
- Cytonn Money Market Fund closed the week at a yield of 16.93% p.a. To invest, dial *809# or download the Cytonn App from Google Play store here or from the Appstore here;
- Cytonn High Yield Fund closed the week at a yield of 19.30% p.a. To invest, email us at sales@cytonn.com and to withdraw the interest, dial *809# or download the Cytonn App from Google Play store here or from the Appstore here;
- We continue to offer Wealth Management Training every Monday, from 10:00 am to 12:00 pm. The training aims to grow financial literacy among the general public. To register for any of our Wealth Management Trainings, click here;
- If interested in our Private Wealth Management Training for your employees or investment group, please get in touch with us through wmt@cytonn.com;
- Cytonn Insurance Agency acts as an intermediary for those looking to secure their assets and loved ones’ future through insurance namely; Motor, Medical, Life, Property, WIBA, Credit and Fire and Burglary insurance covers. For assistance, get in touch with us through insuranceagency@cytonn.com;
- Cytonn Asset Managers Limited (CAML) continues to offer pension products to meet the needs of both individual clients who want to save for their retirement during their working years and Institutional clients that want to contribute on behalf of their employees to help them build their retirement pot. To more about our pension schemes, kindly get in touch with us through pensions@cytonn.com;
Real Estate Updates:
- For more information on Cytonn’s real estate developments, email us at sales@cytonn.com;
- Phase 3 of The Alma is now ready for occupation and the show house is open daily. To join the waiting list to rent, please email properties@cytonn.com;
- For Third Party Real Estate Consultancy Services, email us at rdo@cytonn.com;
- For recent news about the group, see our news section here;
Hospitality Updates:
- We currently have promotions for Staycations. Visit cysuites.com/offers for details or email us at sales@cysuites.com;
Money Markets, T-Bills Primary Auction:
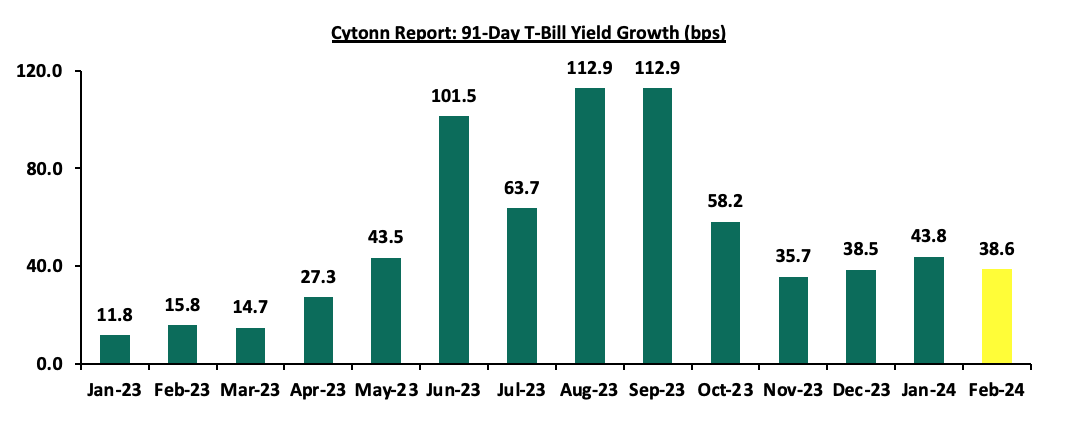
During the month of February 2024, T-bills were oversubscribed, with the overall average oversubscription rate coming in at 150.4%, higher than the oversubscription rate of 133.7% recorded in January 2024. The overall average subscription rates for the 364-day and 182-day papers increased to 90.0% and 63.6%, from 24.9% and 53.1% respectively, while the overall average subscription rates for the 91-day paper decreased to 518.3% from 607.6%, which was recorded in January 2024. The average yields on the government papers were on an upward trajectory in the month, with the 364-day, 182-day, and 91-day papers yields increasing by 51.3 bps, 49.0 bps, and 38.6 bps to 16.9%, 16.7%, and 16.5% respectively from 16.4%, 16.2% and 16.1 recorded the previous month. For the month of February, the government accepted a total of Kshs 159.1 bn of the Kshs 180.4 bn worth of bids received, translating to an acceptance rate of 88.2%. Notably, the growth in the government papers yields was slower in February compared to January, with the yields on the 91-day paper growing by 38.6 bps, compared to 43.8 bps growth that was recorded in January, partly attributable to market volatility following the Eurobond buyback. The chart below shows the yield growth rate for the 91-day paper during the year:
This week, T-bills were undersubscribed for the first time in nine weeks, with the overall undersubscription rate coming in at 99.5%, a reversal from the oversubscription rate of 154.1% recorded the previous week. Investors’ preference for the shorter 91-day paper persisted, with the paper receiving bids worth Kshs 12.3 bn against the offered Kshs 4.0 bn, translating to an oversubscription rate of 306.5%, higher than the oversubscription rate of 247.6% recorded the previous week. The subscription rates for the 182-day paper and 364-day paper decreased significantly to 20.4% and 95.8% respectively, from 74.2% and 196.5% respectively, recorded the previous week. The government accepted a total of Kshs 22.9 bn worth of bids out of Kshs 23.9 bn of bids received, translating to an acceptance rate of 95.9%. The yields on the government papers continued to rise, with the yields on the 364-day, 182-day, and 91-day papers increasing by 5.3 bps, 5.1 bps, and 3.2 bps to 17.0%, 16.8%, and 16.6%, respectively,
So far in the current FY’2023/24, government securities totalling Kshs 1,265.0 bn have been advertised. The government has accepted bids worth Kshs 1,558.5 bn, of which Kshs 1,009.9 bn and Kshs 548.6 bn were treasury bills and bonds, respectively. Total redemptions so far in FY’2023/24 equal to Kshs 1,234.1 bn, with treasury bills accounting for Kshs 1116.0 bn and bonds accounting for Kshs 118.1 bn. As a result, the government has a domestic borrowing surplus of Kshs 324.5 bn in FY’2023/24.
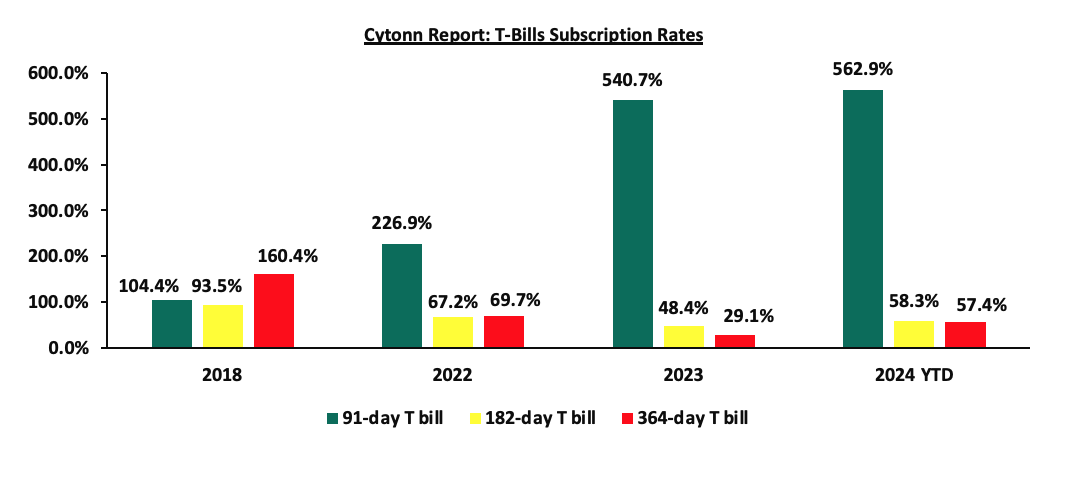
The chart below compares the overall average T-bill subscription rates obtained in 2018, 2022, 2023, and 2024 Year to Date (YTD):
Additionally, February 2024 bonds were oversubscribed, with the overall oversubscription rate coming in at 412.4%, higher than the undersubscription rate of 90.6% recorded in January 2024. The newly issued infrastructure bond IFB1/2024/8.5 with a tenor to maturity of 8.5 years received bids worth Kshs 288.7 bn against the offered Kshs 70.0 bn, translating to an oversubscription rate of 412.4%, with the government accepting bids worth Kshs 241.0 bn translating to an acceptance rate of 83.5%. The weighted average yield of accepted bids and the coupon rate were set at 18.5%, 0.6% points higher than that of the previously issued infrastructure bond IFB1/2023/6.5, whose coupon rate was set at 17.9%. The table below provides more details on the bonds issued during the month of January and February 2024:
|
Cytonn Report: Bond Issues in January and February 2024 |
|||||||||
|
Issue Date |
Bond Auctioned |
Effective Tenor to Maturity (Years) |
Coupon |
Amount offered (Kshs bn) |
Actual Amount Raised/Accepted (Kshs bn) |
Total bids received (Subscription) |
Average Accepted Yield |
Subscription Rate |
Acceptance Rate |
|
15/01/2024 |
FXD1/2023/005 - Re-opened |
4.5 |
16.8% |
35.0 |
25.0 |
37.2 |
18.8% |
106.1% |
67.3% |
|
FXD1/2024/003 |
2.9 |
18.4% |
18.4% |
||||||
|
22/01/2024 |
FXD1/2023/005 - Tapsale |
4.5 |
16.8% |
15.0 |
11.8 |
11.9 |
18.8% |
79.1% |
99.1% |
|
FXD1/2024/003 - Tapsale |
2.9 |
18.4% |
18.4% |
||||||
|
16/01/2023 |
FXD1/2020/005 (re-opened) |
2.4 |
11.7% |
50.0 |
31.5 |
41.6 |
12.9% |
83.3% |
75.7% |
|
19/02/2024 |
IFB1/2024/8.5 |
8.5 |
18.5% |
70.0 |
241.0 |
288.7 |
18.5% |
412.4% |
83.5% |
|
Feb 2024 Average |
|
8.5 |
18.5% |
70.0 |
241.0 |
288.7 |
18.5% |
412.4% |
83.5% |
|
Jan 2024 Average |
|
5.3 |
16.0% |
100.0 |
68.3 |
90.6 |
16.9% |
90.6% |
75.3% |
|
2023 Average |
|
|
|
|
|
|
|
117.8% |
|
Source: Central Bank of Kenya (CBK)
In the primary bond market, the government is seeking to raise an additional Kshs 40.0 bn for budgetary support by issuing three fixed coupon treasury bonds concurrently. FXD1/2024/10, which is a new issue has a tenor to maturity of 10.0 years with a coupon rate of 16.0%, hile the re-opened FXD1/2024/03 and FXDI/2024/05 with a tenor to maturity of 2.9 years and 4.4 years, respectively have their coupon rates set at 18.4% and 16.8%, respectively. Additionally, bonds with a similar tenor to the FXD1/2024/10 in the secondary market like the FXD2/2019/015 and the FXD3/2019/015, with a tenor to maturity of 10.1 years and 10.3 years respectively are trading at coupon rates of 12.7% and 12.3% respectively, which is slightly below the new issue. The bidding process opened on Tuesday 27th February 2024 and will close on 6th March 2024 for the FXD1/2024/03 and on 20th March for the FXD1/2024/05 and FXD1/2024/10. The bonds’ value dates will be 11th March 2024 for the FXD1/2024/03 and 25th March 2024 for the FXD1/2024/05 and FXD1/2024/10, with maturity dates of 11th January 2027, 10th August 2028 and 13th March 2034 respectively.
Secondary Bond Market:
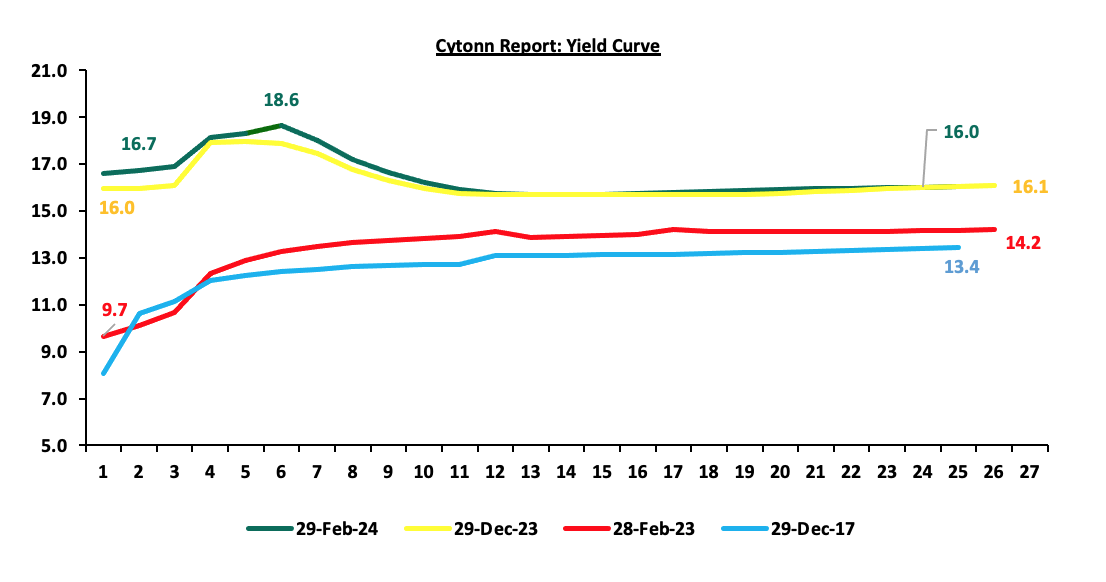
The yields on the government securities were on an upward trajectory during the month compared to the same period in 2023. We observe a humped yield curve for the medium-term bonds in the 3 to 10-year maturity range, an indication of the prevailing uncertainty in the market regarding both medium-term interest rates and inflation. Investors, apprehensive about the economic outlook in the near to medium term, are demanding higher yields for bonds in the 3 to 10-year maturity range to compensate for the perceived risks as they anticipate potential fluctuations in economic conditions in the Kenyan market on the back of the government’s debt sustainability concerns. The chart below shows the yield curve movement during the period:
The secondary bond turnover increased by 332.4% to Kshs 271.0 bn, from Kshs 62.7 bn recorded in January 2024, pointing towards increased activities by commercial banks in the secondary bonds market. On a year-on-year basis, the bonds turnover increased by 481.3% from Kshs 46.6 bn worth of treasury bonds transacted over a similar period last year.
Money Market Performance:
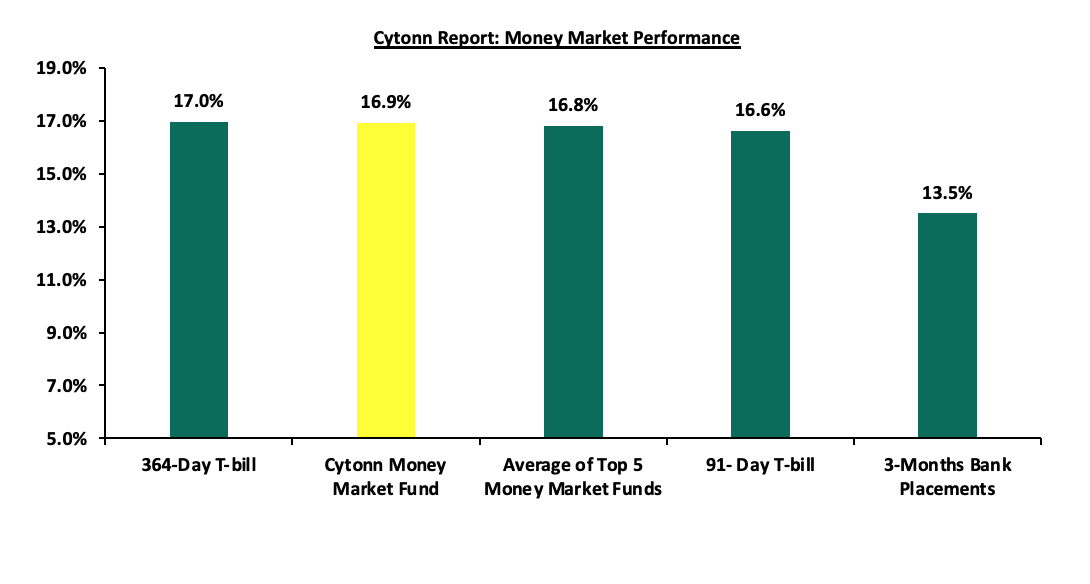
In the money markets, 3-month bank placements ended the week at 13.5% (based on what we have been offered by various banks), while the yield on the 364-day and 182-day papers increased by 5.3 bps and 5.1 bps to 17.0% and 16.8% respectively. The yield of Cytonn Money Market Fund increased by 23.0 bps to close the week at 16.9%, from 16.7% recorded the previous week, and the average yields on the Top 5 Money Market Funds increased by 16.8 bps to 16.8% from 16.6% recorded the previous week
The table below shows the Money Market Fund Yields for Kenyan Fund Managers as published on 1st March 2024:
|
Cytonn Report: Money Market Fund Yield for Fund Managers as published on 1st March 2024 |
||
|
Rank |
Fund Manager |
Effective Annual |
|
1 |
Etica Money Market Fund |
17.4% |
|
2 |
Lofty-Corban Money Market Fund |
17.4% |
|
3 |
Cytonn Money Market Fund (Dial *809# or download the Cytonn App) |
16.9% |
|
4 |
Nabo Africa Money Market Fund |
16.6% |
|
5 |
Apollo Money Market Fund |
15.8% |
|
6 |
Kuza Money Market fund |
15.7% |
|
7 |
GenAfrica Money Market Fund |
15.6% |
|
8 |
Madison Money Market Fund |
15.2% |
|
9 |
Jubilee Money Market Fund |
15.0% |
|
10 |
Co-op Money Market Fund |
14.7% |
|
11 |
GenCap Hela Imara Money Market Fund |
14.7% |
|
12 |
AA Kenya Shillings Fund |
14.6% |
|
13 |
Enwealth Money Market Fund |
14.6% |
|
14 |
Absa Shilling Money Market Fund |
14.5% |
|
15 |
Sanlam Money Market Fund |
14.3% |
|
16 |
Mali Money Market Fund |
14.2% |
|
17 |
Mayfair Money Market Fund |
14.1% |
|
18 |
KCB Money Market Fund |
13.8% |
|
19 |
Old Mutual Money Market Fund |
13.3% |
|
20 |
Dry Associates Money Market Fund |
13.3% |
|
21 |
Orient Kasha Money Market Fund |
13.0% |
|
22 |
CIC Money Market Fund |
12.5% |
|
23 |
ICEA Lion Money Market Fund |
12.3% |
|
24 |
Equity Money Market Fund |
11.5% |
|
25 |
British-American Money Market Fund |
10.1% |
Source: Business Daily
Liquidity:
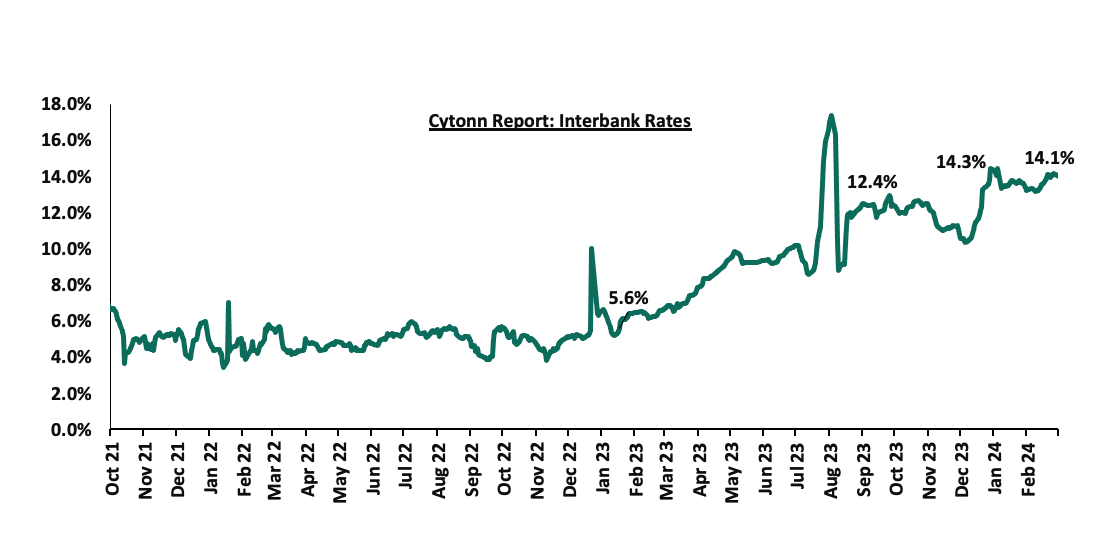
Liquidity in the money markets eased in the month of February 2024, with the average interbank rate decreasing marginally by 4.5 bps to remain relatively unchanged at 13.7% recorded the previous month. During the month of February, the average interbank volumes traded increased by 35.2% to Kshs 26.0 bn, from Kshs 19.2 bn recorded in January. Also, during the week, liquidity in the money markets tightened, with the average interbank rate increasing marginally by 5.3 bps to 14.1%, from 14.0% recorded the previous week, partly attributable to tax remittances that offset government payments. The average interbank volumes traded decreased by 33.6% to Kshs 15.7 bn, from Kshs 23.6 bn recorded the previous week. The chart below shows the interbank rates in the market over the years:
Kenya Eurobonds:
During the month, the yields on the Eurobonds were on a downward trajectory, with the yield on the 7-year Eurobond issued in 2019 decreasing the most by 1.6% points to 9.6% from 11.2% recorded at the end of January 2024. Also, during the week, the yields on Eurobonds recorded a mixed performance, with the yield on the 7-year Eurobond issued in 2019 recording the largest decrease of 0.3% points to 9.6%, from 9.9% the previous week, while the 10-year Eurobond issued in 2018 increased most by 0.2% points to 9.6% from 9.4% recorded the previous week. The table below shows the summary of the yield performance of the Kenyan Eurobonds as of 29th February 2024;
|
Cytonn Report: Summary Yield Performance of Kenya Eurobonds |
||||||
|
|
2018 |
2019 |
2021 |
2024 |
||
|
Date |
10-year issue |
30-year issue |
7-year issue |
12-year issue |
13-year issue |
6-year issue |
|
01-Jan-24 |
9.8% |
10.2% |
10.1% |
9.9% |
9.5% |
|
|
31-Jan-24 |
10.5% |
10.6% |
11.2% |
10.5% |
10.0% |
|
|
22-Feb-24 |
9.4% |
10.3% |
9.9% |
9.9% |
9.8% |
9.8% |
|
23-Feb-24 |
9.3% |
10.2% |
9.6% |
9.8% |
9.6% |
9.7% |
|
26-Feb-24 |
9.3% |
10.3% |
9.6% |
9.8% |
9.7% |
9.7% |
|
27-Feb-24 |
9.4% |
10.3% |
9.6% |
9.9% |
9.8% |
9.8% |
|
28-Feb-24 |
9.4% |
10.3% |
9.6% |
9.9% |
9.8% |
9.8% |
|
29-Feb-24 |
9.6% |
10.4% |
9.6% |
10.0% |
9.8% |
9.8% |
|
Weekly Change |
0.2% |
0.0% |
(0.3%) |
0.0% |
0.1% |
0.0% |
|
MTM Change |
(1.0%) |
(0.2%) |
(1.6%) |
(0.5%) |
(0.2%) |
- |
|
YTD Change |
(0.3%) |
0.2% |
(0.5%) |
0.1% |
0.3% |
- |
Source: Central Bank of Kenya (CBK) and National Treasury
Kenya Shilling:
During the month, the Kenya Shilling gained by 10.7% against the US Dollar, to close the month at Kshs 143.6, from Kshs 160.8 recorded at the end of January 2024, mainly on the back of increased dollar supply from the subscription of government papers mainly the February infrastructure bond, World Bank and IMF inflows as well as panic-selling of the dollar by holders, as they anticipated further depreciation of the dollar in the market.
Also, during the week, the Kenya Shilling gained by 0.4% against the US Dollar to close at Kshs 143.5 from the Kshs 144.1 recorded the previous week. On a year-to-date basis, the shilling has appreciated by 8.6% against the US Dollar, a sharp contrast to the 26.8% depreciation recorded in 2023.
We expect the shilling to be supported by:
- Diaspora remittances standing at a cumulative USD 4,253.0 mn in the 12 months to January 2024, 5.3% higher than the USD 4,039.0 mn recorded over the same period in 2023, which has continued to cushion the shilling against further depreciation. In the January 2024 diaspora remittances figures, America remained the largest source of remittances to Kenya accounting for 54.0% in the period, and,
- The tourism inflow receipts which came in at USD 333.9 mn in 2023, a 24.6% increase from USD 268.1 mn inflow receipts recorded in 2022, and owing to tourist arrivals that improved by 30.7% to 192,000 in the 12 months to December 2023, from 161,000 recorded during a similar period in 2022.
The shilling is however expected to remain under pressure in 2024 as a result of:
- An ever-present current account deficit which came at 3.5% of GDP in Q3’2023 from 6.4% recorded in a similar period in 2022,
- The need for government debt servicing, continues to put pressure on forex reserves given that 67.5% of Kenya’s external debt was US Dollar denominated as of September 2023, and,
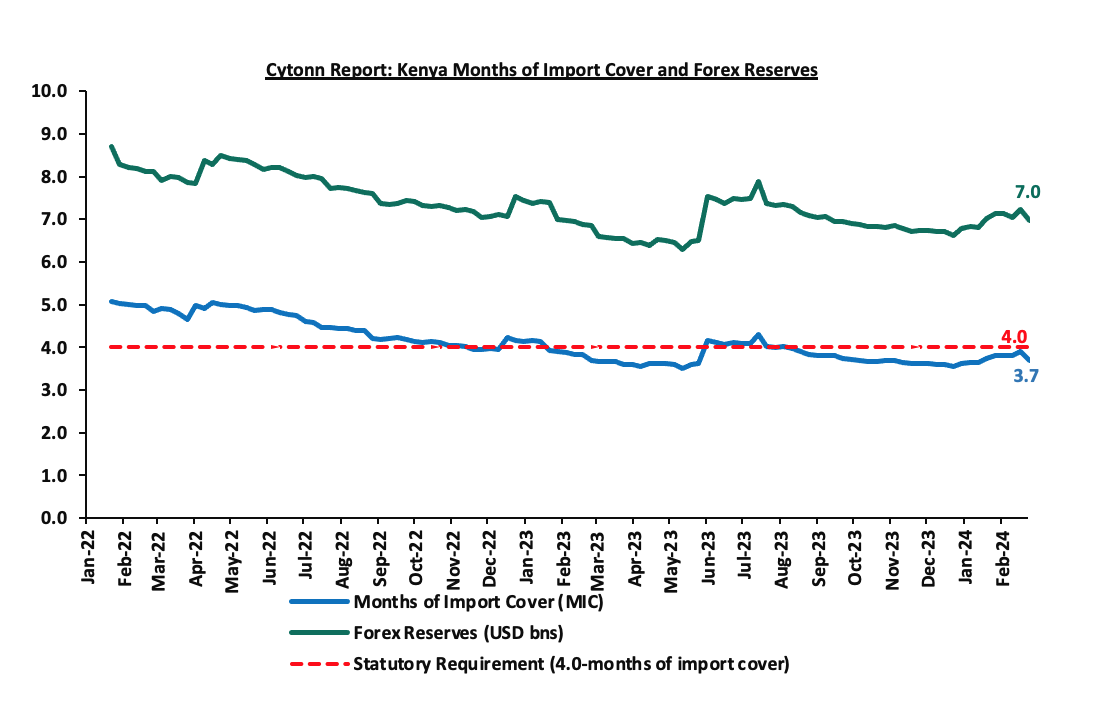
- Dwindling forex reserves, currently at USD 7.0 bn (equivalent to 3.7 months of import cover), which is below the statutory requirement of maintaining at least 4.0 months of import cover.
Key to note, Kenya’s forex reserves decreased by 3.6% during the week to USD 7.0, from USD 7.2 bn recorded the previous week, equivalent to 3.7 months of import cover, and remained below the statutory requirement of maintaining at least 4.0 months of import cover. The chart below summarizes the evolution of Kenya’s months of import cover over the years:
Weekly Highlights:
- Inflation:
The y/y inflation in February 2024 eased by 0.6% points to 6.3%, from the 6.9% recorded in January 2024. This was according to our expectations, but below our projections to within a range of 6.6% to 6.8%. The headline inflation in February 2024 was majorly driven by increase in prices of commodities in the following categories, transport; housing, water, electricity, gas and other fuels; and food and non-alcoholic beverages by 10.8%, 8.4%, and 6.9%, respectively. The table below shows a summary of both the year-on-year and month-on-month commodity indices performance:
|
Cytonn Report: Major Inflation Changes – 2024 |
|||
|
Broad Commodity Group |
Price change m/m (February-2024/January-2024) |
Price change y/y (February-2024/February-2023) |
Reason |
|
Food and Non-Alcoholic Beverages |
0.3% |
6.9% |
The m/m increase was mainly driven by the increase in prices of commodities such as spinach, Sukuma wiki and wheat flour by 3.9%, 3.4%, and 2.6%, respectively. However, the increase was weighed down by decrease in prices of tomatoes, sugar, maize grain and maize flour by 5.7%, 4.6%, 3.4 and 1.6%, respectively. |
|
Housing, Water, Electricity, Gas and Other Fuel |
(0.8%) |
8.4% |
The m/m performance was mainly driven by the decrease in prices of Electricity of 50kWh and 200kWh by 11.0% and 9.3% respectively, coupled with a 0.5% decrease in the price of kerosene per litre. However, there was an increase in the price of gas/LPG by 4.3%. |
|
Transport cost |
0.2% |
10.8% |
The m/m increase in transport Index was recorded despite the decline in the prices of a litre of petrol and diesel by 0.5% each. |
|
Overall Inflation |
0.1% |
6.3% |
The m/m increase was mainly supported by the 0.3% increase in Food and Non-Alcoholic Beverages. |
Notably, February’s overall headline inflation was back on the decline after increasing for the first time in three months in January, however, it has remained within the Central Bank of Kenya (CBK) target range of 2.5% to 7.5% for the eighth consecutive month. The decrease in headline inflation in February 2024 comes following the decline in the Petrol, Diesel and Kerosene prices which decreased by Kshs 1.0 each, to retail at Kshs 206.4, Kshs 195.5 and Kshs 193.2 per litre respectively, for the period between 15th February 2024 to 14th March 2024. The chart below shows the inflation rates for the past 5 years:
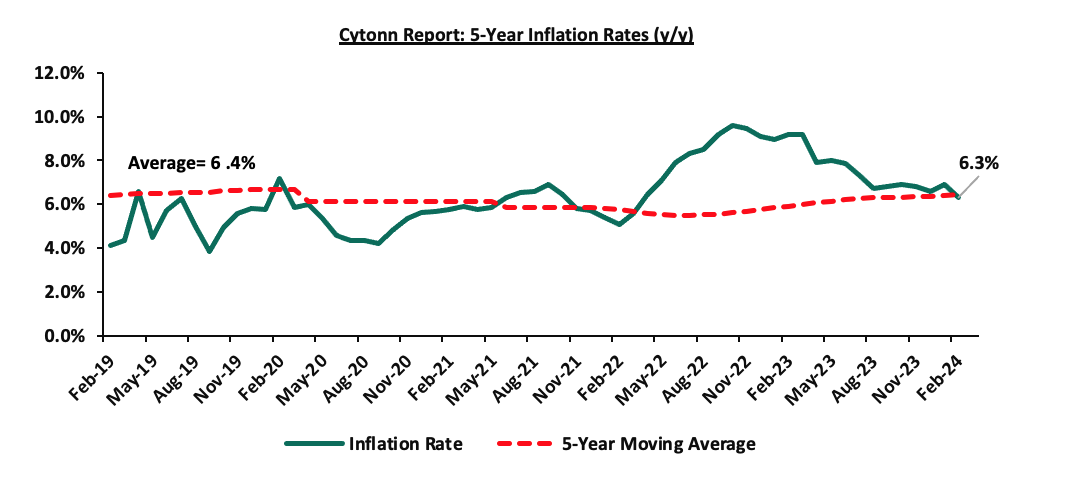
Going forward, we expect inflationary pressures to ease, mainly on the back of a strengthened currency, tighter monetary policy and reduced electricity prices. The risk, however, lies on the high fuel prices which despite their decline in February 2024, still remain elevated compared to global prices. With fuel being a major input in most businesses, we expect that this will continue exerting inflationary pressure on the economy, leaving the rate close to the upper bound of the CBK target range. Key to note is that the Monetary Policy Committee raised the Central Bank Rate to 13.0% in February 2024, from the previous 12.5% with the aim of anchoring the inflation rate. In our view, the rate will be pegged on whether the shilling will sustain its appreciation against the dollar, resulting to a decline in the import bill and costs passed to consumers through hiked consumer prices.
- The Draft 2024 Budget Policy Statement:
The National Treasury released the Draft 2024 Budget Policy Statement, in line with section 25 of the Public Finance Management (PFM) Act, 2012 which requires the National Treasury to seek and take into account the views of stakeholders and the public in preparing the Budget Policy Statement (BPS), before submission to Cabinet for approval and the subsequent submission to Parliament. The statement expresses the priority economic policies, structural reforms and the sectoral expenditure programs to be implemented under the Medium-Term Expenditure Framework for FY’2024/25–27/28.
Below is a summary of the major changes as per the BPS 2024 from the expected FY’2024/2025 budget performance:
|
Cytonn Report: Comparison of 2023/24 and 2024/25 Fiscal Year Budgets as per 2024 Budget Policy Statement |
||||
|
|
FY'2022/2023 Budget Outturn |
FY'2023/2024 Revised Estimates |
FY'2024/2025 BPS |
% change 2023/24 to 2024/25 |
|
Total revenue |
2,360.5 |
3,022.7 |
3,435.0 |
13.6% |
|
External grants |
23.1 |
47.4 |
49.3 |
4.0% |
|
Total revenue & external grants |
2,383.6 |
3,070.1 |
3,484.3 |
13.5% |
|
Recurrent expenditure |
2,311.6 |
2,761.3 |
2,859.3 |
3.5% |
|
Development expenditure & Net Lending |
493.7 |
745.1 |
877.8 |
17.8% |
|
County governments + contingencies |
415.8 |
425.0 |
451.1 |
6.1% |
|
Total expenditure |
3,221.0 |
3,931.4 |
4,188.2 |
6.5% |
|
Fiscal deficit excluding grants |
860.5 |
861.3 |
703.9 |
(18.3%) |
|
Deficit as % of GDP (Including grants) |
5.9% |
5.3% |
3.9% |
(1.4%) |
|
Net foreign borrowing |
310.8 |
412.1 |
326.1 |
(20.9%) |
|
Net domestic borrowing |
459.5 |
449.2 |
377.7 |
(15.9%) |
|
Total borrowing |
770.3 |
861.3 |
703.9 |
(18.3%) |
|
GDP Estimate |
14,274.4 |
16,158.4 |
18,015.2 |
11.5% |
Key take-outs from the table include:
- Revenue is projected to increase by 13.6% to Kshs 3.4 tn from Kshs 3.0 tn as per FY’2023/24 revised budget estimates, with proposals such as expanding the tax base already in place to work towards increasing the amount of revenue collected in the next fiscal year,
- The 2024 BPS points to a 6.5% increase of the total expenditure, to Kshs 4.2 tn from Kshs 3.9 tn in the FY’2023/24 revised budget estimates,
- Development expenditure is set to increase at a higher rate than recurrent expenditure; with development expenditure increasing by 17.8% to Kshs 877.8 bn from Kshs 745.1 bn as per the supplementary budget, while recurrent expenditure is projected to increase by 3.5% to Kshs 2.9 tn from Kshs 2.8 tn as per the FY’2023/24 supplementary budget. However, the recurrent expenditure will still constitute the largest allocation of 68.3% while development will be allocated at 21.0%
- The budget deficit is projected to decline to Kshs 703.9 bn (3.9% of GDP) in FY’2024/2025, from the projected Kshs 861.3 bn (5.3% of GDP) in the FY’2023/24 revised budget; The decline is in line with the International Monetary Fund’s (IMF’s) recommendation for fiscal consolidation, as the country seeks to reduce Kenya’s public debt requirements,
- The total borrowing requirement is expected to decline by 18.3% to Kshs 703.9 bn from Kshs 861.3 bn as per the FY’2023/24 revised budget, in a bid to reduce Kenya’s public debt burden which is estimated at 72.6% of GDP as of September 2023, 22.6% points above the East African Community (EAC) Monetary Union Protocol, the World Bank Country Policy and Institutional Assessment Index, as well as, the IMF threshold of 50.0%, and,
- Debt financing for the 2024/25 budget is estimated to consist of 46.3% foreign debt and 53.7% domestic debt, a change from the 47.8% foreign and 52.2% domestic as projected in the revised FY’2023/24.
The 2024 Budget Policy Statement is the second to be prepared under the new administration with the main aim of realizing the administration’s main objective of achieving the Bottom-Up economic model. The BPS comes at a time when the country and the rest of the world is starting to recover from economic turmoil attributable to ongoing geo-political conflicts, elevated global inflation, and supply chain disruptions. As such, the formulation of the BPS is hinged on solving these problems and ascertaining economic recovery projected at 5.5% GDP in 2024. In the event of an economic downturn, the measures would be negative discouraging entrepreneurship, growth of SMEs, and depress earnings growth in the private sector. From the statement, the implementation of the budget will rely more on increased revenue collection with the treasury putting on proposals to achieve the revenue target of Kshs 3.4 tn. The statement has also indicated a reduction in government debt to ensure fiscal consolidation to ease the debt burden of the country. In line with its manifesto, the Kenya Kwanza regime has also proposed a marginal increase in recurrent expenditure by 3.5% but significantly increased the development expenditure by 17.8% to help push the key development agendas. The proposed budget is also set to have a deficit that will be met through a mix of domestic and foreign borrowing which will reach Kshs 703.9 bn compared to Kshs 861.3 mn in the FY’2023/24 revised budget, with a probability of a decrease in the net domestic borrowing and an increase in the net foreign financing to match the proposed ratio of 45:55.
To read more of our analysis on the 2024 BPS, please see our 2024 Budget Policy Statement Note.
- Moody’s Raises Ivory Coast Credit Rating and Revises Outlook to Stable:
On 1st March 2024, the global ratings agency, Moody’s announced its revision of Ivory Coast’s credit score raising it one level to a Ba2 with a stable outlook from a credit rating of Ba3 with a positive outlook, on the back of the nation's economic resilience and increasing private sector investments. This move positions the Ivory Coast alongside emerging economies like Brazil and South Africa. The upgrade comes after Fitch affirmed the Sovereign’s Long-Term Issuer Default Rating (IDR) to BB- with a stable outlook on 2nd February 2024. Additionally, the upgrade follows S&P Global affirming Kenya’s IDR at B with a negative outlook, and Moody’s downgrading Kenya’s bank outlook to Negative from Stable on the back of high Non-Performing Loans (NPL) volumes.
The decision reflects the robust growth prospects and rising competitiveness of the Ivorian economy, signalling confidence in its ability to weather economic challenges and attract foreign investments and therefore indicating a positive outlook for the nation’s financial stability. However, it's essential to note that while Moody's has upgraded Ivory Coast's credit rating, other credit assessors like Fitch Ratings and S&P Global Ratings score the country slightly lower at BB-, and assign it a stable outlook. Despite this variance, the overall sentiment among credit agencies remains positive, reflecting confidence in Ivory Coast's economic prospects and its ability to manage its debt obligations effectively.
To note, Ivory Coast (Côte d’Ivoire) became the first Sub-Saharan Africa (SSA) country to tap into the international capital markets in January 2024, successfully issuing two bonds with respective maturities of 8.5 years and 12.5 years and coupon rates of 7.65% and 8.25% respectively, maturing on 30th January 2033 and 30th January 2037 respectively, signifying its commitment to fiscal consolidation through its IMF program and sound debt management practices.
Additionally, Benin and Kenya have followed suit in tapping into the international capital markets, with Benin issuing their debut dollar bond with a tenor of 14 years at a coupon rate of 8.375%, while Kenya successfully issued a new USD 1.5 bn Eurobond with a tenor of 6 years at a coupon rate of 9.75%.
Below is a table comparing Kenya, Ivory Coast, and Benin’s Moody’s credit rating and a summary of the Eurobond issues:
|
Cytonn Report: Moody’s Rating's Long-Term Foreign-Currency Issuer Default Rating (IDR) |
||||||
|
Moody’s Rating's Long-Term Foreign-Currency Issuer Default Rating (IDR) |
2024 Eurobond Issues |
|||||
|
Country |
IDR Credit Rating |
IDR Credit Outlook |
Date |
Value (USD mn) |
Tenor (Years) |
Coupon Rate |
|
Ivory Coast |
Ba2 |
Stable |
Mar- 2024 |
1,100.0 |
8.5 |
7.650% |
|
1,500.0 |
12.5 |
8.250% |
||||
|
Benin |
B1 |
Stable |
Sep-2023 |
750.0 |
14.0 |
8.375% |
|
Kenya |
B3 |
Negative |
May- 2023 |
1,500.0 |
6.0 |
9.750% |
Going forward, Ivory Coast's government faces the challenge of sustaining the momentum of economic growth while ensuring fiscal discipline and debt sustainability. Continued efforts to diversify the economy, improve infrastructure, and enhance the business environment will be crucial in attracting more investments and fostering long-term economic stability.
Monthly Highlights:
- During the month, the Monetary Policy Committee met on February 6, 2024, to review the outcome of its previous policy decisions against a backdrop of continued global uncertainties, moderating global oil prices, an improved global growth outlook as well as heightened geopolitical tensions. The MPC decided to raise the CBR rate by 0.5% points to 13.0% from 12.5% on account of inflation remaining sticky in the economy as well as continued pressures on the exchange rate, albeit reduced. Please see our Cytonn Weekly 06/2024,
- The Kenya announced it was going through with the earlier announced plan of buying back the 10-year tenor USD 2.0 bn Eurobond issued in 2014. In the announcement, Kenya stated that the buyback plan would be financed by the issuance of a new Eurobond. This follows successful issues by Ivory Coast and Benin which raised USD 2.6 bn and USD 750.0 mn respectively, marking the return of the Sub-Saharan region to the international Eurobonds market after nearly two years of absence. Please see our Cytonn Weekly 06/2024,
- During the month, Benin became the second country in the Sub-Saharan Africa (SSA) region to tap into the international capital markets in 2024, issuing their debut dollar bond with a tenor of 14 years and a coupon rate of 8.375%. Notably, the bond was oversubscribed with the overall subscription rate coming in at 666.7% having received bids worth USD 5.0 bn against the offered USD 750.0 mn; Please see our Cytonn Weekly 06/2024,
- The Stanbic Bank released its monthly Purchasing Manager's Index (PMI) highlighting that the index for the month of January 2024 improved slightly, coming in at 49.8, up from 48.8 in December 2023, signaling a modest and softer downturn in operating conditions across Kenya’s business environment; Please see our Cytonn Weekly 06/2024,
- The Energy and Petroleum Regulatory Authority (EPRA) released its monthly statement on the maximum retail fuel prices in Kenya, effective from 15th February 2024 to 14th March 2024. Notably, the maximum allowed price for Super Petrol, Diesel and Kerosene decreased by Kshs 1.0 each, and will retail at Kshs 206.4, Kshs 195.5 and Kshs 193.2 per litre respectively from the January 2024 prices of Kshs 207.4, Kshs 196.5 and Kshs 194.2 respectively; Please see our Cytonn Weekly 07/2024,
- During the month, The Government, through the Ministry of National Treasury & Planning has announced the successful pricing of a new USD 1.5 bn Eurobond. The new issuance (KENINT 2031) has attracted a yield of 10.375% and a coupon rate of 9.75%, in line with our expectations which were informed by the prevailing market conditions, Kenya’s credit ratings, and the unique nature of our buyback and issue plan. Interest payments for the bond are to be paid semi-annually on February 16th and August 16th starting August 2024; Please see our Cytonn Weekly 07/2024,
- The Government, on 15th February 2024, announced the results of the Tender offer of its USD 2.0 bn 10-year tenor Eurobond issued in 2014. The buyback offer received tenders worth 1.5 bn against the offered 1.4 bn, translating to an oversubscription rate of 106.1%, with Kenya accepting bids worth USD 1.4 bn, slightly below the offered USD 1.5 bn. This translated to an acceptance rate of 97.0%; Please see our Cytonn Weekly 07/2024,
- During the month, the global ratings agency, S&P Global affirmed Kenya's long-term sovereign credit rating at 'B' with a negative outlook and assigned a 'B' long-term issue rating to the proposed U.S. dollar-denominated Eurobonds. This came in following the buyback of the 10-year tenor USD 2.0 bn Eurobond tenders issued in 2014 and the new issuance of the KENINT 2031 Eurobond priced at USD 1.5 bn. In addition, the global ratings agency, Moody’s announced its revision of the Kenyan banks’ outlook to negative from stable on the back of the high volume of non-performing loans (NPLs), which have thrown a pall over the sector's strong profitability and liquidity. Please see our Cytonn Weekly 07/2024,
- The National Treasury gazetted the revenue and net expenditures for the seventh month of FY’2023/2024, ending 31st January 2024 highlighting that total revenue collected as at the end of January 2024 amounted to Kshs 1,261.0 bn, equivalent to 48.9% of the revised estimates of Kshs 2,576.8 bn for FY’2023/2024 and is 83.9% of the prorated estimates of Kshs 1,503.1 bn; Please see our Cytonn Weekly 07/2024, and,
- Yields on the Government securities have been on an upward trajectory with the 91-day paper now yielding 16.6% from 9.4% in January 2023. Going forward, we anticipate a very modest increase in yields on the government papers before they stabilize in the remaining months of FY’2023/24. The increase will be muted going forward due to the positive investor sentiment brought about by the successful offering of the Eurobond, which helped alleviate the fears of possible default by the government. Please see our Cytonn Weekly 08/2024.
Rates in the Fixed Income market have been on an upward trend given the continued high demand for cash by the government and the occasional liquidity tightness in the money market. The government is 1.5% ahead of its prorated net domestic borrowing target of Kshs 319.9. bn, having a net borrowing position of Kshs 324.5 bn of the domestic net borrowing target of Kshs 471.4 bn for the FY’2023/2024. Therefore, we expect a continued upward readjustment of the yield curve in the short and medium term, with the government looking to reclaim a fiscal surplus through the domestic market. Owing to this, our view is that investors should be biased towards short-term fixed-income securities to reduce duration risk.
Market Performance:
During the month of February 2024, the equities market was on an upward trajectory, with NSE 10 gaining the most by 3.4%, while NSE 25, NSE 20, and NASI gained by 2.7%, 1.8% and 0.3% respectively. The equities market performance was driven by gains recorded by large-cap stocks such as ABSA Group, Cooperative Bank, and Equity Group of 9.8%, 7.4%, and 6.6% respectively. The gains were, however, weighed down by losses recorded by large cap stocks such as Safaricom, BAT, and Stanbic of 2.6%, 2.4%, and 1.6% respectively;
During the week, the equities market was on an upward trajectory, with NSE 10 and NSE 25 gaining the most by 0.7%, while NASI and NSE 20 gained by 0.5% and 0.2% respectively, taking the YTD performance to gains of 1.4%, 2.0%, 4.4% and 4.5% for NASI, NSE 20, NSE 25 and NSE 10 respectively. The equities market performance was driven by gains recorded by large-cap stocks such as DTBK, ABSA Group, and NCBA of 7.6%, 5.7%, and 4.0% respectively. The gains were, however, weighed down by losses recorded by large cap stocks such as Equity Group, EABL, and SCBK of 2.4%, 1.4%, and 1.1% respectively.
Equities turnover increased by 82.5% in the month of February to USD 30.6 mn, from USD 16.8 mn recorded in January 2024. Foreign investors remained net sellers, with a net selling position of USD 6.2 mn, from a net selling position of USD 1.2 mn recorded in January 2024.
During the week, equities turnover increased by 23.0% to USD 10.6 mn from USD 8.7 mn recorded the previous week, taking the YTD total turnover to USD 50.4 mn. Foreign investors remained net sellers for the eighth consecutive week with a net selling position of USD 3.4 mn, from a net selling position of USD 1.5 mn recorded the previous week, taking the YTD foreign net selling position to USD 8.1 mn.
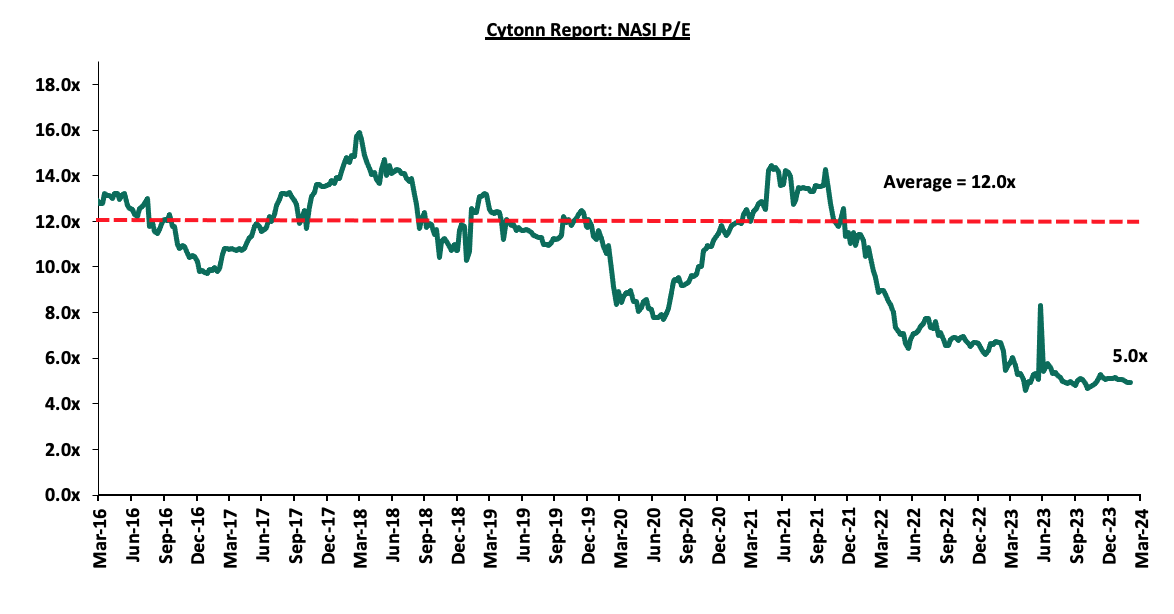
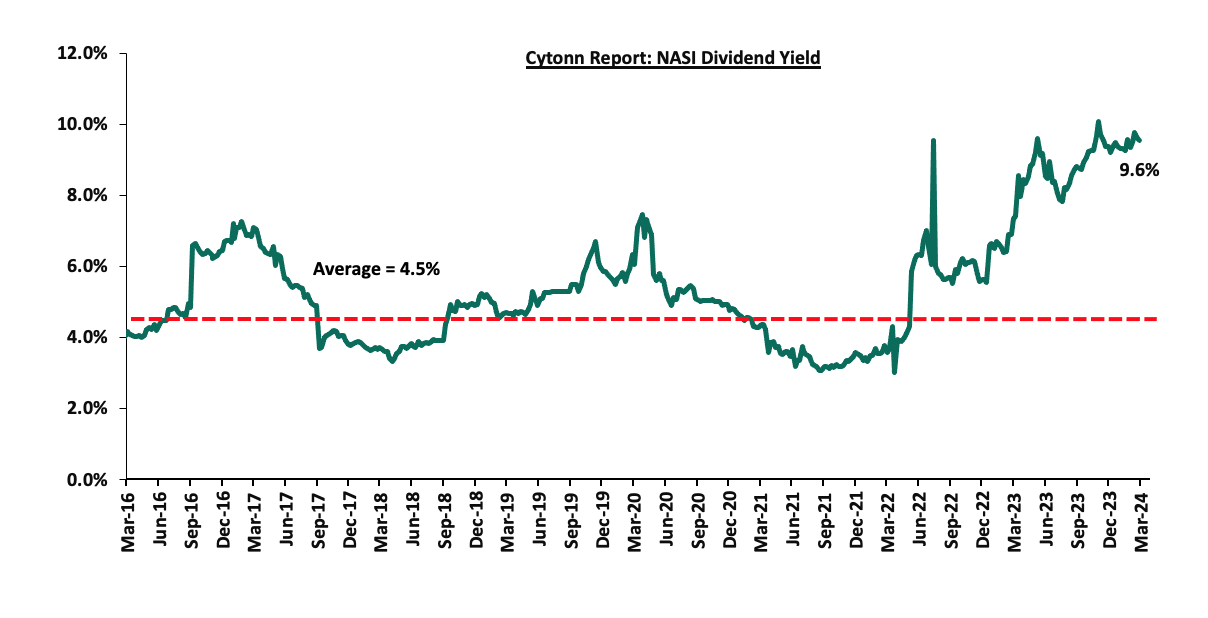
The market is currently trading at a price-to-earnings ratio (P/E) of 5.0x, 58.8% below the historical average of 12.0x. The dividend yield stands at 9.5%, 5.0% points above the historical average of 4.5%. Key to note, NASI’s PEG ratio currently stands at 0.6x, an indication that the market is undervalued relative to its future growth. A PEG ratio greater than 1.0x indicates the market is overvalued while a PEG ratio less than 1.0x indicates that the market is undervalued. The charts below indicate the historical P/E and dividend yields of the market;
Universe of Coverage:
|
Cytonn Report: Equities Universe of Coverage |
|||||||||||
|
Company |
Price as at 23/02/2024 |
Price as at 01/03/2024 |
w/w change |
m/m change |
YTD Change |
Year Open 2024 |
Target Price* |
Dividend Yield |
Upside/ Downside** |
P/TBv Multiple |
Recommendation |
|
Sanlam |
7.0 |
6.1 |
(12.1%) |
(3.1%) |
2.0% |
6.0 |
10.3 |
0.0% |
68.1% |
1.7x |
Buy |
|
KCB Group*** |
20.5 |
21.2 |
3.4% |
3.0% |
(3.4%) |
22.0 |
31.2 |
9.4% |
56.6% |
0.4x |
Buy |
|
Jubilee Holdings |
180.0 |
185.0 |
2.8% |
2.2% |
0.0% |
185.0 |
260.7 |
6.5% |
47.4% |
0.3x |
Buy |
|
Kenya Reinsurance |
2.0 |
2.0 |
0.5% |
8.2% |
6.5% |
1.9 |
2.5 |
10.2% |
37.6% |
0.2x |
Buy |
|
NCBA*** |
37.6 |
39.1 |
4.0% |
4.1% |
0.6% |
38.9 |
48.3 |
10.9% |
34.4% |
0.8x |
Buy |
|
Britam |
4.7 |
4.5 |
(4.0%) |
(12.3%) |
(11.7%) |
5.1 |
6.0 |
0.0% |
31.5% |
0.6x |
Buy |
|
CIC Group |
2.1 |
2.0 |
(2.9%) |
1.0% |
(12.2%) |
2.3 |
2.5 |
6.5% |
30.8% |
0.6x |
Buy |
|
Diamond Trust Bank*** |
45.5 |
49.0 |
7.6% |
(1.5%) |
9.4% |
44.8 |
58.5 |
10.2% |
29.7% |
0.2x |
Buy |
|
I&M Group*** |
18.9 |
18.9 |
0.3% |
6.0% |
8.3% |
17.5 |
22.1 |
11.9% |
28.8% |
0.4x |
Buy |
|
Standard Chartered*** |
164.0 |
162.3 |
(1.1%) |
0.3% |
1.2% |
160.3 |
185.5 |
13.6% |
27.9% |
1.1x |
Buy |
|
Stanbic Holdings |
114.8 |
115.0 |
0.2% |
(1.6%) |
8.5% |
106.0 |
132.8 |
11.0% |
26.4% |
0.8x |
Buy |
|
ABSA Bank*** |
12.3 |
13.0 |
5.7% |
9.8% |
12.1% |
11.6 |
14.6 |
10.4% |
23.2% |
1.0x |
Buy |
|
Liberty Holdings |
5.5 |
5.0 |
(9.1%) |
10.0% |
29.5% |
3.9 |
5.9 |
0.0% |
18.4% |
0.4x |
Accumulate |
|
Co-op Bank*** |
12.9 |
13.1 |
1.2% |
7.4% |
15.0% |
11.4 |
13.8 |
11.5% |
17.2% |
0.6x |
Accumulate |
|
Equity Group*** |
41.0 |
40.0 |
(2.4%) |
6.4% |
17.0% |
34.2 |
42.8 |
10.0% |
17.0% |
0.9x |
Accumulate |
|
HF Group |
4.1 |
4.0 |
(3.4%) |
6.7% |
15.9% |
3.5 |
3.9 |
0.0% |
(2.5%) |
0.2x |
Sell |
|
Target Price as per Cytonn Analyst estimates **Upside/ (Downside) is adjusted for Dividend Yield ***For Disclosure, these are stocks in which Cytonn and/or its affiliates are invested in |
|||||||||||
Weekly Highlights:
- Kenya Electricity Generating Company (KenGen) H1’2023 Financial Performance
During the week, Kenya Electricity Generating Company released their H1’2023 financial results, recording a 9.2% decline in Profits after Tax (PAT) to Kshs 3.0 bn, from Kshs 3.3 bn recorded in H1’2022. The decline in PAT was majorly attributed to the 16.4% increase in operating expenses to Kshs 10.1 bn from Kshs 8.7 bn, coupled with the 25.7% increase in income tax to Kshs 1.9 bn in H1’2023 from Kshs 1.5 bn recorded in H1’2022. The performance was further weighed down by the 27.2% increase in finance costs to Kshs 1.9 bn in H1’2023, from Kshs 1.5 bn recorded in H1’2022. The tables below show the breakdown of KenGen’s financial performance;
|
Cytonn Report: Kenya Electricity Generating Company (KenGen) H1'2023 Performance |
|||
|
Income Statement |
H1'2022 Kshs (bn) |
H1'2023 Kshs (bn) |
% Change |
|
Revenue |
27.5 |
28.5 |
3.9% |
|
Fuel & Water Costs |
(4.5) |
(3.8) |
(16.1%) |
|
Revenue Net Reimbursable Expenses |
22.9 |
24.7 |
7.8% |
|
Other Income |
0.3 |
0.3 |
15.8% |
|
Gains/(Losses) on Net Forex & Fair Valuation of Financial assets |
(0.2) |
(0.1) |
(44.2%) |
|
Expenses |
(18.1) |
(20.5) |
13.1% |
|
Operating Profit |
4.9 |
4.4 |
(9.1%) |
|
Finance Income |
1.0 |
1.9 |
82.4% |
|
Finance Cost |
(1.2) |
(1.5) |
27.2% |
|
Profit/(Loss) Before Tax |
4.7 |
4.8 |
1.8% |
|
Income Tax |
(1.5) |
(1.9) |
25.7% |
|
Profit/(Loss) After Tax |
3.3 |
3.0 |
(9.2%) |
|
Earnings Per Share (EPS) |
0.5 |
0.5 |
(8.2%) |
Source: Kenya Electricity Generating Company (KenGen) H1’2023 Financial Report
|
Cytonn Report: Kenya Electricity Generating Company (KenGen) H1'2023 Performance |
|||
|
Balance Sheet |
H1'2022 Kshs (bn) |
H1'2023 Kshs (bn) |
% Change |
|
Non-Current Assets |
465.4 |
481.6 |
3.5% |
|
Current Assets |
42.4 |
51.9 |
22.5% |
|
Total Assets |
507.8 |
533.5 |
5.1% |
|
Non-Current Liabilities |
207.5 |
234.9 |
13.2% |
|
Current Liabilities |
23.3 |
23.4 |
0.4% |
|
Total Liabilities |
230.8 |
258.3 |
11.9% |
|
Total Equity |
277.0 |
275.2 |
(0.7%) |
Source: Kenya Electricity Generating Company (KenGen) H1’2023 Financial Report
Key takeouts from the financial performance include;
- Net revenue increased by 7.8% to Kshs 24.7 bn in H1’2023, from Kshs 22.9 bn recorded in H1’2022, mainly driven by the 16.1% decline in reimbursable expenses (fuel & water costs) to Kshs 3.8 bn in H1’2023, from Kshs 4.5 bn in H1’2022. Notably, the decrease in reimbursable expenses is attributed to the impact of favourable hydrology and plant efficiency,
- Income tax increased by 25.7% to Kshs 1.9 bn, from Kshs 1.5 bn attributable to the increase in unrealized foreign exchange losses disallowable for tax purposes as a result of the depreciation of the Kenya Shilling during the period,
- Operating profit decreased by 9.1% to Kshs 4.4 bn in H1’2023, from Kshs 4.9 bn in H1’2022, largely driven by the 13.1% increase in the total expenses to 20.5 bn from 18.1 bn as a result of increased plant operating and maintenance costs,
- The current liabilities increased marginally by 0.4% to Kshs 23.4 bn in H1’2023, from Kshs 23.3 bn recorded in H1’2022, mainly attributable to increased borrowing which saw the finance costs increase by 27.2% to Kshs 1.9 bn in H1’2023, from Kshs 1.5 bn recorded in H1’2022.
- Earnings per share decreased significantly by 8.2% to Kshs 0.45 in H1’2023, from Kshs 0.49 in H1’2022, mainly due to the 13.7% decline in the company’s profit after tax by 9.2% to Khs 3.0 bn from Kshs 3.3 bn, and,
- The board of directors did not recommend an interim dividend for the period.
Amidst the tough macroeconomic climate, KenGen recorded a 9.2% decline in Profits after Tax (PAT) to Kshs 3.0 bn in H1’2023, from Kshs 3.3 bn recorded in H1’2022. The challenging operating environment was characterized by local currency depreciation and high inflationary pressures eroding consumers’ purchasing power, which led to increased operating expenses and tax expenses thus weighing down the company’s profitability. Going forward, we expect the company’s earnings to be supported by increased revenues as a result of increased national demand for clean electric energy. Notably, the company has continued to implement strategies to increase production and revenue such as scheduling the rehabilitation of Olkaria I geothermal power plant to increase its capacity to 63.0 MW, commencing the implementation of Olkaria I Additional Units 4 & 5 and Olkaria IV Uprating Project to increase the combined capacity to 340MW, rebuilding the Gogo hydro-power plant and securing funding for the Seven Forks Solar PV project.
Monthly Highlights:
During the month, British American Tobacco Kenya Plc released their FY’2023 financial results, recording a 19.2% decline in Profits after Tax (PAT) to Kshs 5.6 bn, from Kshs 6.9 bn recorded in FY’2022. The decline in PAT was majorly attributed to the 2.4% decrease in Gross Sales to Kshs 41.2 bn in FY’2023 from Kshs 42.2 bn recorded in FY’2022. The performance was further weighed down by the 5.5% increase in indirect taxes to Kshs 15.7 bn in FY’2023, from Kshs 14.9 bn recorded in FY’2022 mainly driven by the upward revision of excise duty by 10.0% in July 2022 and a further 6.0% increment in October 2022. For more details, please see our Cytonn Weekly #07/2024.
We are “Neutral” on the Equities markets in the short term due to the current tough operating environment and huge foreign investor outflows, and, “Bullish” in the long term due to current cheap valuations and expected global and local economic recovery. With the market currently being undervalued for its future growth (PEG Ratio at 0.6x), we believe that investors should reposition towards value stocks with strong earnings growth and that are trading at discounts to their intrinsic value. We expect the current high foreign investors’ sell-offs to continue weighing down the equities outlook in the short term.
- Industry Reports
During the month, the following industry reports were released and the key take-outs were as follows;
|
Cytonn Report: Notable Industry Reports During the Month of February 2024 |
|||
|
# |
Theme |
Report |
Key Take-outs |
|
1 |
Hospitality and Construction Sectors |
The Leading Economic Indicators (LEI) December 2023 Report by National Bureau of Statistics (KNBS) |
· In the month of November 2023, the number of visitor arrivals recorded stood at 123,604 persons, compared to 107,854 persons recorded during a similar period in 2022. On a year-on-year (y/y) basis, the performance represented a 27.3% increase to 1,361,934 persons, compared to 1,070,011 persons recorded during a similar period in 2022 · In the month of December 2023, the value of building plans approved in the Nairobi Metropolitan Area increased by 54.1% to Kshs 22.1 bn from Kshs 14.3 bn recorded in November 2023. On a q/q basis, the value of approved building plans in Q4’2023 decreased by 13.9% to Kshs 52.6 bn from Kshs 61.1 bn recorded in Q3’2023. On a y/y basis, the value of approved building plans in the NMA increased by 30.1% to Kshs 195.7 bn as at December, from Kshs 150.3 bn recorded during a similar period in 2022. For more information, please see our Cytonn Weekly #07/2024 |
|
2 |
Residential, Commercial Office, Retail, and Industrial sectors |
The Kenya Market Update H2’2023 Report by Knight Frank |
· In the residential sector, the average selling prices for prime housing units increased by 0.3% points in H2’2023. On y/y basis, the sector registered a 2.5% increase, lower than an annual appreciation of 4.1% registered in 2022 · The average asking rents for prime commercial office spaces stagnated at USD 1.2 per SQFT in H2’2023 from H1’2023. Commercial office space occupancy increased by 5.0% to 76.5% in H2’2023 from 71.5% recorded in H1’2023 · In the retail sector, prime rents ranged between Kshs 250 per SQF on the uppermost floors to Kshs 800 per SQF on the ground floor in Nairobi suburbs · In the retail sector, prime rents ranged between Kshs 250 per SQF on the uppermost floors to Kshs 800 per SQF on the ground floor in Nairobi suburbs. For more information, please see our Cytonn Weekly #07/2024 |
|
3 |
Residential and Land Sectors |
The House Price Index Q4’2023 Report and Land Price Index Q4’2023 Report by Hass Consult |
· The average quarter-on-quarter (q/q) selling prices for all the properties registered a 4.1% increase in Q4’2023, compared to a 2.2% decrease in Q4’2022 · The overall asking rents of housing units in the NMA during Q4’2023 increased by 2.5% q/q, compared to a 1.5% decline recorded in Q4’2022. On a y/y basis, the average asking rent increased by 2.5% compared to the 0.3% increase recorded in Q4’2022 · Apartments recorded the highest y/y increase in asking rents of 10.2% in Q4’2023, a 5.7% increase from Q4’2022. Conversely, detached units experienced a price correction of 1.4%, while semi-detached units saw a price increase of 2.5% during the period under review · Within the Nairobi Suburbs detached and semi-detached houses market, Langata emerged as the top performer, witnessing a y/y sales price appreciation of 12.9% · In the Nairobi Suburbs apartments, Lang’ata remained to be the best-performing region recording a y/y capital appreciation of 11.4%. · In the satellite towns, properties in Athi River saw the highest year-on-year price appreciation, standing at 14.5% · In satellite towns’ apartments, Thika recorded the highest y/y price appreciation of 9.6% which was supported by good infrastructure access and a growing population · The average q/q selling prices for land in the Nairobi suburbs grew by 3.3%, compared to 0.2% increase recorded in Q4’2022. On a y/y basis the performance represented 4.0% increase, compared to the 1.2% increase recorded in Q4’2022 · Loresho was the best-performing node in the Nairobi suburbs with a y/y price appreciation of 11.0% · For satellite town, Ngong was the best-performing node with a y/y capital appreciation of 21.4%, followed by Thika which recorded a y/y capital appreciation of 17.8%. For more information, please see our Cytonn Weekly #06/2024 |
Going forward, we anticipate positive growth and enhanced performance in Kenya's Real Estate sector bolstered by factors such as rise in the number of visitor’s arrival in the country, increased value of building plans approved in Nairobi Metropolitan Area (NMA), growing population and infrastructure development. However, we expect growth in the sector to be dampened by rise in the cost of construction and the prevailing tough macro-economic environment.
- Residential Sector
- Nakuru County Government receives funding to Upgrade Informal Settlements
During the week, the County Government of Nakuru announced that it had received Kshs 580.0 mn from the World Bank to upgrade low-income informal settlements of Kwa-Murogi, London, and Lake View in Nakuru, as well as Karagita in Naivasha. This funding is part of a larger sum of Kshs 24.1 bn (USD 150.0 mn) provided by the World Bank and Kshs 7.6 bn (USD 46.6 mn) by the French Development Agency. The implementation of the national project which aims to benefit around 400 informal settlements across the country is being overseen by the State Department of Housing and Urban Development.
The funding was allocated under the second phase of the Kenya Informal Settlement Improvement Programme (KISIP) and is designated to improve drainage infrastructure, waste management, roads, and to install street lighting and high-mast floodlights. Additionally, allocated funds will be used to finance the issuing of title deeds to residents in the informal settlements, laying sewerage lines, and providing water connectivity. In the third phase, areas like Kapkures and Kiratina in Nakuru city, Mwisho wa Lami in Molo, and Tayari low-income settlement in Molo will also undergo upgrades.
The initiative comes at a time when Nakuru City's population is increasing rapidly, necessitating adequate water supply for both domestic and industrial purposes. Several slum areas in Nakuru have already benefited from the first phase of the project, where Nakuru County received a Kshs 429.7 mn grant. These funds were primarily directed towards improving drainage infrastructure, waste management, road tarmacking, and installing floodlights in eight informal settlements, including Kaptembwo in Nakuru, with a population of over 120,000 residents, as well as Kivumbini, Kwa-Ronda, Flamingo, Kaloleni, and Bondeni in Nakuru, and Karagita, Kamere, and Kihoto in Naivasha.
Moreover, progress has been reported on the tarmacking of a 950-meter road with a six-meter carriageway in Lake View, which is now about 90.0% complete, while works on a 1.2km road and 2.4km walkway improvement have already commenced.
The KISIP project aims to complement the national government's efforts in providing affordable housing. We anticipate that the project will; i)create employment opportunities, ii) improve the livelihoods of local residents, iii) boost economic activities, and iv) attract more investment to the area.
- Kenya Mortgage Refinance Company establishes a partial mortgage guarantee facility
During the week, the Kenya Mortgage Refinance Company (KMRC) announced plans to establish a partial mortgage guarantee scheme targeting low-income earners by the end of this year. This initiative seeks to establish a risk-sharing facility intended to cushion banks and SACCOs by providing a partial guarantee for any mortgage extended to individuals deemed high-risk. The facility aims at expanding access to housing and boosting lenders' confidence.
Additionally, KMRC aims to implement other interventions, including; i) onboarding additional Primary Mortgage Lenders (PMLs). We note that KMRC has managed to disburse Kshs 8.7 bn out of the Kshs 9.6 bn mortgage loans approved for refinancing to 12 PMLs out of the 20 eligible PMLs who are members of KMRC as at November 2023, ii) introducing new products such as green mortgages, Shariah-compliant mortgages, and developer financing. Additionally, KMRC has revealed its intentions to seek funding from the capital markets through the second phase of its Medium-Term Note (MTN) program once economic conditions become more favorable. KMRC issued its inaugural bond in March 2022 and raised Kshs 1.4 bn in its in 1st tranche, where it attracted bids worth Kshs 8.1 bn, against the Kshs 1.4 bn offered translating to an oversubscription rate of 478.6%. The funds generated from the bond issuance were utilized in refinancing long-term loans aimed at enabling Primary Mortgage Lenders to extend mortgage loans to borrowers. For more information, please see our topical on the Update on Kenya Mortgage Refinance Company (KMRC).
We expect the initiative to; i) boost mortgage uptake in the country which stood at 27,786 loan accounts as at December 2022, ii) promote home ownership rates in the country by improving accessibility to mortgage options, iii) increase lenders’ confidence, and, iv) stimulate economic activities in general.
Notable highlights in the sector during the month include;
- Shelter Afrique, a pan-African finance institution that exclusively supports the development of the housing and real estate sector in Africa, signed a partnership with the government aimed at facilitating the sale of apartments and maisonettes totaling Kshs 1.6 bn to senior civil servants. This partnership is poised to aid Shelter Afrique in offloading units that have remained unsold for extended periods, in some cases spanning years. For more information, please see our Cytonn Weekly #08/2024,
- Kenya Mortgage Refinance Company (KMRC), a state-backed mortgage refinancing entity, increased the maximum loan size across the country to Kshs 10.5 mn from Kshs 8.0 mn and Kshs 6.0 mn for the Nairobi Metropolitan Area and the rest of the country, respectively. For more information, please see our Cytonn Weekly #07/2024, and,
- President Ruto laid the foundation for the Makenji Affordable Housing Project located in Kandara Constituency, Murang’a County. The project will consist of 220 units, including 60 studio apartments, 100 two-bedroom apartments, and 60 three-bedroom apartments. Additionally, the project will occupy a four-acre piece of land provided by the County Government under a Public-Private Partnership (PPP). For more information, please see our Cytonn Weekly #07/2024.
Going forward, we expect to witness growth in the residential sector, driven by intensified initiatives from both governmental and private entities to tackle the country's housing shortage. Additionally, we foresee continued demand for residential housing driven by positive demographic such as rising population and urbanization rates at 1.9% and 3.7% respectively, relatively higher than the global averages of of 0.8% and 1.5%, as of 2022. Nevertheless, we anticipate challenges ahead which we expect will weigh down on the sector’s optimum performance, including rising construction costs and challenging macroeconomic conditions.
- Retail Sector
During the week, Naivas Supermarket, a local retailer, opened its most recent store in the Survey area, situated along Thika Road, bringing its total number of outlets countrywide to 103. This new establishment benefits from convenient access to Thika Super Highway, known for its high volume of vehicular traffic. Naivas is currently undergoing an extensive expansion phase, evidenced by the recent opening of another branch in Nairobi's Westlands area. In the year 2024 alone, Naivas has launched three new branches, solidifying its position as one of the leading supermarket chains in the country. Retailers have been actively pursuing expansion, aiming to broaden their customer reach and adjust to the changing demands of the market. In addition to Naivas, other retailers that have opened outlets in 2024 include Jaza Stores and Quick Mart. The following table outlines the current store counts of major local and international supermarket chains operating in Kenya and international supermarket chains operating in Kenya;
|
Cytonn Report: Main Local and International Retail Supermarket Chains |
||||||||||
|
Name of retailer |
Category |
Branches as at FY’2018 |
Branches as at FY’2019 |
Branches as at FY’2020 |
Branches as at FY’2021 |
Branches as at FY’2022 |
Branches as at FY’2023 |
Branches opened in FY’2024 |
Closed Branches |
Current Branches |
|
Naivas |
Hybrid* |
46 |
61 |
69 |
79 |
91 |
100 |
3 |
0 |
103 |
|
Quick Mart |
Hybrid** |
10 |
29 |
37 |
48 |
55 |
59 |
1 |
0 |
60 |
|
Chandarana |
Local |
14 |
19 |
20 |
23 |
26 |
26 |
0 |
0 |
26 |
|
Carrefour |
International |
6 |
7 |
9 |
16 |
19 |
22 |
0 |
0 |
22 |
|
Cleanshelf |
Local |
9 |
10 |
11 |
12 |
12 |
13 |
0 |
0 |
13 |
|
Jaza Stores |
Local |
0 |
0 |
0 |
0 |
0 |
4 |
2 |
0 |
6 |
|
Tuskys |
Local |
53 |
64 |
64 |
6 |
6 |
5 |
0 |
59 |
5 |
|
Uchumi |
Local |
37 |
37 |
37 |
2 |
2 |
2 |
0 |
35 |
2 |
|
Panda Mart |
International |
0 |
0 |
0 |
0 |
0 |
0 |
1 |
0 |
1 |
|
Game Stores |
International |
2 |
2 |
3 |
3 |
0 |
0 |
0 |
3 |
0 |
|
Choppies |
International |
13 |
15 |
15 |
0 |
0 |
0 |
0 |
15 |
0 |
|
Shoprite |
International |
2 |
4 |
4 |
0 |
0 |
0 |
0 |
4 |
0 |
|
Nakumatt |
Local |
65 |
65 |
65 |
0 |
0 |
0 |
0 |
65 |
0 |
|
Total |
|
257 |
313 |
334 |
189 |
211 |
231 |
7 |
181 |
238 |
|
*51% owned by IBL Group (Mauritius), Proparco (France), and DEG (Germany), while 49% owned by Gakiwawa Family (Kenya) |
||||||||||
|
**More than 50% owned by Adenia Partners (Mauritius), while Less than 50% owned by Kinuthia Family (Kenya) |
||||||||||
Source: Cytonn Research
Going forward, we expect to see more expansion efforts from both local and international retailers as they endeavor to grow their market presence and address voids left by notable competitors like Choppies Supermarket, Game Stores, Shoprite, and Uchumi Supermarket.
- Infrastructure Sector
Notable highlights during the month include;
- Kenya Urban Roads Authority (KURA) announced plans to enhance traffic safety and flow by installing new traffic lights and surveillance cameras at 125 intersections. The project which is to be funded by a loan from the Exim Bank of China and implemented by Chinese contractors, aims to improve road safety and ease congestion. For more information, please see our Cytonn Weekly #06/2024.
Moving forward, we expect more projects to be completed as the government works to improve the country's infrastructure. However, we anticipate a slowdown in the initiation of new development, maintenance and rehabilitation projects particularly in the roads segment. This we attribute to an 8.3% decrease in budgetary allocations in the FY’2023/24 to Kshs 230.1 bn from Kshs 250.8 bn in FY’2022/23. This was on the back of redirection of funds by the government to other key sectors such as education, as well as to address mounting costs over debt repayment, on the back of increasing debt obligations exacerbated by the continued depreciation of the Kenyan Shilling.
- Industrial Sector
Notable highlights during the month include;
- Airtel Africa announced plans to build a data centre in Nairobi, which will become its second facility in Africa after Nigeria in a move to diversify its revenue streams. The data centre in Nairobi will be mainly usable in the telecommunication sector as well as in other sectors. Additionally, the centre will have a capacity of 7.0 megawatts to trail the 36-megawatt centre that it plans to build in Lagos, Nigeria. For more information, please see our Cytonn Weekly #07/2024, and,
- International Finance Corporation (IFC) announced its plans to lend Kshs 4.8 bn (USD 30.0 mn) to Bora Africa, a REIT-like investment vehicle focused on investing in industrial properties and real estate assets in Kenya and Africa. Bora Africa, is a special purpose vehicle of the Mauritian based firm Grit Real Estate Income Group and aims to utilize the IFC funds to expand its project pipeline, further enhancing its presence in the industrial real estate market on the continent. For more information, please see our Cytonn Weekly #06/2024.
We expect to witness growth in the sector supported by; i) increased investment by both local and international industry players, ii) growing demand for data centres and cold rooms in the region, iii) government’s efforts to establish County Aggregation and Industrial Parks (CAIPs) with a budget of Kshs 500 mn, iv) efforts by the government to support investment in Special Economic Zones (SEZ) and Export Processing Zones (EPZ), and, v) the growing ecommerce business which is driving the need for warehouses.
- Regulated Real Estate Funds
- Real Estate Investments Trusts (REITs)
In the Unquoted Securities Platform, Acorn D-REIT and I-REIT traded at Kshs 24.4 and Kshs 21.7 per unit, respectively, as of 1st March 2024. The performance represented a 22.0% and 8.3% gain for the D-REIT and I-REIT, respectively, from the Kshs 20.0 inception price. The volumes traded for the D-REIT and I-REIT came in at 12.3 mn and 30.7 mn shares, respectively, with a turnover of Kshs 257.5 mn and Kshs 633.8 mn, respectively, since inception in February 2021.
REITs enjoys several advantages such as, diversified assets portfolios, table long-term profits and tax exemptions.However, the ongoing decline in the performance of Kenyan REITs and the need for restructuring their business portfolios are impeding significant investments that were previously made.The segment’s growth remains limited due to; i) limited investor knowledge, ii) high minimum capital requirements of Kshs 100.0 mn for Trustees, iii) prolonged approval process for REITs, iv) high minimum investment amounts of 5.0 mn for investors, and shallow Investment-Grade asset pipeline.
We expect the performance of Kenya’s Real Estate sector to remain resilient, supported by factors such as positive demographics such relative high population and urbanization rate at 1.9% and 3.7% respectively, ongoing infrastructure development projects by the government, more expansion activities by retailers in country, increased activities in the residential sector by the government and the private players under the affordable housing program, increased activities geared towards growing the mortgage market by industry players such as Kenya Mortgage Refinance Company (KMRC). On the other hand, we expect the sector’s growth to be limited by factors such as rising construction costs, prevailing tough macro-economic conditions and limited investor knowledge on REITs.
Unit Trust Funds (UTFs) are a type of Collective Investment Scheme that pool funds from various investors to collectively invest in a diversified portfolio of assets, managed by a Fund Manager, with the aim of generating returns for the investors. These funds are overseen by expert fund managers who allocate the collected capital into a diverse range of securities like equities, bonds, or other approved financial securities. The goal is to yield returns that align with the fund’s specific objectives. Following the release of the Capital Markets Authority (CMA) Quarterly CIS Report-Q4'2023, we examine the performance of Unit Trust Funds for the period ended 31st December 2023. These funds have seen consistent growth in total Assets Under Management (AUM) and are one of the preferred investment choices in Kenya. Additionally, we will delve into the performance of Money Market Funds, which are a subset of Unit Trust Funds.
In our previous focus on Unit Trust Funds, we looked at the Unit Trust Funds Performance – Q3'2023 by Fund Managers, where we highlighted that their AUM stood at Kshs 206.7 bn, a 17.4% growth from Kshs 176.0 bn recorded in Q2’2023. In this topical, we focus on the Q4’2023 performance of Unit Trust Funds where we shall analyze the following:
- Performance of the Unit Trust Funds Industry,
- Performance of Money Market Funds,
- Comparing Unit Trust Funds AUM Growth with other Markets, and,
- Recommendations.

Disclaimer: The views expressed in this publication are those of the writers where particulars are not warranted. This publication, which is in compliance with Section 2 of the Capital Markets Authority Act Cap 485A, is meant for general information only and is not a warranty, representation, advice or solicitation of any nature. Readers are advised in all circumstances to seek the advice of a registered investment advisor.

- Talk to us
- Kenya
- P.O Box 20695 - 00200, Nairobi, Kenya
- Cell +254709101200
- Tel +254709101200
- WhatsApp +254741676635
- United States
- +254709101200
- DOWNLOAD OUR APP
-


- Kenya
- 8th Floor, Pinetree Plaza, Kaburu Drive, Ngong Road, Nairobi, Kenya
- USA
- Suite 1150, 1775 Eye Street NW, USA, Washington DC 20006, USA
- Investments
- High Yield
- Private Equity
- Real Estate
- Real Estate
- RiverRun Estates
- Cytonn Towers
- The Ridge
- Taraji Heights
- The Alma