
Cytonn Monthly – October 2026
By research team, Nov 1, 2026
Executive Summary
Fixed Income
During the month of October 2026, T-bills were oversubscribed, with the overall average subscription rate coming in at 196.8%, higher than the subscription rate of 175.2%, recorded in September 2026. The overall average subscription rates for the 91-day paper increased to 413.5% from 327.5% while that for 182-day and 365-day papers decreased to 136.1% and 84.2% from 138.8% and 89.6% respectively recorded in September 2026. During the month, the average yields on the government papers were on a downward trajectory with the yields on the 182-day papers decreasing the most by 4.7 bps to 8.87% from 8.92% recorded the previous month. The average yields on the 364-day paper decreased by 2.3 bps to 9.0% from 9.1% recorded the previous month while that of the 91-day decreased by 1.7 bps to 8.76% from 8.77% recorded the previous month. For the month of October, the government accepted a total of Kshs 167.8 bn of the Kshs 220.4 bn worth of bids received in T-Bills, translating to an acceptance rate of 80.7%, compared to an acceptance rate of 91.6% in the month of July 2026;
During the week, T-bills were oversubscribed for the thirteenth consecutive week, with the overall subscription rate coming in at 185.2% higher than the subscription rate of 103.0% recorded the previous week. Investors’ preference for the shorter 91-day paper persisted, with the paper receiving bids worth Kshs 40.6 bn against the offered Kshs 8.0 bn, translating to a subscription rate of 507.9% significantly higher than the subscription rate of 179.2%, recorded the previous week. The subscription rate for the 182-day paper decreased to 53.2% from 76.9% recorded the previous week, while that of the 364-day paper decreased to 59.1% from 68.0% recorded the previous week. The government accepted a total of Kshs 51.7 bn worth of bids out of Kshs 51.9 bn bids received, translating to an acceptance rate of 99.7%. The yields on the government papers showed a mixed performance with the yields on the 91-day paper and 364 -day papers increasing by 0.2 bps each to remain relatively unchanged at 8.75% and 9.03% respectively recorded the previous week. The yields on the 182-day paper decreased by 0.8 bps to 8.85% from the 8.86% recorded the previous week;
Additionally, October 2026 bonds were oversubscribed, with the overall average subscription rate coming in at 157.7%, higher than the average subscription rate of 125.5%, recorded in September 2026. The reopened bonds SDB1/2011/030, FXD1/2026/030, FXD3/2019/015, FXD1/2019/020 and the switch bond FXD1/2018/015 with tenors to maturity of 14.4 years, 29.6 years, 7.8 years, 12.5 years and 6.6 years respectively and fixed coupon rates of 12.0%, 12.5%, 12.3%, 12.9% and 12.7% respectively, received bids worth Kshs 173.5 bn against the offered Kshs 110.0 bn translating to an oversubscription rate of 157.7%. The government accepted bids worth Kshs 110.6 bn, translating to an acceptance rate of 63.7%. The weighted average yield for the accepted bids for the SDB1/2011/030, FXD1/2026/030, FXD3/2019/015, FXD1/2019/020 and FXD1/2018/015 came in at 13.7%, 14.2%, 13.6%, 12.7% and 12.6% respectively;
The year-on-year inflation in October 2026 increased by 0.5% points to 7.3% from the 6.8% recorded in August 2026,
Equities
During the month of October, the equities market was on a downward trajectory, with NSE 10, NSE 25, NSE 20, and NASI declining by 6.6%, 6.0%, 5.1% and 3.0% respectively. The performance was weighed down by losses recorded large-cap stocks such as ABSA, Equity and Stanbic of 9.7%, 9.3% and 8.0% respectively;
During the week, the equities market showed a mixed performance, with NASI gaining by 1.4% while NSE 20, NSE 25 and NSE 10 declined by 1.9%, 1.2% and 1.2% respectively taking their YTD performance to gains of 30.5%, 29.3%, 28.1%, and 27.1% respectively for NSE 20, NSE 10, NSE 25 and NASI respectively. The equities market performance was mainly driven by gains recorded by large cap stocks such as Safaricom and KCB of 0.9% and 0.9% respectively. However, the performance was weighed down by losses recorded by large-cap stocks such as Stanbic, ABSA and DTBK of 4.6%, 4.0%, and 3.8% respectively;
Also, during the month, the banking sector index decreased by 6.0% to close at 271.5 from the 288.9 recorded at the end of the September 2026. This was attributable to losses recorded by large-cap stocks such as ABSA, Equity and Stanbic of 9.7%, 9.3%, and 8.0% respectively.
During the week, the banking sector index decreased by 1.8% to 271.5 from the 276.4 recorded the previous week. This is attributable to losses recorded by large cap stocks such as Stanbic, ABSA and DTB-K of 4.6%, 4.0%, and 3.8% respectively. The performance was however supported by gains recorded by large-cap stocks such as KCB of 0.9%;
During the week, Quickmart PLC (Quickmart) issued a Supplementary Information Memorandum (SIM) on 23 October 2026, following approval by the Capital Markets Authority (CMA), admitting three additional cornerstone investors to its Kshs 15.0 bn Offer for Sale of 2.0 bn shares at Kshs 7.50 per share;
Real Estate
During the week, Devki Group broke ground on a Kshs 70.0 bn cement and clinker plant in Ngaaie, Kitui County. The facility will produce 3.0 mn tonnes of clinker annually, raising Devki Group’s total production capacity to 9.2 mn tonnes. The expanded capacity represents 88.5% of Kenya’s total installed capacity of 10.4 mn tonnes;
During the week, the government awarded Kshs 15.5 bn in contracts to upgrade 95 rural roads since the start of the 2026/27 financial year under the Kenya Rural Roads Authority (KeRRA). The contracts are valued at more than double the Kshs 6.1 bn recorded for 967 contracts in the 12 months to June 2026, marking a sharp increase in road contracting following previous fiscal containment measures;
During the week, ALP Industrial REIT announced its first-ever interim distribution of USD 930,434, equivalent to USD 0.0207 per unit, representing an implied yield of 2.0% and an indicative annualised yield of 2.7%. The distribution, recommended by the REIT Manager and approved by the Trustee, is based on unaudited financial statements as at 30th September 2026, with payment scheduled for 27th November 2026 to eligible unitholders registered by 18th November 2026;
On the Unquoted Securities Platform Acorn D-REIT and I-REIT traded at Kshs 29.7 and Kshs 24.4 per unit, respectively, as per the last updated data on 30th October 2026. The performance represented a 48.5% and 22.0% gain for the D-REIT and I-REIT, respectively, from the Kshs 20.0 inception price. The volumes traded to date for the D-REIT and I-REIT came in at 13.8 mn and 46.5 mn shares, respectively. Additionally, ILAM Fahari I-REIT traded at Kshs 13.8 per share as of 30th October 2026, representing a 31.0% loss from the Kshs 20.0 inception price. The volume traded to date for the I-EIT came in at 1.2 mn shares;
Digital Payments
During the week, Visa Inc. reported fiscal fourth quarter 2026 net revenue of USD 12.1 bn, with full-year net revenue reaching a record USD 45.9 bn and management guiding to low-double-digit net revenue growth in fiscal 2027;
During the week, American Express Company reported record third-quarter revenue of USD 20.1 bn, with diluted earnings per share rising 30.9% to USD 5.42 from USD 4.14 and full-year 2026 EPS guidance raised to a range of USD 18.3 to USD 18.6;
During the week, PayPal Holdings, Inc. reported third-quarter 2026 net revenues which increased by 2.0% to USD 8.6 bn from USD 8.4 bn and total payment volume which increased by 6.0% to USD 487.1 bn from USD 458.1 bn, and raised its full-year non-GAAP EPS guidance to approximately USD 5.6;
During the week, Global Payments Inc. launched its Genius Road Trip, a mobile showroom set to make more than 40 stops across the U.S., following the debut of Genius World in Las Vegas, to showcase its all-in-one point-of-sale and payments platform;
The digital payment stocks we track (AXP, Visa, Mastercard, Circle, Block, and PayPal) are currently trading at an average forward P/E of 25.1x, implying that investors continue to price in resilient earnings growth and strong digital payment adoption, although elevated operating costs and higher client incentives across legacy card networks may moderate valuation expansion in the near term;
Investment Updates:
-
Weekly Rates: Cytonn Money Market Fund closed the week at a yield of 11.11% p.a. To invest, dial *809# or download the Cytonn App from Google Play store here or from the Appstore here;
-
We continue to offer Wealth Management Training every Tuesday, from 7:00 pm to 8:00 pm. The training aims to grow financial literacy among the general public. To register for any of our Wealth Management Trainings, click here. If interested in our Private Wealth Management Training for your employees or investment group, please get in touch with us through wmt@cytonn.com;
-
Cytonn Asset Managers Limited (CAML) continues to offer pension products to meet the needs of both individual clients who want to save for their retirement during their working years and Institutional clients that want to contribute on behalf of their employees to help them build their retirement pot. To more about our pension schemes, kindly get in touch with us through pensions@cytonn.com;
Hospitality Updates:
-
We currently have promotions for Staycations. Visit cysuites.com/offers for details or email us at sales@cysuites.com;
Money Markets, T-Bills Primary Auction:
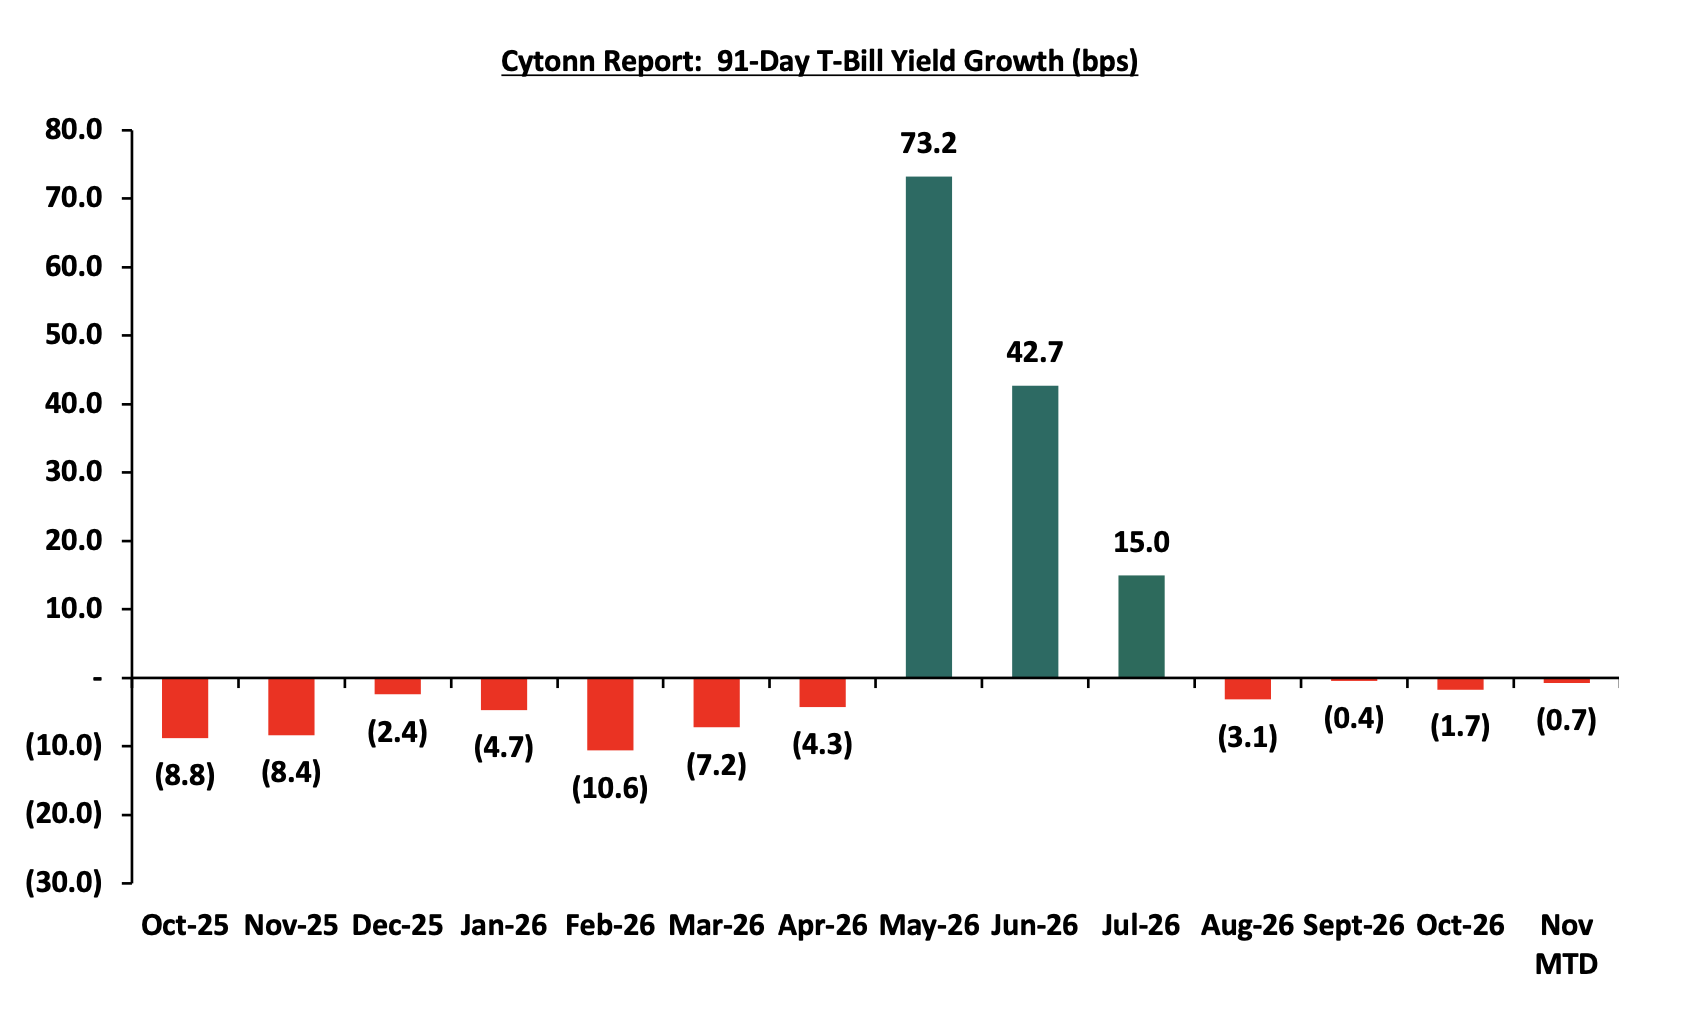
During the month of October 2026, T-bills were oversubscribed, with the overall average subscription rate coming in at 196.8%, higher than the subscription rate of 175.2%, recorded in September 2026. The overall average subscription rates for the 91-day paper increased to 413.5% from 327.5% while that for 182-day and 365-day papers decreased to 136.1% and 84.2% from 138.8% and 89.6% respectively recorded in September 2026. During the month, the average yields on the government papers were on a downward trajectory with the yields on the 182-day papers decreasing the most by 4.7 bps to 8.87% from 8.92% recorded the previous month. The average yields on the 364-day paper decreased by 2.3 bps to 9.0% from 9.1% recorded the previous month while that of the 91-day decreased by 1.7 bps to 8.76% from 8.77% recorded the previous month. For the month of October, the government accepted a total of Kshs 167.8 bn of the Kshs 220.4 bn worth of bids received in T-Bills, translating to an acceptance rate of 80.7%, compared to an acceptance rate of 91.6% in the month of July 2026. The chart below shows the yield growth rate for the 91-day paper for the past one year:
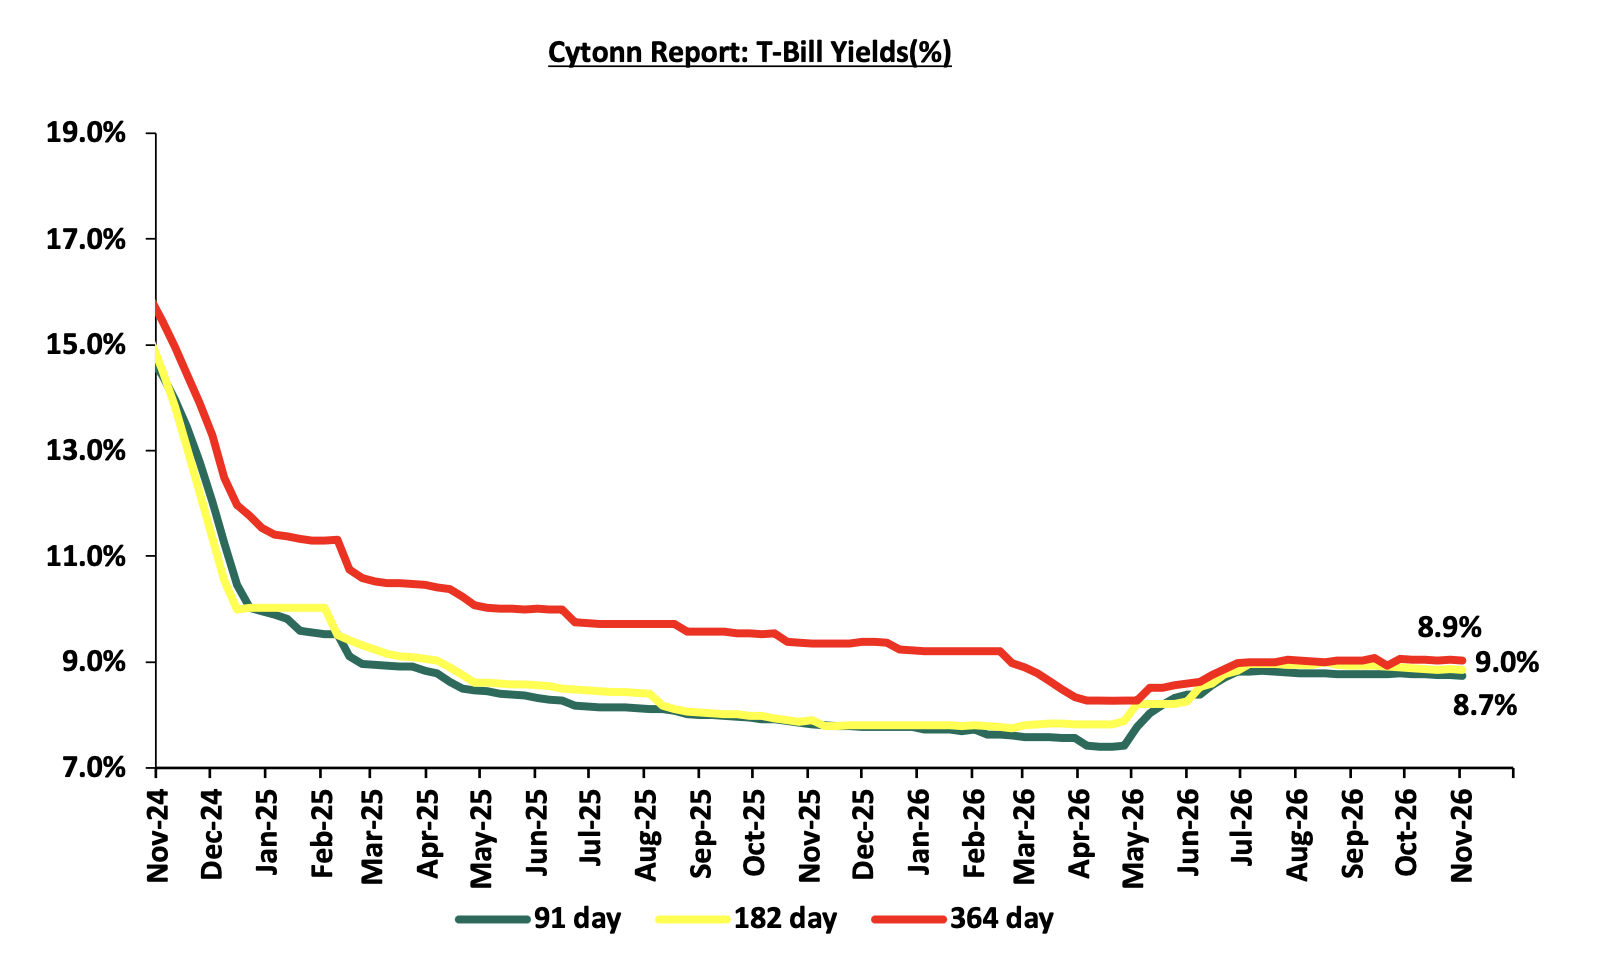
This week, T-bills were oversubscribed for the thirteenth consecutive week, with the overall subscription rate coming in at 185.2% higher than the subscription rate of 103.0% recorded the previous week. Investors’ preference for the shorter 91-day paper persisted, with the paper receiving bids worth Kshs 40.6 bn against the offered Kshs 8.0 bn, translating to a subscription rate of 507.9% significantly higher than the subscription rate of 179.2%, recorded the previous week. The subscription rate for the 182-day paper decreased to 53.2% from 76.9% recorded the previous week, while that of the 364-day paper decreased to 59.1% from 68.0% recorded the previous week. The government accepted a total of Kshs 51.7 bn worth of bids out of Kshs 51.9 bn bids received, translating to an acceptance rate of 99.7%. The yields on the government papers showed a mixed performance with the yields on the 91-day paper and 364 -day papers increasing by 0.2 bps each to remain relatively unchanged at 8.75% and 9.03% respectively recorded the previous week. The yields on the 182-day paper decreased by 0.8 bps to 8.85% from the 8.86% recorded the previous week. The charts below show the performance of the 91-day, 182-day and 364-day papers from November 2024 to November 2026:
So far in the current FY’2026/27, government securities totaling Kshs 980.0 bn have been advertised. The government has accepted bids worth Kshs 1,364.1 bn, of which Kshs 709.7 bn and Kshs 654.4 bn were treasury bills and bonds, respectively. Total redemptions so far in FY’2026/27 equal to Kshs 713.5 bn, with treasury bills accounting for Kshs 595.4 bn while treasury bonds accounted for Kshs 118.1 bn. As a result, the government has a domestic borrowing surplus of Kshs 337.4 bn in FY’2026/27.
The chart below compares the overall average T-bill subscription rates obtained in 2023,2024, 2025 and 2026 Year-to-date (YTD):

T-bonds Primary Market
Additionally, October 2026 bonds were oversubscribed, with the overall average subscription rate coming in at 157.7%, higher than the average subscription rate of 125.5%, recorded in September 2026. The reopened bonds SDB1/2011/030, FXD1/2026/030, FXD3/2019/015, FXD1/2019/020 and the switch bond FXD1/2018/015 with tenors to maturity of 14.4 years, 29.6 years, 7.8 years, 12.5 years and 6.6 years respectively and fixed coupon rates of 12.0%, 12.5%, 12.3%, 12.9% and 12.7% respectively, received bids worth Kshs 173.5 bn against the offered Kshs 110.0 bn translating to an oversubscription rate of 157.7%. The government accepted bids worth Kshs 110.6 bn, translating to an acceptance rate of 63.7%. The weighted average yield for the accepted bids for the SDB1/2011/030, FXD1/2026/030, FXD3/2019/015, FXD1/2019/020 and FXD1/2018/015 came in at 13.7%, 14.2%, 13.6%, 12.7% and 12.6% respectively. The table below provides more details on the bonds issued in October 2026 and September 2026:
|
Cytonn Report: Bond Issuances for September 2026-October 2026 |
|||||||||
|
Issue Date |
Bond Auctioned |
Effective Tenor to Maturity (Years) |
Coupon |
Amount offered (Kshs bn) |
Actual Amount Raised/Accepted (Kshs bn) |
Total bids received (Subscription) |
Average Accepted Yield |
Subscription Rate |
Acceptance Rate |
|
19-Oct |
SDB1/2011/030-Reopened |
14.4 |
12.0% |
50.0 |
19.2 |
23.7 |
13.7% |
167.7% |
80.8% |
|
FXD1/2026/030-Reopened |
29.6 |
12.5% |
33.9 |
60.1 |
14.2% |
103.3% |
56.4% |
||
|
7-Oct |
FXD1/2018/015 -Switch |
6.6 |
12.7% |
10.0 |
9.0 |
9.1 |
12.6% |
90.8% |
98.7% |
|
5-Oct |
FXD3/2019/015-Reopened |
7.8 |
12.3% |
50.0 |
28.6 |
34.6 |
12.7% |
161.1% |
82.8% |
|
FXD1/2019/020-Reopened |
12.5 |
12.9% |
28.9 |
46.0 |
13.6% |
62.8% |
|||
|
21-Sep |
FXD1/2019/020-Reopened |
12.6 |
12.9% |
60.0 |
33.5 |
43.8 |
14% |
135.7% |
76.4% |
|
FXD1/2026/030-Reopened |
29.6 |
12.5% |
16.7 |
37.6 |
14% |
154.9% |
44.5% |
||
|
07-Sept |
FXD4/2019/010-Switch |
3.2 |
12.3% |
10.0 |
11.0 |
13.5 |
11% |
135.2% |
81.5% |
|
02-Sept |
FXD3/2019/015-Reopened |
7.9 |
12.3% |
60.0 |
41.1 |
57.1 |
12.8% |
113.7% |
72.0% |
|
SDB1/2011/030-Reopened |
14.4 |
12.0% |
6.6 |
11.1 |
13.8% |
29.8% |
59.6% |
||
|
October 2026 Average |
16.1 |
12.4% |
110.0 |
110.6 |
173.5 |
13.5% |
157.7% |
63.7% |
|
|
September 2026 Average |
16.1 |
12.4% |
130.0 |
97.9 |
163.1 |
13.6% |
125.5% |
60.0% |
|
|
2026 Average |
15.1 |
12.9% |
60.0 |
33.1 |
50.0 |
13.4% |
175.0% |
70.8% |
|
Secondary Bond Market:
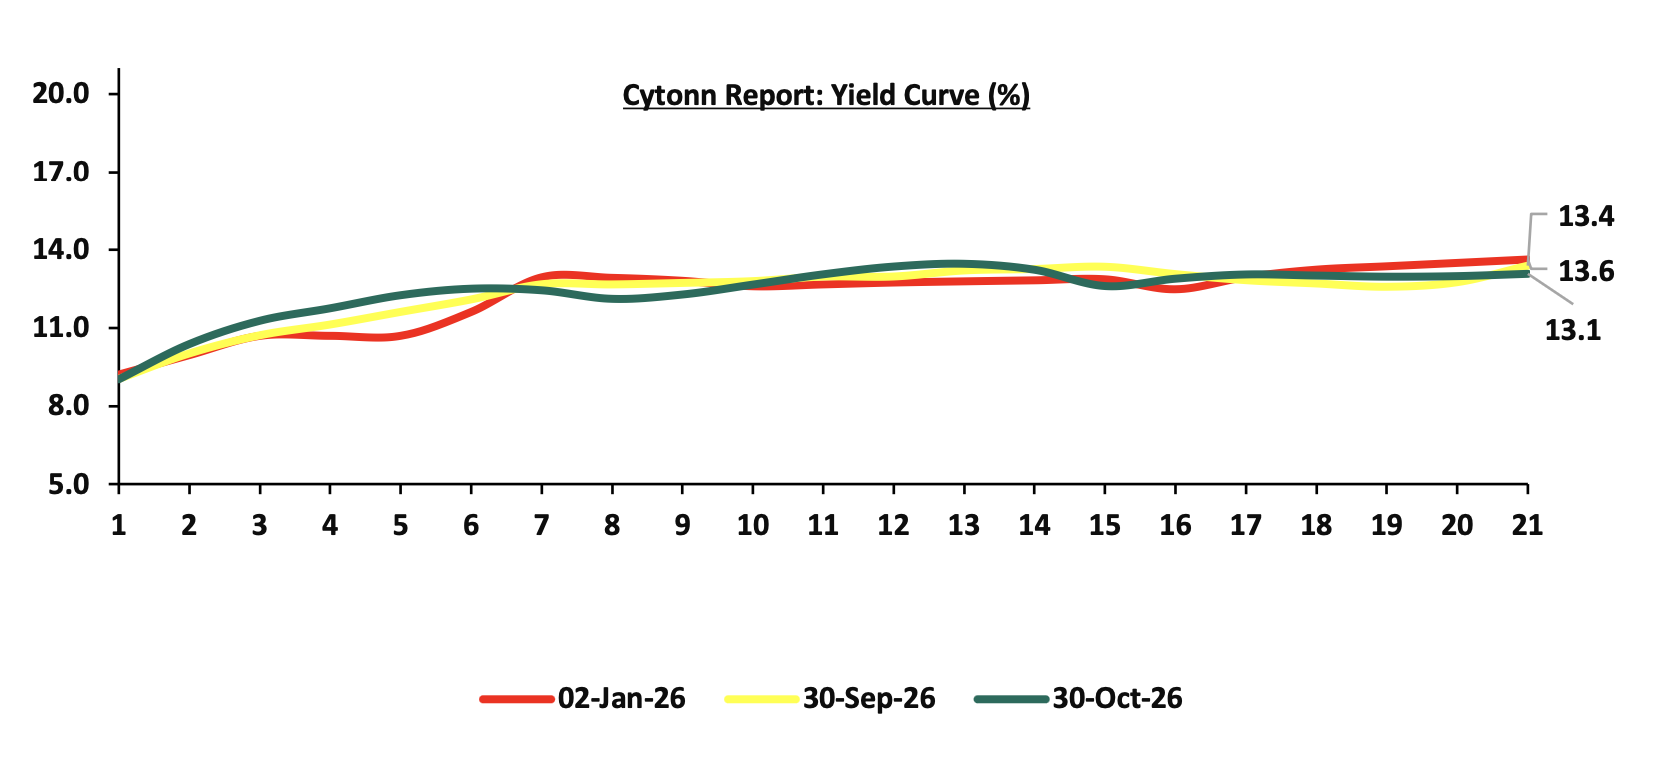
Yields on government securities trended downward during the month of October, in contrast to the mixed performance recorded in the preceding months. This was largely driven by ample market liquidity and strong investor demand across the curve, which outweighed inflationary concerns. The Central Bank of Kenya’s decision to maintain the policy rate at 8.75% reinforced stability in short-term rates by keeping expectations on the near-term cost of funds well anchored. Although inflation rose to 7.3% in October, approaching the upper bound of the Central Bank’s target range, investors continued to show appetite for government paper, with demand supported by the desire to lock in prevailing yields ahead of a possible easing in rates. This sustained demand, coupled with excess liquidity in the banking system, pushed yields lower across most tenors, resulting in a broad-based decline in the yield curve for the month. The downward movement came despite the erosion of real returns, suggesting that yields were driven more by liquidity and demand dynamics than by the inflation outlook. The chart below shows the yield curve movement during the period:
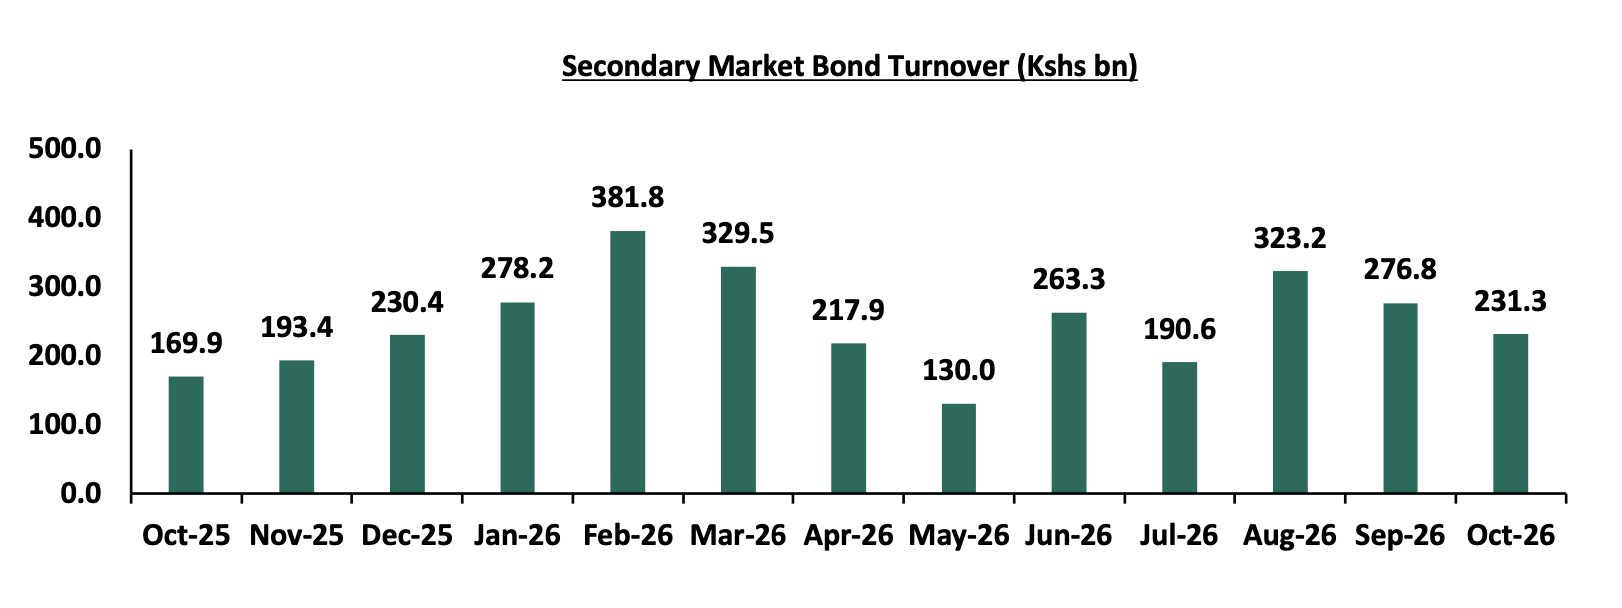
The secondary bond turnover decreased by 16.4% to Kshs 231.1 bn, from Kshs 276.8 bn recorded in September 2026, pointing towards reduced activity by commercial banks in the secondary bond market for the month of October, driven by tighter liquidity conditions and a preference to hold securities to maturity. On a year-on-year basis, the bond turnover increased by 36.1% from Kshs 169.9 bn worth of treasury bonds transacted over a similar period last year. The chart below shows the bond turnover over the past 12 months.
Money Market Performance:
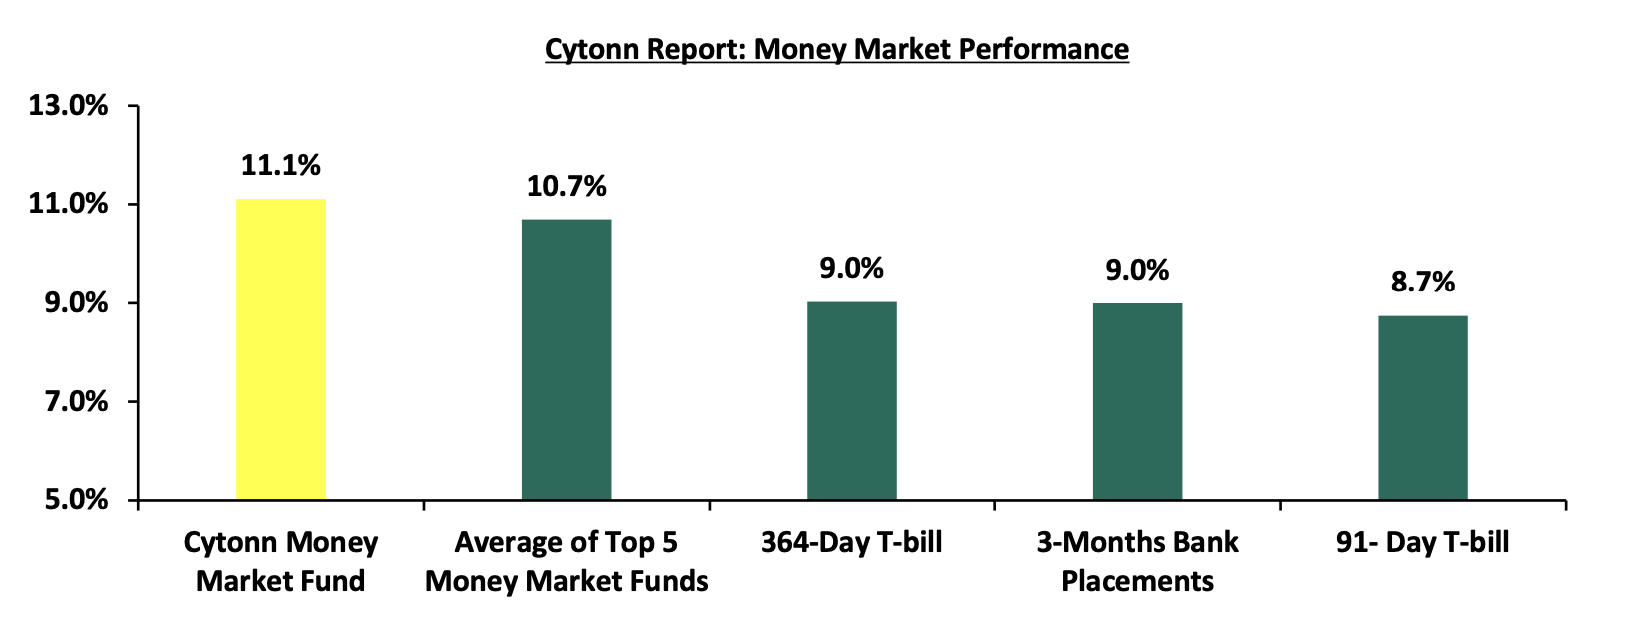
In the money markets, 3-month bank placements ended the week at 9.0% (based on what we have been offered by various banks). The yields on the government papers showed a mixed performance with the yields on the 91-day paper and 364 -day papers increasing by 0.2 bps each to remain relatively unchanged at 8.75% and 9.03% respectively recorded the previous week and the yield on the Cytonn Money Market Fund increased by 10.0 bps to 11.1% from the 11.0% recorded the previous week, while the average yields on the Top 5 Money Market Funds increased by 3.8 bps to 10.69% from 10.66% recorded in the previous week.
The table below shows the Money Market Fund Yields for Kenyan Fund Managers as published on 30th October 2026:
Source: Business Daily
Liquidity:
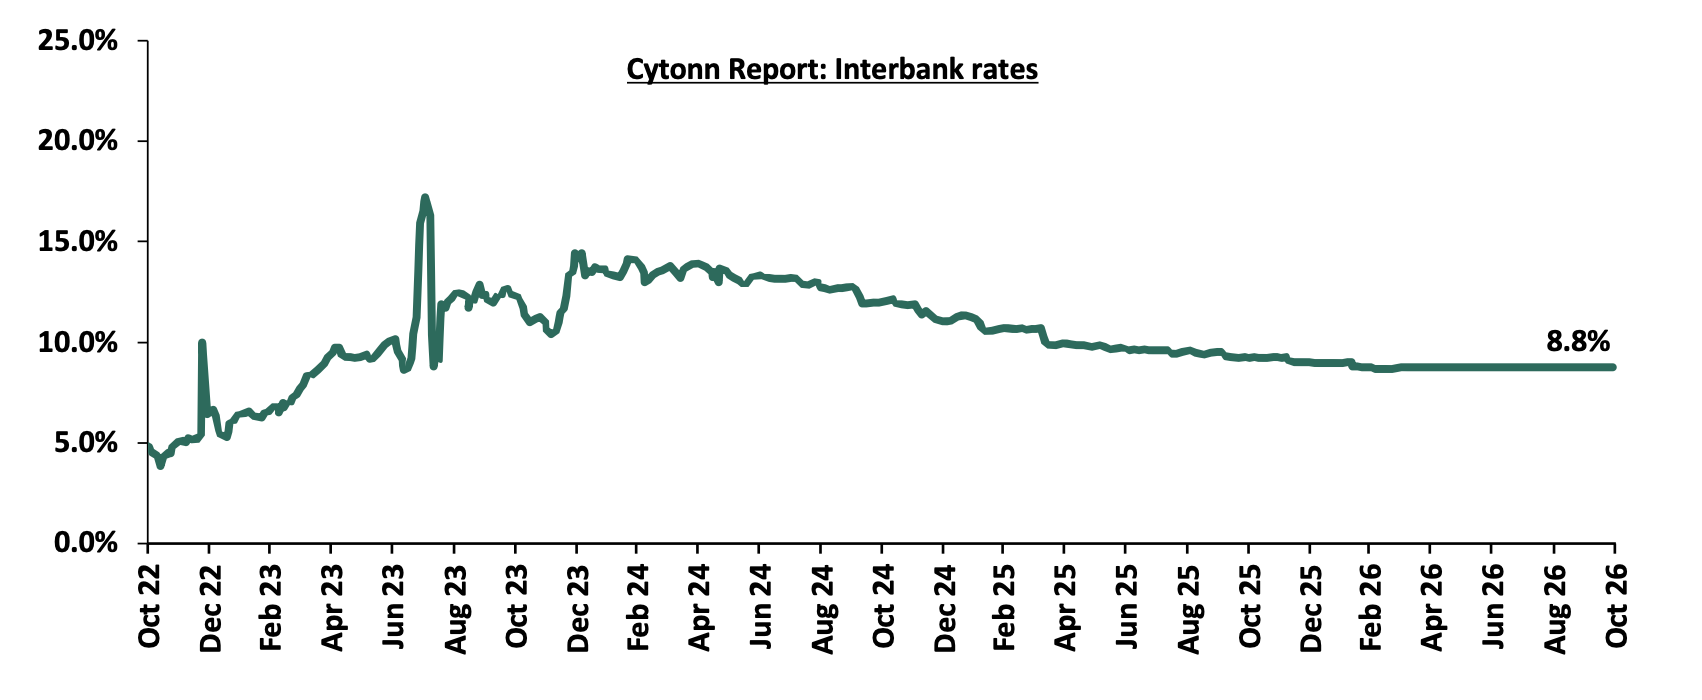
Liquidity in the money markets remained relatively stable in the month of October 2026, with the average interbank rate remaining unchanged from the 8.8% recorded the previous month. The average interbank volumes traded increased by 5.2% to Kshs 12.4 bn, from Kshs 11.8 bn recorded in September 2026.
Additionally, during the week, liquidity in the money markets tightened, with the average interbank rate increasing marginally by 0.03 bps to remain unchanged from the 8.75% recorded the previous week, partly attributable to tax remittances that offset government payments. The average interbank volumes traded decreased by 38.3% to Kshs 12.2 bn from Kshs 20.0 bn recorded the previous week. The chart below shows the interbank rates in the market over the years:
Kenya Eurobonds:
During the month, the yields on the Eurobonds showed a mixed performance, with the yield on the 13-year Eurobond issued in 2021 increasing the most by 13.1 bps to 9.3% from 9.2%, while the yield on the 7-year Eurobond issued in 2024 decreased the most by 33.3 bps to remain relatively unchanged to 8.0% from 8.3% recorded the previous month.
Also, during the week, the yields on the Eurobonds were on a downward trajectory, with the yield on the 30-year Eurobond issued in 2018 decreasing the most by 28.8 bps to 9.9% from the 10.2% recorded the previous week. The table below shows the summary performance of the Kenyan Eurobonds as of 29th October 2026:
|
Cytonn Report: Kenya Eurobonds Performance |
|||||
|
|
2018 |
2019 |
2021 |
2024 |
|
|
Tenor |
10-year issue |
30-year issue |
12-year issue |
13-year issue |
7-year issue |
|
Amount Issued (USD) |
1.0 bn |
1.0 bn |
1.2 bn |
1.0 bn |
1.5 bn |
|
Years to Maturity |
2.5 |
22.5 |
6.7 |
8.8 |
5.5 |
|
Yields at Issue |
7.3% |
8.3% |
7.9% |
6.2% |
10.4% |
|
02-Jan-26 |
6.1% |
8.8% |
7.2% |
7.8% |
7.1% |
|
01-Oct-26 |
7.6% |
9.8% |
8.8% |
9.2% |
8.3% |
|
22-Oct-26 |
7.4% |
10.2% |
9.0% |
9.6% |
8.2% |
|
23-Oct-26 |
7.5% |
10.3% |
9.1% |
9.6% |
8.3% |
|
26-Oct-26 |
7.5% |
10.3% |
9.1% |
9.7% |
8.3% |
|
27-Oct-26 |
7.4% |
10.1% |
9.0% |
9.5% |
8.1% |
|
28-Oct-26 |
7.4% |
10.1% |
8.9% |
9.5% |
8.1% |
|
29-Oct-26 |
7.3% |
9.9% |
8.8% |
9.3% |
8.0% |
|
Weekly Change |
(0.1%) |
(0.3%) |
(0.2%) |
(0.2%) |
(0.3%) |
|
MTD Change |
(0.3%) |
0.1% |
0.1% |
0.1% |
(0.3%) |
|
YTD Change |
1.2% |
1.1% |
1.7% |
1.5% |
0.9% |
Source: Central Bank of Kenya (CBK) and National Treasury
Kenya Shilling:
During the month, the Kenya Shilling depreciated by 12.3 bps against the US Dollar, to Kshs 130.0 from the Kshs 129.8 recorded at the end of September. Also, during the week, the Kenya Shilling depreciated by 4.6 bps against the US Dollar, to Kshs 129.95 from the Kshs 129.89 recorded the previous week. On a year-to-date basis, the shilling has depreciated by 69.7 bps against the dollar, as compared to the 22.9 bps appreciation recorded in 2025.
We expect the shilling to be supported by:
-
Diaspora remittances standing at a cumulative USD 5,031.5 mn in the twelve months to September 2026, slightly lower than the USD 5,080.5 mn recorded over the same period in 2025. These have continued to cushion the shilling against further depreciation. In the September 2026 diaspora remittances figures, North America remained the largest source of remittances to Kenya accounting for 49.1% in the period,
-
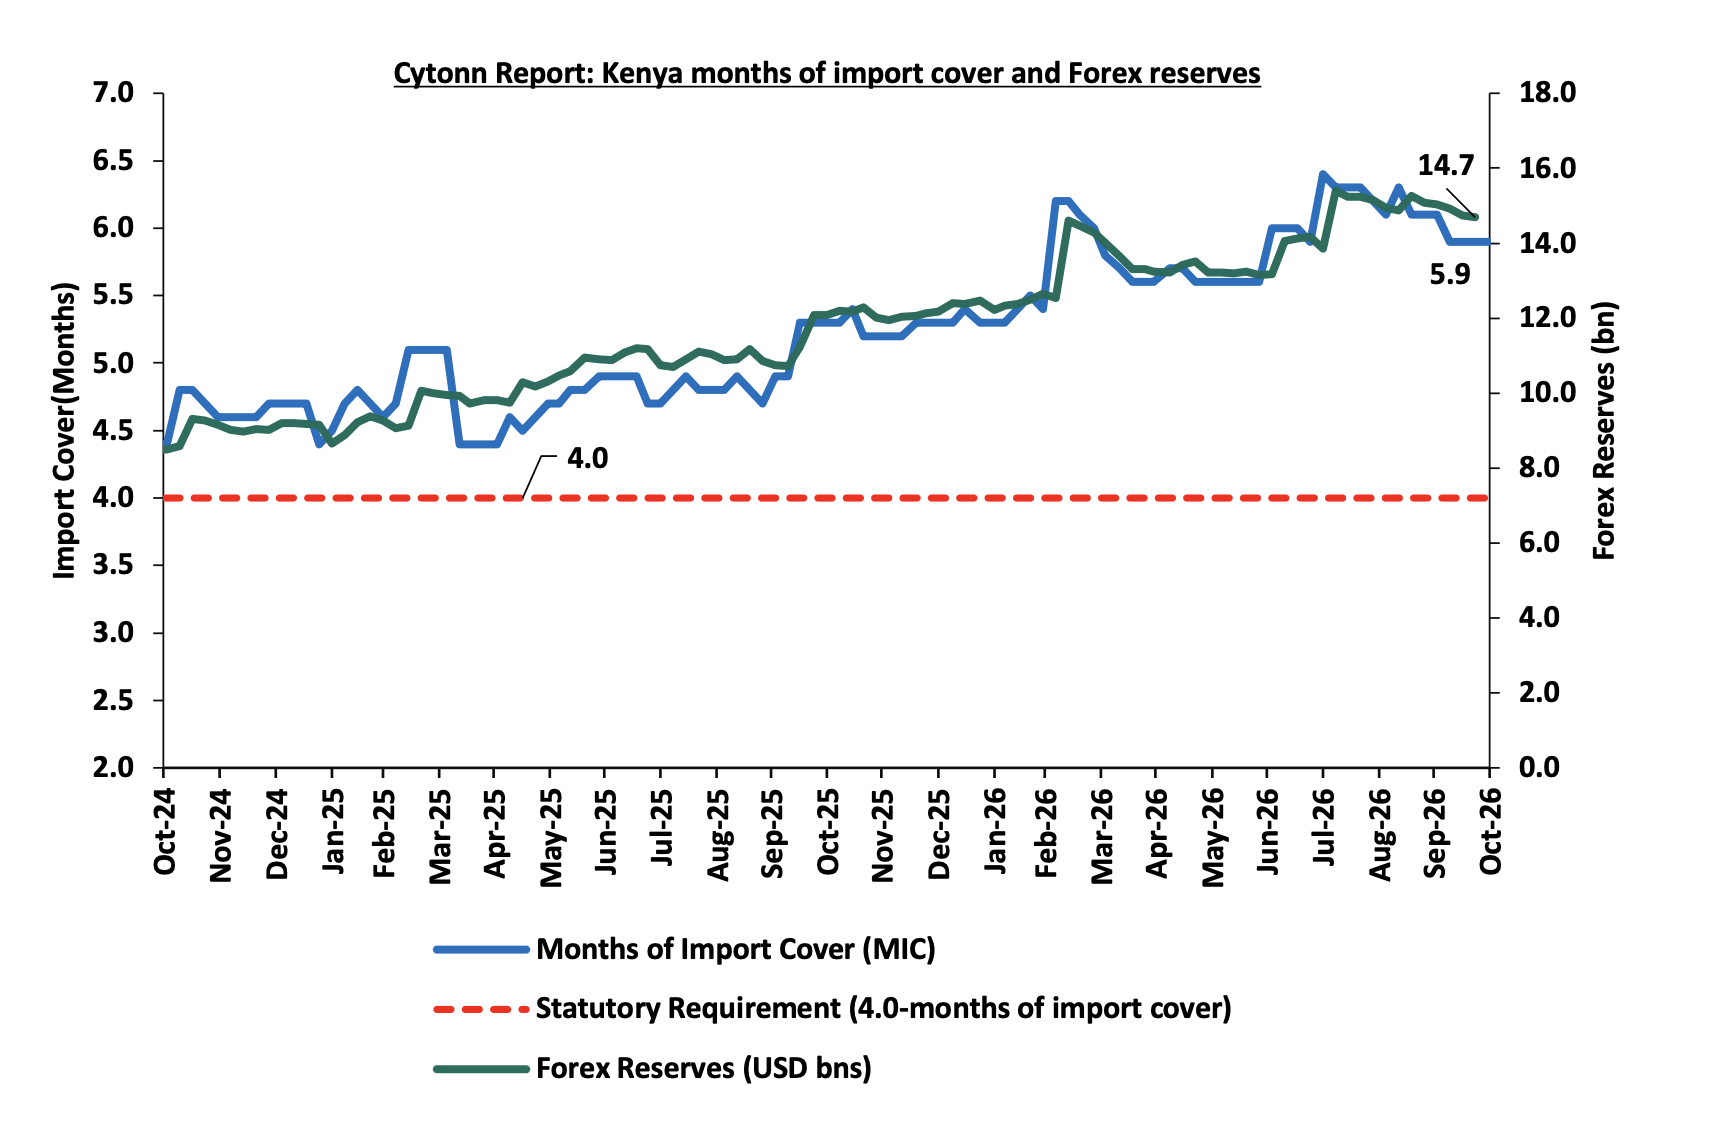
Improved forex reserves currently at USD 14.7 bn (equivalent to 5.9-months of import cover), which is above the statutory requirement of maintaining at least 4.0-months of import cover and above the EAC region’s convergence criteria of 4.5-months of import cover
The shilling is however expected to remain under pressure in 2026 as a result of:
-
An ever-present current account deficit which widened to 3.1% of GDP in the 12 months to August 2026 compared to 2.1% of GDP in a similar period in 2025 and,
-
The need for government debt servicing, continues to put pressure on forex reserves given that 54.7% of Kenya’s external debt is US Dollar-denominated as of July 2026.
-
Rising geopolitical tensions in the Middle East, which could exert pressure on the shilling through higher global oil prices and increased uncertainty in international markets. Given that Kenya is a net importer of petroleum products, any sustained increase in oil prices would widen the import bill, increase demand for US Dollars, and consequently put depreciation pressure on the shilling
Kenya’s forex reserves marginally decreased by 0.3% during the week to remain relatively unchanged at USD 14.7 bn recorded the previous week, equivalent to 5.9 months of import cover, and above the statutory requirement maintaining at least 4.0-months of import cover.
Weekly Highlights
-
August 2026 Inflation Highlight
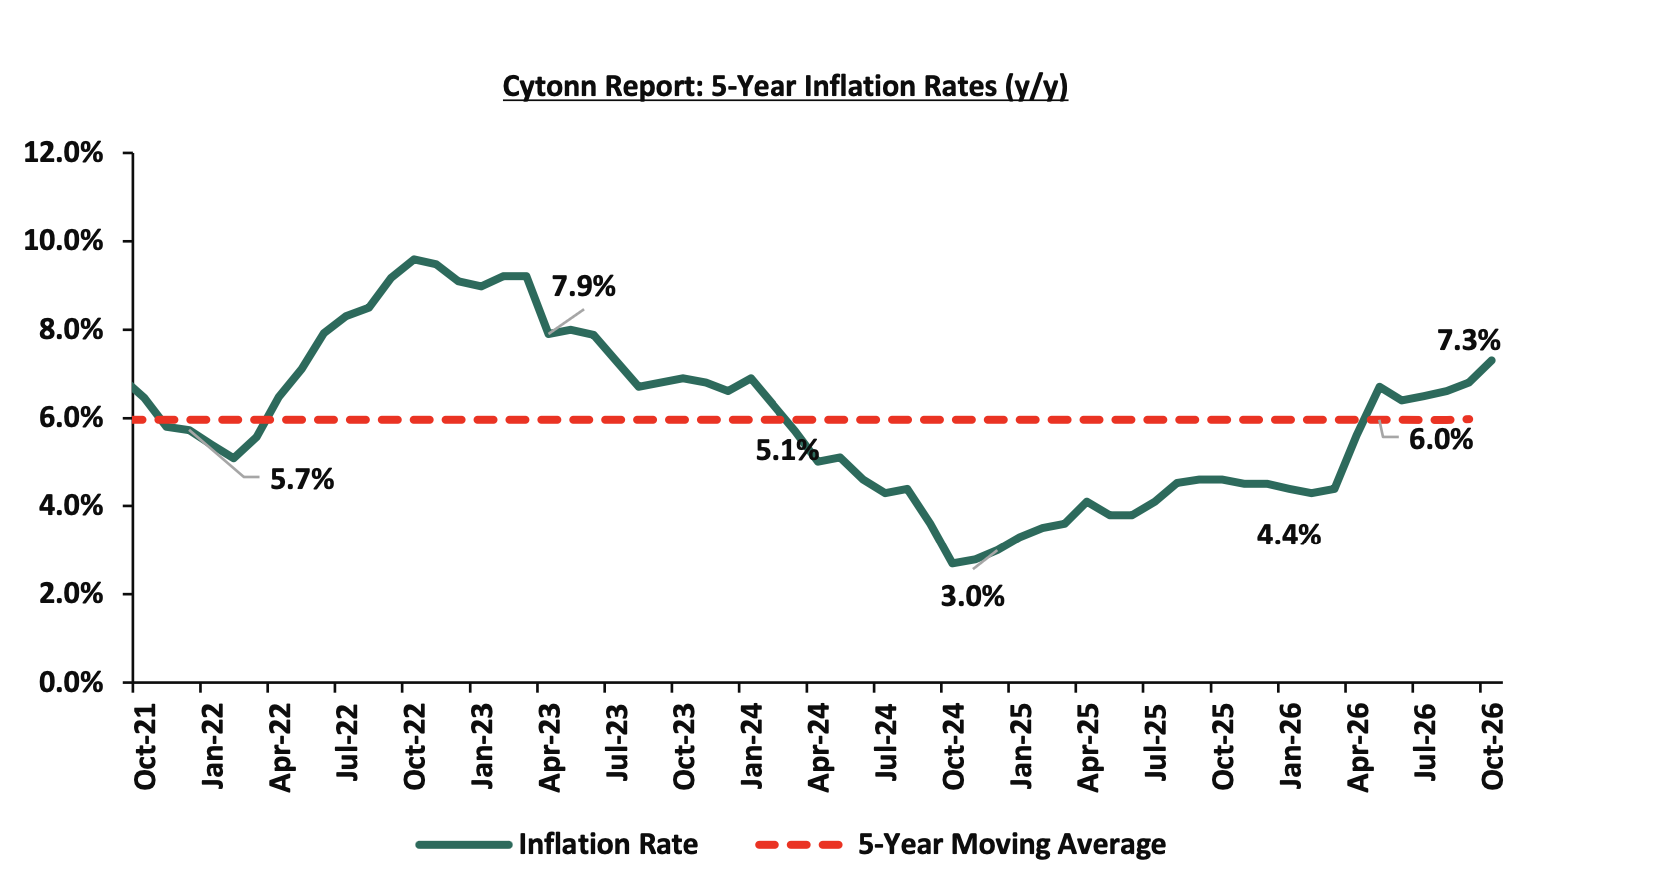
The year-on-year inflation in October 2026 increased by 0.5%-points to 7.3% from the 6.8% recorded in September 2026. The price increase was primarily driven by a rise in prices of items in the Food and Non-Alcoholic Beverages at 10.2%; Transport at 17.1%; and Housing, Water, Electricity, Gas and other fuels at 3.7%; over the one-year period. The month-on-month inflation rate stood at 0.7% in October 2026. The table below summarizes the performance of commodity indices both on a year-on-year and month-on-month basis:
|
Cytonn Report: Major Inflation Changes –October 2026 |
|||
|
Broad Commodity Group |
Price change m/m (October-2026/ September-2026) |
Price change y/y October-2026/October-2025) |
Reason |
|
Food and Non- Alcoholic Beverages |
0.9% |
10.2% |
The m/m increase was mainly driven by a rise in prices of fresh packeted cow milk, Irish potatoes and beef with bones by 4.7%, 2.5% and 0.8% respectively. However, the increase was weighed down by a decline in prices of sugar, loose maize flour and oranges by 1.2%, 1.1% and 1.1% respectively. |
|
Transport |
1.7% |
17.1% |
The m/m increase was mainly driven by a rise in petrol and diesel prices by 6.0% and 4.4% respectively, and taxi fares by 1.5%. However, the increase was weighed down by a 2.6% decline in local flight fares. |
|
Housing, Water, Electricity, Gas and Other fuels |
0.8% |
3.7% |
The m/m increase was mainly due to a rise in the price of kerosene/paraffin and Gas/LPG by 14.7% and 0.3% respectively. The increase was however weighed down by a 0.1% decrease in the price of electricity (200kWh) |
|
Overall Inflation |
0.7% |
7.3% |
The m/m increase was mainly attributable to the 1.7% rise in Transport, coupled with a 0.9% increase in Food and Non-Alcoholic Beverages and a 0.8% increase in Housing, Water, Electricity, Gas and Other Fuels. |
In October 2026, overall inflation increased by 0.5%-points to 7.3% from the 6.8% recorded in September 2026 on a y/y basis, signaling intensifying price pressure across major categories, and edging closer to the upper bound of the Central Bank of Kenya’s preferred range of 2.5%-7.5%, while remaining within the range for the fortieth consecutive month. Notably, the maximum allowed pump prices for Super Petrol, Diesel and Kerosene increased by Kshs 12.9, Kshs 9.9 and Kshs 28.5 per litre to Kshs 227.0, Kshs 227.8 and Kshs 219.9 respectively in Nairobi, in the pricing cycle running from 15th October to 14th November 2026, reflecting higher landed costs amid the Middle East conflict. Electricity costs eased marginally during the month, with the 50kWh and 200kWh tariffs declining by 0.1% each to Kshs 1,257.2 and Kshs 5,529.7 respectively, from Kshs 1,258.2 and Kshs 5,533.8 respectively, between September and October 2026. Additionally, the Monetary Policy Committee (MPC) of the Central Bank of Kenya (CBK) maintained the Central Bank Rate (CBR) at 8.75% for a fourth consecutive meeting on 7th October 2026, noting that the current policy stance remains appropriate to keep inflation expectations anchored within the target range and the exchange rate stable. The chart below shows the inflation rates for the past 5 years:
Going forward, we expect Kenya’s inflation to remain elevated in the short term, with risk of approaching or breaching the upper bound of the CBK’s target range of 2.5%–7.5%, driven by the full pass-through of the October fuel price increases to transport and production costs, persistent food price volatility, elevated electricity costs, fluctuations in global commodity prices, and exchange rate pass-through effects that increase the cost of imported goods and production inputs, majorly as a result of the Middle East War. Nevertheless, we expect the CBK’s prudent monetary policy stance and relative exchange rate stability, alongside the expected easing of food prices on the back of above-average rainfall forecast for October to December 2026, to help anchor inflation expectations and moderate price pressures over the medium term.
Notable Monthly Highlights:
-
Stanbic Bank released its September Purchasing Managers' Index (PMI), indicating that Kenya's Purchasing Managers' Index (PMI) improved by 1.6 points to 51.3 in September 2026, from 49.7 in August 2026, returning above the 50.0 no-change mark after a brief deterioration in the previous month. For more information, please see our Cytonn Weekly #40/2026,
-
The Monetary Policy Committee (MPC) met on 7th October 2026 to review the outcome of its previous policy decisions and decided to maintain the Central Bank Rate (CBR) at 8.75%, unchanged from the June 2026 meeting For more information, please see our Cytonn Weekly #40/2026,
-
The Energy and Petroleum Regulatory Authority (EPRA) released their monthly statement on the maximum retail fuel prices in Kenya, effective from 15th October 2026 to 14th November 2026. Notably, the maximum allowed prices for Kerosene, Super Petrol and Diesel increased by Kshs 28.5, Kshs 12.9 and Kshs 9.9 per litre to Kshs 219.9, Kshs 226.9 and Kshs 227.8 respectively, from Kshs 191.4, Kshs 214.0 and Kshs 217.9 set in September. For more information, please see our Cytonn Weekly #41/2026,
-
The Kenya National Bureau of Statistics (KNBS) released the Q2’2026 Quarterly Gross Domestic Product Report, highlighting that the Kenyan economy recorded a 5.1% growth in Q2’2026, higher than the 4.9% growth recorded in Q2’2025. The main contributor to Kenyan GDP remains the Agriculture, Forestry and Fishing sectors, which grew by 3.5% in Q2’2026, lower than the 4.0% expansion recorded in Q2’2025, as the early cessation of the long rains weighed on crop production. For more information, please see our Cytonn Weekly #41/2026,
-
The National Treasury gazetted the revenue and net expenditures for the third month of FY’2026/2027, ending 30th September 2026, highlighting that the total revenue collected as at the end of September 2026 amounted to Kshs 685.4 bn, equivalent to 23.0 % of the original estimates of Kshs 2,985.7 bn for FY’2026/2027 and is 91.8% of the prorated estimates of Kshs 746.4 bn. For more information, please see our Cytonn Weekly #42/2026.
Rates in the fixed income market have declined MTD, reversing the recent upward trend. The decline comes despite the CBK's decision to pause its rate-cutting cycle at 8.75%, with inflation remaining elevated at 7.3% but within the CBK's target range of 2.5%-7.5%. The government is 207.7% ahead of its prorated net domestic borrowing target of Kshs 919.4 bn, having a net borrowing position of Kshs 650.6 bn (inclusive of T-bills). We expect investors to maintain a preference for short to medium-term papers as they monitor the pace of government issuance and the path of inflation before committing further out on the curve, with the yield curve likely to remain under upward pressure rather than stabilize, at least until the inflation trajectory becomes clearer.
Market Performance:
During the month of October, the equities market was on a downward trajectory, with NSE 10, NSE 25, NSE 20, and NASI reducing by 6.6%, 6.0%, 5.1% and 3.0% respectively. The performance was weighed down by losses recorded large-cap stocks such as ABSA, Equity and Stanbic of 9.7%, 9.3% and 8.0% respectively.
During the week, the equities market showed a mixed performance, with NASI gaining by 1.4% while NSE 20, NSE 25 and NSE 10 declined by 1.9%, 1.2% and 1.2% respectively taking their YTD performance to gains of 30.5%, 29.3%, 28.1%, and 27.1% respectively for NSE 20, NSE 10, NSE 25 and NASI respectively. The equities market performance was mainly driven by gains recorded by large cap stocks such as Safaricom and KCB of 0.9% and 0.9% respectively. However, the performance was weighed down by losses recorded by large-cap stocks such as Stanbic, ABSA and DTBK of 4.6%, 4.0%, and 3.8% respectively.
Also, during the month, the banking sector index decreased by 6.0% to close at 271.5 from the 288.9 recorded at the end of the September 2026. This was attributable to losses recorded by large-cap stocks such as ABSA, Equity and Stanbic of 9.7%, 9.2%, and 8.0% respectively.
During the week, the banking sector index decreased by 1.8% to 271.5 from the 276.4 recorded the previous week. This is attributable to losses recorded by large cap stocks such as Stanbic, ABSA and DTB-K of 4.6%, 4.0%, and 3.8% respectively. The performance was however supported by gains recorded by large-cap stocks such as KCB of 0.9%.
During the month of October, equities turnover increased by 91.0% to USD 425.6 mn from USD 222.8 mn recorded during the month of September 2026. Foreign investors became net sellers, with a net selling position of USD 30.4 mn, from a net selling position of USD 27.9 mn recorded in September 2026.
During the week, equities turnover decreased by 92.2% to USD 27.2 mn from USD 350.8 mn recorded the previous week, taking the YTD total turnover to USD 3,470.6 mn. Foreign investors remained net sellers with a net selling position of USD 6.8 mn, from a net selling position of USD 9.5 mn recorded the previous week, taking the YTD foreign net selling position to USD 197.6 mn, compared to a net selling position of USD 69.6 mn recorded in 2025.
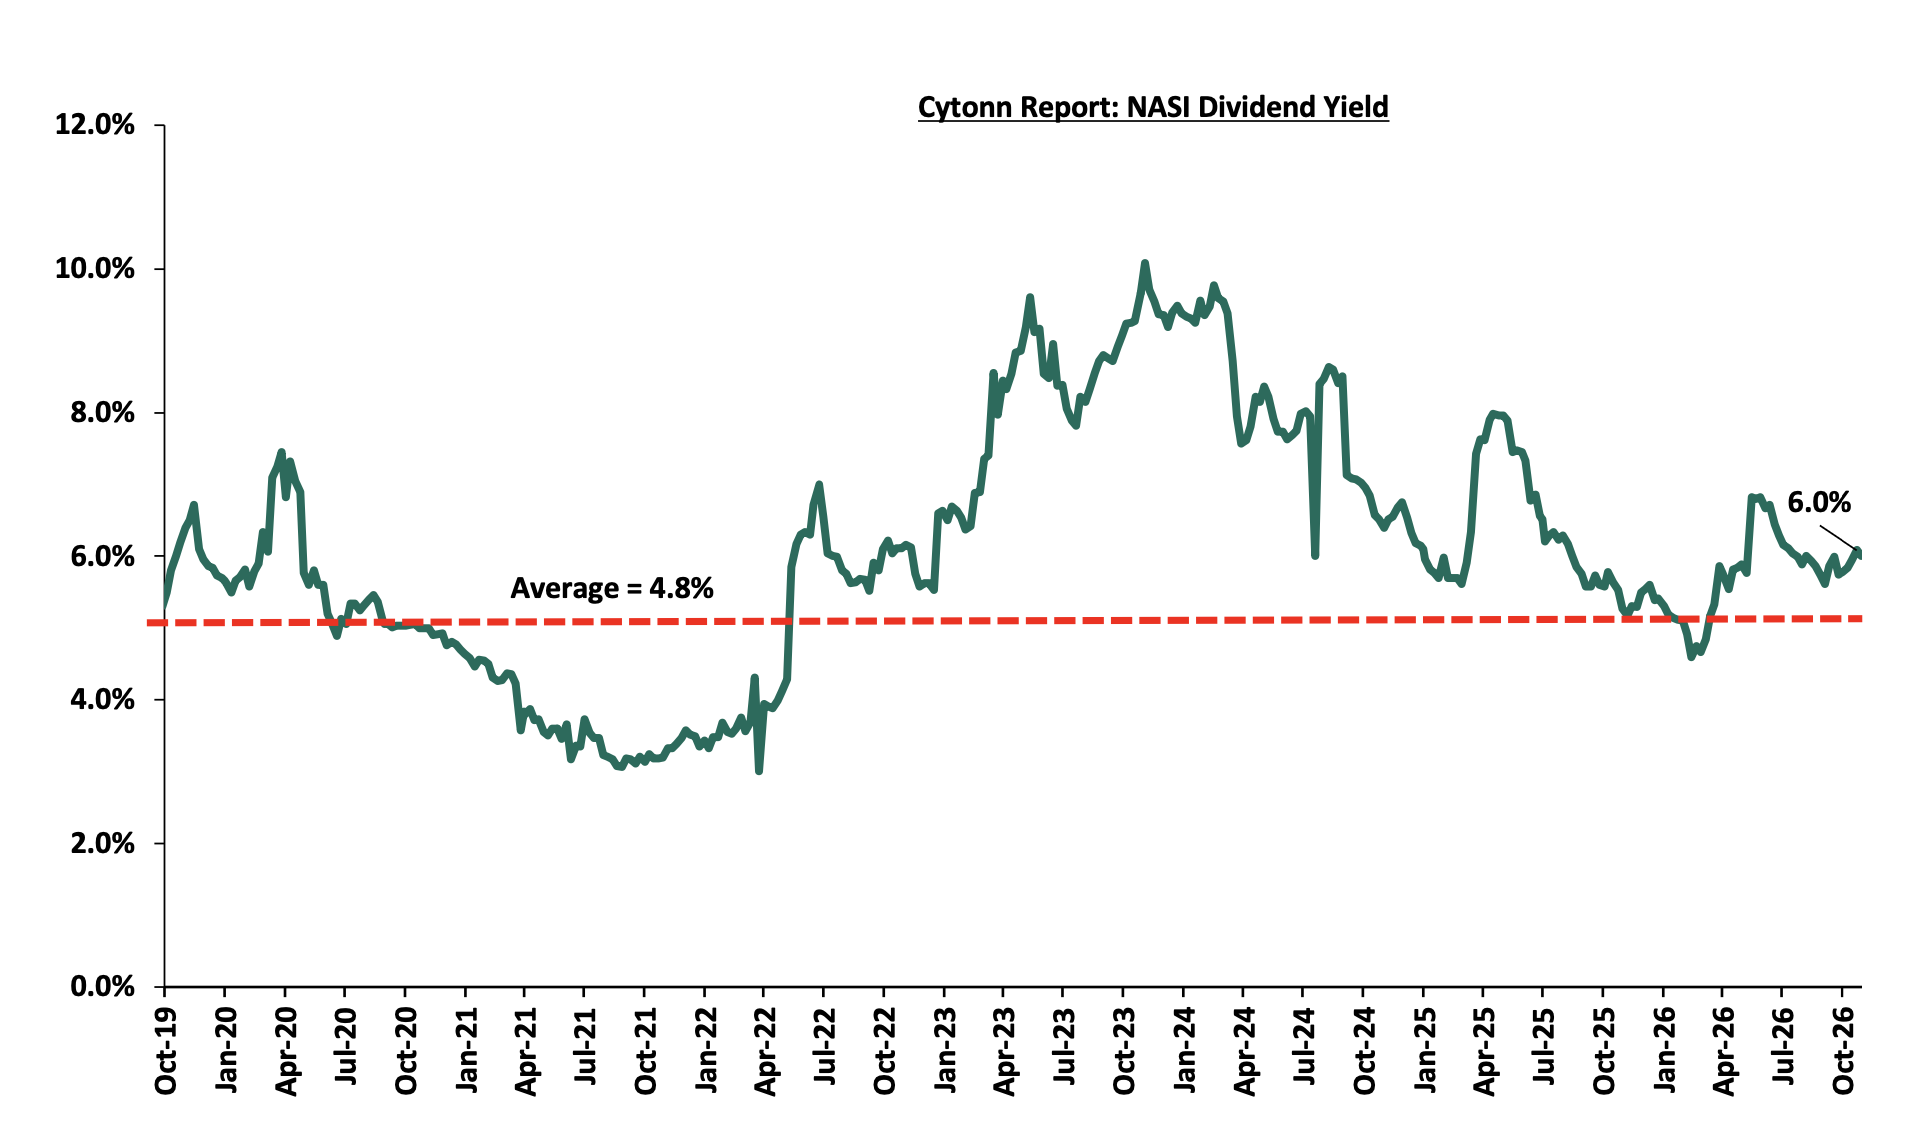
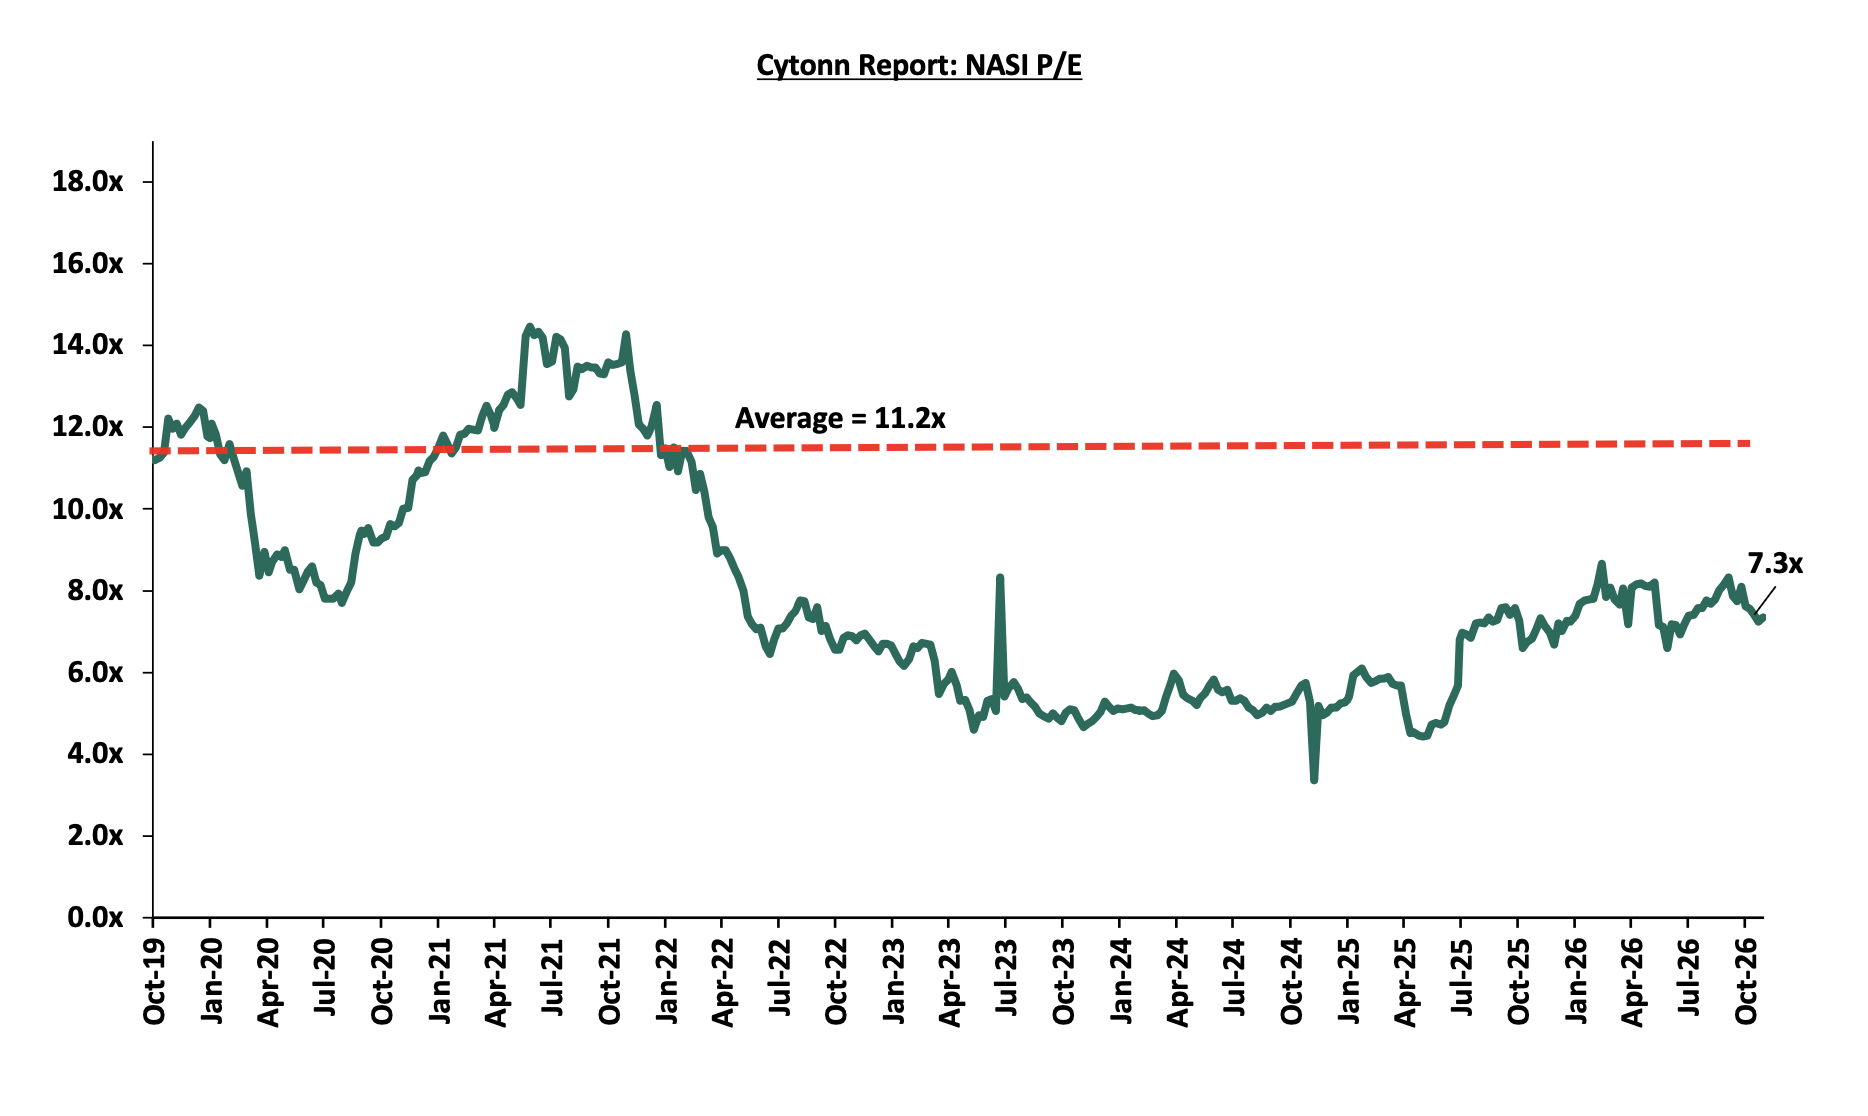
The market is currently trading at a price to earnings ratio (P/E) of 7.3x, 34.3% below the historical average of 11.2x, and a dividend yield of 6.0%, 1.2% points above the historical average of 4.8%. Key to note, NASI’s PEG ratio currently stands at 0.9x, an indication that the market is slightly undervalued relative to its future growth. A PEG ratio greater than 1.0x indicates the market may be overvalued while a PEG ratio less than 1.0x indicates that the market is undervalued.
The charts below indicate the historical P/E and dividend yields of the market;
Universe of Coverage:
|
Cytonn Report: Equities Universe of Coverage |
|||||||||||
|
Price as at 23/10/2027 |
Price as at 30/10/2028 |
w/w change |
m/m change |
YTD Change |
Year Open 2026 |
Target Price* |
Dividend Yield*** |
Upside/ Downside** |
P/TBV Multiple |
Recommendation |
|
|
Co-op Bank |
36.8 |
35.5 |
(3.5%) |
(4.3%) |
48.5% |
23.9 |
46.1 |
7.0% |
36.9% |
1.3x |
Buy |
|
NCBA |
88.0 |
88.0 |
0.0% |
(1.1%) |
3.5% |
85.0 |
108.9 |
8.1% |
31.9% |
1.2x |
Buy |
|
ABSA Bank |
31.2 |
30.0 |
(4.0%) |
(9.7%) |
20.5% |
24.9 |
36.8 |
6.8% |
29.9% |
1.6x |
Buy |
|
KCB Group |
85.3 |
86.0 |
0.9% |
(5.8%) |
30.8% |
65.8 |
104.4 |
8.1% |
29.5% |
0.9x |
Buy |
|
Equity Group |
97.5 |
95.0 |
(2.6%) |
(9.3%) |
41.8% |
67.0 |
113.5 |
6.1% |
25.5% |
1.2x |
Buy |
|
Stanbic Holdings |
272.0 |
259.5 |
(4.6%) |
(8.0%) |
31.2% |
197.8 |
300.3 |
8.6% |
24.3% |
1.5x |
Buy |
|
Family Bank |
25.8 |
27.2 |
5.2% |
(6.2%) |
50.8% |
18.0 |
32.5 |
4.4% |
24.1% |
1.4x |
Buy |
|
Standard Chartered Bank |
314.8 |
304.8 |
(3.2%) |
(3.9%) |
1.7% |
299.8 |
345.8 |
10.2% |
23.6% |
1.9x |
Buy |
|
Diamond Trust Bank |
186.3 |
179.3 |
(3.8%) |
(5.2%) |
56.2% |
114.8 |
199.5 |
5.0% |
16.3% |
0.5x |
Accumulate |
|
I&M Group |
81.3 |
81.3 |
0.0% |
(1.5%) |
89.8% |
42.8 |
90.4 |
4.6% |
15.9% |
1.3x |
Accumulate |
|
Jubilee Holdings |
393.0 |
396.8 |
1.0% |
(0.8%) |
23.0% |
322.5 |
420.5 |
3.8% |
9.8% |
0.5x |
Hold |
|
CIC Group |
5.1 |
4.7 |
(7.8%) |
(4.2%) |
4.4% |
4.5 |
5.0 |
2.7% |
7.4% |
1.2x |
Hold |
|
Britam |
18.5 |
18.1 |
(2.2%) |
(4.0%) |
99.2% |
9.1 |
18.5 |
0.0% |
2.2% |
1.3x |
Lighten |
|
*Target Price as per Cytonn Analyst estimates **Upside/ (Downside) is adjusted for Dividend Yield ***Dividend Yield is calculated using FY’2025 Dividends |
|||||||||||
Weekly Highlights
-
Quickmart PLC shareholder allocation update
Quickmart PLC (Quickmart) issued a Supplementary Information Memorandum (SIM) on 23 October 2026, following approval by the Capital Markets Authority (CMA), admitting three additional cornerstone investors to its Kshs 15.0 bn Offer for Sale of 2.0 bn shares at Kshs 7.50 per share. MOBILIST, RWC LLP and 337 Frontier join the International Finance Corporation (IFC), which was previously the sole cornerstone investor, bringing the number of anchors in the offer to four. The three new investors have applied for a combined Kshs 5.2 bn, with the SIM also reworking how the 2.0 bn shares are split between investor categories. Below is our previous write-up on the Quickmart IPO, based on the original Information Memorandum (IM):
-
Quickmart PLC IPO Note in October 2026, where we analyzed the offer structure, shareholding, proceeds of the sale, financial performance, dividend policy and valuation against Shoprite and SPAR, and recommended the offer as a subscribe for medium- to long-term investors.
The table below shows the new cornerstone investors.
|
Cytonn Report: Quickmart’s New Cornerstone Investors |
|||
|
Investor |
Application in Kshs bn |
% of offer |
% of post-listing capital |
|
MOBILIST |
1.9 |
13.0% |
6.5% |
|
337 Frontier |
1.9 |
13.0% |
6.5% |
|
RWC LLP |
1.3 |
8.7% |
4.3% |
|
Total |
5.2 |
34.7% |
14.3% |
MOBILIST is a UK Foreign, Commonwealth and Development Office programme, supported by the Governments of Norway and Switzerland, that mobilises institutional capital into new listed products in developing economies. RWC LLP is a UK-based investment manager regulated by the Financial Conduct Authority (FCA) and the US Securities and Exchange Commission (SEC), and part of Redwheel Group, which manages over USD 22.6 bn (as at June 2026). 337 Frontier is an SEC-registered investment adviser, formed in 2016, that focuses on frontier African (ex-South Africa) equities. RWC LLP and 337 Frontier are investing on behalf of various funds. Together with IFC’s Kshs 1.9 bn (13.0% of the offer, subject to its board approval), the four cornerstone investors have applied for about Kshs 7.1 bn, or roughly 48.0% of the offer and 24.0% of Quickmart’s post-listing share capital.
To accommodate the new anchors, the supplementary IM raises the cornerstone pool to 48.0% of the offer from 13.0%, an increase of 269.2% to 960.0 mn shares equivalent to Kshs 7.2 bn from 260.0 mn shares equivalent to Kshs 1.9 bn. The additional 700.0 mn shares were taken from every other pool. The foreign investor pool fell by 60.0% to 160.0 mn shares (Kshs 1.2 bn) from 400.0 mn shares (Kshs 3.0 bn), while the Kenyan retail pool fell by 40.0% to 240.0 mn shares (Kshs 1.8 bn) from 400.0 mn shares (Kshs 3.0 bn). The Kenyan institutional pool declined by 8.6% to 640.0 mn shares (Kshs 4.8 bn) from 700.0 mn shares (Kshs 5.25 bn). The East African Community (EAC) pool of 240.0 mn shares (12.0%) no longer stands alone, as EAC retail and institutional investors now sit within the retail and institutional pools. The table below shows the initial and revised allocations:
|
Cytonn Report: Quickmart IPO Allocation, Initial vs Revised (% of offer) |
|||
|
Investor category |
Initial |
Revised |
% Change points |
|
Kenyan retail (revised: Kenyan and EA retail) |
20.0% |
12.0% |
(8.0%) |
|
Kenyan institutional (revised: Kenyan and EA institutional) |
35.0% |
32.0% |
(3.0%) |
|
EAC investors (separate pool, now merged into the two above) |
12.0% |
0.0% |
(12.0%) |
|
Foreign investors |
20.0% |
8.0% |
(12.0%) |
|
Cornerstone investors |
13.0% |
48.0% |
35.0% |
|
Total |
100.0% |
100.0% |
|
For local investors as a whole, the revision narrows the room available in the offer. Combined, the Kenyan and EAC pools fell by 34.3% to 880.0 mn shares from 1,340.0 mn shares, reducing the local and regional share of the offer by 23.0% points to 44.0% from 67.0%, while foreign participation, treating the cornerstone investors as foreign, rises to 56.0% from 33.0%. Kenyan retail investors are the most affected in relative terms, as they now share a pool 40.0% smaller than before with EA retail investors, while Kenyan institutions retain the most room but also share their pool with EA institutions. Cornerstone allotments will be filled in full and will not be subject to scale-back, which means any oversubscription will be absorbed by the retail, institutional and foreign pools, whose applications may be scaled back pro rata. The stronger anchor book, however, lowers the risk of the offer lapsing, as the 960.0 mn-share cornerstone pool alone equals 64.0% of the 1.5 bn-share minimum subscription. The SIM does not disclose any lock-up on the new cornerstone investors, which, together with IFC’s freedom to sell after listing and the 0.8 bn unlocked Sokoni shares, leaves post-listing supply risk in place.
The offer closed on 30th October 2026, with the allocation results due on 6th November 2026 and trading on the NSE Main Investment Market Segment set to commence on 12th November 2026. We expect any scale-back to be borne by the retail, institutional and foreign pools, and that local investors will find it harder to secure their full applications than under the initial allocation.
Notable highlights for October 2026:
-
During the month, Quickmart Plc launched an Initial Public Offer (IPO) at the Nairobi Securities Exchange (NSE) through an Offer for Sale by its sole shareholder, Sokoni Retail Kenya Limited. The listing is the second IPO at the NSE in 2026, following Kenya Pipeline Company (KPC), and the first private-sector, private equity-backed IPO in Kenya in over a decade. Quickmart is Kenya’s second-largest modern grocery retailer, with an estimated 15.0% market share behind Naivas at 31.0% and ahead of Carrefour at 14.0%, and operates 72 stores across 16 counties. The IPO gives investors direct exposure to the consumer and modern grocery retail sector, which has lacked a listed pure-play supermarket since the decline of Uchumi Supermarkets. For more information, please see our Cytonn Weekly #40/2026 and our Quickmart IPO Note;
-
During the month, The Kenya Pipeline Company (KPC), released its FY’2026 financial results, recording a 13.1% Increase in Profit After Tax (PAT) to Kshs 11.6 bn in FY’ 2026 from 10.2 bn in FY’ 2025. This is mainly attributable to an 8.9% increase in Net Revenue to Kshs 33.8 bn from Kshs 31.1 bn in FY’2025. The increase in PAT was, however, weighed down by a 4.1% increase in operating expenses to Kshs 8.9 bn from Kshs 8.5 bn in FY’2025, coupled with a 20.2% increase in depreciation and amortization charges to Kshs 7.7 bn from Kshs 6.4 bn in 2025. For more information, please see our Cytonn Weekly #41/2026;
We maintain a “cautiously optimistic” short-term outlook supported primarily earnings-led attractive valuations, despite heightened geopolitical risks such as Iran war that may weigh on investor sentiment, and, “neutral” in the long term as persistent foreign investor outflows continue to constrain market liquidity and limit broad-based market re-rating. With the market currently trading at a discount to its future growth (PEG Ratio at 0.9x), where performance will be driven by company-specific fundamentals rather than general market direction, we believe that investors should reposition towards value stocks exhibiting strong earnings growth, attractive dividend yields, solid balance sheets, sustainable competitive advantages and trading at compelling discounts to their intrinsic value. While foreign investor sell-offs are expected to continue exerting pressure in the near term, we believe this will create selective entry opportunities for long-term investors
There were four notable industry highlights during the month:
|
Cytonn Report: Notable Industry Reports During the Month of October 2026 |
|||
|
Theme |
Report |
Key Take-outs |
|
|
1. |
Leading Economic Indicators |
August Leading Economic Indicators (LEI) |
|
|
2 |
KNBS Q2’2026 GDP report |
the Quarterly Gross Domestic Product Report for Q2'2026 |
|
|
3 |
KNBS’ Q2’2026 Kenya Residential Property Price Index (RPPI) Report |
KNBS’ Q2'2026 Kenya Residential Property Price Index (RPPI) |
|
-
Residential sector
There were four notable highlights during the month;
-
During the month, the state department for Housing and Urban development revealed in a budgetary report that the government is facing severe revenue collection hurdles in converting completed housing units into cash flow to finance subsequent phases of its Affordable Housing Program (AHP). For more information, please see our Cytonn Weekly #40/2026,
-
During the month, property developer International Housing Solutions (IHS) Kenya officially broke ground on a Kshs 1.8 bn residential rental development dubbed Muzi Enzi, expanding its Real Estate portfolio within Kiambu County. The project is situated inside the Tatu City mixed-use development in Ruiru and will deliver 406 apartments consisting of 238 one-bedroom and 168 two-bedroom units. For more information, please see our Cytonn Weekly #40/2026,
-
During the month, the Kenya Green Building Society (KGBS) launched the Kenya Sustainable and Resilient Built Environment Projects and Solutions Repository during the Kenya Green Building Society Conference 2026 held in Nairobi. For more information, please see our Cytonn Weekly #40/2026,
-
During the month, Shelter Afrique Development Bank (SADb) opened subscriptions for a FCFA Kshs 60.0 bn (USD 100.0 mn) sustainable housing bond targeting institutional and retail investors across the eight-member West African Economic and Monetary Union (WAEMU) region. For more information, please see our Cytonn Weekly #40/2026,
We expect the residential sector to remain supported by demand for affordable housing, private-sector investment in rental developments and growing adoption of sustainable construction solutions. However, financing constraints and weak revenue mobilization under the government's Affordable Housing Programme could slow project implementation, particularly where gradual Tenant Purchase Scheme payments delay funding for subsequent construction phases. Private-sector developments, such as the Muzi Enzi project at Tatu City, highlight continued investor interest in rental housing, while green building initiatives are expected to improve access to sustainable construction solutions and financing. Going forward, sector growth will depend on improved housing programme funding, access to long-term development finance and sustained private-sector investment.
-
Devki Group breaks ground on Kshs 70.0 bn clinker and cement plant in Kitui County;
During the week, Devki Group broke ground on a Kshs 70.0 bn cement and clinker plant in Ngaaie, Kitui County. The facility will produce 3.0 mn tonnes of clinker annually, raising Devki Group’s total production capacity to 9.2 mn tonnes. The expanded capacity represents 88.5% of Kenya’s total installed capacity of 10.4 mn tonnes. The investment intensifies regional competition among industrial players, including Tanzania’s Amsons Group (owner of Bamburi Cement) and Uganda-based Sarrai Group. Devki’s latest project brings its combined cement investments across East Africa to at least Kshs 203.0 bn over the past three years. The government defended the 17.5% Export and Investment Promotion Levy on imported clinker introduced via the Finance Act 2023 to promote local manufacturing, despite opposition from smaller cement producers who sought a grace period through 2026. Major infrastructure developments, including the Affordable Housing Programme, Dangote Refinery, Lamu Port expansion, Talanta Stadium, and SGR extensions are expected to drive long-term demand for construction materials.
Going forward, increased domestic clinker production is expected to reduce reliance on imported raw materials, improve cement supply and potentially moderate construction costs. This could support the timely execution of residential, commercial and infrastructure developments by improving the availability and affordability of construction materials. However, the extent of the benefit will depend on cement demand, production costs and the implementation of planned housing and infrastructure projects.
-
Hospitality Sector;
There was one notable highlight during the month;
-
During the month, KNBS recorded air travel between Kenya and the Middle East staged a strong rebound in Q3’2026, even as regional conflict persists. Departures from JKIA to Middle Eastern destinations like Dubai and Doha climbed by 16.0% in July and August combined, rising to 151,295 passengers from 130,156 in 2025. For more information, please see Cytonn Weekly #42/2026,
We expect the hospitality sector to benefit from the recovery in international air travel, supported by increased passenger traffic between Kenya and key Middle Eastern destinations. Departures from Jomo Kenyatta International Airport (JKIA) to destinations such as Dubai and Doha increased by 16.0% in July and August 2026, reaching 151,295 passengers from 130,156 recorded during a similar period in 2025. The growth signals improving travel activity and presents opportunities for increased demand for accommodation, conferencing and related hospitality services. However, sustained growth will depend on continued recovery in international travel, regional stability and the resilience of global tourism demand.
-
Infrastructure Sector
-
Government steps up rural roads spending with Kshs 15.5 bn contracts;
During the week, the government, through the Kenya Rural Roads Authority (KeRRA), awarded contracts worth Kshs 15.5 bn for the upgrading of 95 rural roads since the start of FY2026/27. The contracts are valued at more than double the Kshs 6.1 bn recorded for 967 contracts in the 12 months to June 2026, marking a sharp increase in road contracting following previous fiscal containment measures. Most projects involve upgrading gravel roads to bitumen standards across Coast, Rift Valley, North Eastern, Central, and Nyanza regions to improve market and facility access. The largest contract awarded is the Kshs 3.8 bn upgrade of the Korisa-Gamba road in Garissa County to Xtreme Engineering Limited. Other major awards include the Kshs 2.0 bn upgrade of road links in Kisii County, the Kshs 1.8 bn upgrade of the Junction C67 (Kirwara)-Kigio-Junction C67 (Blue Post) road in Murang’a County, and the Kshs 1.8 bn Mwaila-Bwage-Makutano-Kapsara-Minex-Arba-Kesegon project in Trans Nzoia County.
Additional contracts cover projects in Makueni, Kilifi, Uasin Gishu, and Kajiado counties. Data from the State Department for Roads MTEF report indicates that actual road construction by KeNHA, KURA, and KeRRA reached 786 km in 2025/26 against a target of 863.1 km, compared to 761.2 km in 2024/25. Total allocation to the State Department for Roads stands at Kshs 234.7 bn in 2026, with development allocations rising to Kshs 76.9 bn from Kshs 23.5 bn in 2025. The increased infrastructure investment will enhance regional connectivity and lower transport costs.
We expect, the expansion of rural road networks will support Real Estate development by opening up hinterlands, increasing land accessibility, and driving commercial and residential demand in secondary urban and trading hubs. However, long-term market absorption and REstate activity will depend on project completion timelines and sustained budgetary allocations from The National Treasury.
There were five notable highlights during the month;
-
During the month, China Road and Bridge Corporation (CRBC) was awarded a Kshs 3.2 bn contract to upgrade the seven-kilometer Old Mombasa Road linking the Nairobi Inland Container Depot (ICD) to Syokimau, with construction expected to begin on 1st September, 2026 and complete by 28th April, 2029. The works to be undertaken under the contract include pavement construction, drainage and protection works, road furniture, identification and relocation of services and maintenance of traffic passage during construction. For more information, please see Cytonn Weekly #41/2026,
-
During the month, the National Treasury approved the initial pitch to convert the 243-kilometre Athi River-Namanga road, commonly known as the A2 corridor, into a dual carriageway, with the PPP Directorate confirming that the project concept note received first approval in September 2026. The A2 corridor extends from Athi River through Kitengela, Isinya, and Kajiado to the Namanga border town, serving as a strategic transport artery linking Nairobi with northern Tanzania and forming part of the Cairo-Cape Town Trans-African Highway, while also providing access to rapidly growing peri-urban settlements, the Konza Technopolis, and key economic centers in Machakos and Kajiado counties. For more information, please see Cytonn Weekly #41/2026,
-
During the month, the National Land Commission (NLC) initiated compulsory land acquisition proceedings targeting 59 land parcels within North Mugirango Constituency in Nyamira County, as part of the Naivasha-Kisumu-Malaba Standard Gauge Railway (SGR) Phase 2B and 2C extension project. The gazette notice, executed under Section 110 of the Land Act, 2012, forms a critical statutory step toward establishing the primary rail corridor, with affected landholders and stakeholders directed to inspect project survey plans at Ardhi House in Nairobi and at the Nyamira County Coordinator’s office, ahead of formal inquiry notices detailing compensation valuations and boundary claims. For more information, please see Cytonn Weekly #41/2026,
-
During the month, the State Department for Roads reported that new road construction by the Kenya National Highways Authority (KeNHA), Kenya Urban Roads Authority (KURA), and Kenya Rural Roads Authority (KeRRA) fell by 62.0% over the last four financial years compared to the pre-2022 period. Between FY2022/23 and FY2025/26, the three agencies constructed a combined 2,584.2 km of roads, down from 6,813 km delivered in the preceding four-year period. Average annual output dropped from 1,703 km to 646 km, hitting a low of 495 km in FY2022/23 before partially recovering to 542 km in FY2023/24, 761.25 km in FY2024/25, and 786 km in FY2025/26. For more information, please see our Cytonn Weekly #40/2026,
-
During the month, the proposed 243-kilometer Mau Summit-Malaba dual carriageway successfully cleared its initial technical, social, and environmental pre-feasibility assessment. The study, conducted jointly by Canadian consulting firm CPCS and Kenya’s Avatech Engineering, confirmed that upgrading the existing two-lane corridor into a four-lane, access-controlled tolled highway is technically viable and requires minimal land acquisition or resettlement because it falls within the existing national road right-of-way.For more information, please see our Cytonn Weekly #40/2026,
We expect the infrastructure sector to benefit from increased investment in road networks and efforts to improve regional connectivity, although actual road construction remains below historical levels. During the month, the government awarded Kshs 15.5 bn in contracts to upgrade 95 rural roads through KeRRA, alongside other developments involving the Old Mombasa Road upgrade, the proposed Athi River-Namanga and Mau Summit-Malaba dual carriageways, and the Naivasha-Kisumu-Malaba SGR extension. These projects are expected to improve accessibility, lower transportation costs and strengthen connectivity to emerging economic centres, supporting residential, commercial and industrial development along the affected corridors. However, their impact will depend on timely implementation and sustained funding
-
Land Sector
There were three notable highlights during the month;
-
During the month the president plans to scrap stamp duty on land and property transactions. The exemption lowers a direct transaction cost that has long discouraged formal registration among smallholders and low-income buyers, and we expect this to translate into higher transaction volumes and improved land market data in the low-value segment, which has historically been underrepresented in formal records due to the cost of titling. For more information, please see our Cytonn Weekly #42/2026,
-
During the month, the Nairobi City County Cabinet approved a fresh application procedure for land rates exemptions, ordering all property owners to reapply for exemptions before the 1st January 2027 billing cycle under the criteria established by the National Rating Act, 2024, which came into effect on 24th December, 2024. For more information, please see Cytonn Weekly #41/2026,
-
During the month, the National Treasury published the Agriculture, Rural and Urban Development (ARUD) Sector Report for the 2027/28-2029/30 MTEF period, which highlighted that title deeds issued fell by 35.3% to 282,392 in the year to June 2026, from 436,212 in the prior financial year. For more information, please see Cytonn Weekly #41/2026,
We expect the land sector to remain shaped by government reforms aimed at reducing property transaction costs, formalising land ownership and strengthening county revenue collection. Proposed stamp duty exemptions for low-value land transactions could improve access to formal property ownership, while revised land rates exemption procedures are expected to enhance compliance and accuracy in county land records. However, declining title deed issuance highlights persistent challenges in land administration. Overall, effective implementation of these reforms could improve tenure security, encourage formal land transactions and strengthen the attractiveness of land as an investment asset.
-
Real Estate Investments Trusts
-
ALP Industrial REIT announces first-ever interim distribution
During the week, ALP Industrial REIT announced its first-ever interim distribution of USD 930,434, equivalent to USD 0.0207 per unit, representing an implied yield of 2.0% and an indicative annualised yield of 2.7%. The distribution, recommended by the REIT Manager and approved by the Trustee, is based on unaudited financial statements as at 30th September 2026, with payment scheduled for 27th November 2026 to eligible unitholders registered by 18th November 2026. The payout marks a significant milestone for the REIT, which listed on the Nairobi Securities Exchange (NSE) on 11th March 2026 as East Africa’s first industrial REIT and the NSE’s first US dollar-denominated security. It also represents the first step in delivering the fund’s income distribution proposition, which requires at least 80.0% of distributable income to be paid to unitholders.
The table below shows ALP I-REIT interim distribution breakdown;
|
ALP I-REIT |
|
|
Number of Units |
455,000,000.0 |
|
Total Distribution (USD) |
9,304,344.0 |
|
Distribution per Unit (USD) |
0.02 |
|
Market Price (USD |
1.02 |
|
Implied Yield |
2.0% |
|
Annualized Yield |
2.7% |
Going forward, distribution growth will depend on the REIT’s ability to expand its income-generating portfolio and translate additional rental income into higher distributable earnings. The transfer of ALP North Three, a fully occupied 21,628-square-metre warehouse in Tatu City valued at USD 18.4 mn and carrying an implied entry yield of 8.93%, is expected to strengthen the REIT’s rental income base. Similarly, the recently completed 11,000-square-metre Kivu logistics facility at ALP West, which attained 85.0% occupancy within its first month, provides further potential to expand rental income as occupancy increases and the asset is incorporated into the REIT. Additionally, the reinstatement of stamp duty exemptions for qualifying property transfers into REITs under the Finance Act 2026 is expected to lower transfer costs and facilitate portfolio expansion. Nevertheless, the extent to which these developments translate into higher distributions per unit will depend on the timing of asset incorporation, rental income growth and the additional units issued to finance property transfers.
-
TRIFIC Green USD I-REIT September 2026 Performance;
During the week, TRIFIC Green USD I-REIT released its inaugural financial results for the period ended 30th September 2026, reporting a profit of USD 782,392 and basic earnings per unit of USD 0.0266. The REIT, which commenced trading on the Nairobi Securities Exchange (NSE) on 29th June 2026, is managed by Nabo Capital Limited, with NCBA Bank Kenya PLC as trustee. Notably, the acquisition of its initial investment property, TRIFIC North Tower, remained incomplete as at the reporting date. Consequently, the USD 574,337 reported as rental income represents promoter-supported income for July to September 2026, rather than income generated by a property legally transferred to the REIT.
Below is a summary of the TRIFIC GREEN I-REIT’s Performance for the period ended 30th September 2026.
|
Figures in USD mn unless stated otherwise |
|
|
Balance Sheet |
September 2026 |
|
Total Assets |
29.5 |
|
Total Equity |
29.4 |
|
Total Liabilities |
0.1 |
|
Figures in USD unless stated otherwise |
|
|
Income Statement |
September 2026 |
|
Pre-Transfer Rental Income |
574,337.0 |
|
Income from Other Sources |
4,693.0 |
|
Operating Expenses |
58,453.0 |
|
Profit/Loss |
782,392.0 |
|
Basic Earnings per Unit (USD) |
0.0266 |
|
Distribution Per Unit (USD) |
0.02 |
|
Implied Yield |
1.6% |
|
Anualized Implied Yield* |
2.1% |
*The implied yield for the nine-month period has been annualised to a 12-month basis
|
Figures in USD unless stated otherwise |
|
|
Ratios Summary |
September 2026 |
|
ROA |
2.7% |
|
ROE |
2.7% |
|
Debt Ratio |
0.2% |
|
PBT Margin |
136.2% |
|
Rental Yield |
0.0% |
|
Annualized Rental Yield |
0.0% |
The following are the Key Takeaways;
Income statement takeaways;
-
Positive inaugural earnings: The REIT recorded a profit of USD 782,392, translating into basic earnings per unit of USD 0.0266. Earnings were supported by promoter rental income, interest earned on unutilized IPO proceeds and other income, rather than income from an acquired investment property.
-
Promoter-supported rental income: Pre-transfer rental income amounted to USD 574,337, representing income support from Two Rivers Land Company (SEZ) Limited for July to September 2026. The amount remained receivable from the promoter at the reporting date, highlighting the REIT's dependence on interim income support pending completion of the North Tower acquisition.
-
Interest income supported profitability: Finance income amounted to USD 261,815, reflecting returns earned on unutilized IPO proceeds. While this provided an additional earnings stream during the establishment phase, its contribution is expected to change as the funds are deployed into income-generating Real Estate.
-
Operating cost management: Operating expenses totalled USD 58,453, comprising fund operating expenses of USD 56,223 and administrative expenses of USD 2,230. This translated into a cost-to-income ratio of 10.1%, based on total operating income of USD 579,030.
-
Interim distribution declared: The Board declared a distribution of USD 745,800, equivalent to 95.3% of reported comprehensive income. Based on the stated market price of USD 1.3 per unit, the distribution implies a yield of 1.6% and annualized yield of 2.1%. The payout is supported by promoter income support and interest earned on unutilized IPO proceeds, rather than established recurring property rental income.
Balance Sheet Key Takeaways
-
Strong liquidity position: Total assets stood at USD 29.5 mn, comprising mainly USD 28.8 mn in cash and cash equivalents, USD 0.6 mn due from the promoter and USD 0.1 mn in trade and other receivables. The sizeable cash balance reflects largely undeployed IPO proceeds awaiting completion of the North Tower acquisition.
-
Minimal financial leverage: Total liabilities amounted to USD 0.1 mn, entirely comprising trade and other payables, with no outstanding borrowings. This resulted in a low debt-to-asset ratio of 0.2%, providing balance sheet flexibility and limiting exposure to financing costs.
-
Equity reflects pending property consideration: Unitholders' equity stood at USD 29.4 mn, comprising USD 36.5 mn in trust capital and USD 0.8 mn in retained earnings, offset by USD 7.9 mn in unpaid consideration relating to units issued to the promoter for the proposed property acquisition.
-
Initial returns recorded: The REIT reported ROA and ROE of 2.7% each, while net asset value per unit stood at USD 1.0, consistent with the initial offer price. However, the reported returns reflect the fund's initial capitalization and promoter-supported earnings, rather than an established property operating track record.
We expect the REIT's performance to depend largely on the successful completion of the TRIFIC North Tower acquisition, valued at USD 37.3 mn, comprising USD 29.4 mn in cash and USD 7.9 mn in units issued to the promoter. The REIT Manager expects the transfer to be completed by 9th December 2026, subject to outstanding completion requirements, particularly the discharge of the existing property charge. The acquisition of the 16,213-square-metre office property is expected to establish the REIT's underlying income-generating asset and enable rental income to accrue directly to the fund. Additionally, market-making activities commenced on 22nd October 2026 through AIB-AXYS Investment Bank, which could support secondary market liquidity. However, investors should monitor completion of the property transfer, settlement of the outstanding consideration, conversion of promoter-supported income into recurring rental cash flows and progress towards the targeted 8.0% annual net USD distribution yield.
For a more detailed analysis please see Cytonn’s Trific I-REIT September 2026 Earnings Note
-
REITs Weekly Performance
On the Unquoted Securities Platform Acorn D-REIT and I-REIT traded at Kshs 29.7 and Kshs 24.4 per unit, respectively, as per the last updated data on 30th October 2026. The performance represented a 48.5% and 22.0% gain for the D-REIT and I-REIT, respectively, from the Kshs 20.0 inception price. The volumes traded to date for the D-REIT and I-REIT came in at 13.8 mn and 46.5 mn shares, respectively. Additionally, ILAM Fahari I-REIT traded at Kshs 13.8 per share as of 30th October 2026, representing a 31.0% loss from the Kshs 20.0 inception price. The volume traded to date for the I-EIT came in at 1.2 mn shares. REITs offer various benefits, such as tax exemptions, diversified portfolios, and stable long-term profits. However, the ongoing decline in the performance of Kenyan REITs and the restructuring of their business portfolios are hindering significant previous investments. Additional general challenges include:
-
Insufficient understanding of the investment instrument among investors leading to a slower uptake of REIT products,
-
Lengthy approval processes for REIT creation,
-
High minimum capital requirements of Kshs 100.0 mn for REIT trustees compared to Kshs 10.0 mn for pension funds Trustees, essentially limiting the licensed REIT Trustee to banks only
-
The rigidity of choice between either a D-REIT or and I-REIT forces managers to form two REITs, rather than having one Hybrid REIT that can allocate between development and income earning properties
-
Limiting the type of legal entity that can form a REIT to only a trust company, as opposed to allowing other entities such as partnerships, and companies,
-
We need to give time before REITS are required to list - they would be allowed to stay private for a few years before the requirement to list given that not all companies maybe comfortable with listing on day one, and,
-
Minimum subscription amounts or offer parcels set at Kshs 0.1 mn for D-REITs and Kshs 5.0 mn for restricted I-REITs. The significant capital requirements still make REITs relatively inaccessible to smaller retail investors compared to other investment vehicles like unit trusts or government bonds, all of which continue to limit the performance of Kenyan REITs.
We expect Kenya’s Real Esector to remain resilient, supported by: i) Increased domestic cement and clinker production supported by Devki Group’s Kitui plant, which will improve construction material supply and support property development, ii) Government Kshs 15.0 bn investment in rural roads, which will enhance connectivity and open up emerging Real Estate markets, iii) Growing REIT activity, demonstrated by ALP Industrial REIT’s first distribution and TRIFIC Green USD I-REIT’s inaugural results, and iv) Expansion of industrial and logistics assets, supported by strong occupancy and proposed portfolio additions. However, delays in Trific I-REIT property transfers, reliance on promoter-supported income, and weak investor appetite, reflected in ILAM Fahari I-REIT’s 31.0% loss from its inception price, will continue to constrain the sector’s performance.
-
Visa Reports 13.2% Fiscal Q4 2026 Revenue Growth, with Full-Year Net Revenue Reaching a Record USD 45.9 Bn
During the week, Visa Inc. reported its fiscal fourth quarter and full-year 2026 financial results. Net revenue for the quarter increased by 13.2% year-on-year to USD 12.1 bn, driven by growth in payments volume, cross-border volume and processed transactions, while full-year net revenue increased by 14.8% to a record USD 45.9 bn. GAAP net income for the quarter was USD 6.0 bn, or USD 3.19 per share, which is an increase of 17.9% and 21.8% respectively, while non-GAAP net income was USD 6.6 bn, or USD 3.5 per share, which is an increase of 13.0% and 17.0% respectively, with payments volume growing 9.0% in constant dollars, cross-border volume rising by 14.0% and processed transactions increasing by 10.0%. GAAP operating expenses increased by 6.6% to USD 4.9 bn from USD 4.6 bn, primarily driven by higher general and administrative expenses, partly offset by a lower litigation provision. Visa returned USD 5.2 bn to shareholders through share repurchases and dividends in the quarter, with the board raising the quarterly dividend per share (DPS) by 16.4% to USD 0.78 from USD 0.67 in 2025. For fiscal 2027, management guided to low-double-digit net revenue growth and expects to renew client agreements representing approximately 25.0% of payments volume, which is likely to increase client incentive growth. The results reflect resilient consumer and cross-border spending across the Visa network, although higher renewal activity and client incentives may moderate the pace at which revenue growth converts into margin expansion.
-
American Express Delivers Record Q3 2026 Revenue of USD 20.1 Bn and Raises Full-Year EPS Guidance
During the week, American Express Company reported its third-quarter 2026 financial results, with total revenues net of interest expense rising by 8.9% year-on-year to a record USD 20.1 bn and billed business growing by 8.0% to USD 454.0 bn. Net income increased by 27.9% to USD 3.7 bn, while diluted earnings per share rose by 30.9% to USD 5.42, or 13.0% to USD 4.68 on an adjusted basis after excluding the gain on the sale of its equity investment in Global Business Travel Group. Credit quality remained strong, with the net write-off rate easing to 1.8% from 1.9% a year earlier. Total expenses increased by 9.3% to USD 14.5 bn from USD 13.3 bn, driven by higher variable customer engagement costs from increased Card Member spending and the U.S. Platinum Card refresh, partially offset by lower other operating expenses, which benefited from the gain on the GBTG sale. Reflecting the performance, management raised its full-year 2026 EPS guidance to a range of USD 18.3 to USD 18.6 on a GAAP basis and USD 17.6 to USD 17.9 on an adjusted basis. The board also declared a quarterly dividend per share (DPS) of USD 0.95, which is 15.9% higher than the USD 0.82 declared a year earlier. The results point to sustained Card Member spending, new account acquisition and retention, although the increase in reported EPS was boosted by a one-time gain, making adjusted EPS growth of 13.0% a better gauge of underlying performance.
-
PayPal Raises Full-Year Non-GAAP EPS Guidance as Q3 2026 Revenue Grows by 2.0% to USD 8.6 Bn
During the week, PayPal Holdings, Inc. reported its third-quarter 2026 results, with net revenues rising by 2.0% to USD 8.6 bn and total payment volume (TPV) increasing by 6.0% to USD 487.1 bn, or 7.0% on a foreign-exchange-neutral basis. Payment transactions grew by 7.0% to 6.8 bn, while active accounts edged up by 0.6% to 440.0 mn. Non-GAAP EPS increased by 8.0% to USD 1.45, whereas GAAP EPS declined by 3.8% to USD 1.25, and transaction margin dollars rose by 2.0% to USD 4.0 bn. Total operating expenses increased by 4.1% to USD 7.2 bn from USD 6.9 bn, mainly on higher transaction expense and restructuring and other charges, which rose to USD 255 mn from USD 69 mn. PayPal repurchased approximately 28.0 mn shares for USD 1.5 bn during the quarter and raised its full-year 2026 non-GAAP EPS guidance to approximately USD 5.60 from approximately USD 5.38, while guiding fourth-quarter non-GAAP EPS of approximately USD 1.43. The board also declared a quarterly dividend per share (DPS) of USD 0.14, unchanged from a year earlier, payable on 24 December 2026. Revenue growth continues to trail TPV growth, with international revenue declining about 2.0% to USD 3.58 bn, indicating that monetization remains under pressure even as share repurchases and cost discipline support per-share earnings.
-
Global Payments Takes Its Genius Commerce Platform on the Road Through a Nationwide Tour
During the month, Global Payments Inc. launched Genius World, its inaugural four-day flagship event in Las Vegas showcasing Genius, its all-in-one point-of-sale and payments platform, and publicly debuted the Genius Road Trip, a mobile showroom set to make more than 40 stops across the U.S. The tour brings live demonstrations of how Genius unites hardware, software and payments into a connected commerce ecosystem to merchants, resellers, independent sales organizations and banks, with a focus on reducing operational complexity and supporting scale across retail, restaurant and stadium settings. The initiative comes as the company executes a multi-year turnaround strategy centered on new payment technology and artificial intelligence. By placing Genius directly in front of customers in their local communities, Global Payments seeks to differentiate its merchant offering in a competitive small business segment and accelerate adoption of its integrated platform.
-
Digital Payments Financial Results
The table below compares the latest reported results of Visa, American Express and PayPal with the corresponding prior-year period:
|
Cytonn Report: Digital Payments Financial Results |
||||
|
Company |
Metric |
2025 |
2026 |
y/y Change |
|
Visa (Fiscal Q4) |
Net revenue FY (USD bn) |
14.8% |
||
|
Net income (USD bn) |
17.9% |
|||
|
Diluted EPS (USD) |
21.8% |
|||
|
Dividend per share (USD) |
16.4% |
|||
|
Total operating expenses (USD bn) |
6.6% |
|||
|
American Express (Q3) |
Revenue net of interest expense (USD bn) |
8.9% |
||
|
Net income (USD bn) |
27.9% |
|||
|
Diluted EPS (USD) |
30.9% |
|||
|
Dividend per share (USD) |
15.9% |
|||
|
Total expenses (USD bn) |
9.3% |
|||
|
PayPal (Q3) |
Net revenues (USD bn) |
2.0% |
||
|
Net income (USD bn) |
(14.0%) |
|||
|
Diluted EPS (USD) |
(3.8%) |
|||
|
Dividend per share (USD) |
0.14 |
0.0% |
||
|
Total operating expenses (USD bn) |
4.1% |
|||
Source: Visa, American Express and PayPal earnings releases (SEC filings). GAAP figures for the quarter ended 30 September 2026 (Visa fiscal Q4; American Express and PayPal Q3).
-
Digital Payments Stock Performance
The table below presents a snapshot of NYSE-listed digital payments stocks, covering Visa, Mastercard, American Express (AXP), Wise Plc, Block, Global Payments and PayPal:
|
Cytonn Report: Digital Payments NYSE and LSE stock perfomance |
||||||||
|
Company |
Year Open 2026 |
Price 30/09/2026 |
Price 23/10/2026 |
Price 30/10/2026 |
w/w change |
m/m change |
YTD change |
Forward P/E |
|
Global Payments Inc |
77.0 |
81.9 |
82.8 |
96.8 |
16.9% |
18.3% |
25.7% |
|
|
Mastercard |
563.1 |
551.5 |
623.6 |
638.0 |
2.3% |
15.7% |
13.3% |
|
|
American Express |
372.7 |
304.1 |
313.2 |
319.1 |
1.9% |
4.9% |
(14.4%) |
|
|
Visa |
346.5 |
359.3 |
407.9 |
413.6 |
1.4% |
15.1% |
19.4% |
|
|
Paypal Holdings |
58.1 |
52.5 |
57.0 |
57.0 |
(0.0%) |
8.5% |
(1.9%) |
|
|
Block |
65.2 |
73.5 |
76.5 |
76.2 |
(0.3%) |
3.7% |
17.0% |
|
|
Circle |
83.5 |
82.2 |
85.9 |
72.5 |
(15.6%) |
(11.7%) |
(13.1%) |
|
|
Average |
|
|
|
|
|
|
|
25.1x |
Source: Visa, AXP, Circle, Global Payments, Mastercard, Block and PayPal financials, NYSE, PE* calculated using forward estimates FY’2027 financials
The stocks are currently trading at an average P/E multiple of 25.1x, indicating that investors are pricing in strong future earnings growth and are prepared to pay a substantial premium for current earnings. This also suggests that valuations may be stretched relative to near-term fundamentals.
Notable highlights for October 2026:
-
During the month, Visa announced three enhanced commercial payment capabilities: SESA 2.0, which uses AI-driven analytics to identify supplier card-payment opportunities; Visa Commercial Fraud Solutions, which strengthens supplier verification, virtual-card authentication and transaction-level spending controls and a live pilot with BILL and Billtrust enabling authorized AI agents to complete buyer-approved invoice payments through supplier portals using tokenized credentials. SESA has identified more than USD 600.0 bn in potential card-able spend, positioning Visa to benefit from AI-driven commerce and the growth of B2B virtual-card payments. For more information, please see our Cytonn Weekly #42/2026;
-
During the month, Mastercard launched its Global Money Platform with BVNK, integrating traditional fiat payments and stablecoin infrastructure through a single API following its acquisition of BVNK in August 2026. The platform enables banks, fintechs and enterprises to embed multi-currency accounts, real-time currency conversion, stablecoin-linked cards and local bank payouts through Mastercard Move, with Nuvei, Marqeta, Ontop, Bolt Group and Almond FinTech as initial adopters. For more information, please see our Cytonn Weekly #41/2026;
-
During the month, PayPal's Venmo announced an industry-first split-to-earn feature on the Venmo Credit Card, under which customers who open a new card from 15 October 2026 can earn up to 4.0% cash back on dining and entertainment purchases: 3.0% automatically on every eligible transaction, plus an additional 1.0% when the purchase is split with friends in the Venmo app and repaid within 30 days. The feature is aimed at deepening engagement among Venmo's more than 100 mn American users and capturing a larger share of consumer spend within PayPal's ecosystem. For more information, please see our Cytonn Weekly #40/2026;
We expect the global digital payments sector to continue shifting toward greater payment sovereignty and reduced reliance on traditional card-based networks, as governments and financial institutions prioritize control over domestic payment ecosystems. The European Central Bank's progress toward launching the Digital Euro signals a growing move toward central bank-backed payment infrastructure, which is likely to intensify competition with established private networks such as Visa Inc. and Mastercard Incorporated. However, despite these favorable long-term tailwinds, valuations remain elevated, with the companies under coverage trading at an average forward P/E of 25.1x, suggesting that much of the expected growth may already be priced in. As such, we expect near-term performance to remain sensitive to regulatory developments, execution risk, and how quickly incumbents and new entrants adapt to the changing payments landscape.
Disclaimer: The views expressed in this publication are those of the writers where particulars are not warranted. This publication, which follows Section 2 of the Capital Markets Authority Act Cap 485A, is meant for general information only and is not a warranty, representation, advice or solicitation of any nature. Readers are advised in all circumstances to seek the advice of a registered investment advisor.

- Talk to us
- Kenya
- P.O Box 20695 - 00200, Nairobi, Kenya
- Cell +254709101200
- Tel +254709101200
- WhatsApp +254741676635
- United States
- +254709101200
- DOWNLOAD OUR APP
-


- Kenya
- 8th Floor, Pinetree Plaza, Kaburu Drive, Ngong Road, Nairobi, Kenya
- USA
- Suite 1150, 1775 Eye Street NW, USA, Washington DC 20006, USA
- Investments
- High Yield
- Private Equity
- Real Estate
- Real Estate
- RiverRun Estates
- Cytonn Towers
- The Ridge
- Taraji Heights
- The Alma