
Kenya's Mortgage Market Review, & Cytonn Weekly #40.2026
By Research Team, Oct 11, 2026
Executive Summary
Fixed Income
During the week, T-bills were oversubscribed for the tenth consecutive week, with the overall subscription rate coming in at 269.2% higher than the subscription rate of 170.4% recorded the previous week. Investors’ preference for the shorter 91-day paper persisted, with the paper receiving bids worth Kshs 50.2 bn against the offered Kshs 8.0 bn, translating to a subscription rate of 627.6%, significantly higher than the subscription rate of 224.8%, recorded the previous week. The subscription rate for the 182-day paper decreased to 155.3% from 191.5% recorded the previous week, while that of the 364-day paper decreased to 96.4% from 105.9% recorded the previous week. The government accepted a total of Kshs 45.5 bn worth of bids out of Kshs 75.4 bn bids received, translating to an acceptance rate of 60.4%. The yields on the government papers were on a downward trajectory with the yields on the 182-day paper decreasing the most by 1.1 bps to 8.87% from and 8.89% recorded the previous week, while the yields on the 91 -day paper decreased by 0.8 bps to 8.76% from 8.77%. The yields on the 364-day paper decreased by 0.5 bps to remain relatively unchanged at 9.04% recorded the previous week;
During the week, the Central Bank of Kenya released the auction results for the switch treasury bonds from FXD1/2024/003, with a tenor to maturity of 0.3 years and a fixed coupon rate of 18.4% and FXD2/2013/015 with a tenor to maturity of 1.3 years and a fixed coupon rate of 11.3% to FXD1/2018/015 with tenor to maturity of 6.6 years and a fixed coupon of 12.7%. This marks the first switch involving the bond, following the switch to FXD1/2018/015. The bond was undersubscribed, with the overall subscription rate coming in at 90.8%, receiving bids worth Kshs 9.1 bn against the offered Kshs 10.0 bn. The government accepted bids worth Kshs 9.0 bn, translating to an acceptance rate of 98.7%. The weighted average yield for the accepted bids for the FXD1/2018/015 came in at 12.6%. With the Inflation rate at 6.8% as of September 2026, the real returns of the FXD1/2018/015 is 5.8%. Given the 10.0% withholding tax on the bonds, the tax equivalent yields for shorter term bonds with 15.0% withholding tax is 13.4% for the FXD1/2018/015;
During the week, Stanbic Bank released its monthly Purchasing Managers' Index (PMI), indicating that Kenya's Purchasing Managers' Index (PMI) improved by 1.6 points to 51.3 in September 2026, from 49.7 in August 2026, returning above the 50.0 no-change mark after a brief deterioration in the previous month. The latest reading matched July 2026 as the joint-fastest improvement since January, although it was slightly lower than the 51.9 recorded in September 2025, reflecting a modest recovery in private sector conditions. The improvement was primarily supported by stronger new orders, which increased for the fourth consecutive month as improved market demand, customer referrals, marketing campaigns and cash injections drove sales growth;
During the week, The Monetary Policy Committee (MPC) met on 7th October 2026 to review the outcome of its previous policy decisions and decided to maintain the Central Bank Rate (CBR) at 8.75%, unchanged from the June 2026 meeting. The decision was in line with our expectation of the MPC maintaining the CBR at 8.75%. Notably, inflation remained within the CBK preferred range of 2.5%-7.5% for the thirty- eighth consecutive month, increasing marginally by 0.2% points to 6.8% in August 2026, from 6.6% in July 2026;
Equities
During the week, the equities market was on a downward trajectory, with the NASI, NSE 10, NSE 25 and NSE 20 losing by 1.0%, 0.6%, 0.5% and 0.2%, respectively, taking their YTD performance to gains of 38.4%, 37.4%, 36.0% and 30.7%, respectively for NSE 10, NSE 20, NSE 25 and NASI respectively. The week-on-week equities market performance was mainly driven by losses recorded by large-cap stocks such as KCB Group, Safaricom and Stanbic of 3.0%, 2.2% and 1.8%, respectively. The performance was however supported by gains recorded by large-cap stocks such as NCBA, DTBK and EABL of 1.1%, 1.1% and 0.9%, respectively;
During the week, the banking sector index decreased by 0.5% to 288.3 from the 293.5 recorded the previous week. This is attributable to losses recorded by large cap stocks such as KCB, Stanbic and Equity of 3.0%, 1.8% and 1.4% respectively. The performance was however supported by gains recorded by large-cap stocks such as NCBA and DTBK both of 1.1%;
During the week, Quickmart launched an Initial Public Offer (IPO) at the Nairobi Securities Exchange (NSE) through an Offer for Sale by its sole shareholder, Sokoni Retail Kenya Limited;
Real Estate
During the week, the state department for Housing and Urban development revealed in a budgetary report that the government is facing severe revenue collection hurdles in converting completed housing units into cash flow to finance subsequent phases of its Affordable Housing Program (AHP). The Affordable Housing Board collected Kshs 212.3 mn from sold units in the financial year ended 30th June 2026, against a target of Kshs 15.3 bn, achieving only 1.4% of its projected revenue and leaving a Kshs15.1 bn shortfall. The variance stems from a reliance on rent-to-own structures and lower-than-anticipated upfront cash deposits from buyers relative to the pace of construction expenditure;
During the week, property developer International Housing Solutions (IHS) Kenya officially broke ground on a Kshs 1.8 bn residential rental development dubbed Muzi Enzi, expanding its real estate asset portfolio within Kiambu County. The project is situated inside the Tatu City mixed-use development in Ruiru and will deliver 406 apartments consisting of 238 one-bedroom and 168 two-bedroom units. Executed through the IHS Kenya Green Housing Fund, the development specifically targets the rising demand for quality, well-priced rental accommodation among corporate and industrial workers employed at Tatu City, as well as commuters working in neighboring Nairobi;
During the week, the Kenya Green Building Society (KGBS) launched the Kenya Sustainable and Resilient Built Environment Projects and Solutions Repository during the Kenya Green Building Society Conference 2026 held in Nairobi. Developed under the Building the Transition (BTT) Programme with support from the World Green Building Council, the national digital platform serves as a centralized database designed to enhance market visibility for green-certified developments, non-certified projects advancing along sustainability pathways, and low-carbon construction products across Kenya’s built economy;
During the week, Shelter Afrique Development Bank (ShafDB) opened subscriptions for CFA Francs Kshs 60.0 bn (USD 100.0 mn) sustainable housing bond targeting institutional and retail investors across the eight-member West African Economic and Monetary Union (WAEMU) region. The issuance offers dual-tranche debt instruments comprising five-year bonds yielding an annual interest rate of 6.1% and seven-year bonds yielding an annual interest rate of 6.3%, with the public offer scheduled to close on 30th October 2026. Capital raised from the regional bond sale will directly fund affordable housing developments and green building infrastructure across WAEMU member states, which currently face an estimated combined housing deficit of 3.5 mn units;
During the week, the State Department for Roads reported that new road construction by the Kenya National Highways Authority (KeNHA), Kenya Urban Roads Authority (KURA), and Kenya Rural Roads Authority (KeRRA) fell by 62.0% over the last four financial years compared to the pre-2022 period. Between FY2022/23 and FY2025/26, the three agencies constructed a combined 2,584.2 km of roads, down from 6,813 km delivered in the preceding four-year period. Average annual output dropped from 1,703 km to 646 km, hitting a low of 495 km in FY2022/23 before partially recovering to 542 km in FY2023/24, 761.25 km in FY2024/25, and 786 km in FY2025/26;
During the week, the proposed 243-kilometer Mau Summit–Malaba dual carriageway successfully cleared its initial technical, social, and environmental pre-feasibility assessment. The study, conducted jointly by Canadian consulting firm CPCS and Kenya’s Avatech Engineering, confirmed that upgrading the existing two-lane corridor into a four-lane, access-controlled tolled highway is technically viable and requires minimal land acquisition or resettlement because it falls within the existing national road right-of-way;
On the Unquoted Securities Platform Acorn D-REIT and I-REIT traded at Kshs 29.7 and Kshs 24.4 per unit, respectively, as per the last updated data on 25th September 2026. The performance represented a 48.5% and 22.0% gain for the D-REIT and I-REIT, respectively, from the Kshs 20.0 inception price. The volumes traded for the D-REIT and I-REIT came in at 13.7 mn and 46.0 mn shares, respectively. Additionally, ILAM Fahari I-REIT traded at Kshs 13.8 per share as of 25th September 2026, representing a 31.0% loss from the Kshs 20.0 inception price. The volume traded came in at 1.2 mn shares;
Digital Payments
During the week, Visa announced that it will report its fiscal fourth quarter and full-year 2026 financial results on Tuesday, October 27th , 2026 after market close, with a live webcast scheduled for 5:00 p.m. ET; the company is currently in its customary quiet period and management will not engage the investment community until the results are public, making the release the next key catalyst for Visa, which trades at a forward P/E of 24.0x;
During the week, Mastercard announced its line-up for Money 20/20 in Las Vegas from October 18th -21st, 2026, where it will showcase capabilities across agentic commerce, cybersecurity, stablecoins and commercial payments, alongside BVNK demos on digital asset and stablecoin-enabled payments; the line-up signals Mastercard's focus on building the trust and security infrastructure required to scale AI-driven and stablecoin-enabled payments;
During the week, PayPal's Venmo announced a new rewards structure for the Venmo Credit Card, allowing cardholders to earn up to 4.0% cash back on dining and entertainment purchases, made up of an automatic 3.0% plus an additional 1.0% when purchases are split with friends in the Venmo app, effective October 15th, 2026; by linking credit rewards to the peer-to-peer splitting behavior that already defines Venmo usage, PayPal is deepening engagement across its base of over 100 mn U.S. users and strengthening card monetization within its ecosystem;
During the week, Circle announced that it will report its third quarter 2026 financial results on Wednesday, November 4th, 2026, with a live webcast at 8:00 a.m. ET where management will address shareholder questions submitted in advance via the Say Technologies platform; results are likely to be closely watched as valuation remains highly sensitive to earnings delivery;
The digital payment stocks we track (AXP, Visa, Mastercard, Circle, Block, and PayPal) are currently trading at an average forward P/E of 23.8x, implying that investors continue to price in resilient earnings growth and strong digital payment adoption, although elevated operating costs and higher client incentives across legacy card networks may moderate valuation expansion in the near term;
Focus of the Week
Over the years, Kenya has grappled with a persistent housing deficit, driven by rapid population growth and high urbanization rates, with mortgage finance remaining out of reach for the majority of households. In response, the government and the financial sector have implemented different measures, including the establishment of the Kenya Mortgage Refinance Company (KMRC) to provide long-term funding to lenders, the revised Risk-Based Credit Pricing Model (RBCPM) to improve loan pricing, and a cumulative 425 bps cut in the Central Bank Rate (CBR) to 8.75% since August 2024. These measures have supported a recovery in the mortgage market, with the value of mortgage loans outstanding increasing by 10.0% to Kshs 307.2 bn in 2025, the highest growth in a decade, and banks launching single-digit fixed-rate mortgages backed by KMRC funding. However, the market remains underdeveloped, with only 30,762 mortgage accounts in the country, a net increase of 746 in 2025, and mortgages accounting for 1.7% of GDP, as low incomes, high property prices, elevated credit risk and lengthy land titling processes continue to limit access to home financing;
Investment Updates:
- Weekly Rates: Cytonn Money Market Fund closed the week at a yield of 11.03% p.a. To invest, dial *809# or download the Cytonn App from Google Play store here or from the Appstore here;
- We continue to offer Wealth Management Training every Tuesday, from 7:00 pm to 8:00 pm. The training aims to grow financial literacy among the general public. To register for any of our Wealth Management Trainings, click here; If interested in our Private Wealth Management Training for your employees or investment group, please get in touch with us through wmt@cytonn.com;
- Cytonn Asset Managers Limited (CAML) continues to offer pension products to meet the needs of both individual clients who want to save for their retirement during their working years and Institutional clients that want to contribute on behalf of their employees to help them build their retirement pot. To more about our pension schemes, kindly get in touch with us through pensions@cytonn.com;
Hospitality Updates:
- We currently have promotions for Staycations. Visit cysuites.com/offers for details or email us at sales@cysuites.com;
Money Markets, T-Bills Primary Auction:
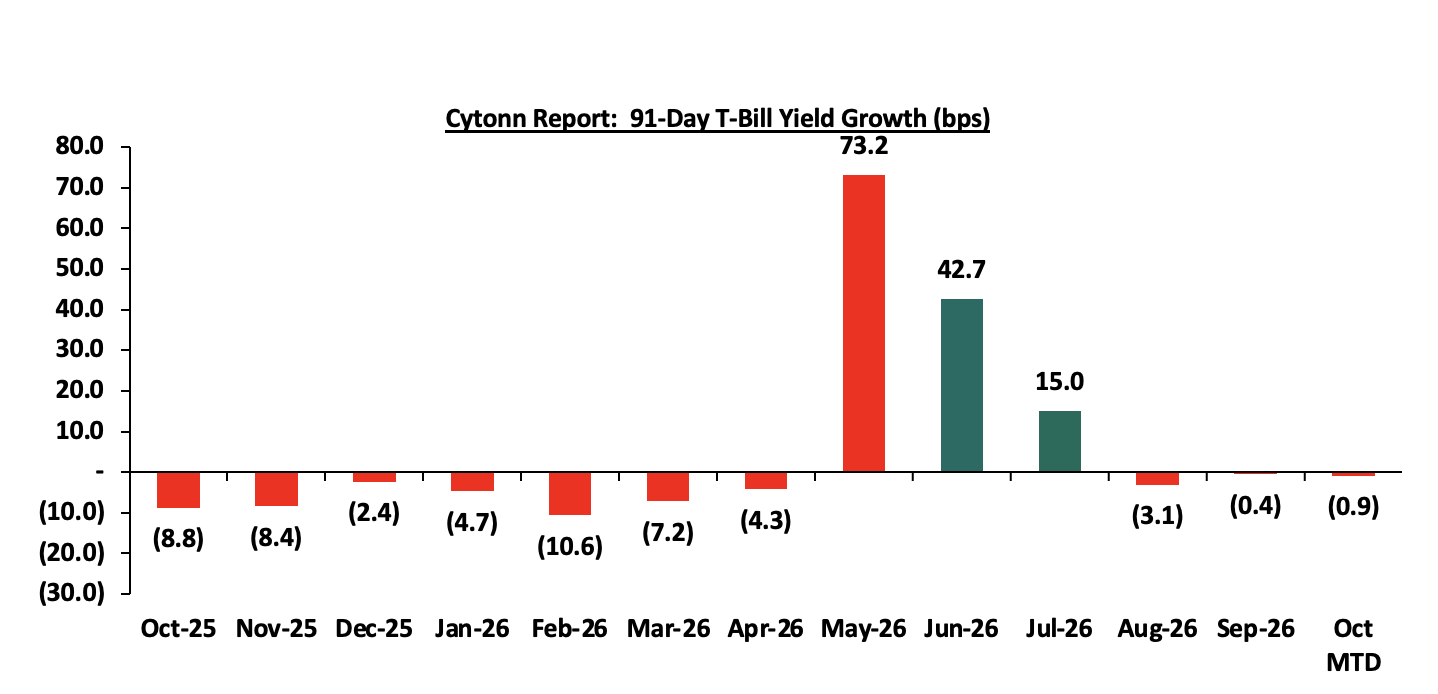
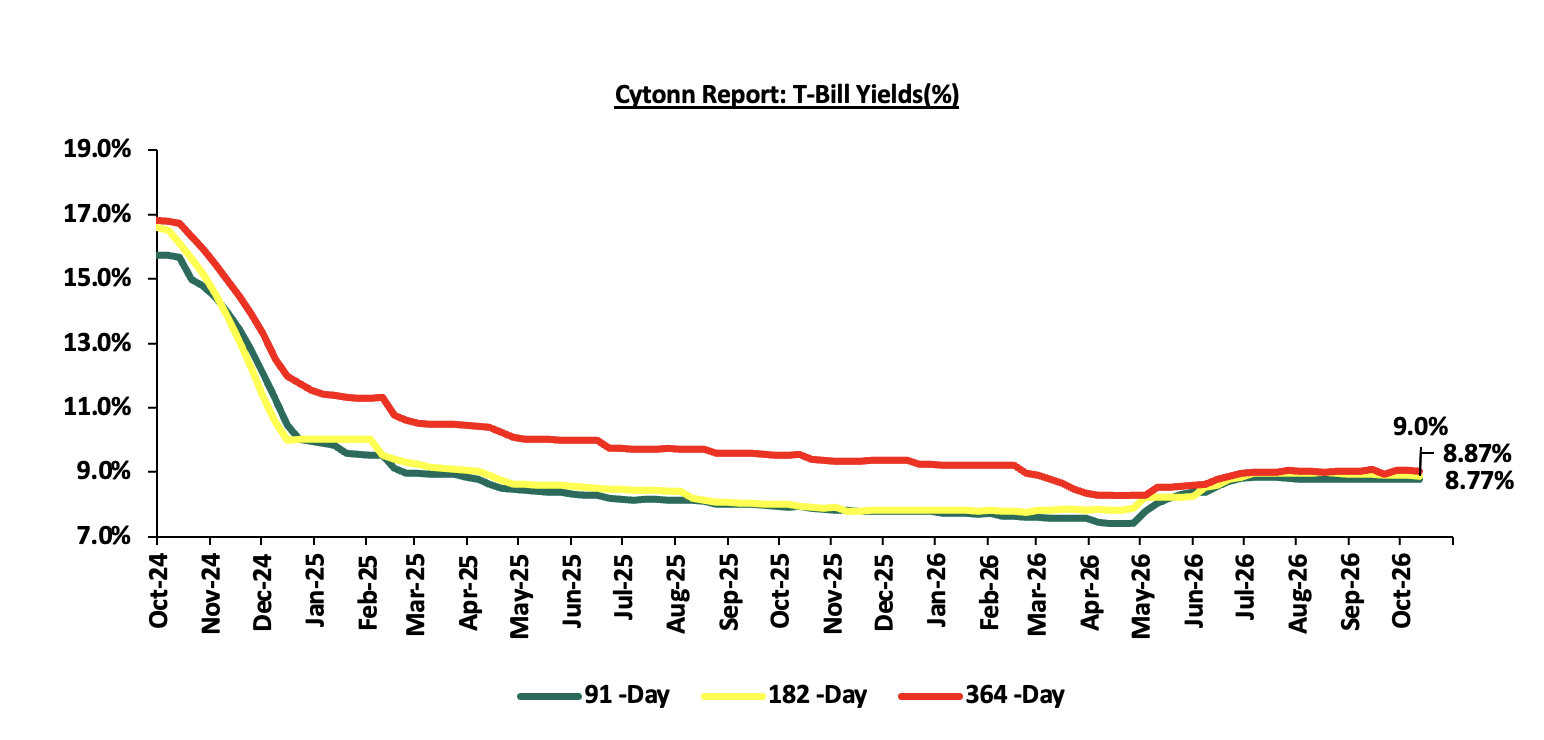
This week, T-bills were oversubscribed for the tenth consecutive week, with the overall subscription rate coming in at 269.2% higher than the subscription rate of 170.4% recorded the previous week. Investors’ preference for the shorter 91-day paper persisted, with the paper receiving bids worth Kshs 50.2 bn against the offered Kshs 8.0 bn, translating to a subscription rate of 627.6% significantly higher than the subscription rate of 224.8%, recorded the previous week. The subscription rate for the 182-day paper decreased to 155.3% from 191.5% recorded the previous week, while that of the 364-day paper decreased to 96.4% from 105.9% recorded the previous week. The government accepted a total of Kshs 45.5 bn worth of bids out of Kshs 75.4 bn bids received, translating to an acceptance rate of 60.4%. The yields on the government papers were on a downward trajectory with the yields on the 182-day paper decreasing the most by 1.1 bps to 8.87% from and 8.89%, while the yields on the 91 -day paper decreased by 0.8 bps to 8.76% from 8.77%. The yields on the 364-day paper decreased by 0.5 bps to remain relatively unchanged at 9.04% recorded the previous week.
The chart below shows the yield growth rate for the 91-day paper from October 2025 to date:
The chart below shows the performance of the 91-day, 182-day and 364-day papers from October 2024 to October 2026:
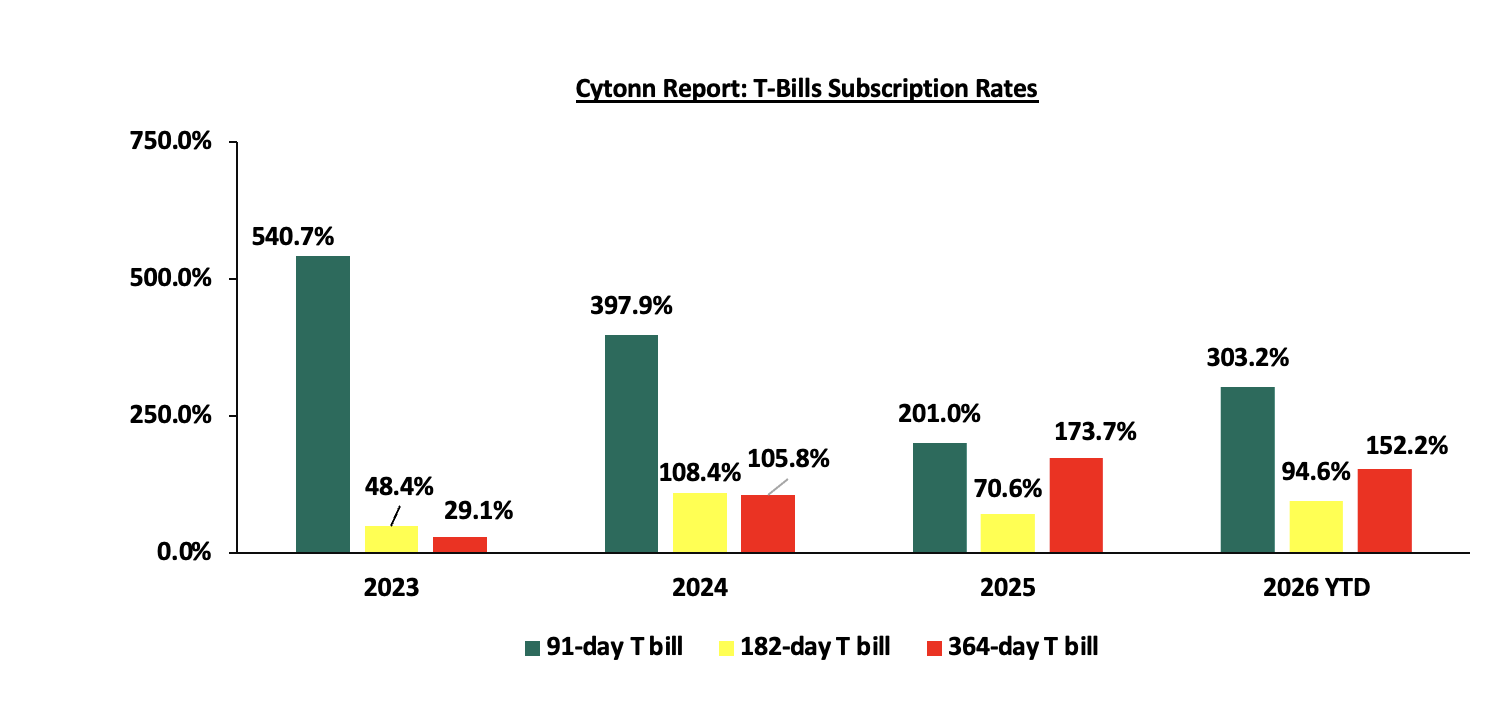
The chart below compares the overall average T-bill subscription rates obtained in 2023, 2024, 2025 and 2026 Year-to-date (YTD):
T-Bonds Primary Market:
During the week, the Central Bank of Kenya released the auction results for the switch treasury bonds from FXD1/2024/003, with a tenor to maturity of 0.3 years and a fixed coupon rate of 18.4% and FXD2/2013/015 with a tenor to maturity of 1.3 years and a fixed coupon rate of 11.3% to FXD1/2018/015 with tenor to maturity of 6.6 years and a fixed coupon of 12.7%. This marks the first switch involving the bond, following the switch to FXD1/2018/015. The bond was undersubscribed, with the overall subscription rate coming in at 90.8%, receiving bids worth Kshs 9.1 bn against the offered Kshs 10.0 bn. The government accepted bids worth Kshs 9.0 bn, translating to an acceptance rate of 98.7%. The weighted average yield for the accepted bids for the FXD1/2018/015 came in at 12.6%. With the Inflation rate at 6.8% as of September 2026, the real returns of the FXD1/2018/015 is 5.8%. Given the 10.0% withholding tax on the bonds, the tax equivalent yields for shorter term bonds with 15.0% withholding tax is 13.4% for the FXD1/2018/015.
Money Market Performance:
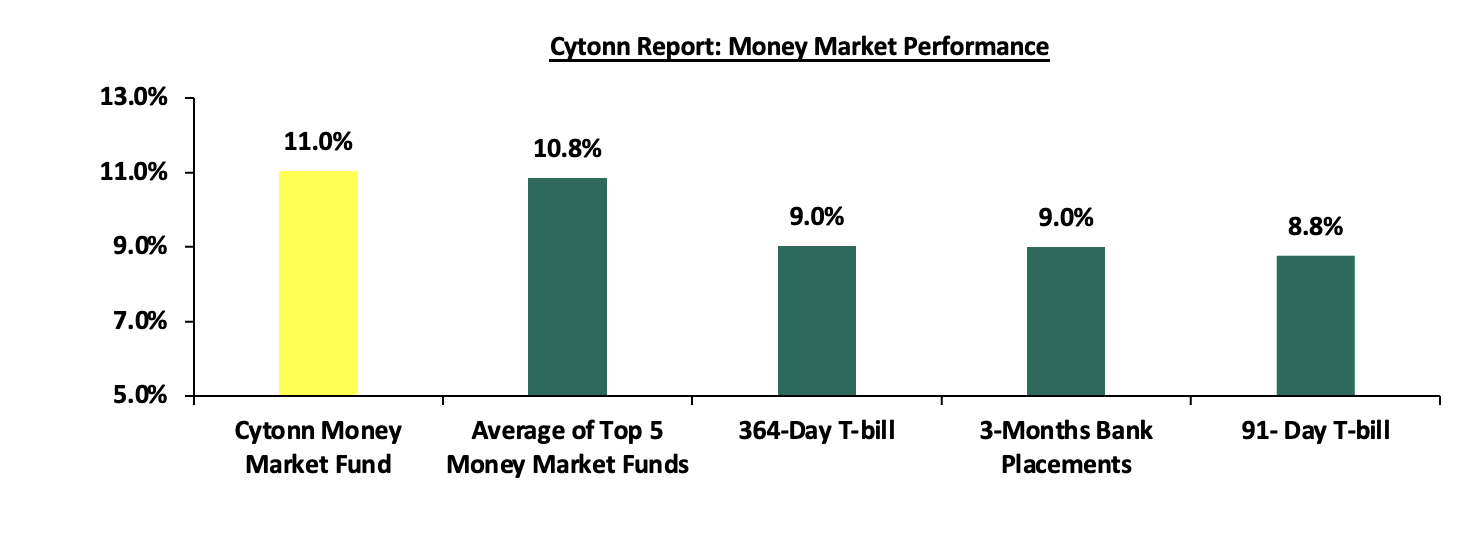
In the money markets, 3-month bank placements ended the week at 9.0% (based on rates offered by various banks). The yields on the government papers were on a downward trajectory with the yields on the 182-day paper decreasing the most by 1.1 bps to 8.87% from and 8.89%, while the yields on the 91-day paper decreased by 0.8 bps to 8.76% from 8.77%. The yields on the 364-day paper decreased by 0.5 bps to remain relatively unchanged at 9.04% recorded the previous week. The yield on the Cytonn Money Market Fund increased by 3.0 bps to 11.03% from the 11.0% recorded the previous week, while the average yields on Top 5 Money Market Funds increased by 7.2 bps to 10.84% from 10.77% recorded the previous week
The table below shows the Money Market Fund Yields for Kenyan Fund Managers as published on 9th October 2026
|
Money Market Fund Yield for Fund Managers as published on 9th October 2026 |
||
|
Rank |
Fund Manager |
Effective Annual Rate |
|
1 |
Cytonn Money Market Fund (Dial *809# or download Cytonn App) |
11.0% |
|
2 |
Orient Kasha Money Market Fund |
10.9% |
|
3 |
Nabo Africa Money Market Fund |
10.9% |
|
4 |
Faulu Money Market Fund |
10.8% |
|
5 |
Arvocap Money Market Fund |
10.6% |
|
6 |
Lofty-Corban Money Market Fund |
10.5% |
|
7 |
Madison Money Market Fund |
10.5% |
|
8 |
Ndovu Money Market Fund |
10.5% |
|
9 |
Enwealth Money Market Fund |
10.4% |
|
10 |
Globetec Money Market Fund |
10.4% |
|
11 |
Old Mutual Money Market Fund |
10.3% |
|
12 |
Rejesha Money Market Fund |
10.3% |
|
13 |
Kuza Money Market fund |
10.3% |
|
14 |
Jubilee Money Market Fund |
10.2% |
|
15 |
Etica Money Market Fund |
10.2% |
|
16 |
Gulfcap Money Market Fund |
10.1% |
|
17 |
British-American Money Market Fund |
9.8% |
|
18 |
Apollo Money Market Fund |
9.6% |
|
19 |
SanlamAllianz Money Market Fund |
9.5% |
|
20 |
GenAfrica Money Market Fund |
9.3% |
|
21 |
KCB Money Market Fund |
9.3% |
|
22 |
Dry Associates Money Market Fund |
9.2% |
|
23 |
Genghis Money Market Fund |
8.9% |
|
24 |
CIC Money Market Fund |
8.4% |
|
25 |
CPF Money Market Fund |
8.4% |
|
26 |
AA Kenya Shillings Fund |
8.2% |
|
27 |
Mayfair Money Market Fund |
8.2% |
|
28 |
Co-op Money Market Fund |
8.1% |
|
29 |
Mali Money Market Fund |
8.0% |
|
30 |
ICEA Lion Money Market Fund |
7.7% |
|
31 |
Absa Shilling Money Market Fund |
7.0% |
|
32 |
Ziidi Money Market Fund |
6.1% |
|
33 |
Equity Money Market Fund |
5.4% |
|
34 |
Stanbic Money Market Fund |
5.3% |
Source: Business Daily
Liquidity:
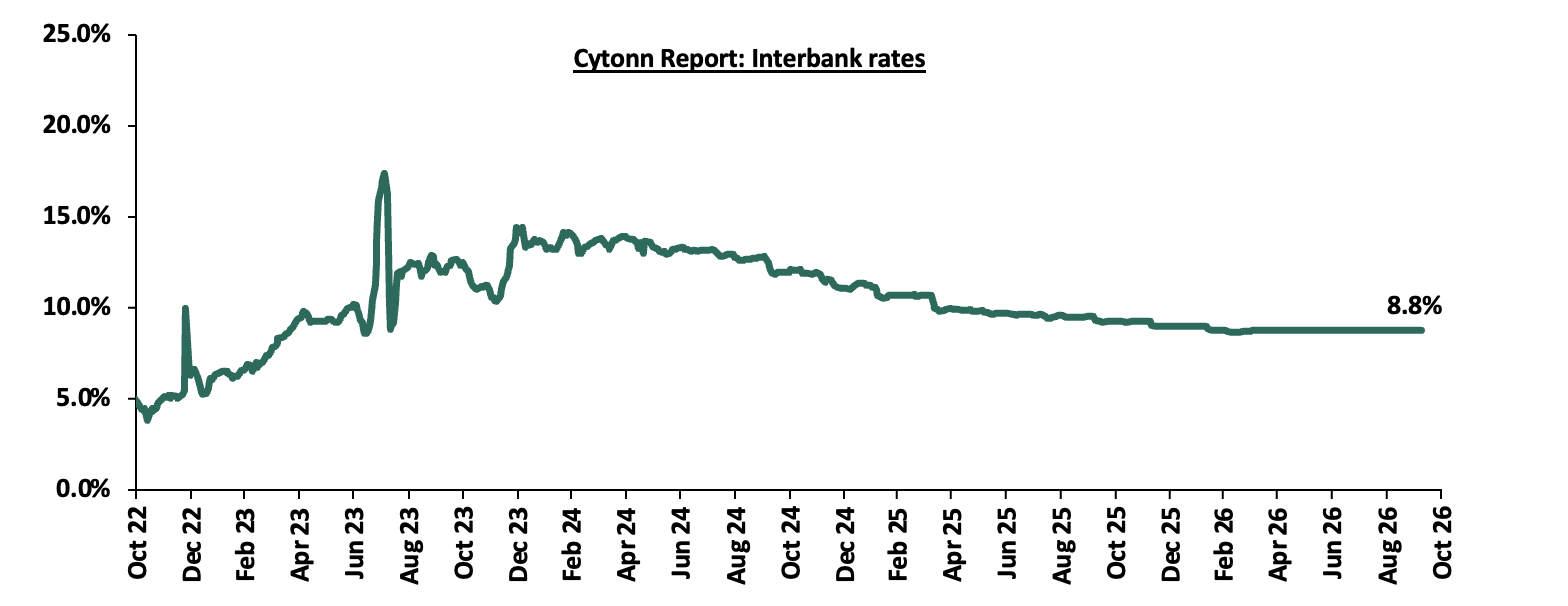
During the week, liquidity in the money markets tightened with the average interbank rate increasing marginally by 0.2 bps to remain relatively unchanged at 8.8% recorded the previous week, partly attributable government payments that offset tax remittances. The average interbank volumes traded decreased by 38.1% to Kshs 5.9 bn from Kshs 9.5 bn recorded the previous week. The chart below shows the interbank rates in the market over the years:
Kenya Eurobonds:
During the week, the yields on the Eurobonds recorded a mixed performance with the yields on the 10 -year issue decreasing the most by 28.8 bps to 7.3% from 7.6% recorded the previous week. However, this was supported by the 13-year issue increasing the most by 10.3 bps to 9.3% from 9.2% recorded the previous week. The table below shows the summary performance of the Kenyan Eurobonds as of 9th October 2026:
|
Cytonn Report: Kenya Eurobonds Performance |
||||||
|
|
2018 |
2019 |
2021 |
2024 |
||
|
Tenor |
10-year issue |
30-year issue |
12-year issue |
13-year issue |
7-year issue |
|
|
Amount Issued (USD) |
1.0 bn |
1.0 bn |
1.0 bn |
1.5 bn |
1.5 bn |
|
|
Years to Maturity |
2.5 |
22.5 |
8.8 |
5.5 |
10.5 |
|
|
Yields at Issue |
7.3% |
8.3% |
6.2% |
10.4% |
9.9% |
|
|
02-Jan-26 |
6.1% |
8.8% |
7.2% |
7.8% |
7.1% |
|
|
01-Oct-26 |
7.6% |
9.8% |
8.8% |
9.2% |
8.3% |
|
|
02-Oct-26 |
7.5% |
9.7% |
8.7% |
9.1% |
8.1% |
|
|
05-Oct-26 |
7.5% |
9.8% |
8.7% |
9.2% |
8.2% |
|
|
06-Oct-26 |
7.2% |
9.6% |
8.4% |
9.0% |
7.9% |
|
|
07-Oct-26 |
7.4% |
9.7% |
8.7% |
9.2% |
8.1% |
|
|
08-Oct-26 |
7.3% |
9.8% |
8.7% |
9.3% |
8.1% |
|
|
Weekly Change |
(0.3%) |
0.0% |
(0.0%) |
0.1% |
(0.2%) |
|
|
MTD Change |
(0.3%) |
0.0% |
(0.0%) |
0.1% |
(0.2%) |
|
|
YTD Change |
1.3% |
1.0% |
1.6% |
1.5% |
1.0% |
|
Source: Central Bank of Kenya (CBK) and National Treasury
Kenya Shilling:
During the week, the Kenya Shilling depreciated marginally against the US Dollar by 11.6 bps to 129.9 from 129.8 recorded the previous week. On a year-to-date basis, the shilling has depreciated by 66.6 bps against the dollar, as compared to the 22.9 bps appreciation recorded in 2025.
We expect the shilling to be supported by:
- Diaspora remittances standing at a cumulative USD 5,012.7 mn in the twelve months to August 2026, slightly lower than the USD 5,078.8 mn recorded over the same period in 2025. These have continued to cushion the shilling against further depreciation. In the August 2026 diaspora remittances figures, North America remained the largest source of remittances to Kenya accounting for 50.3% in the period,
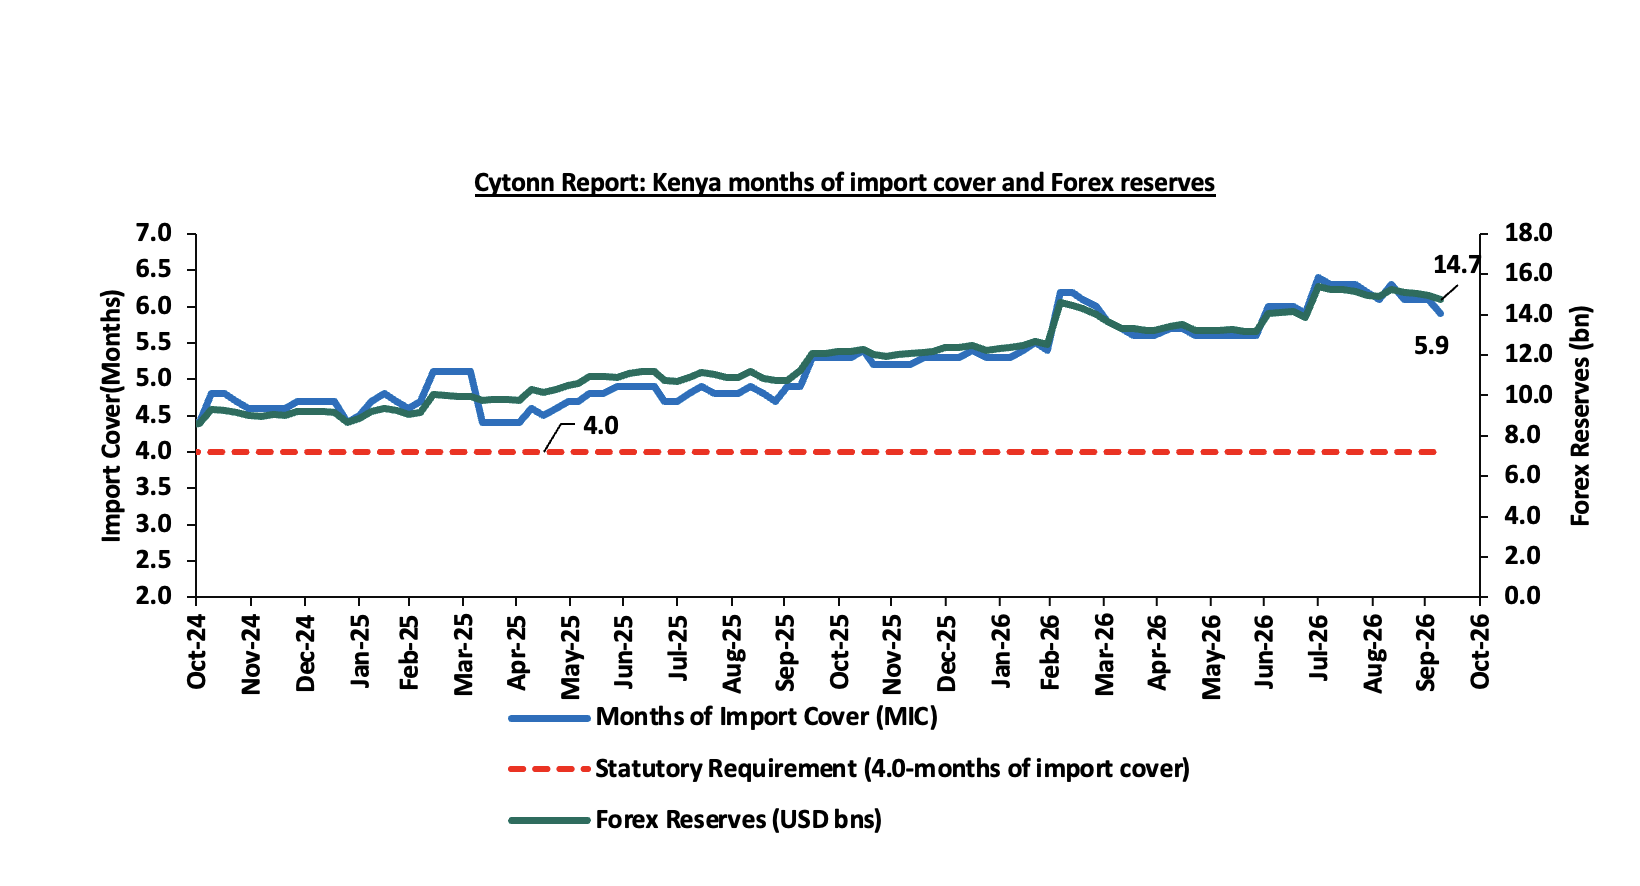
- Improved forex reserves currently at USD 14.7 bn (equivalent to 5.9-months of import cover), which is above the statutory requirement of maintaining at least 4.0-months of import cover and above the EAC region’s convergence criteria of 4.5-months of import cover.
The shilling is however expected to remain under pressure in 2026 as a result of:
- An ever-present current account deficit which widened to 3.1% of GDP in the 12 months to August 2026 compared to 2.1% of GDP in a similar period in 2025 and,
- The need for government debt servicing, continues to put pressure on forex reserves given that 54.7% of Kenya’s external debt is US Dollar-denominated as of July 2026.
- Rising geopolitical tensions in the Middle East, which could exert pressure on the shilling through higher global oil prices and increased uncertainty in international markets. Given that Kenya is a net importer of petroleum products, any sustained increase in oil prices would widen the import bill, increase demand for US Dollars, and consequently put depreciation pressure on the shilling
Kenya's forex reserves decreased by 1.3% during the week to USD 14.7bn, from USD 14.9 bn recorded the previous week, equivalent to 5.9 months of import cover, and above the statutory requirement of maintaining at least 4.0-months of import cover. The chart below summarizes the evolution of Kenya's months of import cover over from September 2024 to September 2026:
Weekly Highlights
- Stanbic Bank’s September 2026 Purchasing Manager’s Index (PMI)
Stanbic Bank released its monthly Purchasing Managers' Index (PMI), indicating that Kenya's Purchasing Managers' Index (PMI) improved by 1.6 points to 51.3 in September 2026, from 49.7 in August 2026, returning above the 50.0 no-change mark after a brief deterioration in the previous month. The latest reading matched July 2026 as the joint-fastest improvement since January, although it was slightly lower than the 51.9 recorded in September 2025, reflecting a modest recovery in private sector conditions. The improvement was primarily supported by stronger new orders, which increased for the fourth consecutive month as improved market demand, customer referrals, marketing campaigns and cash injections drove sales growth. However, this improvement in demand did not translate into higher output, which contracted for the seventh consecutive month, albeit at the softest pace in the current sequence, reflecting inflationary pressures, material shortages and cutbacks linked to shortages of agricultural goods. Purchasing activity returned to growth after a four-month contraction, supporting the first rise in input inventories since June, while employment continued to increase on the back of rising workloads. Inflationary pressures ticked higher, with around 30% of firms reporting higher input costs driven by fuel, transport and agricultural products. Key to note, a PMI reading of above 50.0 indicates an improvement in business conditions, while readings below 50.0 indicate a deterioration. The chart below shows Kenya's Purchasing Managers' Index for the last 24 months: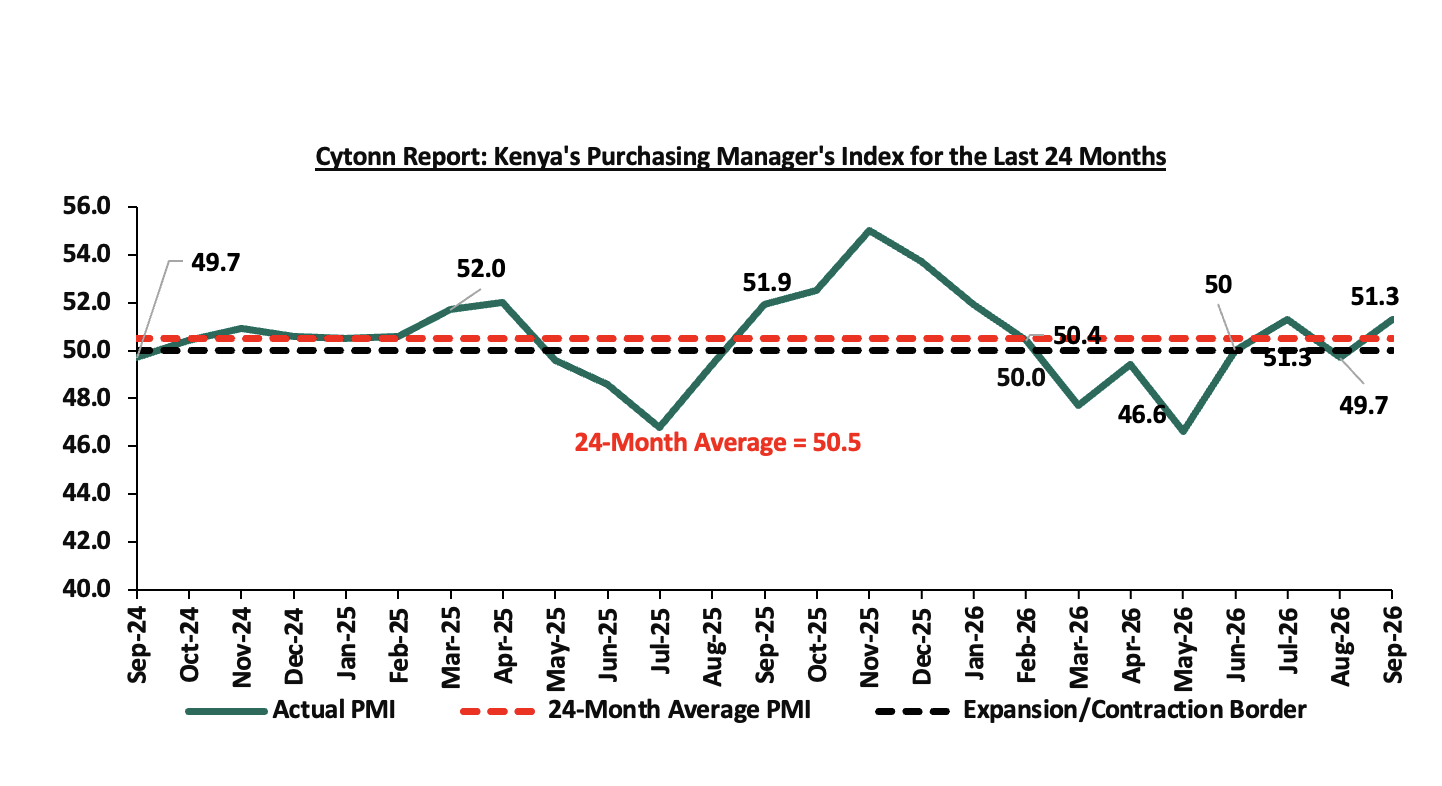
Going forward, the September PMI suggests that Kenya's private sector is experiencing a demand-led improvement rather than a broad-based recovery in activity, with manufacturing, construction and services expanding while agriculture, wholesale and retail remained under pressure. The near-term outlook is cautiously positive, supported by continued growth in new orders, hiring and renewed inventory accumulation, while business activity expectations slipped to a four-month low but remained among the strongest seen in over five years. However, the pace of expansion is likely to remain modest as higher fuel, transport and agricultural input costs, alongside material shortages, continue to limit firms' ability to convert sales into production and are increasingly being passed on to consumers through higher prices. Sustained expansion will therefore depend on an easing of cost pressures and improved input availability; otherwise, growth may remain modest and increasingly inflationary.
- October 2026 Monetary Policy Committee (MPC) Meeting Highlight
The Monetary Policy Committee (MPC) met on 7th October 2026 to review the outcome of its previous policy decisions and decided to maintain the Central Bank Rate (CBR) at 8.75%, unchanged from the June 2026 meeting. The decision was in line with our expectation of the MPC maintaining the CBR at 8.75%. Notably, inflation remained within the CBK preferred range of 2.5%-7.5% for the thirty- eighth consecutive month, increasing marginally by 0.2% points to 6.8% in August 2026, from 6.6% in July 2026. Below are some of the key highlights from the October 2026 meeting:
- Overall inflation remained within the CBK target range of 2.5%-7.5% in September 2026, increasing by 0.2% points to 6.8% from 6.6% in August 2026. Core inflation increased by 0.6% points to 4.0% from 3.4%, driven mainly by higher prices of processed food items, particularly milk, wheat products and edible oils. In contrast, non-core inflation declined by 0.7% points to 14.0% from 14.7%, supported by lower vegetable and energy price inflation. Government interventions, including subsidies and the temporary reduction of VAT on fuel, continued to mitigate inflationary pressures. Overall inflation is expected to remain within the target range in the near term, supported by appropriate monetary policy actions, government interventions and exchange rate stability. However, elevated global oil prices remain an important upside risk to the inflation outlook.
- The Kenyan economy is projected to grow by 5.0% in 2026, an upward revision from the previous 4.9% projection and an acceleration from 4.6% in 2025. The upward revision mainly reflects stronger performance in the industry and services sectors, while the 2027 growth projection remains unchanged at 5.3%. The growth outlook remains supported by macroeconomic stability, resilient services activity and stronger industrial performance. However, prolonged geopolitical tensions, elevated trade policy uncertainties and the potential adverse effects of the El Niño weather phenomenon pose downside risks to economic activity.
- The current account deficit is estimated at 3.1% of GDP in the 12 months to August 2026, compared to 2.1% of GDP in a similar period in 2025, reflecting a wider trade deficit and lower secondary income transfers. Goods exports increased by 11.8%, supported mainly by horticulture, tea, and machinery and transport equipment, while goods imports increased by 15.8%, driven by higher imports of food, mineral fuels, and intermediate and capital goods. Services receipts increased by 8.7%, mainly due to higher travel services receipts, while diaspora remittances declined by 1.3%. The current account deficit is projected at 3.2% of GDP in 2026, compared to 2.1% in 2025, mainly reflecting higher mineral fuel imports following elevated international oil prices and lower remittances. The deficit is expected to be more than fully financed by financial and capital account inflows, resulting in an overall balance of payments surplus of USD 2.4 bn in 2026. CBK foreign exchange reserves stood at USD 14.7 bn, equivalent to 5.9 months of import cover, providing an adequate buffer against short-term domestic and external shocks.
- The banking sector remains stable and resilient, supported by strong liquidity and capital adequacy ratios. The ratio of gross non-performing loans (NPLs) to gross loans declined to 13.9% in September 2026, from 14.8% in June 2026 and 17.6% in August 2025, indicating continued improvement in asset quality. Declines in NPLs were recorded in the financial services, agriculture, trade, and energy and water sectors. Banks have continued to maintain adequate provisions against NPLs, supporting the resilience of the banking sector despite persistent credit and macroeconomic risks.
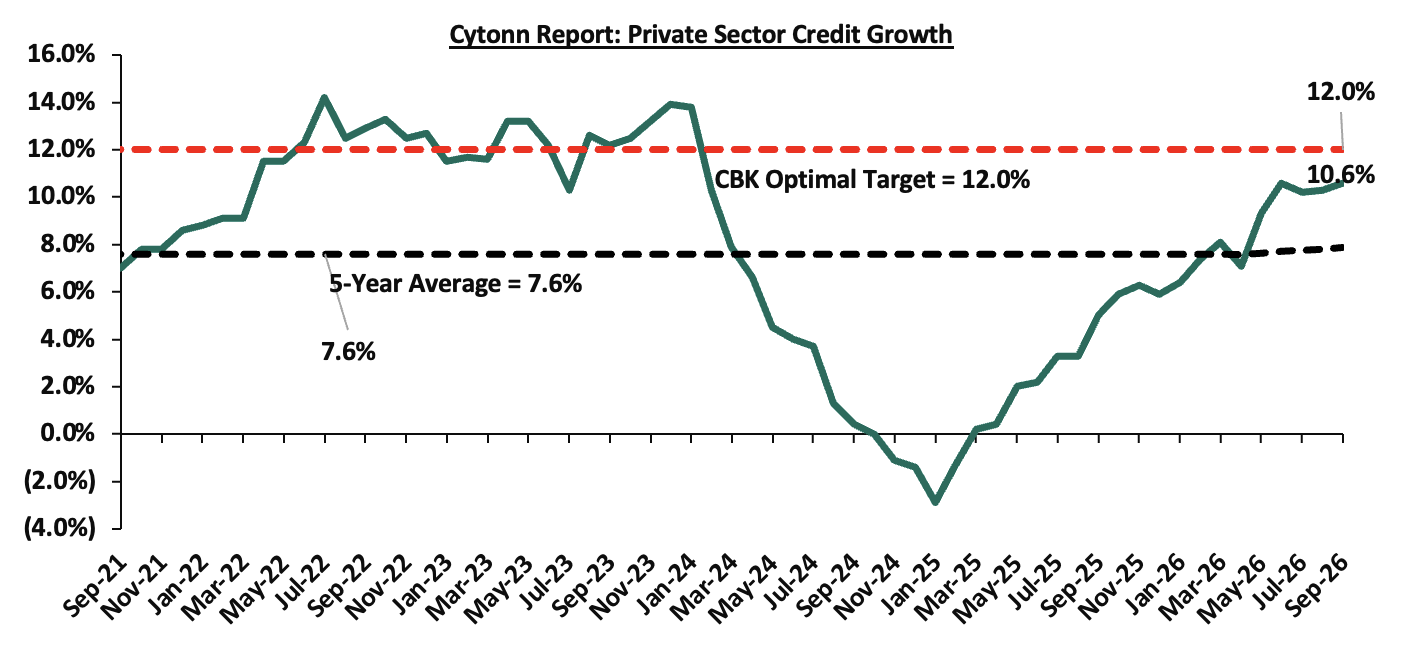
- Growth in commercial banks’ lending to the private sector increased to 10.6% in September 2026, from 10.3% in August 2026 and representing a significant recovery from 2.9% contraction recorded in January 2025. Credit growth remained strong across key sectors, particularly trade, building and construction, agriculture, finance and insurance, and consumer durables, reflecting improved demand for credit. However, average commercial banks’ lending rates increased marginally to 14.4% in September 2026 from 14.3% in August, although they remained substantially below the 17.2% recorded in November 2024. The sustained recovery in private-sector credit growth indicates that the easing in lending conditions continues to support domestic economic activity.
- The CEOs Survey and Market Perceptions Survey conducted in September 2026 indicated sustained optimism regarding business activity and economic growth prospects over the next 12 months. Respondents attributed the positive outlook to continued macroeconomic stability, increased Government infrastructure spending, greater digital innovation and improved private-sector credit growth arising from lower bank lending rates. However, businesses remained concerned about elevated energy costs associated with the conflict in the Middle East and potential disruptions arising from the expected El Niño rains.
- A majority of respondents to the September 2026 Agriculture Sector Survey expect moderate upward pressure on inflation risks, particularly from elevated fuel prices resulting from the conflict in the Middle East. Nevertheless, respondents expect inflation to remain within the CBK target range in the near term, supported by exchange rate stability and an anticipated decline in food prices following forecasts of above-average rainfall between October and December 2026. The outlook therefore remains sensitive to developments in international oil prices and weather conditions.
- Global growth is projected to moderate in 2026, primarily due to higher energy prices associated with the conflict in the Middle East. Elevated trade policy uncertainty and the Russia-Ukraine conflict remain additional risks to global economic activity. Global inflation is also expected to increase in 2026, mainly due to higher energy and food prices. Inflation in most major economies has increased in recent months and remains above respective targets, reflecting higher energy prices and persistent core inflation. Central banks have therefore maintained a cautious policy stance, with some implementing modest rate increases while others have maintained existing policy rates as they assess the effects of the Middle East conflict on inflation and growth.
- The Committee noted the ongoing implementation of the FY2026/27 Government Budget and the planned fiscal consolidation strategy aimed at reducing debt vulnerabilities over the medium term. The continued focus on fiscal consolidation is important for containing fiscal risks, strengthening macroeconomic stability and supporting investor confidence, particularly against the backdrop of elevated public debt and external financing requirements.
The MPC maintained the Central Bank Rate (CBR) at 8.75%, concluding that the existing monetary policy stance remains appropriate to anchor inflation expectations within the 2.5%-7.5% target range and support exchange rate stability. The Committee will continue monitoring global oil prices and potential second-round effects on domestic inflation, alongside developments in the global and domestic economies. Going forward, we expect the MPC to maintain a cautious monetary policy stance, balancing the need to contain inflationary pressures and preserve exchange rate stability against the objective of supporting private-sector credit growth and economic activity. The elevated global oil price environment, geopolitical tensions and weather-related risks will remain key considerations for future policy decisions. The next MPC meeting is scheduled for December 2026.
Rates in the fixed income market have declined MTD, reversing the recent upward trend. The decline comes despite the CBK's decision to pause its rate-cutting cycle at 8.75%, with inflation remaining elevated at 6.8% but within the CBK's target range of 2.5%-7.5%. The government is 231.1% ahead of its prorated net domestic borrowing target of Kshs 260.1 bn, having a net borrowing position of Kshs 601.2 bn (inclusive of T-bills). We expect investors to maintain a preference for short to medium-term papers as they monitor the pace of government issuance and the path of inflation before committing further out on the curve, with the yield curve likely to remain under upward pressure rather than stabilize, at least until the inflation trajectory becomes clearer.
Market Performance:
During the week, the equities market was on a downward trajectory, with the NASI, NSE 10, NSE 25 and NSE 20 losing by 0.1%, 0.6%, 0.5% and 0.2%, respectively, taking their YTD performance to gains of 38.4%, 37.4%, 36.0% and 30.7%, respectively for NSE 10, NSE 20, NSE 25 and NASI respectively. The week-on-week equities market performance was mainly driven by losses recorded by large-cap stocks such as KCB Group, Safaricom and Stanbic of 3.0%, 2.2% and 1.8%, respectively. The performance was however supported by gains recorded by large-cap stocks such as NCBA, DTBK and EABL of 1.1%, 1.1% and 0.9%, respectively.;
During the week, the banking sector index decreased by 0.5% to 288.3 from the 293.5 recorded the previous week. This is attributable to losses recorded by large cap stocks such as KCB, Stanbic and Equity of 3.0%, 1.8% and 1.4% respectively. The performance was however supported by gains recorded by large-cap stocks such as NCBA and DTBK both of 1.1%.
During the week, equities turnover decreased by 14.3% to USD 15.0 mn from USD 17.5 mn recorded the previous week, taking the YTD total turnover to USD 3,068.1 mn. Foreign investors became net sellers for the first time in three weeks with a net selling position of USD 5.7 mn, from a net buying position of USD 1.2 mn recorded the previous week, taking the YTD foreign net selling position to USD 171.8 mn, compared to a net selling position of USD 92.9 mn recorded in 2025.
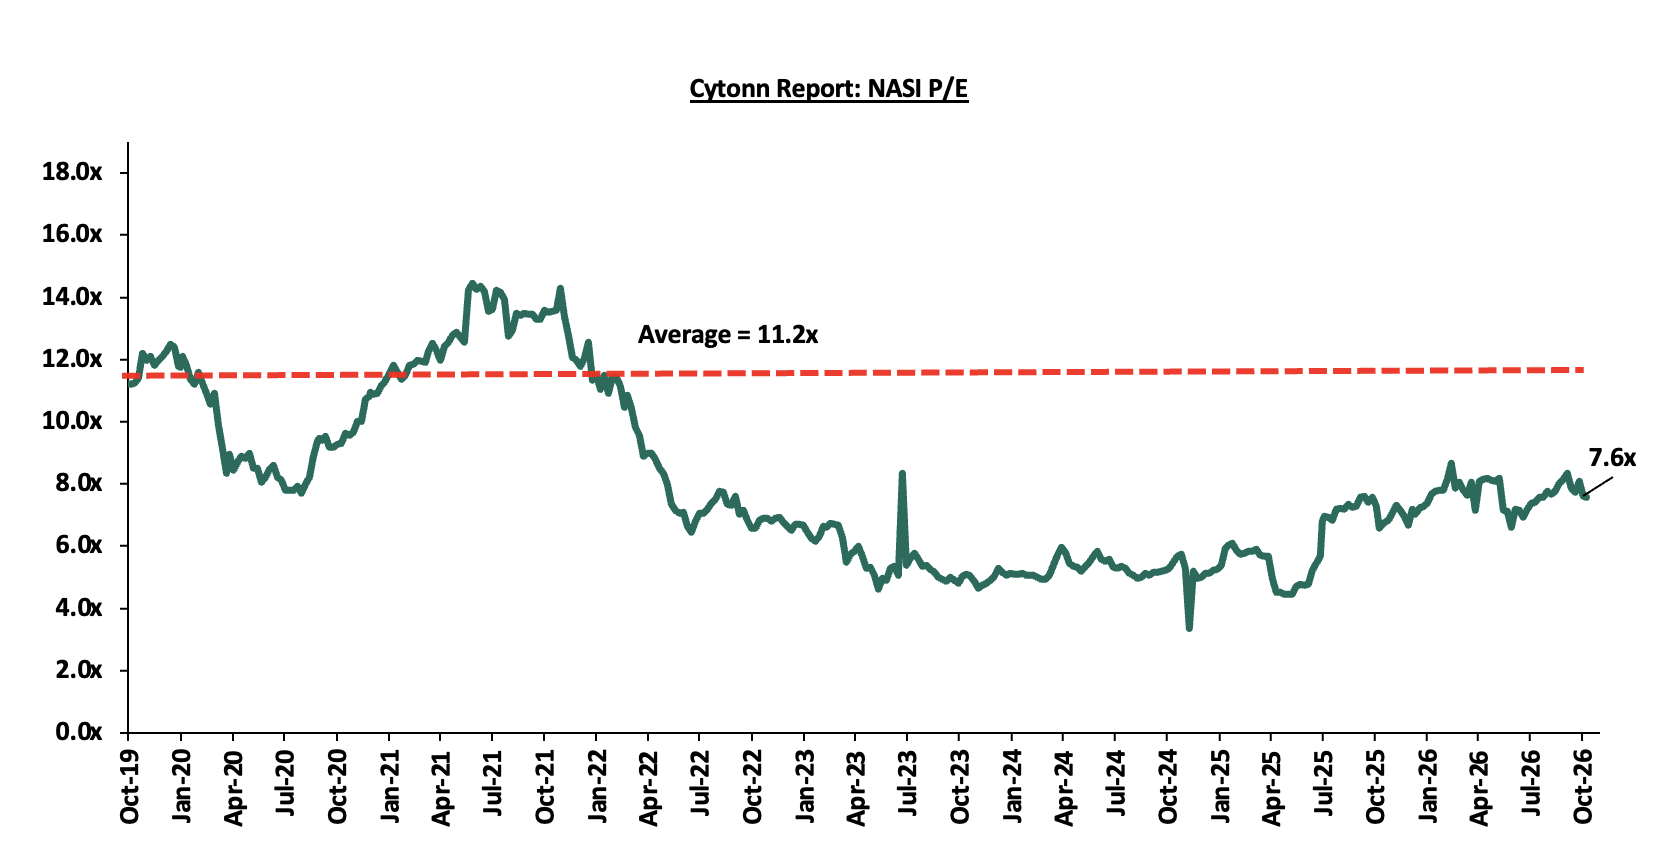
The market is currently trading at a price to earnings ratio (P/E) of 7.6x, 31.9% below the historical average of 11.2x, and a dividend yield of 5.8%, 1.0% points above the historical average of 4.8%. Key to note, NASI’s PEG ratio currently stands at 0.9x, an indication that the market is slightly undervalued relative to its future growth. A PEG ratio greater than 1.0x indicates the market may be overvalued while a PEG ratio less than 1.0x indicates that the market is undervalued.
The charts below indicate the historical P/E and dividend yields of the market: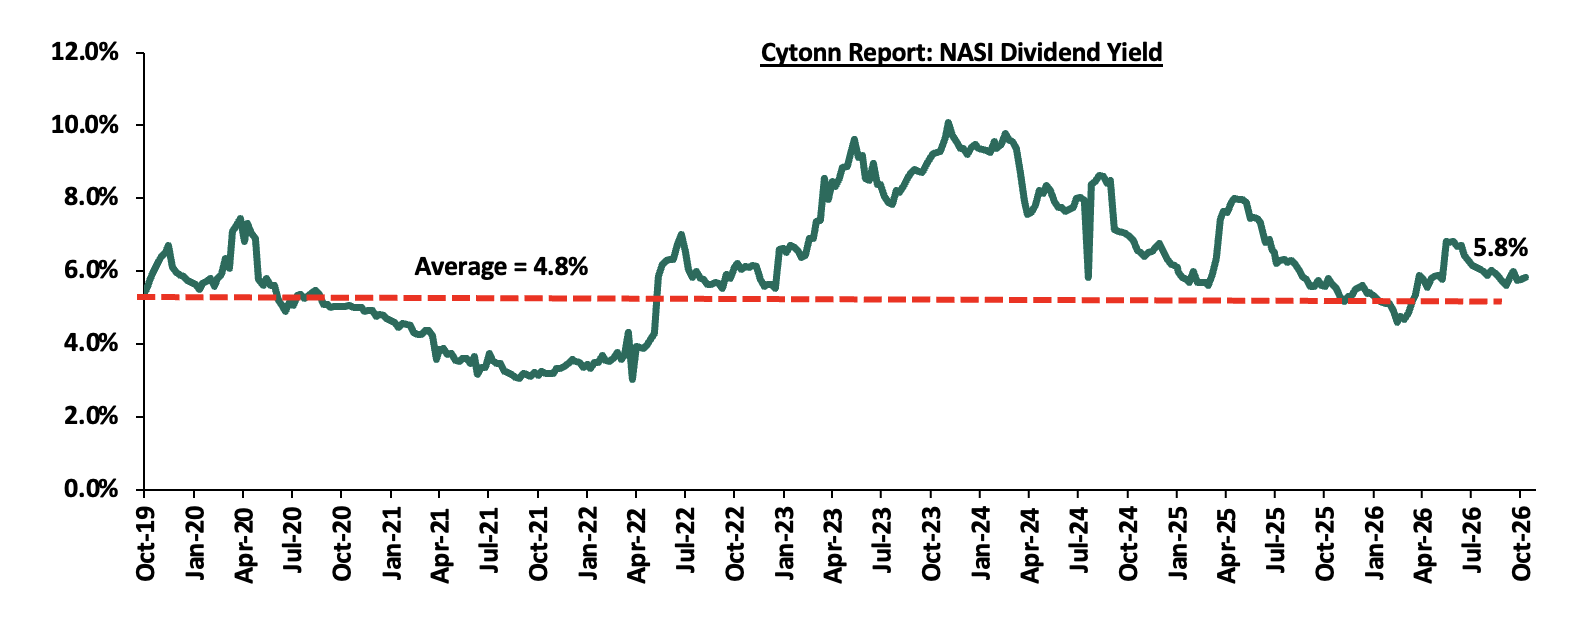
Universe of Coverage:
|
Cytonn Report: Equities Universe of Coverage |
|||||||||||
|
Company |
Price as at 02/10/2026 |
Price as at 09/10/2027 |
w/w change |
m/m change |
YTD Change |
Year Open 2026 |
Target Price* |
Dividend Yield |
Upside/ Downside** |
P/TBv Multiple |
Recommendation |
|
Co-op Bank |
37.1 |
37.0 |
(0.3%) |
(0.4%) |
54.6% |
23.9 |
46.1 |
6.8% |
31.5% |
1.4x |
Buy |
|
NCBA |
87.8 |
88.8 |
1.1% |
(0.3%) |
4.4% |
85.0 |
108.9 |
8.0% |
30.8% |
1.2x |
Buy |
|
KCB Group |
92.5 |
89.8 |
(3.0%) |
(1.6%) |
36.5% |
65.8 |
104.4 |
7.8% |
24.1% |
0.9x |
Buy |
|
Family Bank |
28.7 |
28.0 |
(2.4%) |
(3.3%) |
55.6% |
18.0 |
32.5 |
4.3% |
20.4% |
1.5x |
Buy |
|
Standard Chartered Bank |
319.5 |
318.3 |
(0.4%) |
0.3% |
6.2% |
299.8 |
345.8 |
9.7% |
18.4% |
2.0x |
Accumulate |
|
ABSA Bank |
33.1 |
33.1 |
0.0% |
(0.3%) |
33.0% |
24.9 |
36.8 |
6.2% |
17.7% |
1.8x |
Accumulate |
|
Stanbic Holdings |
280.5 |
275.5 |
(1.8%) |
(2.3%) |
39.3% |
197.8 |
300.3 |
8.1% |
17.1% |
1.6x |
Accumulate |
|
Equity Group |
105.5 |
104.0 |
(1.4%) |
(0.7%) |
55.2% |
67.0 |
113.5 |
5.5% |
14.7% |
1.4x |
Accumulate |
|
Diamond Trust Bank |
189.0 |
191.0 |
1.1% |
1.1% |
66.4% |
114.8 |
199.5 |
4.7% |
9.2% |
0.5x |
Hold |
|
Jubilee Holdings |
399.0 |
402.8 |
0.9% |
0.7% |
24.9% |
322.5 |
420.5 |
3.7% |
8.1% |
0.6x |
Hold |
|
I&M Group |
82.5 |
87.5 |
6.1% |
6.1% |
104.4% |
42.8 |
90.4 |
4.3% |
7.6% |
1.4x |
Hold |
|
Britam |
18.7 |
18.2 |
(2.4%) |
(3.2%) |
100.9% |
9.1 |
18.5 |
0.0% |
1.4% |
1.4x |
Lighten |
|
CIC Group |
5.1 |
5.1 |
1.2% |
3.4% |
12.8% |
4.5 |
5.0 |
2.5% |
(0.6%) |
1.3x |
Sell |
|
*Target Price as per Cytonn Analyst estimates **Upside/ (Downside) is adjusted for Dividend Yield ***Dividend Yield is calculated using FY’2025 Dividends |
|||||||||||
Weekly highlights
- Quickmart Plc Initial Public Offer (IPO)
During the week, Quickmart Plc launched an Initial Public Offer (IPO) at the Nairobi Securities Exchange (NSE) through an Offer for Sale by its sole shareholder, Sokoni Retail Kenya Limited. The listing is the second IPO at the NSE in 2026, following Kenya Pipeline Company (KPC), and the first private-sector, private equity-backed IPO in Kenya in over a decade. Quickmart is Kenya’s second-largest modern grocery retailer, with an estimated 15.0% market share behind Naivas at 31.0% and ahead of Carrefour at 14.0%, and operates 72 stores across 16 counties. The IPO gives investors direct exposure to the consumer and modern grocery retail sector, which has lacked a listed pure-play supermarket since the decline of Uchumi Supermarkets.
The offer involves the sale of a 50.0% stake, equivalent to 2.0 bn shares, at a fixed offer price of Kshs 7.50 per share, targeting gross proceeds of Kshs 15.0 bn and implying a market capitalisation of Kshs 30.0 bn. The shares will be listed on the NSE Main Investment Market Segment, with the offer running from 5th October 2026 to 30th October 2026 and trading expected to commence on 12th November 2026, as shown in the table below:
|
Cytonn Report: Summary of Key Details of the Quickmart IPO |
|
|
Item |
Details |
|
Offer Type |
Offer for Sale |
|
Shares on Offer |
2,000,000,000 |
|
Percentage Offered |
50.0% |
|
Offer Price per share |
Kshs 7.50 |
|
Expected Gross Proceeds |
Kshs 15.0 bn |
|
Implied Market Capitalisation |
Kshs 30.0 bn |
|
Listing Segment |
NSE Main Investment Market Segment |
|
Offer period |
5th October 2026 – 30th October 2026 |
|
Commencement of trading at NSE |
12th November 2026 |
Source: Quickmart IPO Information Memorandum
As an Offer for Sale, all Kshs 15.0 bn of proceeds will accrue to Sokoni Retail Kenya Limited, with no funds raised by Quickmart, making the IPO a partial exit for Adenia Partners’ funds (effective economic interest of about 48.6%) and the founding shareholders after roughly seven years of Adenia’s involvement. Sokoni will retain a 50.0% stake, but its 24-month lock-up covers only 60.0% of the retained shares (1.2 bn shares, or 30.0% of Quickmart); the remaining 0.8 bn shares, or 20.0% of the company, can be sold at any time after listing and present a potential supply overhang. The offer is conditional on a 75.0% minimum subscription, and the International Finance Corporation (IFC) has conditionally committed about Kshs 1.9 bn as cornerstone investor (13.0% of the offer and 6.45% of the company), subject to its board approval. A cornerstone investor is a large investor that commits to buy a fixed portion of an offer upfront, anchoring demand and signalling confidence to other investors. Kenyan institutional investors are allocated 35.0% of the offer, Kenyan retail and foreign investors 20.0% each, IFC 13.0% and EAC investors 12.0%.
Quickmart has grown quickly, with revenue rising at a 4-year CAGR of 18.4% to Kshs 50.4 bn in FY’2025 (up 8.0% y/y) and profit after tax rising 32.9% to Kshs 1.5 bn. H1’2026 revenue was Kshs 27.3 bn and profit after tax Kshs 0.9 bn. Dividend payouts have exceeded 100.0% of earnings in every year since FY’2023 (109.2% in FY’2025), alongside a Kshs 1.1 bn shareholder advance in H1’2026 equal to 126.0% of half-year profit. This has kept shareholders’ funds at between Kshs 1.1 bn and Kshs 1.9 bn, inflating ROE to 134.1% and P/B to 28.4x. After listing, the company intends to pay out at least about 80.0% of annual profit after tax, semi-annually.
At the offer price, Quickmart trades at a P/E of 12.9x based on projected 2026 earnings and an EV/EBITDA of 5.7x, based on projected 2026 EBITDA, with an FY’2025 dividend yield of 5.5% and an implied dividend yield of 6.7% based on 2026 projections. While the valuation multiples are relatively attractive compared to its listed peers, the investment case remains dependent on the delivery of projected earnings. We therefore recommend the IPO as a SUBSCRIBE for medium- to long-term, income-oriented investors comfortable with execution risk, while value-focused and short-term investors should exercise caution.
For more information kindly see our Quickmart IPO Note
We maintain a “cautiously optimistic” short-term outlook supported primarily earnings-led attractive valuations, despite heightened geopolitical risks such as Iran war that may weigh on investor sentiment, and, “neutral” in the long term as persistent foreign investor outflows continue to constrain market liquidity and limit broad-based market re-rating. With the market currently trading at a discount to its future growth (PEG Ratio at 0.9x), where performance will be driven by company-specific fundamentals rather than general market direction, we believe that investors should reposition towards value stocks exhibiting strong earnings growth, attractive dividend yields, solid balance sheets, sustainable competitive advantages and trading at compelling discounts to their intrinsic value. While foreign investor sell-offs are expected to continue exerting pressure in the near term, we believe this will create selective entry opportunities for long-term investors
- Residential Sector
- Rent-to-Own option traps Kshs 15.1 bn in affordable housing revenue
During the week, the state department for Housing and Urban development revealed in a budgetary report that the government is facing severe revenue collection hurdles in converting completed housing units into cash flow to finance subsequent phases of its Affordable Housing Program (AHP). The Affordable Housing Board collected Kshs 212.3 mn from sold units in the financial year ended 30th June 2026, against a target of Kshs 15.3 bn, achieving only 1.4% of its projected revenue and leaving a Kshs15.1 bn shortfall. The variance stems from a reliance on rent-to-own structures and lower-than-anticipated upfront cash deposits from buyers relative to the pace of construction expenditure.
The Kshs 15.1 bn cash flow deficit raises operational questions regarding the State’s strategy to fund future housing construction using sales proceeds from completed projects rather than relying predominantly on statutory housing levy receipts. While physical construction progress continues across various project sites, such as the 955-unit Starehe Affordable Housing Project, the slow conversion of completed inventory into immediate capital creates a financing mismatch between ongoing project liabilities and actual revenue realization.
Going forward, the liquidity shortfall under the rent-to-own collection model creates pipeline and execution risks for subsequent phases of the AHP. Unless upfront financing structures, mortgage end-user off-take arrangements, or capital recycling mechanisms are restructured, delayed revenue realization will force greater reliance on public debt or levy collections to bridge the funding gap, potentially extending overall delivery schedules for planned housing stock.
- Developer expands portfolio with Kshs 1.8 bn Kiambu project
During the week, property developer International Housing Solutions (IHS) Kenya officially broke ground on a Kshs 1.8 bn residential rental development dubbed Muzi Enzi, expanding its real estate asset portfolio within Kiambu County. The project is situated inside the Tatu City mixed-use development in Ruiru and will deliver 406 apartments consisting of 238 one-bedroom and 168 two-bedroom units. Executed through the IHS Kenya Green Housing Fund, the development specifically targets the rising demand for quality, well-priced rental accommodation among corporate and industrial workers employed at Tatu City, as well as commuters working in neighboring Nairobi.
The project aligns with strong demand dynamics across Kiambu County’s satellite hubs. According to IHS Kenya, Tatu City currently houses over 7,000 residents with an overall daily population exceeding 35,000, growing at an estimated rate of 40% annually. Residential demand in Ruiru is supported by proximity to major commercial/industrial employers and improved accessibility via the expanded road infrastructure network. Industry metrics from the 2025 Hass Consult House Price Index show that house prices in satellite towns were buoyed by rising rents, with Ruiru recording a price appreciation of up to 15.6%. Additionally, IHS Kenya has executed other green developments in the region, including Muzi Salama, a 240-unit green affordable housing project comprising two- and three-bedroom apartments located within the Tilisi Masterplan Development in Limuru.
Going forward, sustained population expansion and commercial activity within master-planned hubs like Tatu City and Tilisi will continue to drive demand for institutional-grade rental housing stock. However, project success will depend on maintaining competitive rental yields against rising land acquisition and construction costs in satellite hubs. Consequently, while the addition of 406 units expands the private rental pipeline, overall market absorption will be governed by tenant affordability and the delivery of supporting urban infrastructure.
- Kenya launches green building hub to power sustainable projects
During the week, the Kenya Green Building Society (KGBS) launched the Kenya Sustainable and Resilient Built Environment Projects and Solutions Repository during the Kenya Green Building Society Conference 2026 held in Nairobi. Developed under the Building the Transition (BTT) Programme with support from the World Green Building Council, the national digital platform serves as a centralized database designed to enhance market visibility for green-certified developments, non-certified projects advancing along sustainability pathways, and low-carbon construction products across Kenya’s built economy.
The repository aggregates project-level performance data, including investment valuations, embodied carbon reductions, energy and water conservation metrics, renewable energy capacity, and job creation, to connect developers and technical partners with financial institutions and institutional capital. Initial roll-out covers primary urban and secondary markets across Nairobi, Mombasa, Kisumu, Lamu, and Laikipia counties. Conference deliberations highlighted the integration of verified building performance metrics into sustainable finance frameworks, mortgage products, development-finance instruments, and carbon-efficient materials procurement such as low-carbon cement and bio-based timber.
Going forward, the deployment of a centralized sustainability repository is expected to reduce information asymmetry for ESG-oriented investors and lower capital costs for certified green developments. However, market-wide impact will depend on developer adoption rates, standardized disclosure metrics, and the capacity of local banking institutions to scale specialized green mortgage products to absorb the sustainable real estate pipeline.
- Shelter Afrique launches FCFA Kshs 60.0 bn sustainable housing bond
During the week, Shelter Afrique Development Bank (SADb) opened subscriptions for a FCFA Kshs 60.0 bn (USD 100.0 mn) sustainable housing bond targeting institutional and retail investors across the eight-member West African Economic and Monetary Union (WAEMU) region. The issuance offers dual-tranche debt instruments comprising five-year bonds yielding an annual interest rate of 6.1% and seven-year bonds yielding an annual interest rate of 6.3%, with the public offer scheduled to close on 30th October 2026. Capital raised from the regional bond sale will directly fund affordable housing developments and green building infrastructure across WAEMU member states, which currently face an estimated combined housing deficit of 3.5 million units.
The bond issuance represents a pivotal step in expanding capital market-based intervention mechanisms for real estate development across sub-Saharan Africa. By tapping WAEMU's regional capital market, SADb utilizes local-currency debt financing to mitigate foreign exchange risks for long-term housing projects while establishing benchmark yield curves for green and sustainable real estate debt instruments in West Africa.
Going forward, the successful subscription and deployment of the FCFA 60.0 bn capital pool will boost developer access to long-term funding, accelerate housing project delivery, and catalyze sustainable construction standards across the WAEMU region. However, long-term market absorption and urban housing delivery will depend on local bank participation in end-user mortgage provision and the alignment of national land-titling frameworks to enable off-take for completed housing stock.
- Infrastructure
- Road construction slows 62.0% as funding squeeze hits projects
During the week, the State Department for Roads reported that new road construction by the Kenya National Highways Authority (KeNHA), Kenya Urban Roads Authority (KURA), and Kenya Rural Roads Authority (KeRRA) fell by 62.0% over the last four financial years compared to the pre-2022 period. Between FY2022/23 and FY2025/26, the three agencies constructed a combined 2,584.2 km of roads, down from 6,813 km delivered in the preceding four-year period. Average annual output dropped from 1,703 km to 646 km, hitting a low of 495 km in FY2022/23 before partially recovering to 542 km in FY2023/24, 761.25 km in FY2024/25, and 786 km in FY2025/26.
Despite an increase in the Road Maintenance Levy Fund (RMLF) from Kshs 18.0 to Kshs 25.0 per liter of fuel in July 2024, state road projects remain constrained by a historical debt burden. In April 2025, Kshs 7.0 of every Kshs 25.0 collected was securitized to back Kshs 75.0 bn in bank financing to settle unpaid contractor bills. In November 2025, Cabinet approved committing a further Kshs 5.0 per liter (bringing total committed revenue to Kshs 12.0 per liter) to enable the Kenya Roads Board to raise additional capital. Furthermore, the government announced plans to list an RMLF securitization bond on the Nairobi Securities Exchange (NSE) to refinance bank loans used to clear pending bills accumulated up to December 2024. Routine road maintenance saw modest gains, expanding 18.5% from 26,255.65 km to 31,105.6 km in the latest financial year, though remaining 24.1% below the 40,988.0 km maintained in June 2022.
Going forward, while the securitization of RMLF receipts and proposed NSE bond listing provide liquidity to settle contractor arrears and revive stalled projects, debt-service obligations will restrict discretionary capital for new road corridors. Consequently, primary infrastructure growth will remain concentrated on maintenance and targeted arterial upgrades rather than expansive network additions in the short to medium term.
- Mau Summit–Malaba dual road plan passes first test
During the week, the proposed 243-kilometer Mau Summit–Malaba dual carriageway successfully cleared its initial technical, social, and environmental pre-feasibility assessment. The study, conducted jointly by Canadian consulting firm CPCS and Kenya’s Avatech Engineering, confirmed that upgrading the existing two-lane corridor into a four-lane, access-controlled tolled highway is technically viable and requires minimal land acquisition or resettlement because it falls within the existing national road right-of-way.
The successful pre-feasibility finding paves the way for a detailed feasibility study to establish final project development costs, traffic volume projections, toll tariff structures, and the overall Public-Private Partnership (PPP) transaction framework. The Mau Summit–Malaba highway forms a vital section of the Northern Corridor linking landlocked East African nations (such as Uganda) to the Port of Mombasa, and is designed to complement the upstream Kshs 170.0 bn Rironi–Mau Summit dual highway project.
Going forward, the progression of the Mau Summit– Malaba toll road under a PPP framework represents a strategic shift toward off-balance-sheet infrastructure financing. If successfully structured and awarded, the project will reduce transit bottlenecks along the Northern Corridor, lower regional freight costs, and stimulate industrial, logistics, and roadside commercial real estate development along the Western Kenya transit corridor.
- Real Estate Investment Trusts (REITs)
On the Unquoted Securities Platform Acorn D-REIT and I-REIT traded at Kshs 29.7 and Kshs 24.4 per unit, respectively, as per the last updated data on 25th September 2026. The performance represented a 48.5% and 22.0% gain for the D-REIT and I-REIT, respectively, from the Kshs 20.0 inception price. The volumes traded for the D-REIT and I-REIT came in at 13.7 mn and 46.0 mn shares, respectively. Additionally, ILAM Fahari I-REIT traded at Kshs 13.8 per share as of 25th September 2026, representing a 31.0% loss from the Kshs 20.0 inception price. The volume traded came in at 1.2 mn shares. REITs offer various benefits, such as tax exemptions, diversified portfolios, and stable long-term profits. However, the ongoing decline in the performance of Kenyan REITs and the restructuring of their business portfolios are hindering significant previous investments. Additional general challenges include:
- Insufficient understanding of the investment instrument among investors leading to a slower uptake of REIT products,
- Lengthy approval processes for REIT creation,
- High minimum capital requirements of Kshs 100.0 mn for REIT trustees compared to Kshs 10.0 mn for pension funds Trustees, essentially limiting the licensed REIT Trustee to banks only,
- The rigidity of choice between either a D-REIT or I-REIT forces managers to form two REITs, rather than having one Hybrid REIT that can allocate between development and income earning properties
- Limiting the type of legal entity that can form a REIT to only a trust company, as opposed to allowing other entities such as partnerships, and companies,
- We need to give time before REITs are required to list – they would be allowed to stay private for a few years before the requirement to list given that not all companies may be comfortable with listing on day one, and,
- Minimum subscription amounts or offer parcels set at Kshs 0.1 mn for D-REITs and Kshs 5.0 mn for restricted I-REITs. The significant capital requirements still make REITs relatively inaccessible to smaller retail investors compared to other investment vehicles like unit trusts or government bonds, all of which continue to limit the performance of Kenyan REITs.
We expect Kenya’s Real Estate sector to remain on a growth trend, supported by: i) demand for housing sustained by positive demographics, such as urbanization and population growth rates of 2.9% p.a and 1.9% p.a, respectively, against the global average of 1.4% p.a and 0.9% p.a, respectively, as at 2025, ii) the AHP rent-to-own collection shortfall (Kshs 15.1 bn) as a risk, iii) Muzi enzi/ Private rental supply in Kiambu, iv) the shelter Afrique bond and the green building repository as financing and ESG support, v) the Mau Summit- Malaba PPP and roads funding constraints, and v) weak investor appetite for REITS.
- Visa Schedules Fiscal Q4 and Full-Year 2026 Earnings Release
During the week, Visa Inc. announced that it will release its fiscal fourth quarter and full-year 2026 financial results on Tuesday, October 27th, 2026 after market close, furnishing the results to the U.S. Securities and Exchange Commission and posting them on its Investor Relations website. Management will host a live audio webcast at 2:00 p.m. Pacific Time (5:00 p.m. Eastern Time), with a replay available for 30 days, while the company remains in its customary quiet period during which executives will not interact with the investment community until the results are public. The announcement sets the timeline for the next major information event for Visa shareholders; with the stock trading at a forward P/E of 24.0x, the results will be a key test of whether Visa can sustain the earnings growth implied by its valuation and, as a sector bellwether, could also influence sentiment toward Mastercard and the other digital payments stocks we track.
- Mastercard Showcases Agentic Commerce, Cybersecurity and Stablecoin Capabilities at Money 20/20
During the week, Mastercard announced its line-up for Money 20/20, to be held at The Venetian Resort in Las Vegas from October 18th -21st , 2026, where it will showcase demos across agentic commerce, cybersecurity, stablecoins and commercial payments at Booth #13049, while BVNK will demonstrate Mastercard's expanding digital asset and stablecoin-enabled payment capabilities at Booth #9113. The agenda includes sessions on the guardrails and trust layer required for AI agent-driven transactions, stablecoin security and trust featuring Mastercard and BVNK executives, wallet interoperability for cross-border experiences, and digital asset wallets as a global payout network. The line-up signals that Mastercard is prioritizing the trust, security and risk infrastructure needed to scale AI-driven and stablecoin-enabled payments, and its joint presence with BVNK points to an effort to extend its network into digital assets; this could strengthen Mastercard's positioning as agentic commerce and stablecoin payments move toward mainstream adoption.
- PayPal's Venmo Introduces Split-to-Earn Rewards on Its Credit Card
During the week, PayPal's Venmo announced an industry-first split-to-earn feature as part of a new rewards structure for the Venmo Credit Card, under which customers who open a new card from October 15th, 2026 can earn up to 4.0% cash back on dining and entertainment purchases: 3.0% automatically on every eligible transaction, plus an additional 1.0% when the purchase is split with friends in the Venmo app and repaid within 30 days. Cardholders also earn 3.0% when paying with Venmo at checkout, to small businesses and for eligible peer-to-peer purchases, and 1.0% on all other purchases, with cash back deposited daily into the Venmo account, no annual fee, no foreign transaction fees, and the option to auto-purchase cryptocurrency with cash back at no transaction fee. The card is issued by Synchrony on the Visa network, and Venmo serves more than 100 mn Americans. By tying credit rewards to the peer-to-peer splitting behavior that already defines Venmo usage, PayPal is positioned to deepen engagement, lift card adoption and capture a larger share of consumer spend within its ecosystem; however, the higher reward rates could weigh on margins, while Visa stands to benefit from additional transaction volume on its network.
- Circle Schedules Q3 2026 Earnings Release
During the week, Circle Internet Group, Inc. announced that it will report its third quarter 2026 financial results on Wednesday, November 4th, 2026, with a live video webcast at 8:00 a.m. ET on its official YouTube and X channels, where management will address a selection of shareholder questions submitted in advance via the Say Technologies Q&A platform, which opens on October 28, 2026 at 9:00 a.m. ET and closes on November 3rd, 2026 at 9:00 a.m. ET. A replay and transcript will be available on Circle's investor relations website. The release will give investors an update on Circle's operating performance; with Circle trading at a forward P/E of 74.6x, the results and management's responses to shareholder questions are likely to be a key driver of sentiment, as valuation remains highly sensitive to earnings delivery.
- Digital Payments Stock Performance
The table below presents a snapshot of NYSE-listed digital payments stocks, covering Visa, Mastercard, American Express (AXP), Wise Plc, Block and PayPal:
|
Cytonn Report: Digital Payments NYSE and LSE stock perfomance |
|
|||||
|
Company |
Year Open 2026 |
Price 10/03/2026 |
Price 10/09/2026 |
w/w change |
YTD change |
Forward P/E |
|
American Express |
372.7 |
302.8 |
308.2 |
1.8% |
(17.3%) |
15.1 x |
|
Visa |
346.5 |
360.7 |
385.5 |
6.9% |
11.2% |
24.0 x |
|
Mastercard |
563.1 |
552.3 |
589.1 |
6.7% |
4.6% |
24.2x |
|
Circle |
83.5 |
81.3 |
84.5 |
4.0% |
1.2% |
74.6x |
|
Block |
65.2 |
74.3 |
77.2 |
3.9% |
18.6% |
14.5x |
|
Paypal Holdings |
58.1 |
52.8 |
55.5 |
5.2% |
(4.5%) |
9.1x |
|
Global Payments Inc |
77.0 |
78.4 |
82.2 |
4.9% |
6.7% |
5.3x |
|
Average |
|
|
|
|
|
23.8x |
Source: Visa, AXP, Circle, Mastercard, Block and PayPal financials, NYSE, PE* calculated using FY’2025 audited financials
The stocks are currently trading at an average forward P/E multiple of 23.8x, indicating that investors are pricing in strong future earnings growth and are prepared to pay a substantial premium for current earnings. This also suggests that valuations may be stretched relative to near-term fundamentals.
We expect the global digital payments sector to continue shifting toward greater payment sovereignty and reduced reliance on traditional card-based networks, as governments and financial institutions prioritize control over domestic payment ecosystems. The European Central Bank's progress toward launching the Digital Euro signals a growing move toward central bank-backed payment infrastructure, which is likely to intensify competition with established private networks such as Visa Inc. and Mastercard Incorporated. However, despite these favorable long-term tailwinds, valuations remain elevated, with the companies under coverage trading at an average forward P/E of 23.8x, suggesting that much of the expected growth may already be priced in. As such, we expect near-term performance to remain sensitive to regulatory developments, execution risk, and how quickly incumbents and new entrants adapt to the changing payments landscape.
Kenya has one of the most developed banking sectors in Sub-Saharan Africa, with banking sector assets of Kshs 8.4 tn, equivalent to 47.5% of GDP, and one of the most advanced digital finance ecosystems globally. Yet its mortgage market remains among the shallowest on the continent relative to the size of the economy. As per the latest Bank Supervision Annual Report 2025 by the Central Bank of Kenya (CBK), there were only 30,762 mortgage loan accounts in the market as at December 2025, with an outstanding value of Kshs 307.2 bn, against customer deposits of Kshs 6.1 tn. Mortgages therefore account for only 7.1% of the banking sector's gross loan book of Kshs 4.4 tn, and 1.7% of the country's nominal GDP of Kshs 17.6 tn in 2025, as per the Economic Survey 2026. In urban areas, homeownership declined to 23% in 2024 from 30.0% in 2013, and in Nairobi only 7.7% of households own the homes they live in, as per the KNBS 2023/24 Kenya Housing Survey. Even among those who do own, mortgages play a marginal role, with 91.4% of home acquisitions financed through cash or savings, 5.5% through loans, and fewer than 1.0% of households having acquired their homes through mortgages.
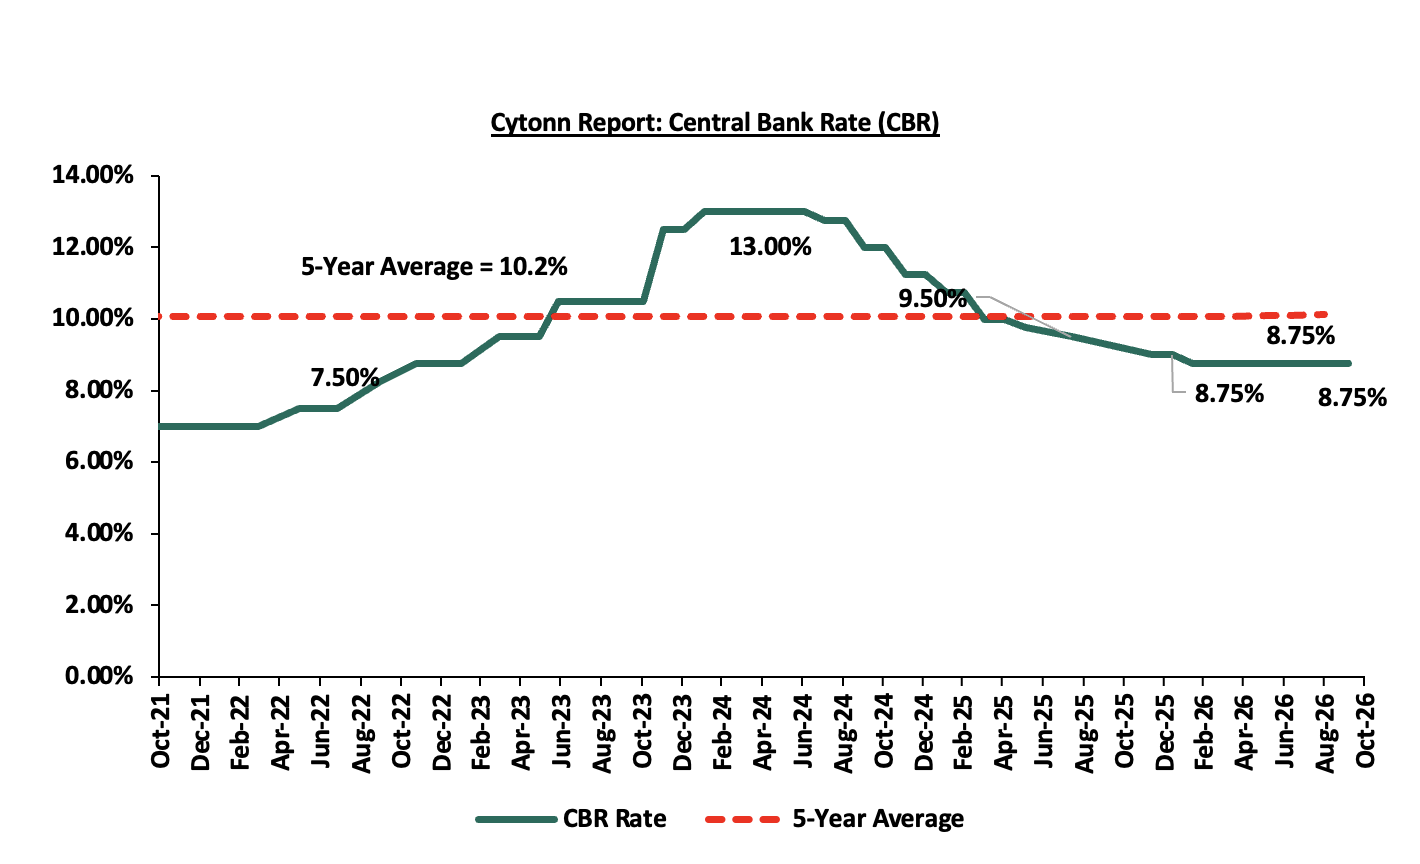
Notably, 2025 marked a turning point for the market, with the value of outstanding mortgages growing by 10.0%, the highest growth in a decade, as the average mortgage rate declined by 1.7% points to 13.5%, from 15.2% in 2024. This was on the back of the CBK’s easing cycle, which saw the Central Bank Rate (CBR) cut by a cumulative 425 bps to 8.75% from a peak of 13.0% in mid-2024, where it was retained at the 7th October 2026 MPC meeting, alongside the revised Risk-Based Credit Pricing Model (RBCPM), anchored on KESONIA, aimed at improving the transmission of monetary policy to lending rates. Additionally, the Kenya Mortgage Refinance Company (KMRC) raised a Kshs 3.0 bn sustainability bond in May 2026, while banks such as KCB and Stanbic launched single-digit fixed-rate mortgages of between 8.9% and 9.5%. However, the market remains constrained by low incomes, high property prices, rising construction costs, lengthy titling processes, elevated non-performing loans and a mismatch between short-term deposits and long-term mortgage assets.
We have been tracking the evolution of Kenya's mortgage market and home financing landscape, and below are some of the most recent topicals we have done on the subject:
- Kenya Mortgage Refinance Company (KMRC) Review 2026 - In 2026, we reviewed KMRC's progress since operationalization, including its refinancing record, its funding model and its role in the Affordable Housing Programme,
- Update on Kenya Mortgage Refinance Company (KMRC) - In February 2023, we highlighted KMRC's progress, the state of home financing in Kenya and lessons from mortgage refinance companies in Jordan, Saudi Arabia, Tanzania, France and Nigeria, and,
- Kenya Mortgage Refinance Company (KMRC) Progress - In May 2022, we analyzed the performance of KMRC since it commenced its lending operations.
In this week's topical, we focus on the state of Kenya's mortgage market as at 2026, analyzing its size and growth, its cost and affordability relative to household incomes, the supply and funding sides of the market, and the role of government policy, with a view to identifying what it would take to deepen home financing in the country. We shall cover this through the following sections:
- Introduction to Mortgage Finance,
- State of the Kenyan Mortgage Market,
- Regional Comparison,
- Cost of Borrowing and Affordability,
- Lenders, Products and the Supply Side,
- Funding the Market: KMRC and Long-Term Capital,
- Risks and Challenges, and,
- Recommendations and Conclusion.
Section I: Introduction to Mortgage Finance
A mortgage is a long-term loan advanced for the purchase, construction or improvement of property, with the property itself pledged as security. The borrower contributes a deposit, while the lender finances the balance as a proportion of the property's value, known as the Loan-to-Value (LTV) ratio, with the loan repaid in monthly instalments of principal and interest over a tenor of 10 to 25 years. Should the borrower default, the lender has the right to sell the property to recover the outstanding amount. Mortgages are priced either at a variable rate, which in Kenya is now linked to KESONIA or the CBR plus a lender-specific premium, or at a fixed rate for all or part of the tenor. The two variables that determine whether a mortgage is affordable are the tenor and the cost of funds. Lenders, however, can only offer long tenors at fixed rates if they hold long-term funding, which is why deep mortgage markets rely on a second layer of institutions behind the lenders, comprising refinance companies, mortgage guarantee schemes, mortgage-backed securities and long-term investors such as pension funds.
Kenya has, over the last decade, put most of this architecture in place. Commercial banks originate the bulk of mortgages, with SACCOs participating through development loans and as KMRC lenders. The Kenya Mortgage Refinance Company (KMRC), licensed in 2020 by the CBK, provides long-term refinancing to Primary Mortgage Lenders (PMLs) at 5.0%, while the Kenya Mortgage Guarantee Trust (KMGT), to which the National Treasury committed Kshs 603.0 mn in August 2025, is set to share credit risk on loans to lower-income and informal earners. The Central Bank of Kenya (CBK) regulates lenders and sets the pricing framework, the Capital Markets Authority (CMA) regulates bonds and REITs, and the Affordable Housing Board manages the levy-funded Affordable Housing Fund.
Section II: State of the Kenyan Mortgage Market
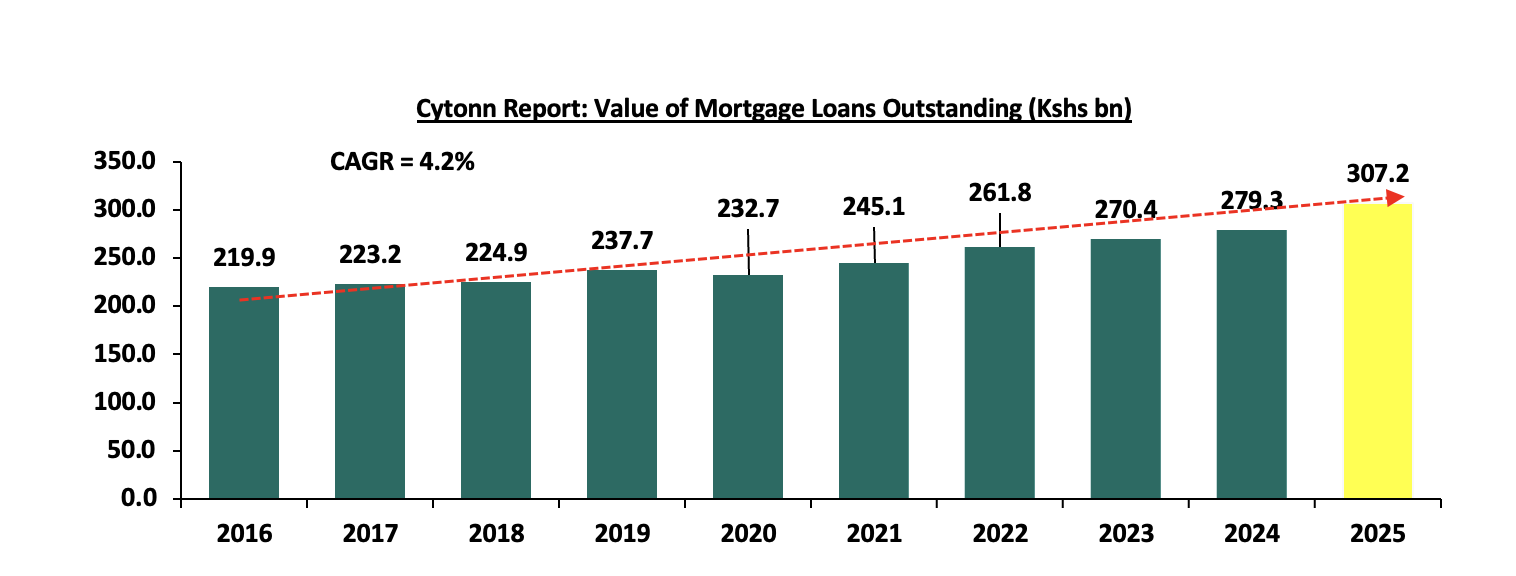
According to the CBK Bank Supervision Annual Report 2025, the value of mortgage loans outstanding increased by 10.0% to Kshs 307.2 bn in December 2025, from Kshs 279.3 bn in December 2024, attributable to new mortgage loans granted during the year. The chart below shows the value of mortgage loans outstanding over the past decade:
Source: Central Bank of Kenya (CBK), Cytonn Research.
The chart highlights three distinct phases. Between 2015 and 2019, the market stagnated, with the value of mortgages increasing by only 16.9% to Kshs 237.7 bn in 2019, from Kshs 203.3 bn in 2015, as the interest rate cap introduced in 2016 made long-term, risk-priced lending unattractive to banks. Between 2019 and 2023, growth resumed but remained modest, with the value of mortgages increasing by 13.8% to Kshs 270.4 bn in 2023, from Kshs 237.7 bn in 2019. In 2024, the value of mortgages increased by 3.3% to Kshs 279.3 bn, from Kshs 270.4 bn in 2023, as the CBR peaked at 13.0% and the average mortgage rate rose to 15.2%, as per the CBK Bank Supervision Annual Report 2024. Consequently, the 10.0% growth to Kshs 307.2 bn in 2025, from Kshs 279.3 bn in 2024, was the highest annual growth in a decade. However, over the full decade, the value of mortgages has recorded a CAGR of only 4.2%, below the growth in nominal GDP, indicating that the market has not deepened relative to the economy over the period.
The growth in the number of mortgage accounts, on the other hand, has been significantly weaker, as shown below: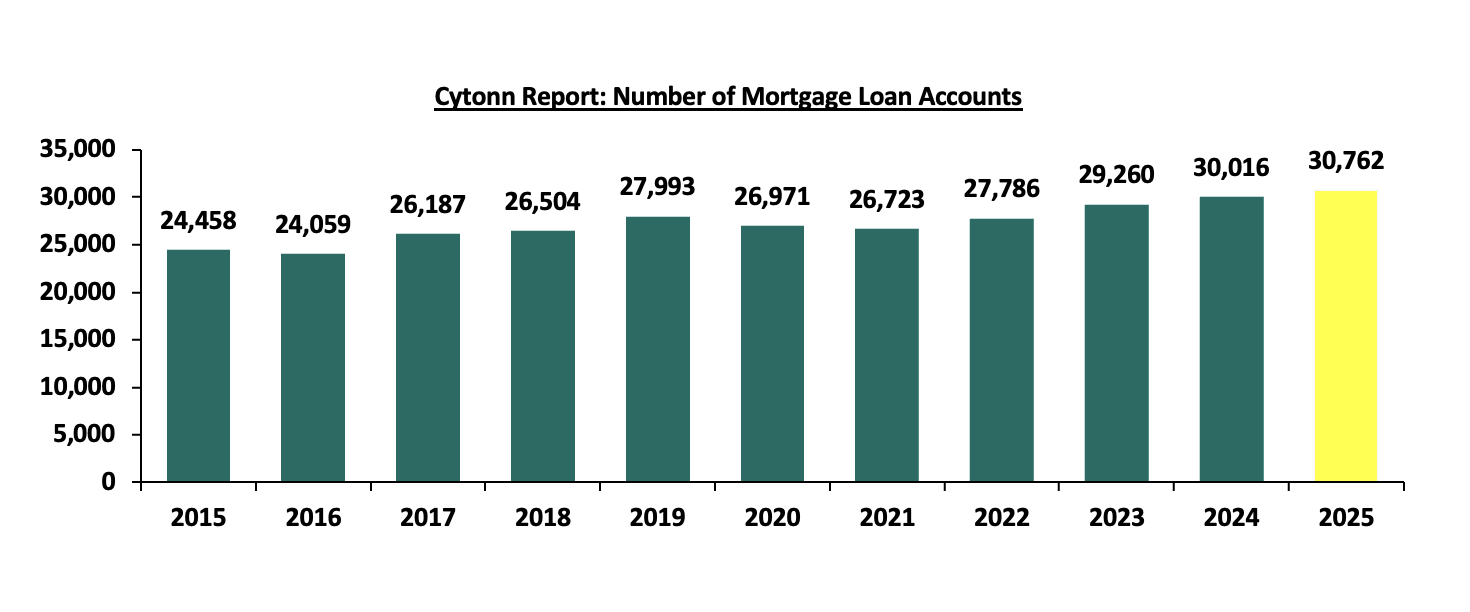
Source: Central Bank of Kenya (CBK), Cytonn Research
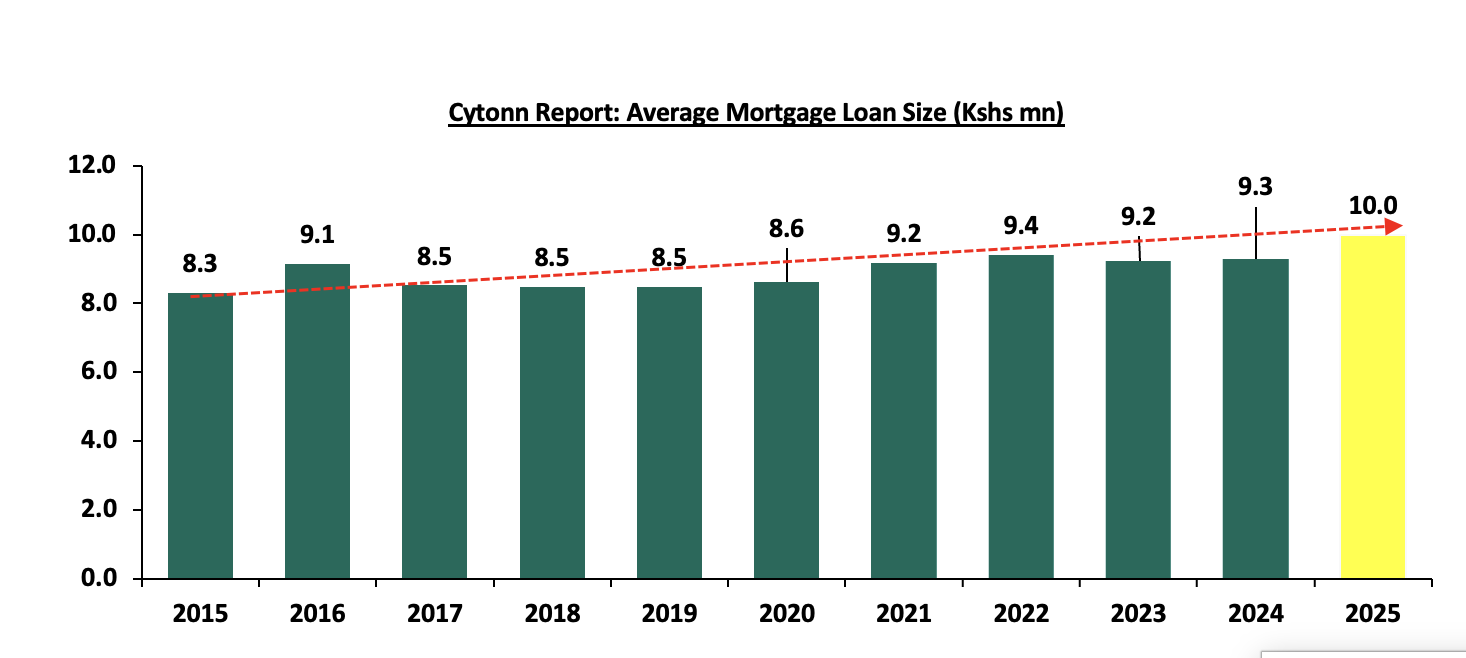
The number of accounts increased by only 2.5% to 30,762 in 2025 from 30,016, an addition of 746 accounts. Notably, the number of accounts in 2025 was only 9.9% higher than the 27,993 recorded in 2019, meaning that the market has spent six years recovering the borrowers it lost during the rate cap period and the pandemic. The divergence between value and volume is explained by loan size, with the average mortgage increasing by 11.1% to Kshs 10.0 mn in 2025, from Kshs 9.0 mn in 2024. In our view, this confirms that the 2025 recovery was driven by existing borrowers taking larger loans on the back of lower rates, rather than by new borrowers entering the market.
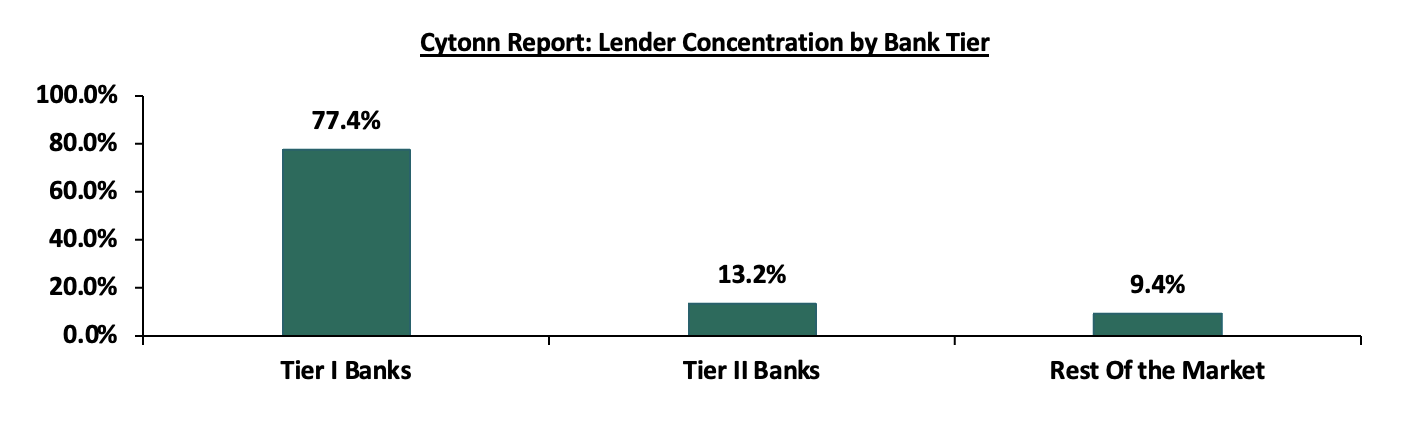
Mortgage lending also remains highly concentrated. Nine lenders accounted for 90.6% of the market in 2025, comprising seven large banks, namely KCB, Absa, Stanbic, NCBA, Co-operative Bank, Standard Chartered and Equity, with 77.4%, and two medium-sized lenders, HFC and Family Bank, with 13.2%. In addition to direct bank lending, the Kenya Mortgage Refinance Company (KMRC) has become an increasingly important contributor to the overall mortgage market. As per the CBK, 10 lenders had outstanding KMRC refinancing facilities amounting to Kshs 19.6 bn as at December 2025, a 64.7% increase from Kshs 11.9 bn across 7 lenders in December 2024, equivalent to 6.4% of the value of mortgages outstanding. Additionally, KMRC had cumulatively refinanced 5,148 mortgages by the end of 2025, equivalent to 16.7% of the mortgage accounts in the market, as highlighted in our KMRC Review 2026. The higher share by number than by value indicates that KMRC-backed mortgages are smaller than the market average, meaning that KMRC is reaching lower-income borrowers than the rest of the market. The chart below shows the value of mortgages outstanding by bank tier:
Source: Central Bank of Kenya (CBK),
KCB Group was the largest contributor to the mortgage market among the lenders, with mortgages of Kshs 126.8 bn in 2025, equivalent to 41.3% of the Kshs 307.2 bn market. Among medium-sized banks, HFCB Group, historically Kenya's dedicated mortgage lender, grew its mortgage book by 4.3% to Kshs 26.5 bn in 2025, from Kshs 25.4 bn in 2024, even as the group continues to diversify away from mortgage lending.
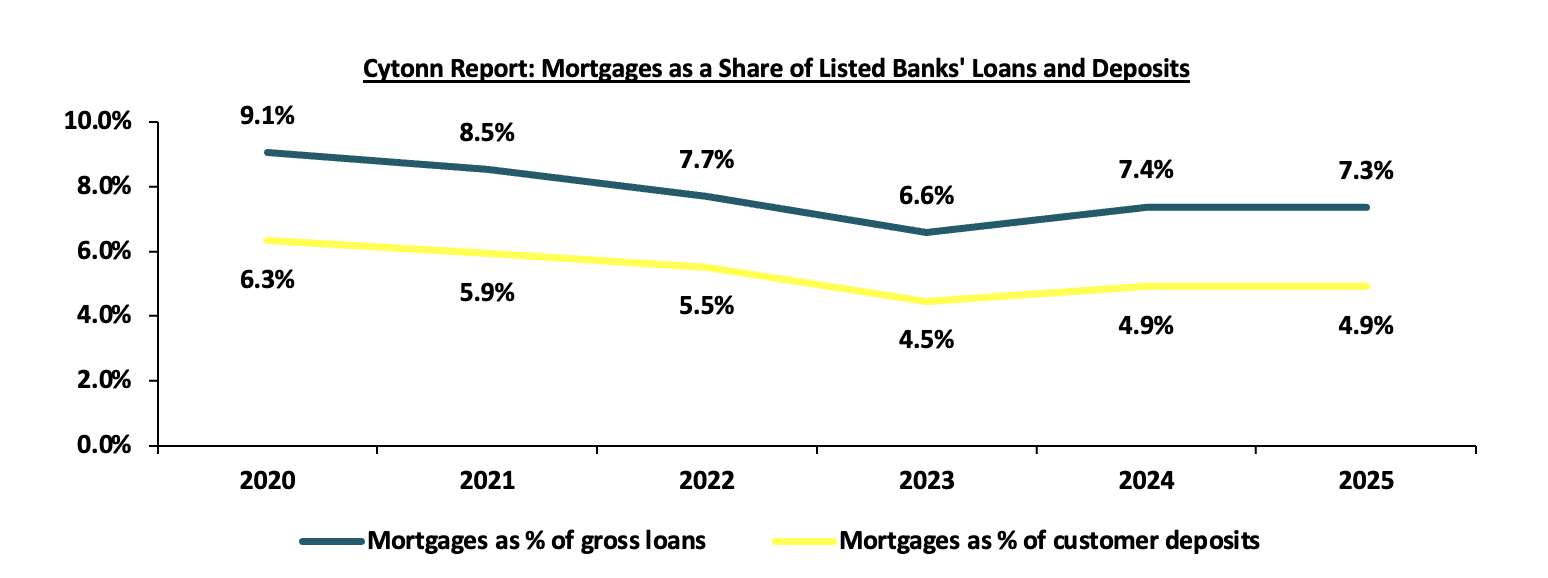
To assess the importance of mortgages to the banking sector, we compare the mortgage book with the sector's gross loans and customer deposits, as summarized below:
|
Cytonn Report: Mortgages as a Share of Listed Banks' Loans and Deposits |
||||||
|
Item (Amounts in bn Kshs) |
2020 |
2021 |
2022 |
2023 |
2024 |
2025 |
|
Mortgages outstanding |
232.7 |
245.1 |
261.8 |
270.4 |
279.3 |
307.2 |
|
Gross loans |
2,567.9 |
2,872.8 |
3,406.6 |
4,112.5 |
3,787.8 |
4,180.2 |
|
Customer deposits |
3,679.1 |
4,128.4 |
4,740.7 |
6,063.2 |
5,681.0 |
6,242.8 |
|
Mortgages as % of gross loans |
9.1% |
8.5% |
7.7% |
6.6% |
7.4% |
7.3% |
|
Mortgages as % of customer deposits |
6.3% |
5.9% |
5.5% |
4.5% |
4.9% |
4.9% |
Source: CBK Bank Supervision Annual Reports, Cytonn Research
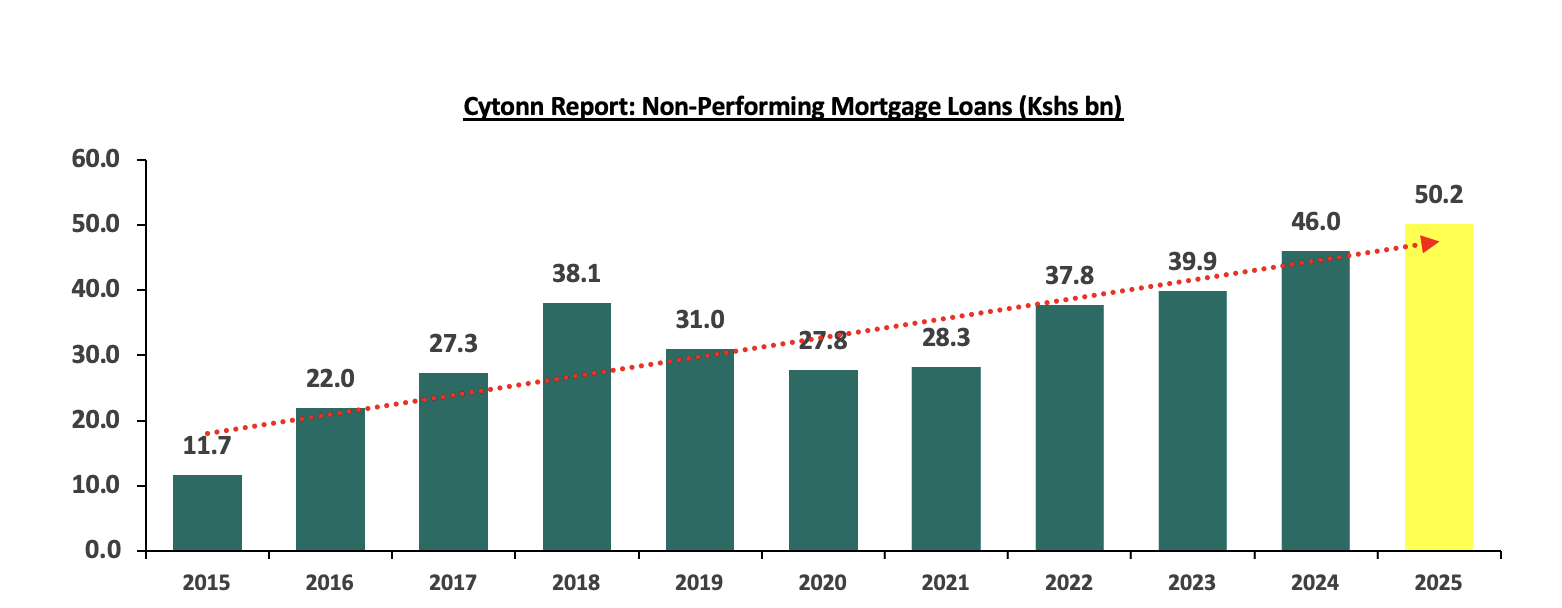
In 2025, listed banks held gross loans of Kshs 4,180.2 bn and customer deposits of Kshs 6,242.8 bn, against mortgages outstanding of Kshs 307.2 bn in the market. Notably, the Kshs 27.9 bn increase in the value of mortgages during the year was equivalent to only 7.1% of the Kshs 392.4 bn increase in listed banks' gross loans, with mortgages accounting for 7.3% of listed banks' gross loans and 4.9% of their deposits in 2025, down from 9.1% and 6.3%, respectively, in 2020. Over the same period, listed banks recorded a weighted average growth of 18.9% in their investments in government securities, more than twice the 8.9% weighted average growth in loans and advances, as banks continued to favour government securities, which offer yields of between 8.8% and 13.6% with no credit risk, title complications or foreclosure costs, compared to an average mortgage rate of 13.5% and a mortgage non-performing loan ratio of 16.3%.
Asset quality, in turn, has deteriorated steadily, as shown in the chart below:
Source: Central Bank of Kenya (CBK)
Non-performing mortgages increased by 9.1% to Kshs 50.2 bn in 2025, from Kshs 46.0 bn in 2024, mainly attributable to the reduced debt servicing capacity of borrowers, as lending rates remained elevated for most of the year despite the easing of monetary policy, with the average commercial bank lending rate at 16.6% in January 2025 and 14.8% in December 2025. However, as the value of mortgages grew faster, by 10.0%, the mortgage NPL ratio declined marginally by 0.2% points to 16.3% in 2025, from 16.5% in 2024. Despite this, the ratio remained above the banking industry's gross NPL ratio of 16.0%, having been below the industry ratio of 17.1% in 2024, indicating that asset quality in mortgages has not improved in line with the broader banking sector.
Section III: Regional Comparison
Kenya's mortgage market is larger than those of Uganda, Nigeria and Egypt relative to their economies, but a fraction of the size of the markets in South Africa and Morocco, as shown below: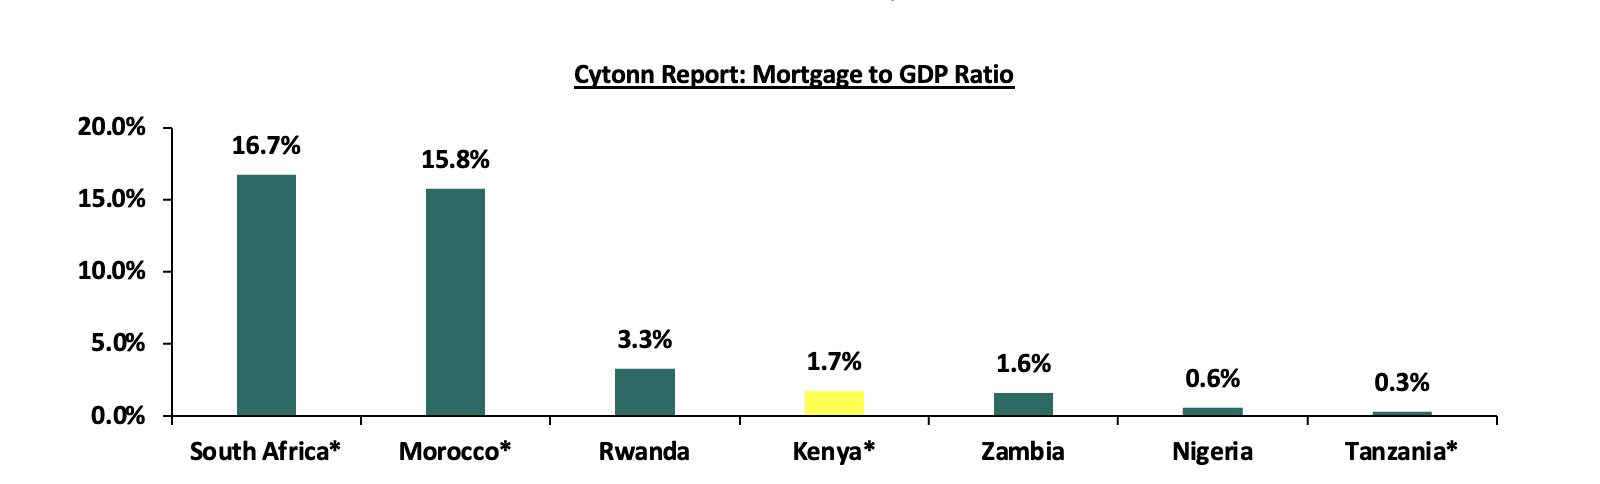
Source Cytonn Research, *Figures as of FY’2025,
The comparison across the countries highlights the following on penetration, rates and institutions:
- South Africa: Rates linked to the policy rate and long tenors: With mortgages at 17.6% of GDP, South Africa's market is built on 20 to 30-year tenors and mortgage pricing referenced to a prime rate set at a fixed 350 bps above the repo rate. Following the September 2026 hike in the repo rate to 7.25%, the prime rate stands at 10.75%, with mortgage rates 3.5% points above the policy rate, compared to 4.75% points in Kenya. Notably, the South African Reserve Bank published a consultation paper in February 2026 proposing to replace the prime rate with the policy rate as the reference rate for lending, mirroring Kenya's shift to KESONIA,
- Morocco: Low rates, guarantees and direct buyer support: Housing loans in Morocco stood at MAD 273.0 bn in 2025, equivalent to 15.8% of GDP based on Bank Al-Maghrib data, at an average rate of 4.64% in Q3'2025. The market is supported by the FOGARIM state guarantee fund, which enables lending to low-income and informal earners, and the Daam Sakane programme, which had disbursed MAD 5.4 bn in direct housing aid to 66,305 buyers by September 2025, 24.0% of whom were Moroccans living abroad,
- Rwanda: Land administration as an enabler: At 3.3% of GDP, Rwanda's mortgage market is almost twice Kenya's relative to GDP, supported by a fully registered and digitized land system, which reduces the time and cost of registering titles and charges,
- Zambia: High borrowing costs constraining mortgage uptake: Zambia’s mortgage market, at 1.6% of GDP, is broadly comparable in size to Kenya’s relative to the economy, with the Bank of Zambia reporting 7,400 outstanding mortgages valued at ZMW 10.0 bn, as per the Centre for Affordable Housing Finance in Africa (CAHF). The limited uptake is mainly attributable to high borrowing costs, with the average commercial bank lending rate at 28.0% in April 2026, 14.8% points above the policy rate of 13.25%, almost double Kenya’s average lending rate of 14.4%, and mortgage rates ranging from 16.0% to as high as 34.5%.
For Kenya to match South Africa’s 16.7% ratio, the mortgage book would need to grow by Kshs 2.6 tn, equivalent to 262,826 additional mortgages at the current average mortgage size of Kshs 10.0 mn, 8.5x the current number of mortgage accounts. Similarly, matching Morocco’s 15.8% would require the book to grow by Kshs 2.5 tn, equivalent to 247,010 additional mortgages. The regional evidence suggests that the levers with the largest impact are the spread of mortgage rates over the policy rate, as evidenced by Zambia’s high borrowing costs, and the availability of state-backed mortgage guarantees, as demonstrated by Morocco, both of which are within the control of domestic policy.
Section IV: Cost of Borrowing and Affordability
a) The CBR path and the transmission to lending rates
The cost of mortgage finance in Kenya is closely tied to the monetary policy stance. Following the tightening cycle of 2023 and 2024, during which the CBR peaked at 13.0%, the Monetary Policy Committee (MPC) commenced an easing cycle in August 2024, cutting the CBR by a cumulative 425 bps to 8.75% by February 2026. The MPC has since maintained the CBR at 8.75% at its April, June, August and October 2026 meetings, amid rising inflationary pressures from elevated global oil prices linked to the conflict in the Middle East, with inflation rising to 6.8% in September 2026. The chart below compares the CBR with the average lending and deposit rates of commercial banks, as per the KNBS Leading Economic Indicators July 2026:
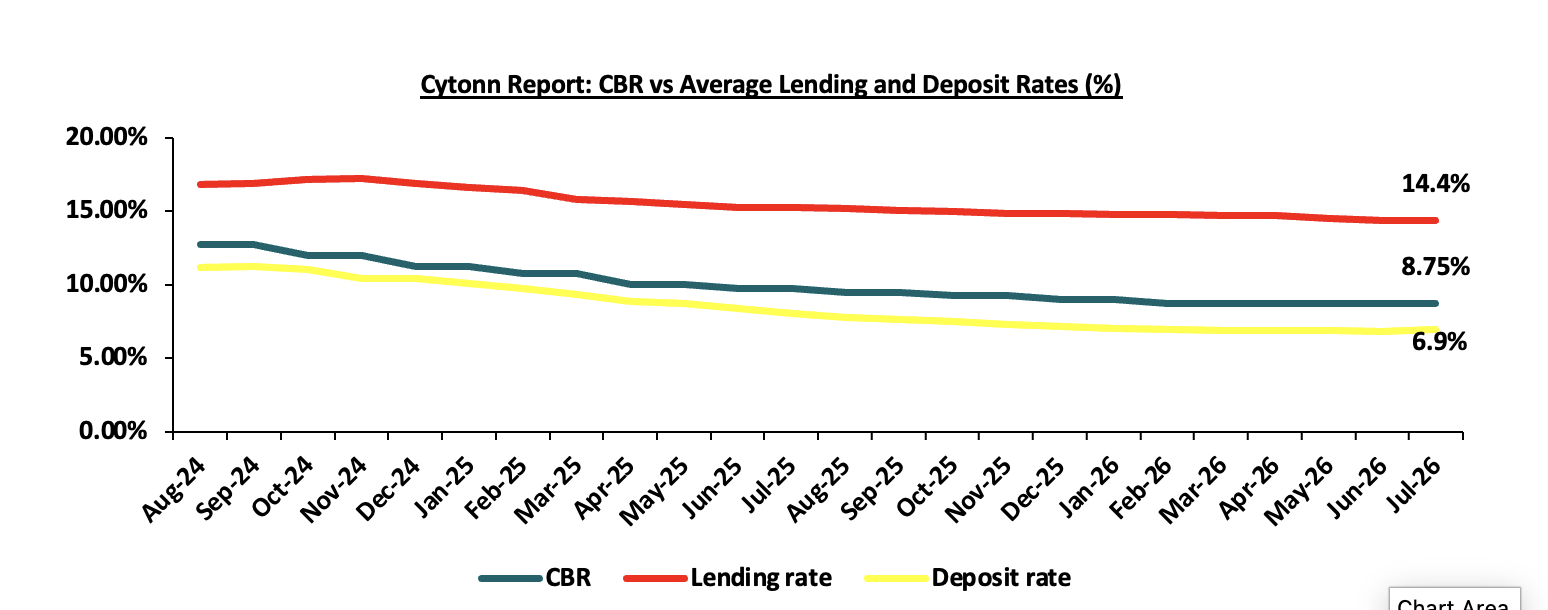
Source: KNBS Leading Economic Indicators July 2026, Central Bank of Kenya (CBK)
The rate cuts have gradually transmitted to lending rates, with the average commercial bank lending rate declining to 14.3% in July 2026, from 17.2% in November 2024. Similarly, the average interest rate on mortgages declined to 13.5% in 2025 from 15.2% in 2024, while the range of mortgage rates narrowed to between 7.5% and 19.6%, from between 8.2% and 20.4% in 2024. However, at 13.5%, the average mortgage rate remains 4.75% points above the CBR, and well above the 11.3% average recorded in 2021, before the tightening cycle. With the MPC deciding to maintain the CBR at 8.75%, in line with expectation as highlighted in our Cytonn Q3'2026 Markets Review, which means that the scope for further declines in mortgage rates in the near term will depend mainly on the competitive pricing of the premium (K) charged by banks rather than on further policy rate cuts
b The New Risk-Based Credit Pricing Model
In August 2025, the CBK issued a revised Risk-Based Credit Pricing Model (RBCPM), under which the lending rate for variable rate loans is determined as KESONIA plus a premium (K) plus fees and charges. The premium covers the bank's lending-related operating costs, the return to shareholders and the borrower-specific risk premium, while fees and charges include origination, arrangement and commitment fees. Where the use of KESONIA is not practical, banks may use the CBR as the alternative reference rate. The model took effect for all new variable-rate loans from 1st September 2025 and for existing variable-rate loans from 28th February 2026, following a six-month transition period, and by December 2025, all banks had obtained Board approval for their pricing models. In addition, banks are now required to publish their weighted average lending rates, average premiums and fees for each lending product on their websites and on the Total Cost of Credit (TCC) website.
The trend in the average mortgage rate shows how much the cost of mortgages has depended on the policy cycle:
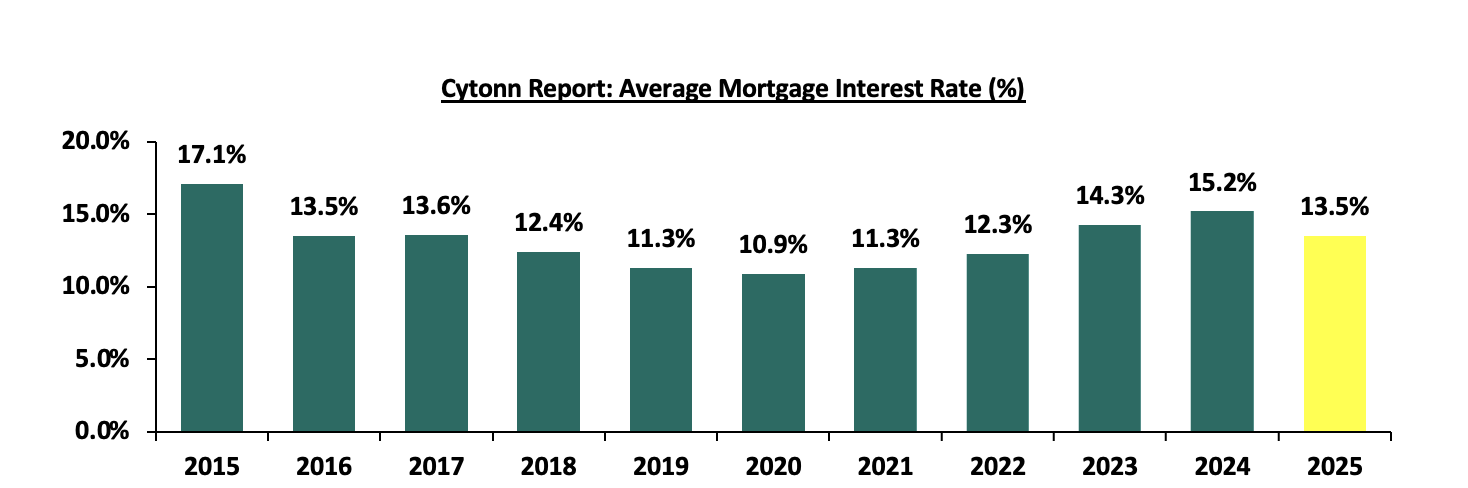
Source: Central Bank of Kenya (CBK).
The average mortgage interest rate declined by 3.6% points to 13.5% in 2016, from 17.1% in 2015, following the introduction of the interest rate cap in September 2016, and continued to ease, declining by a further 2.6% points to a low of 10.9% in 2020, supported by the rate cap regime and the accommodative monetary policy stance during the COVID-19 pandemic. However, the trend reversed from 2021, with the average mortgage rate increasing by 4.3% points to 15.2% in 2024, from 10.9% in 2020, as the CBK tightened monetary policy to contain inflation and exchange rate pressures, with the CBR peaking at 13.0% in 2024. In 2025, the average mortgage rate declined by 1.7% points to 13.5%, from 15.2% in 2024, on the back of the easing cycle, with the range of mortgage rates narrowing to between 7.5% and 19.6%, from between 8.2% and 20.4% in 2024, as per the CBK.
c) House Price Trends
House prices have continued to rise, but performance is diverging sharply between houses and apartments. The overall index rose by 4.8% to 118.4 in Q1'2026, from 113.0 in Q1'2025, driven by an 8.5% increase in standalone house prices to 133.6, while apartment prices declined by 3.0% to 88.7, their fourth consecutive quarterly decline. The decline in apartment prices reflects a supply build-up in the upper and middle-income segments in Nairobi, and is a positive development for first-time buyers, who are more likely to purchase apartments. The chart below shows the performance of the According to the Kenya National Bureau of Statistics (KNBS) Residential Property Price Index (RPPI) by segment: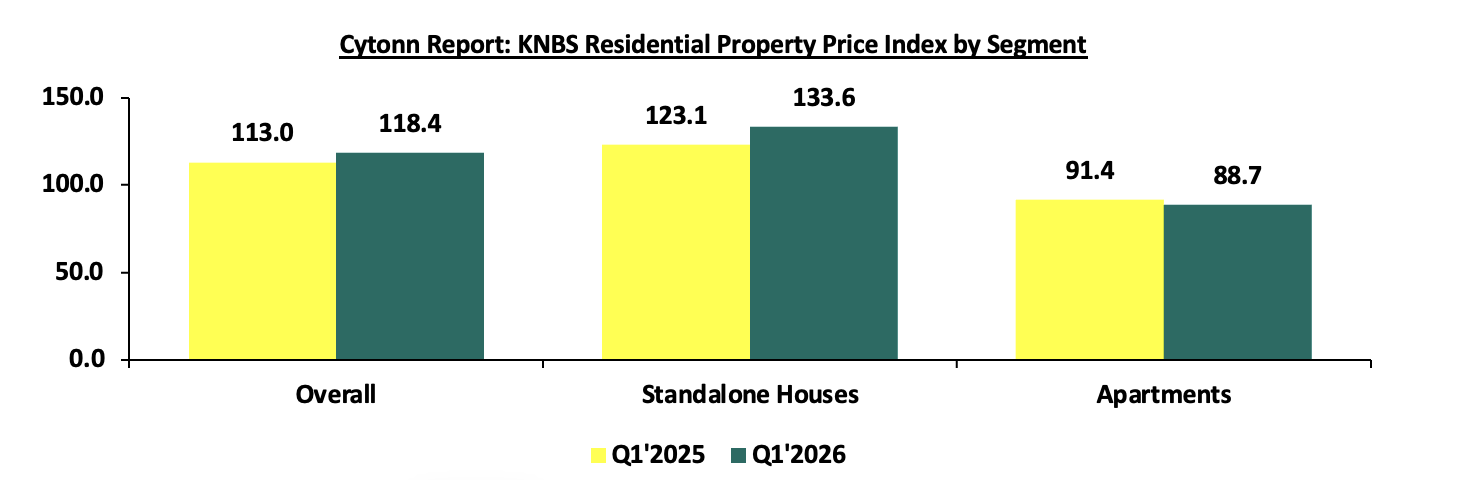
Source: Kenya National Bureau of Statistics (KNBS) Residential Property Price Index;
Our own data on the Nairobi Metropolitan Area (NMA) points to a similar trend, as shown in the chart below:
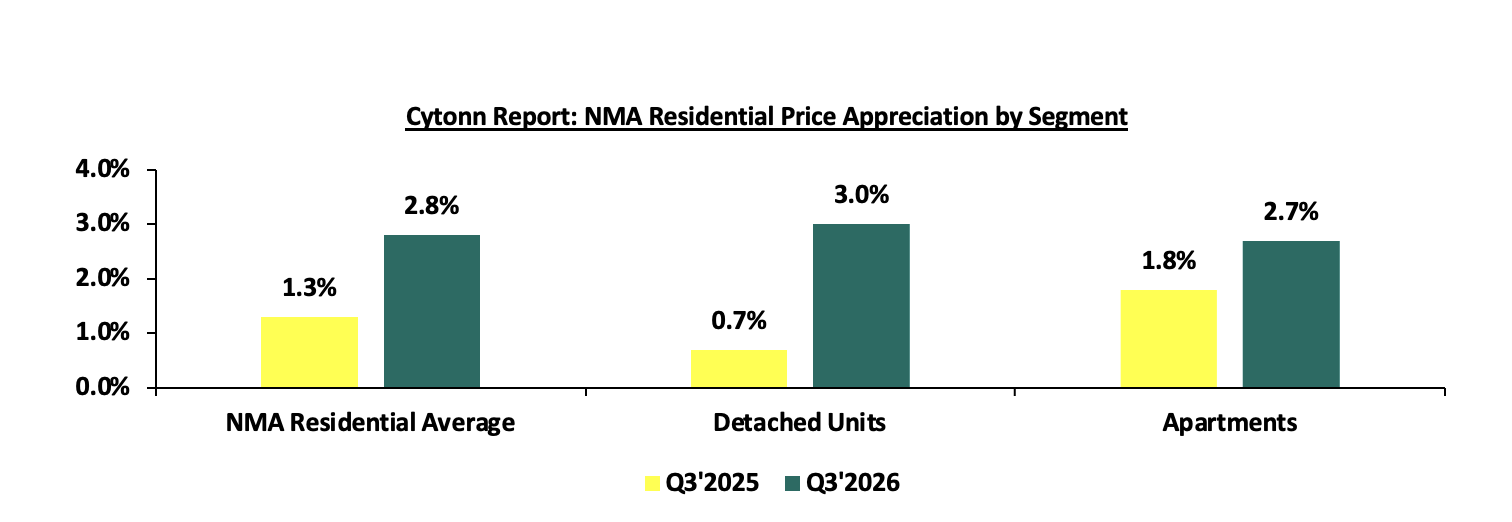
The average y/y price appreciation in the NMA residential market increased by 1.5% points to 2.8% in Q3'2026, from 1.3% in Q3'2025, as per our Cytonn Q3'2026 Markets Review, driven by a 2.3% points increase in detached unit price appreciation to 3.0%, from 0.7%, while apartment price appreciation rose more moderately to 2.7%, from 1.8%. The stronger performance of detached units reflects a continued shortage of quality standalone housing stock, such as bungalows, townhouses and maisonettes, amid sustained demand from owner-occupiers, while apartment prices have been weighed down by a build-up of supply, with select nodes such as Kileleshwa and Ruaka recording price declines of 0.7% each. For first-time buyers, this divergence is a positive development, with apartments in the lower mid-end satellite towns offering the most accessible entry point at an average of Kshs 82,977 per SQM, 44.1% lower than the average detached unit price of Kshs 148,340 per SQM, and recording the slowest appreciation of 2.5%. Similarly, the HassConsult Q2'2026 Property Index, as highlighted in our Q3 review, shows that satellite town property prices declined by 0.6% q/q to Kshs 14.5 mn, with six of the nine satellite apartment markets surveyed recording price declines.
d) Affordability
Mortgage affordability in Kenya remains constrained by income levels, even within the formal sector. According to the Economic Survey 2026, average annual earnings per employee in the modern sector increased by 5.9% to Kshs 988.2 thousand in 2025, from Kshs 933.1 thousand in 2024, equivalent to a monthly salary of Kshs 82,348, with private sector earnings averaging Kshs 1.0 mn and public sector earnings averaging Kshs 874.3 thousand. However, after adjusting for inflation, real average earnings increased by only 2.0% to Kshs 678.8 thousand, from Kshs 665.4 thousand in 2024. Against these income levels, the average mortgage of Kshs 10.0 mn in 2025, as per the CBK, was equivalent to 10.1x the average annual earnings of a formal sector employee. Assuming the average mortgage rate of 13.5% over a 20-year tenor, the monthly repayment on the average mortgage would amount to Kshs 120,737.0, equivalent to 1.8x the average monthly salary, meaning that the average mortgage exceeds the entire monthly income of the average formal sector worker.
Section V: Lenders, Products and the Supply Side
a) Bank Mortgage Books and New Products
The large banks have responded to the easing cycle and KMRC's funding with single-digit fixed-rate products. KCB is running a home loan campaign until 31st December 2026 at a fixed rate from 8.9% for the full tenor, with financing of up to 105.0% and loans of up to Kshs 10.5 mn over 25 years. Stanbic offers a KMRC-backed affordable housing mortgage at 9.5% fixed over 25 years, while HFC offers 9.5% fixed mortgages over 20 years through its partnership with Superior Homes. The chart below compares the rates on these products with each bank's overall average lending rate:
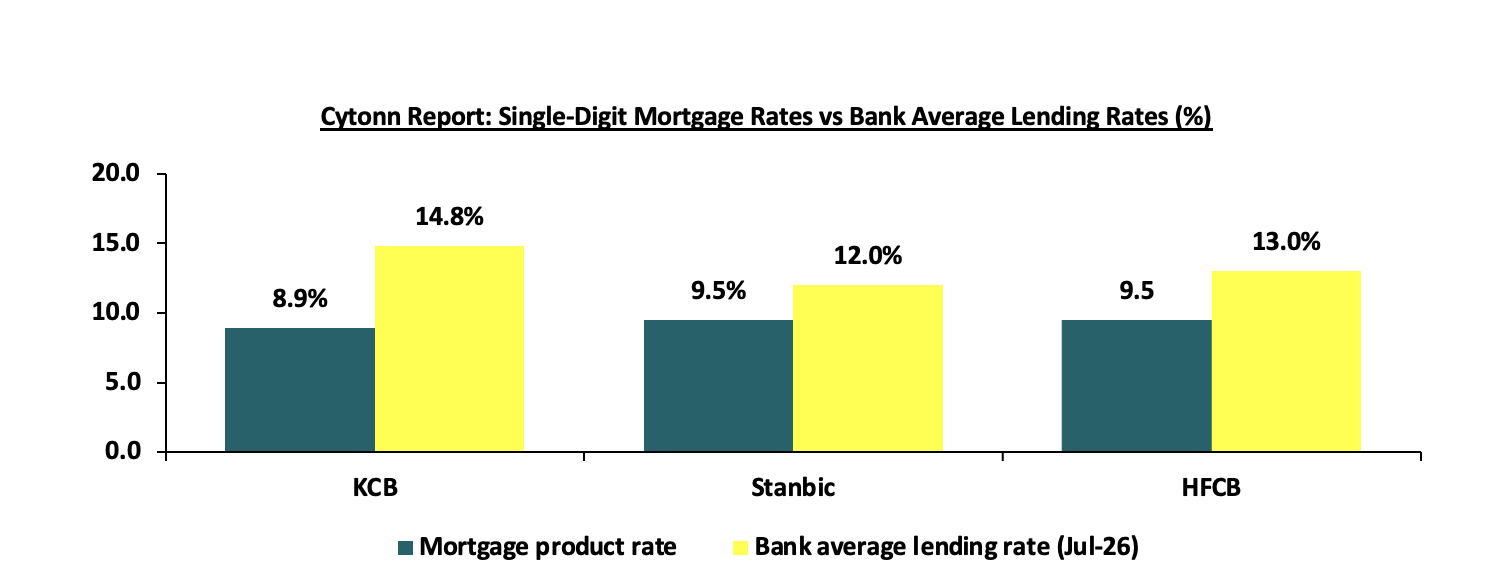
Source: KCB, Stanbic, HF Group, CBK Total Cost of Credit (July 2026)
The single-digit products are priced between 2.5% and 5.9% points below the respective bank's average lending rate, which is only possible because they are funded by KMRC at 5.0% rather than by deposits. This illustrates that the binding constraint on mortgage pricing in Kenya is the cost and tenor of funding, not lenders' willingness to lend. However, the products are capped at Kshs 10.5 mn, require verifiable income, and in KCB's case are time-bound and limited to properties valued at not more than Kshs 15.0 mn, meaning that their reach is limited to salaried buyers of lower-priced units.
Diaspora borrowers present a significant opportunity for these products. Diaspora remittances stood at USD 5,012.7 mn in the twelve months to August 2026, with North America accounting for 50.3% of the inflows, and a significant share is directed towards property. Diaspora borrowers have verifiable, largely hard-currency incomes, making them easier to underwrite than most local informal earners. KCB accepts foreign income under its home loan campaign, Stanbic's affordable housing mortgage is available to Kenyans abroad provided the loan is denominated in Kenya Shillings, and the Boma Yangu platform has a dedicated diaspora applicant channel. In Morocco, Moroccans living abroad accounted for 24.0% of the beneficiaries of the Daam Sakane housing programme, an indication of the scale of demand that a well-targeted diaspora product can unlock. The main barriers in Kenya remain the difficulty of conducting property due diligence from abroad and the risk of fraud in land transactions, both of which point back to land administration.
b) Case Study: HF Group and Mortgage Lending
HF Group, Kenya's only historically dedicated mortgage lender, provides the clearest illustration of the economics of mortgage lending in Kenya. In December 2019, HFC was the second-largest mortgage lender in the country with Kshs 33.7 bn in mortgage loans. After years of losses driven by the interest rate cap and deteriorating mortgage asset quality, the group raised Kshs 6.0 bn through a rights issue in 2024 and embarked on a diversification strategy, with non-mortgage loans rising to 31.2% of its loan book by Q3'2025. In May 2026, the group adopted the HFCB Group name, formalizing its transition from a mortgage-focused lender into a broader financial services group.
In FY’2025, HFCB Group’s profit after tax increased by 171.1% to Kshs 1.4 bn, from Kshs 524.7 mn in FY’2024, as per its FY’2025 audited financial statements. Customer deposits increased by 17.7% to Kshs 55.9 bn, from Kshs 47.5 bn, while net loans and advances increased by only 5.8% to Kshs 41.1 bn, from Kshs 38.9 bn. In contrast, investment in government securities increased by 66.6% to Kshs 28.3 bn, from Kshs 17.0 bn, with the government securities to deposit ratio increasing by 14.8% points to 50.6%, from 35.7%, and interest income from government securities and other financial assets increasing by 78.6% to Kshs 2.8 bn, from Kshs 1.6 bn. This indicates that the group’s return to profitability was driven primarily by investment in government securities rather than by mortgage lending. In H1'2026, profit after tax increased by 59.9% to Kshs 1.0 bn, from Kshs 0.6 bn in H1'2025, while net loans and advances increased by 11.5% to Kshs 43.4 bn, from Kshs 38.9 bn, indicating a pick-up in lending. However, investment in government securities increased at a faster rate of 41.0% to Kshs 33.7 bn, from Kshs 23.9 bn, highlighting that the risk-return profile of government securities continues to be more attractive to lenders than that of mortgage lending.
c) Developers, construction activity and construction costs
On the supply side, high frequency indicators point to a recovery in construction activity in 2026. As per the KNBS Leading Economic Indicators, cement consumption increased by 14.3% to 6.5 mn metric tonnes in the first seven months of 2026, following a 20.3% increase to 10.3 mn metric tonnes in 2025, as shown below:
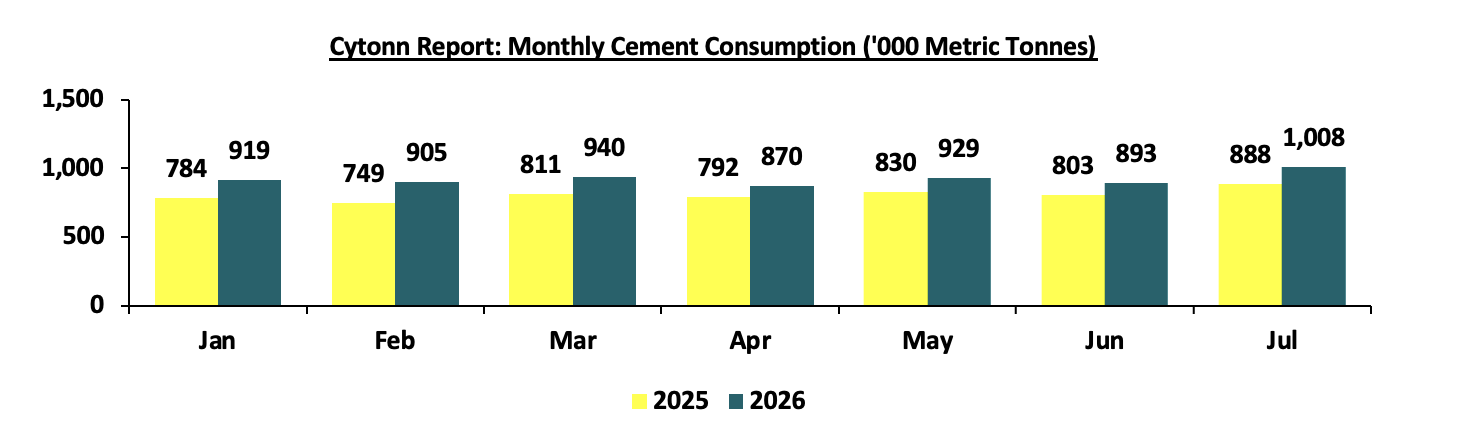
Source: KNBS Leading Economic Indicators July 2026
Consumption in every month of 2026 exceeded the corresponding month of 2025, with July 2026 recording 1.0 mn metric tonnes, a 13.5% y/y increase. Additionally, residential building plans approved in Nairobi increased by 20.2% to Kshs 73.2 bn in the first five months of 2026, reversing a decline in 2025, when approvals in the first eight months fell to Kshs 114.3 bn from Kshs 148.5 bn. Together, these indicators point to a growing
After a period of stability between 2024 and mid-2025, during which annual construction cost inflation slowed to 0.5% in 2025, the Construction Input Price Index rose by 5.7% to 126.4 in Q2'2026, from 119.5 in Q1'2026, driven by fuel, transport, cement and concrete prices following the spike in global oil prices. The Architectural Association of Kenya reported that the cost of constructing a standard bungalow increased by 12.3% to Kshs 54,730 per square metre in 2025. Rising construction costs are a direct threat to the affordability arithmetic in Section IV, since every increase in unit costs pushes AHP units further from the income levels they are designed for.
d) REIT Performance
REITs, which could channel institutional capital into rental and for-sale housing, remain small. As at 25th September 2026, Acorn D-REIT and I-REIT, which are focused on student accommodation, traded at Kshs 29.7 and Kshs 24.4 per unit on the Unquoted Securities Platform, 48.5% and 22.0% above their Kshs 20.0 inception price, while ILAM Fahari I-REIT traded at Kshs 13.8, 31.0% below its inception price. Acorn's performance shows that well-structured residential REITs can attract investors, but there is still no REIT dedicated to affordable housing. With average apartment rental yields of 6.1% in the Nairobi Metropolitan Area in H1'2026, against an average mortgage rate of 13.5%, a mortgage-financed rental investment carries a negative spread of 7.4% points, which explains the absence of buy-to-let investors, a key source of mortgage demand in developed markets.
Section VI: Funding the Market: KMRC and Long-Term Capital
- KMRC's Refinancing Record
KMRC has steadily expanded its footprint since it commenced lending, as shown below:
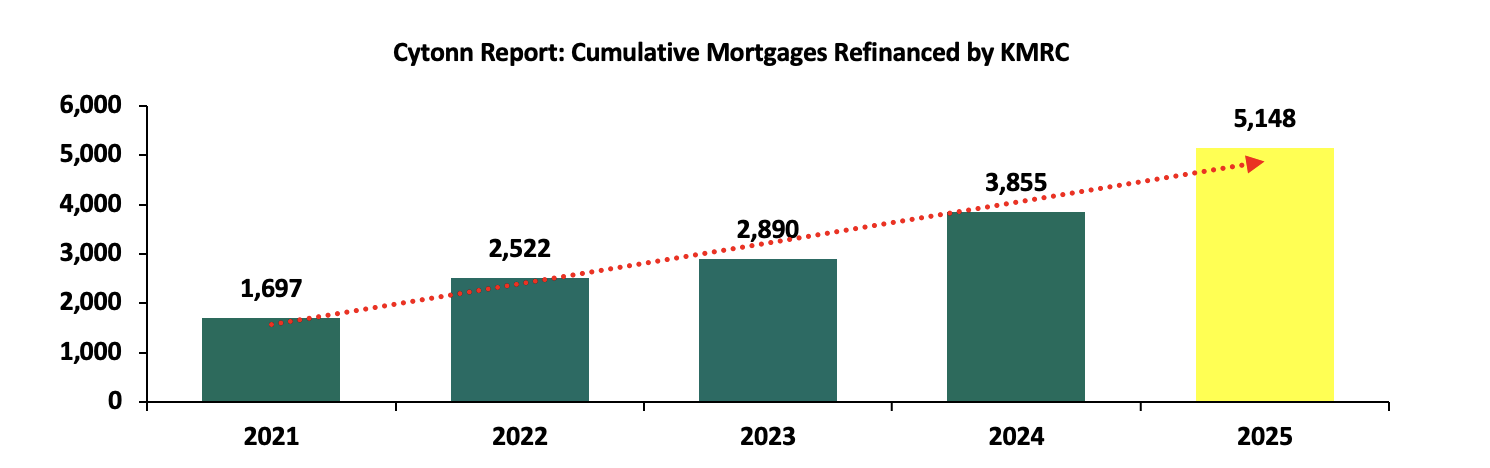
Source: Kenya Mortgage Refinance Company (KMRC)
KMRC had refinanced 5,148 mortgages cumulatively by the end of 2025, a 33.5% increase from 3,855 in 2024, with cumulative disbursements to PMLs of Kshs 25.4 bn, as per its 2025 Annual Report. Ten lenders had outstanding KMRC facilities of Kshs 19.6 bn in December 2025, up from seven lenders with Kshs 11.9 bn in 2024. Two features of this footprint stand out. First, KMRC-refinanced mortgages account for 16.7% of mortgage accounts but only 6.4% of the value of the mortgage book, with its affordable home loans averaging Kshs 4.7 mn, less than half the market average, meaning that KMRC is reaching a lower-income borrower than the rest of the market.
KMRC currently has 18 PMLs, including commercial banks such as KCB, Co-operative Bank, Stanbic, NCBA, Absa, DTB, I&M, HFC, Credit Bank and Kingdom Bank, KWFT Microfinance Bank, and SACCOs such as Mwalimu, Harambee, Imarisha, Imarika, Bingwa, Qona and Kenya Police SACCO. KMRC's cumulative disbursements to PMLs have grown steadily since it commenced operations, as shown in the chart below: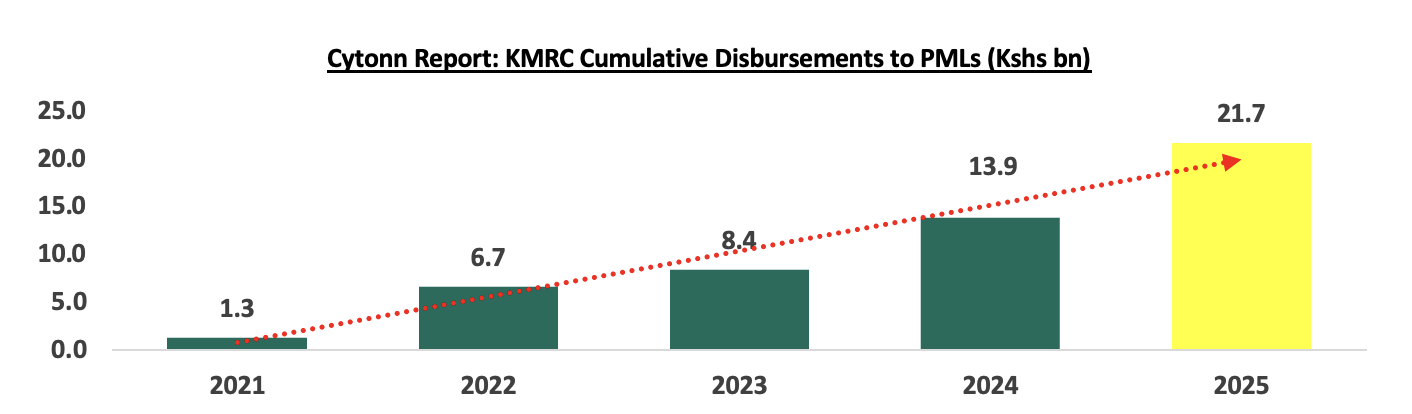
Source: KMRC, National Treasury, Cytonn Research
Cumulative disbursements by KMRC increased to Kshs 21.7 bn by 2025, from Kshs 13.9 bn in 2024 and Kshs 1.3 bn in 2021, with the company having refinanced over 4,500 affordable home loans across 39 counties by August 2025, as per the National Treasury. As per the CBK, 10 institutions had outstanding KMRC facilities amounting to Kshs 19.6 bn in December 2025, a 64.7% increase from Kshs 11.9 bn across 7 institutions in December 2024, equivalent to 6.4% of the total mortgage book. In addition, KMRC released its HY'2026 financial results, whose key highlights are summarized below:
|
Cytonn Report: KMRC Key Financial Highlights, HY'2025 - HY'2026 |
|||
|
Item (Kshs mn) |
HY'2025 |
HY'2026 |
y/y Change |
|
Interest income |
1,576.9 |
1,549.5 |
(1.7%) |
|
Interest expense |
(649.8) |
(877.9) |
35.1% |
|
Net interest income |
927.2 |
671.7 |
(27.6%) |
|
Total expenses |
(149.8) |
(170.7) |
14.0% |
|
Profit after tax |
544.2 |
350.7 |
(35.6%) |
|
Loans and advances |
18,776.6 |
24,269.4 |
29.3% |
|
Cash and cash equivalents |
16,154.7 |
16,031.1 |
(0.8%) |
|
Total assets |
40,952.6 |
46,444.0 |
13.4% |
|
Borrowings |
33,960.3 |
35,916.7 |
5.8% |
|
Debt securities in issue |
936.7 |
3,742.1 |
299.5% |
|
Total capital |
5,616.0 |
6,341.3 |
12.9% |
Source: KMRC HY'2026 Financial Statements
Key take-outs from KMRC's HY'2026 performance include:
- Strong growth in refinancing: Loans and advances to PMLs grew by 29.3% to Kshs 24.3 bn in HY'2026, from Kshs 18.8 bn in HY'2025, reflecting the continued uptake of KMRC funding by PMLs, supported by the single-digit mortgage campaigns by its partner banks,
KMRC has built a track record in the debt capital markets. In March 2022, it issued the first Kshs 1.4 bn tranche of its Kshs 10.5 bn Medium-Term Note programme at a coupon of 12.5%, which recorded a subscription rate of 478.6%. In May 2026, it issued a Kshs 3.0 bn, eight-year amortizing sustainability bond under the same programme, which received bids of Kshs 9.4 bn, a subscription rate of 312.8%, with proceeds earmarked for green and social home loans. Across the two issues, KMRC has raised Kshs 4.4 bn against bids of Kshs 16.1 bn, meaning that Kshs 11.7 bn of investor demand for housing-linked paper was left unmet. The sustainability of KMRC's model, however, depends on raising funds at a cost that allows it to continue lending at 5.0%, and its net interest income declined by 19.6% in FY'2025 and a further 27.6% in HY'2026, as higher-cost market funding replaced concessional funding from the World Bank and the African Development Bank.
For a detailed review of KMRC’s performance, including its refinancing activity, financial results and funding model, see our Kenya Mortgage Refinance Company (KMRC) Review 2026 and our Cytonn Weekly #34 Report.
- Pensions, SACCOs and REITs
Pension funds are the largest untapped pool of long-term capital for housing. According to the Retirement Benefits Authority (RBA), pension assets grew by 24.6% to Kshs 2.8 tn in December 2025, allocated as shown below:
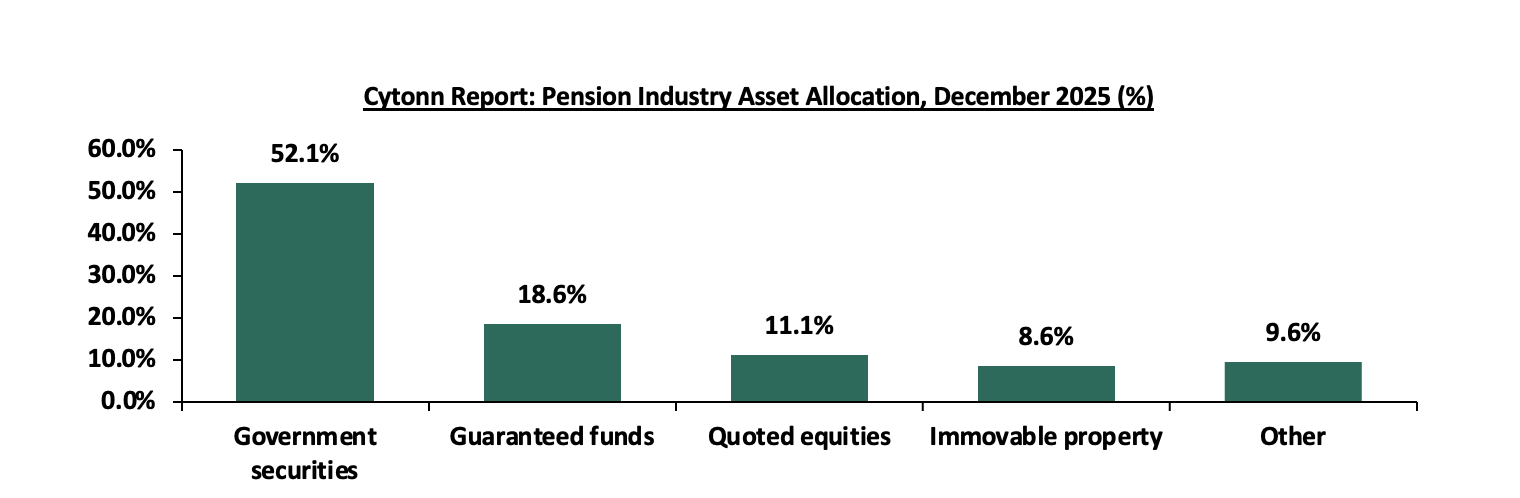
Source: Retirement Benefits Authority (RBA), Business Daily
Government securities accounted for 52.1% of pension assets, while immovable property accounted for only 8.6%, or Kshs 241.0 bn, against a regulatory limit of 30.0%, implying headroom of Kshs 602.0 bn, almost twice the size of the entire mortgage book. More significantly, the share of property in pension portfolios has been falling, from 14.5% in June 2023 to 8.57% in December 2025, as schemes have shifted towards government securities and, more recently, quoted equities. Pension funds have long-term liabilities that match the duration of mortgages, but Kenya does not offer them a liquid, standardized instrument through which to invest in mortgages, such as mortgage-backed securities. Similarly, SACCOs, with seven registered as KMRC lenders, serve exactly the middle and lower-income households the market struggles to reach, but their lending remains largely short to medium-term and unstandardized. REITs, have yet to emerge as a meaningful source of housing finance.
Section VII: Risks and Challenges
The mortgage market faces several risks and challenges on both the supply and demand sides, which include:
a) Risks and Challenges Facing Lenders and Developers
- Credit risk and slow foreclosure: The mortgage NPL ratio of 16.3% is above the industry average, and the time and cost of realizing security keep non-performing mortgages on balance sheets for extended periods,
- Competition from government securities: With a net domestic borrowing target of Kshs 1,030.1 bn in FY'2026/27, risk-free government securities will continue to compete with mortgages for bank balance sheets, as illustrated by the 13.8x gap between the increase in banks' holdings of government securities and the increase in mortgages in 2025,
- KMRC funding costs: The decline in KMRC's net interest income highlights the pressure on its ability to sustain refinancing at 5.0% as concessional funding is deployed,
- Rising construction costs: The 5.7% q/q increase in construction input costs in Q2'2026 threatens the delivery and pricing of affordable units, and,
- AHP funding gap: The Kshs 118.3 bn funding gap and 176 stalled projects could delay the delivery of units on which the affordable mortgage pipeline depends.
- b) Risks and Challenges Facing Borrowers
- Low and informal incomes: The average mortgage requires 1.47x average monthly earnings in repayments, while 83.8% of the workforce is in the informal sector and unable to meet lenders' income verification requirements,
- Interest rate risk: With 75.6% of mortgages on variable rates linked to KESONIA, borrowers are exposed to any tightening of monetary policy, with inflation at 6.8% in September 2026, approaching the upper bound of the 2.5% to 7.5% target range,
- Upfront costs: Deposits of 10.0% to 20.0% for standard mortgages, together with legal fees, valuation fees and stamp duty, significantly increase the upfront cost of a home,
- Title and transaction delays: Difficulties with property registration, the registration of charges and fraud in land transactions increase the time and cost of acquiring property, particularly for diaspora buyers, and,
- Limited awareness: Limited knowledge of KMRC-backed products and of the provision allowing the use of up to 40.0% of accrued pension benefits towards a home continues to limit uptake.
Section IX: Recommendations and Conclusion
Based on our analysis, the binding constraints on Kenya's mortgage market are the price of housing relative to incomes, the credit risk of lending to informal earners, and the efficiency of land administration, rather than the availability of long-term funding. Our recommendations are therefore focused on these constraints:
- Recapitalize the Kenya Mortgage Guarantee Trust (National Treasury and KMRC): The KMGT provides partial guarantees of up to 40.0% of the loan to borrowers earning below Kshs 200,000 per month, but its initial capitalization of Kshs 603.0 mn would fully back 251 loans of Kshs 6.0 mn before leverage. To guarantee 10,000 such loans, equivalent to 32.5% of the current number of mortgage accounts, the trust would require guarantee capacity of Kshs 24.0 bn, which at a leverage of 5x implies capital of Kshs 4.8 bn, equivalent to 6.1% of one year of levy collections. We recommend that a portion of the Affordable Housing Fund be allocated to the KMGT, given that a guarantee supports several times its value in bank and SACCO lending,
- Develop a Mortgage-Backed Securities Market (CMA, CBK and KMRC): The CMA should finalize a framework for residential mortgage-backed securities, building on KMRC's standardized mortgage documentation. This would give pension funds, with Kshs 602.0 bn of headroom in their property allocation, a liquid instrument through which to finance mortgages, and enable banks to recycle capital into new lending,
- Reform Land Titling and Foreclosure (Ministry of Lands and the Judiciary): The Ministry of Lands should complete the digitization of land registries, set statutory timelines for the registration of charges and sectional titles, and introduce a verified digital land search service to reduce fraud, which would also support diaspora demand. The legal framework for the realization of security should be streamlined to reduce the time and cost of foreclosure, lowering the credit risk premium on mortgages,
- Route AHP Sales Through Mortgages (State Department for Housing, Affordable Housing Board and KMRC): Completed AHP units should, where buyers qualify, be sold through KMRC-backed mortgages originated by banks and SACCOs rather than solely through tenant purchase. With KMRC holding Kshs 16.0 bn in undeployed cash, this would put idle funding to work and allow the Affordable Housing Fund to recycle capital into stalled projects,
- Tax-Exempt KMRC Bonds (National Treasury): Interest on KMRC bonds should be exempted from withholding tax, in line with infrastructure bonds. Given the Kshs 11.7 bn of unmet demand across KMRC's two bond issues, a tax exemption would allow KMRC to raise larger amounts at a lower cost and sustain single-digit mortgage rates as its concessional funding is deployed,
- Shift Bulk Infrastructure to the NIF (National Treasury): The financing of roads, water and sewerage for AHP sites should be moved to the National Infrastructure Fund, freeing levy resources for housing and lowering unit costs, and,
- Expand Diaspora and SACCO Mortgage Channels (Lenders, SASRA and KMRC): Lenders should develop dedicated diaspora mortgage products supported by digital land verification, while SASRA and KMRC should develop a standardized framework for SACCO mortgage lending, with alternative credit scoring based on mobile money and SACCO savings data to reach informal earners.
In conclusion, the 2025 recovery in Kenya's mortgage market was real, but it was cyclical rather than structural. Lower interest rates allowed existing borrowers to take larger loans, lifting the value of the book by 10.0%, but the number of borrowers grew by only 746, the average mortgage remains less affordable than in 2021, and banks continued to allocate 13.8x more new capital to government securities than to mortgages. The market's constraints have shifted from funding, where KMRC now holds surplus liquidity, to the price of housing, the credit risk of informal borrowers and land administration. The AHP, with 205,311 units under construction at an average cost that is affordable to the average formal worker on KMRC terms, represents the first real opportunity to connect affordable housing supply to mortgage finance at scale.
We expect the value of mortgages outstanding to grow at a high single-digit rate in 2026, supported by the stable interest rate environment following the MPC's decision to retain the CBR at 8.75%, the uptake of single-digit KMRC-backed products and the recovery in construction activity, as evidenced by the 14.3% increase in cement consumption in the first seven months of 2026. However, we expect growth in the number of mortgage accounts to remain in the low single digits, constrained by low and informal incomes, the 16.3% mortgage NPL ratio, rising construction costs and the risk of renewed monetary tightening as inflation approaches the upper bound of the target range. For the market to deepen structurally, we believe that the policy focus must shift from supplying funding to de-risking new borrowers through a recapitalized guarantee trust, connecting the AHP pipeline to mortgage finance, and reforming land administration.
Disclaimer: The views expressed in this publication are those of the writers where particulars are not warranted. This publication, which is in compliance with Section 2 of the Capital Markets Authority Act Cap 485A, is meant for general information only and is not a warranty, representation, advice, or solicitation of any nature. Readers are advised in all circumstances to seek the advice of a registered investment advisor.

- Talk to us
- Kenya
- P.O Box 20695 - 00200, Nairobi, Kenya
- Cell +254709101200
- Tel +254709101200
- WhatsApp +254741676635
- United States
- +254709101200
- DOWNLOAD OUR APP
-


- Kenya
- 8th Floor, Pinetree Plaza, Kaburu Drive, Ngong Road, Nairobi, Kenya
- USA
- Suite 1150, 1775 Eye Street NW, USA, Washington DC 20006, USA
- Investments
- High Yield
- Private Equity
- Real Estate
- Real Estate
- RiverRun Estates
- Cytonn Towers
- The Ridge
- Taraji Heights
- The Alma