Cytonn Monthly – April 2024
By Research Team, May 5, 2024
Executive Summary
Fixed Income
During the month of April 2024, T-bills were oversubscribed, with the overall average oversubscription rate coming in at 129.6%, higher than the oversubscription rate of 109.1% recorded in March 2024. The overall average subscription rates for the 364-day and 182-day papers increased to 140.3% and 78.0%, from 81.5% and 51.1% respectively, while the overall average subscription rates for the 91-day paper decreased to 231.9% from 323.1%, which was recorded in March 2024. The average yields on the government papers were on a downward trajectory in the month, with the 364-day, 182-day, and 91-day papers yields decreasing by 35.8 bps, 21.8 bps, and 68.3 bps to 16.6%, 16.7%, and 16.0% respectively from 17.0%, 16.9%, and 16.7% recorded the previous month. For the month of April, the government accepted a total of Kshs 121.2 bn of the Kshs 124.4 bn worth of bids received, translating to an acceptance rate of 97.4%;
Additionally, April 2024 bonds were oversubscribed, with the overall oversubscription rate coming in at 146.1%, higher than the oversubscription rate of 128.5% recorded in March 2024. The tap sale issues for the FXD1/2023/005 and FXD1/2024/010 received bids worth Kshs 47.8 bn against the offered Kshs 25.0 bn, translating to an oversubscription rate of 191.2%, with the government accepting bids worth Kshs 45.8 bn, translating to an acceptance rate of 95.9%. Moreover, the reopened bond FXD1/2023/02 received bids worth Kshs 47.2 bn against the offered Kshs 40.0 bn translating to an oversubscription rate of 118.0%, with the government accepting bids worth Kshs 34.8 bn, translating to an acceptance rate of 73.7%;
During the week, T-bills were oversubscribed for the first time in two weeks, with the overall oversubscription rate coming in at 108.2%, a reversal from the undersubscription rate of 98.2% recorded the previous week. Investors’ preference for the shorter 91-day paper persisted, with the paper receiving bids worth Kshs 10.1 bn against the offered Kshs 4.0 bn, translating to an oversubscription rate of 252.6%, higher than the oversubscription rate of 149.6% recorded the previous week. The subscription rates for the 182-day paper decreased to 52.0% from 69.3% recorded the previous week, while the subscription rate for the 364-day paper increased marginally to 106.6% from 106.4% recorded the previous week. The government accepted a total of Kshs 25.8 bn worth of bids out of Kshs 26.0 bn of bids received, translating to an acceptance rate of 99.5%. The yields on the government papers were on an upward trajectory, with the yields on the 364-day, 182-day, and 91-day papers increasing by 0.3 bps, 2.7 bps, and 4.2 bps to 16.50%, 16.49% and 15.87% from 16.49%, 16.46% and 15.82% respectively recorded the previous week;
During the week, the government released the auction results for the re-opened FXD1/2024/10 with a tenor of 9.9 years and a fixed coupon rate of 16.0%. The bond was undersubscribed with the overall subscription rate coming in at 59.9%, receiving bids worth Kshs 15.0 bn against the offered Kshs 25.0 bn. The government accepted bids worth Kshs 11.0 bn, translating to an acceptance rate of 73.4%. The weighted average yield of accepted bids came in at 16.2% which was within our expected range of 15.85%-16.25%, and lower than the 16.5% recorded at issue in March. With the Inflation rate at 5.0% as of April 2024, the real return of the bonds is 11.2%;
During the week, the Kenya National Bureau of Statistics (KNBS) released the year-on-year inflation, highlighting that inflation in April 2024 eased by 0.7% points to 5.0%, from the 5.7% recorded in March 2024. This was according to our expectations of a decline, but below our projections to within a range of 5.3% to 5.6%;
During the week, the National Treasury presented its Budget Estimates for the next fiscal year, FY’2024/25. Notably, the budget estimates recorded a 6.4% decrease to Kshs 3.9 tn from the previous estimates of Kshs 4.2 tn in the Budget Policy Statement for FY’2024/25 and a 2.2% increase from the Kshs 3.8 tn in FY’2023/24 as per Supplementary Budget II. Additionally, revenue is set to increase by 16.2% to Kshs 3.4 tn in FY’2024/25 from Kshs 2.9 tn in FY’2023/24. Furthermore, the allocation of resources has been aligned to priority programs and sectors under the Bottom-Up Economic Transformation Agenda, and the Medium-Term Revenue Strategy FY’2024/25-FY’2026/27. This is to ensure spending is directed towards the most critical needs considering the available resources;
Equities
During the month of April 2024, the equities market was on a downward trajectory, with NASI declining the most by 5.8%, while NSE 25, NSE 10, and NSE 20 declined by 4.2%, 3.7%, and 3.5% respectively. The equities market performance was driven by losses recorded by large-cap stocks such as Cooperative Bank, Standard Chartered Bank, and Safaricom of 17.0%, 15.3%, and 10.1% respectively. The losses were, however, mitigated by gains recorded by large-cap stocks such as EABL, Bamburi, and NCBA of 22.2%, 2.1%, and 1.1% respectively;
During the week, the equities market was on a downward trajectory, with NSE 10 declining the most by 4.5%, while NSE 25, NASI, and NSE 20 declined by 3.4%, 2.7%, and 2.4% respectively, taking the YTD performance to gains of 17.9%, 15.7%, 13.8%, and 9.2% for NSE 10, NSE 25, NASI, and NSE 20 respectively. The equities market performance was driven by losses recorded by large-cap stocks such as Cooperative Bank, NCBA, and ABSA Group of 12.9%, 10.7%, and 10.5% respectively. The losses were, however, mitigated by gains recorded by large-cap stocks such as Bamburi and Stanbic of 5.2% and 1.1% respectively;
Real Estate
During the week, Naivas Supermarket, a local retail chain, inaugurated its 105th branch at T-Square Mall in Buruburu Phase 4, bringing its total number of outlets nationwide to 105. Spanning an impressive 28,000 square feet, the newest Naivas store offers a comprehensive shopping experience, featuring dedicated sections for electronics, home goods, apparel, fresh produce, and fast-moving consumer goods. This opening represents a significant milestone for Naivas, marking its return to the area after an absence of ten years;
In the Unquoted Securities Platform, Acorn D-REIT and I-REIT traded at Kshs 24.4 and Kshs 21.7 per unit, respectively, as of 26th April 2024. The performance represented a 22.0% and 8.3% gain for the D-REIT and I-REIT, respectively, from the Kshs 20.0 inception price;
Investment Updates:
- Weekly Rates:
- Cytonn Money Market Fund closed the week at a yield of 17.13% p.a. To invest, dial *809# or download the Cytonn App from Google Play store here or from the Appstore here;
- We continue to offer Wealth Management Training every Monday, from 10:00 am to 12:00 pm. The training aims to grow financial literacy among the general public. To register for any of our Wealth Management Trainings, click here;
- If interested in our Private Wealth Management Training for your employees or investment group, please get in touch with us through wmt@cytonn.com;
- Cytonn Insurance Agency acts as an intermediary for those looking to secure their assets and loved ones’ future through insurance namely; Motor, Medical, Life, Property, WIBA, Credit and Fire and Burglary insurance covers. For assistance, get in touch with us through insuranceagency@cytonn.com;
- Cytonn Asset Managers Limited (CAML) continues to offer pension products to meet the needs of both individual clients who want to save for their retirement during their working years and Institutional clients that want to contribute on behalf of their employees to help them build their retirement pot. To more about our pension schemes, kindly get in touch with us through pensions@cytonn.com;
Real Estate Updates:
- For more information on Cytonn’s real estate developments, email us at sales@cytonn.com;
- Phase 3 of The Alma is now ready for occupation and the show house is open daily. To join the waiting list to rent, please email properties@cytonn.com;
- For Third Party Real Estate Consultancy Services, email us at rdo@cytonn.com;
- For recent news about the group, see our news section here;
Hospitality Updates:
- We currently have promotions for Staycations. Visit cysuites.com/offers for details or email us at sales@cysuites.com;
Money Markets, T-Bills Primary Auction:
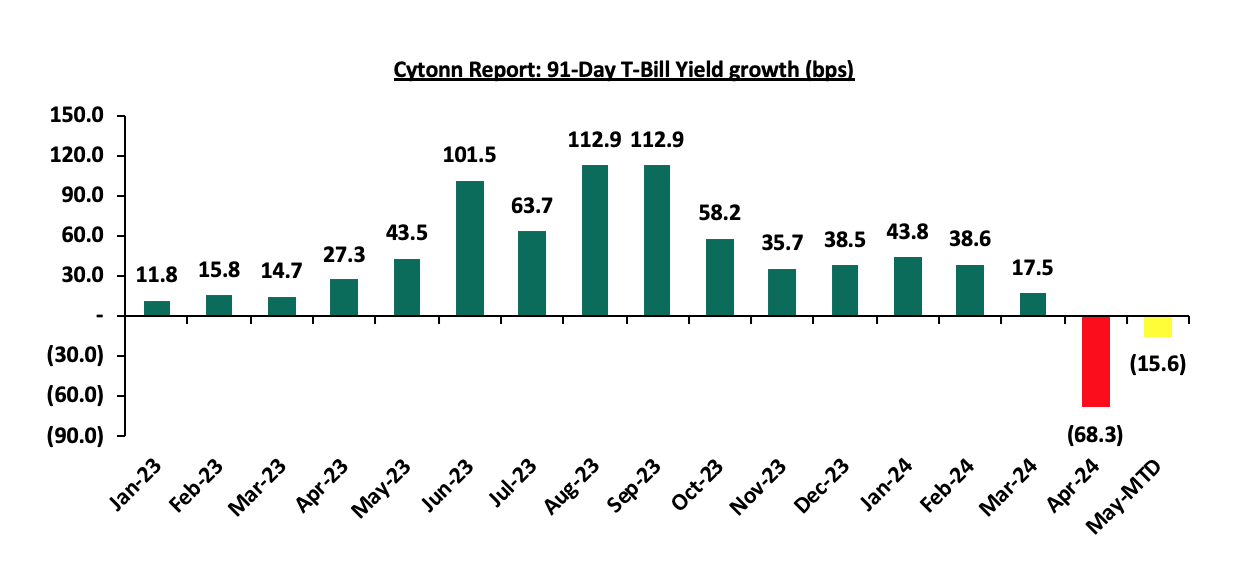
During the month of April 2024, T-bills were oversubscribed, with the overall average oversubscription rate coming in at 129.6%, higher than the oversubscription rate of 109.1% recorded in March 2024. The overall average subscription rates for the 364-day and 182-day papers increased to 140.3% and 78.0%, from 81.5% and 51.1% respectively, while the overall average subscription rates for the 91-day paper decreased to 231.9% from 323.1%, which was recorded in March 2024. The average yields on the government papers were on a downward trajectory in the month, with the 364-day, 182-day, and 91-day papers yields decreasing by 35.8 bps, 21.8 bps, and 68.3 bps to 16.6%, 16.7%, and 16.0% respectively from 17.0%, 16.9%, and 16.7% recorded the previous month. For the month of April, the government accepted a total of Kshs 121.2 bn of the Kshs 124.4 bn worth of bids received, translating to an acceptance rate of 97.4%. The chart below shows the yield growth rate for the 91-day paper during the year:
This week, T-bills were oversubscribed for the first time in two weeks, with the overall oversubscription rate coming in at 108.2%, a reversal from the undersubscription rate of 98.2% recorded the previous week. Investors’ preference for the shorter 91-day paper persisted, with the paper receiving bids worth Kshs 10.1 bn against the offered Kshs 4.0 bn, translating to an oversubscription rate of 252.6%, higher than the oversubscription rate of 149.6% recorded the previous week. The subscription rates for the 182-day paper decreased to 52.0% from 69.3% recorded the previous week, while the subscription rate for the 364-day paper increased marginally to 106.6% from 106.4% recorded the previous week. The government accepted a total of Kshs 25.8 bn worth of bids out of Kshs 26.0 bn of bids received, translating to an acceptance rate of 99.5%. The yields on the government papers were on an upward trajectory, with the yields on the 364-day, 182-day, and 91-day papers increasing by 0.3 bps, 2.7 bps, and 4.2 bps to 16.50%, 16.49%, and 15.87% from 16.49%, 16.46, and 15.82% respectively recorded the previous week.
So far in the current FY’2023/24, government securities totalling Kshs 1,651.0 bn have been advertised. The government has accepted bids worth Kshs 1,948.3 bn, of which Kshs 1,251.2 bn and Kshs 697.1 bn were treasury bills and bonds, respectively. Total redemptions so far in FY’2023/24 equal to Kshs 1,511.7 bn, with treasury bills accounting for Kshs 135.4 bn and bonds accounting for Kshs 157.3 bn. As a result, the government has a domestic borrowing surplus of Kshs 436.6 bn in FY’2023/24.
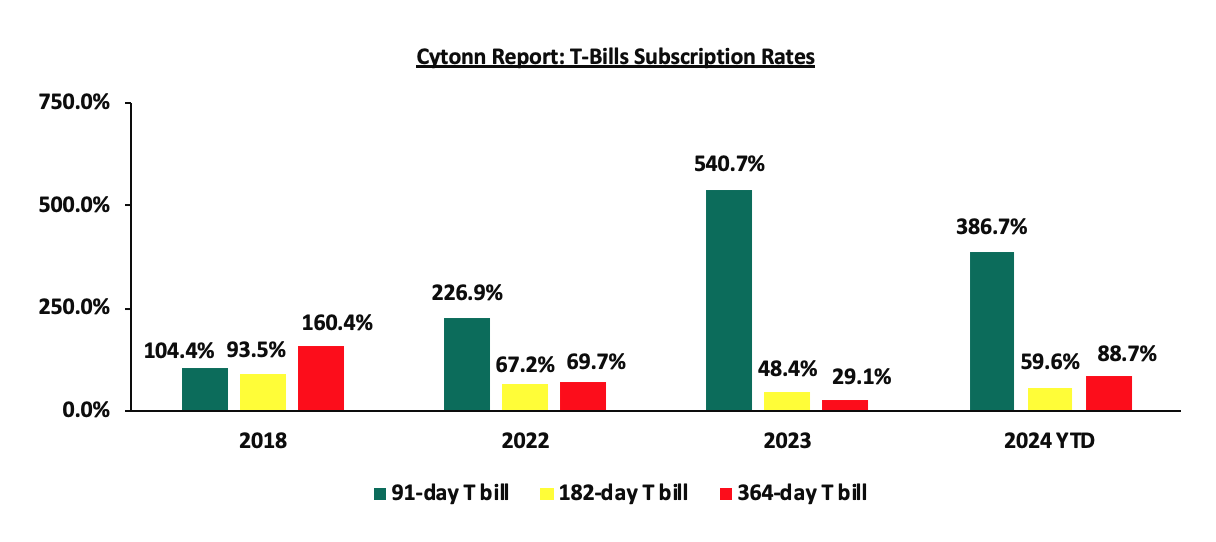
The chart below compares the overall average T-bill subscription rates obtained in 2018, 2022, 2023, and 2024 Year to Date (YTD):
Additionally, April 2024 bonds were oversubscribed, with the overall oversubscription rate coming in at 146.1%, higher than the oversubscription rate of 128.5% recorded in March 2024. The tap sales issues for the FXD1/2023/005 and FXD1/2024/010 received bids worth Kshs 47.8 bn against the offered Kshs 25.0 bn, translating to an oversubscription rate of 191.2%, with the government accepting bids worth Kshs 45.8 bn, translating to an acceptance rate of 95.9%. Moreover, the reopened bond FXD1/2023/02 received bids worth Kshs 47.2 bn against the offered Kshs 40.0 bn translating to an oversubscription rate of 118.0%, with the government accepting bids worth Kshs 34.8 bn, translating to an acceptance rate of 73.7%:
|
Cytonn Report: T-Bond Issues in March and April 2024 |
|||||||||
|
Issue Date |
Bond Auctioned |
Effective Tenor to Maturity (Years) |
Coupon |
Amount offered (Kshs bn) |
Actual Amount Raised/Accepted (Kshs bn) |
Total bids received (Subscription) |
Average Accepted Yield |
Subscription Rate |
Acceptance Rate |
|
11/3/2024 |
FXD1/2024/003 |
2.8 |
18.4% |
40.0 |
34.3 |
43.1 |
18.4% |
107.7% |
79.6% |
|
25/3/2024 |
FXD1/2023/005-Re-opened |
4.3 |
16.8% |
40.0 |
17.8 |
35.8 |
18.4% |
89.6% |
49.6% |
|
FXD1/2024/010-New |
10.0 |
16.0% |
4.8 |
23.9 |
16.5% |
59.7% |
20.3% |
||
|
4/4/2024 |
FXD1/2023/005 - Tapsale |
4.5 |
16.8% |
25.0 |
45.8 |
47.8 |
18.4% |
191.2% |
95.9% |
|
FXD1/2024/010 - Tapsale |
10.0 |
16.0% |
16.5% |
||||||
|
22/4/2024 |
FXD1/2023/002-Reopened |
1.4 |
17.0% |
40.0 |
34.8 |
47.2 |
17.0% |
118.0% |
73.7% |
|
Apr 2024 Average |
|
5.3 |
16.6% |
65.0 |
80.6 |
95.0 |
17.3% |
146.1% |
84.9% |
|
Mar 2024 Average |
|
5.7 |
17.1% |
80.0 |
56.9 |
102.8 |
17.8% |
128.5% |
55.3% |
|
2023 Average |
|
6.1 |
14.8% |
740.3 |
735.2 |
872.4 |
15.5% |
117.8% |
82.0% |
Source: Central Bank of Kenya (CBK)
During the week, the government released the auction results for the re-opened FXD1/2024/10 with a tenor of 9.9 years and a fixed coupon rate of 16.0%. The bond was undersubscribed with the overall subscription rate coming in at 59.9%, receiving bids worth Kshs 15.0 bn against the offered Kshs 25.0 bn. The government accepted bids worth Kshs 11.0 bn, translating to an acceptance rate of 73.4%. The weighted average yield of accepted bids came in at 16.2% which was within our expected range of 15.85% - 16.25%, and lower than the 16.5% recorded at issue in March. With the Inflation rate at 5.0% as of April 2024, the real return of the bonds is 11.2%.
Secondary Bond Market:
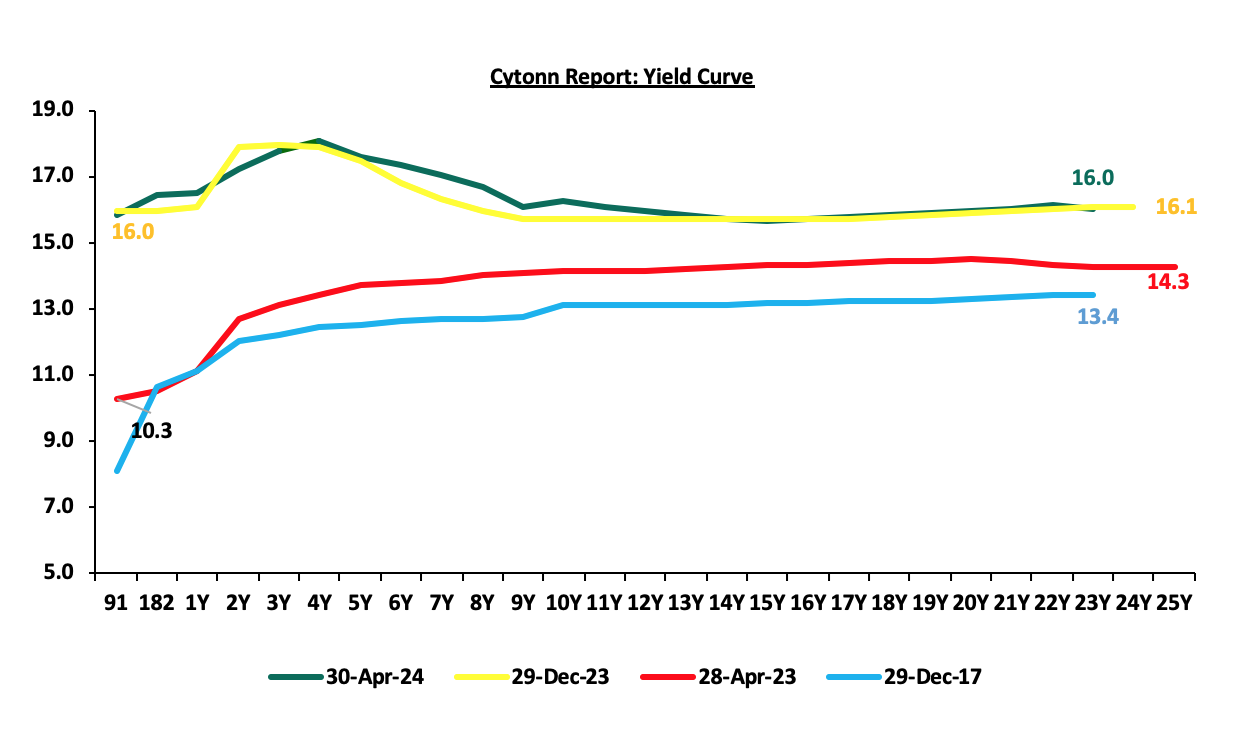
The yields on the government securities were on an upward trajectory during the month compared to the same period in 2023. We observe a humped yield curve for the medium-term bonds in the 3 to 10-year maturity range, an indication of the prevailing uncertainty in the market regarding both medium-term interest rates and inflation. Investors, apprehensive about the economic outlook in the near to medium term, are demanding higher yields for bonds in the 3 to 10-year maturity range to compensate for the perceived risks as they anticipate potential fluctuations in economic conditions in the Kenyan market on the back of the government’s debt sustainability concerns. The chart below shows the yield curve movement during the period:
The secondary bond turnover decreased by 26.7% to Kshs 92.1 bn, from Kshs 125.7 bn recorded in March 2024, pointing towards decreased activities by commercial banks in the secondary bonds market for the month of April. However, on a year-on-year basis, the bond turnover increased significantly by 138.0% from Kshs 38.7 bn worth of treasury bonds transacted over a similar period last year.
Money Market Performance:
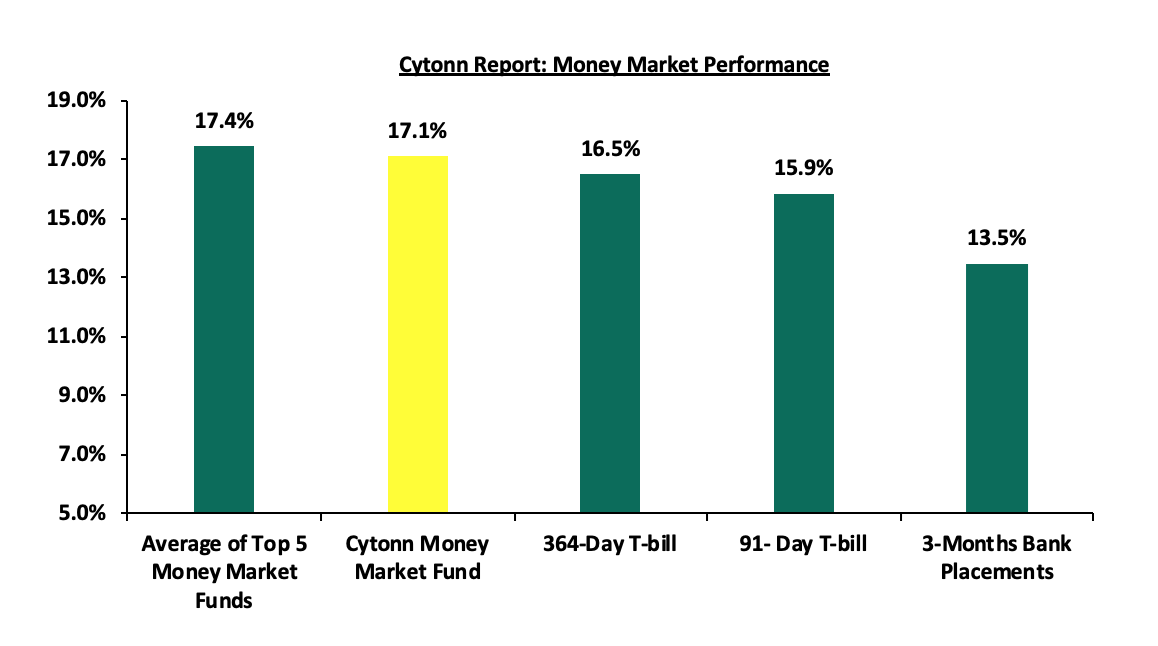
In the money markets, 3-month bank placements ended the week at 13.5% (based on what we have been offered by various banks), while the yield on the 364-day and 91-day papers increased by 0.3 bps and 4.2 bps to 16.5% and 15.9% respectively. The yield of Cytonn Money Market Fund increased by 10.0 bps to close the week at 17.1%, from 17.0% recorded the previous week, and the average yields on the Top 5 Money Market Funds decreased by 2.8 bps to 17.4% from 17.5% recorded the previous week, as shown below:
The table below shows the Money Market Fund Yields for Kenyan Fund Managers as published on 3rd May 2024:
|
Cytonn Report: Money Market Fund Yield for Fund Managers as published on 3rd May 2024 |
||
|
Rank |
Fund Manager |
Effective Annual |
|
1 |
Lofty-Corban Money Market Fund |
18.27% |
|
2 |
Etica Money Market Fund |
18.21% |
|
3 |
Cytonn Money Market Fund (Dial *809# or download the Cytonn app) |
17.13% |
|
4 |
GenAfrica Money Market Fund |
16.93% |
|
5 |
Nabo Africa Money Market Fund |
16.66% |
|
6 |
Apollo Money Market Fund |
16.37% |
|
7 |
Kuza Money Market fund |
16.18% |
|
8 |
Enwealth Money Market Fund |
16.17% |
|
9 |
KCB Money Market Fund |
15.89% |
|
10 |
Madison Money Market Fund |
15.68% |
|
11 |
Mali Money Market Fund |
15.54% |
|
12 |
Jubilee Money Market Fund |
15.41% |
|
13 |
Absa Shilling Money Market Fund |
15.40% |
|
14 |
Co-op Money Market Fund |
15.33% |
|
15 |
GenCap Hela Imara Money Market Fund |
15.33% |
|
16 |
AA Kenya Shillings Fund |
15.20% |
|
17 |
Sanlam Money Market Fund |
15.12% |
|
18 |
Mayfair Money Market Fund |
14.86% |
|
19 |
Equity Money Market Fund |
14.68% |
|
20 |
Dry Associates Money Market Fund |
13.83% |
|
21 |
Old Mutual Money Market Fund |
13.52% |
|
22 |
CIC Money Market Fund |
13.24% |
|
23 |
Orient Kasha Money Market Fund |
13.23% |
|
24 |
ICEA Lion Money Market Fund |
12.37% |
|
25 |
British-American Money Market Fund |
9.44% |
Source: Business Daily
Liquidity:
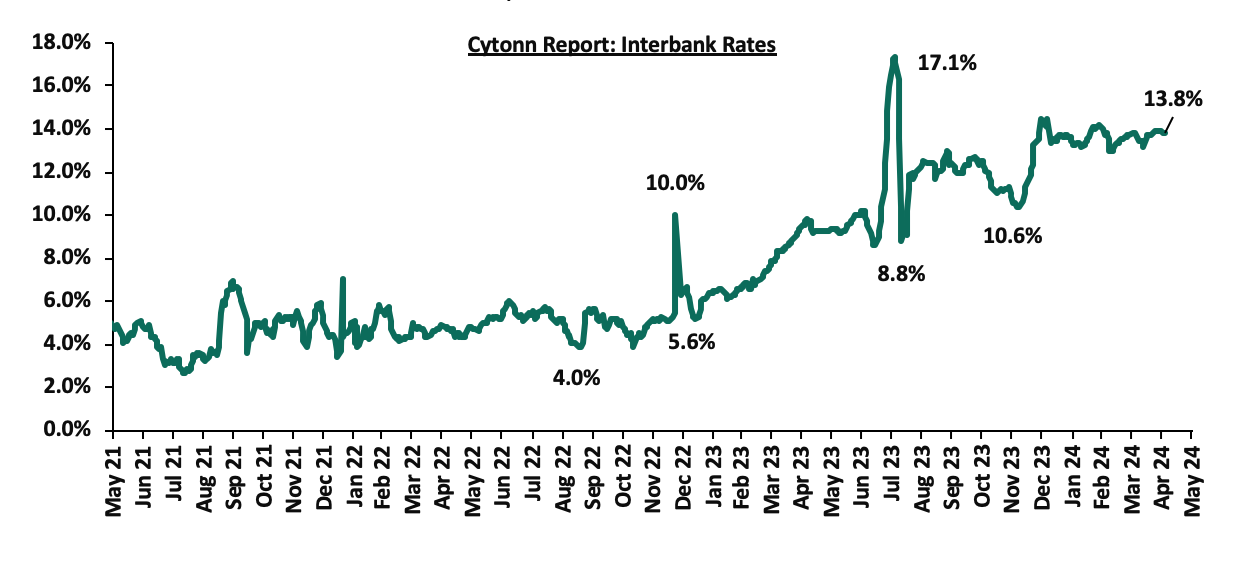
Liquidity in the money markets tightened in the month of April 2024, with the average interbank rate increasing by 23.0 bps to 13.7% from 13.5% recorded the previous month. During the month of April, the average interbank volumes traded decreased by 16.4% to Kshs 22.4 bn, from Kshs 26.7 bn recorded in March. Also, during the week, liquidity in the money markets marginally eased, with the average interbank rate decreasing by 1.2 bps to remain relatively unchanged from 13.9% recorded the previous week, partly attributable to government payments that offset tax remittances. The average interbank volumes traded increased by 30.9% to Kshs 27.2 bn, from Kshs 20.8 bn recorded the previous week. The chart below shows the interbank rates in the market over the years:
Kenya Eurobonds:
During the month, the yields on the Eurobonds were on an upward trajectory, with the yield on the 30-year Eurobond issued in 2018 increasing the most by 0.7% points to 10.0% from 9.3% recorded at the end of March 2024. Also, during the week, the yields on Eurobonds recorded a mixed performance, with the yield on the 10-year Eurobond issued in 2018 recording the largest increase of 9.0 bps to 9.2%, from 9.1% the previous week, while the 7-year Eurobond issued in 2019 decreased most by 5.0 bps to remain relatively unchanged at 9.1% recorded the previous week. The table below shows the summary of the yield performance of the Kenyan Eurobonds as of 2nd May 2024;
|
Cytonn Report: Summary Yield Performance of Kenya Eurobonds |
||||||
|
|
2018 |
2019 |
2021 |
2024 |
||
|
Date |
10-year issue |
30-year issue |
7-year issue |
12-year issue |
13-year issue |
6-year issue |
|
1-Jan-24 |
9.8% |
10.2% |
10.1% |
9.9% |
9.5% |
|
|
29-Mar-24 |
8.7% |
9.3% |
8.4% |
9.3% |
9.3% |
9.2% |
|
25-Apr-24 |
9.1% |
10.1% |
9.1% |
9.8% |
9.9% |
9.8% |
|
26-Apr-24 |
9.1% |
10.0% |
9.0% |
9.7% |
9.8% |
9.7% |
|
29-Apr-24 |
8.9% |
9.9% |
8.9% |
9.6% |
9.6% |
9.5% |
|
30-Apr-24 |
9.1% |
10.0% |
9.1% |
9.8% |
9.8% |
9.7% |
|
1-May-24 |
9.3% |
10.2% |
9.3% |
10.0% |
10.0% |
10.0% |
|
2-May-24 |
9.2% |
10.1% |
9.1% |
9.9% |
9.9% |
9.8% |
|
Weekly Change |
0.1% |
0.0% |
(0.1%) |
0.1% |
0.0% |
0.1% |
|
MTM Change |
0.4% |
0.7% |
0.6% |
0.5% |
0.5% |
0.5% |
|
YTD Change |
(0.6%) |
(0.1%) |
(1.0%) |
(0.0%) |
0.4% |
9.8% |
Source: Central Bank of Kenya (CBK) and National Treasury
Kenya Shilling:
During the month, the Kenya Shilling depreciated by 1.1% against the US Dollar, to close the month at Kshs 133.3, from Kshs 131.8 recorded at the end of March 2024. Also, during the week, the Kenya Shilling gained by 0.3% against the US Dollar to close at Kshs 133.1 from the Kshs 133.5 recorded the previous week. On a year-to-date basis, the shilling has appreciated by 15.2% against the US Dollar, a sharp contrast to the 26.8% depreciation recorded in 2023.
We expect the shilling to be supported by:
- Diaspora remittances standing at a cumulative USD 4,380.5 mn in the 12 months to March 2024, 9.0% higher than the USD 4,019.6 mn recorded over the same period in 2023, which has continued to cushion the shilling against further depreciation. In the March 2024 diaspora remittances figures, North America remained the largest source of remittances to Kenya accounting for 56.2% in the period, and,
- The tourism inflow receipts which came in at USD 352.5 bn in 2023, a 31.5% increase from USD 268.1 bn inflow receipts recorded in 2022, and owing to tourist arrivals that improved by 27.6% to 182,000 in the 12 months to January 2024, from 151,000 recorded during a similar period in 2023.
The shilling is however expected to remain under pressure in 2024 as a result of:
- An ever-present current account deficit which came at 3.5% of GDP in Q3’2023 from 6.4% recorded in a similar period in 2022,
- The need for government debt servicing, continues to put pressure on forex reserves given that 67.5% of Kenya’s external debt was US Dollar denominated as of September 2023, and,
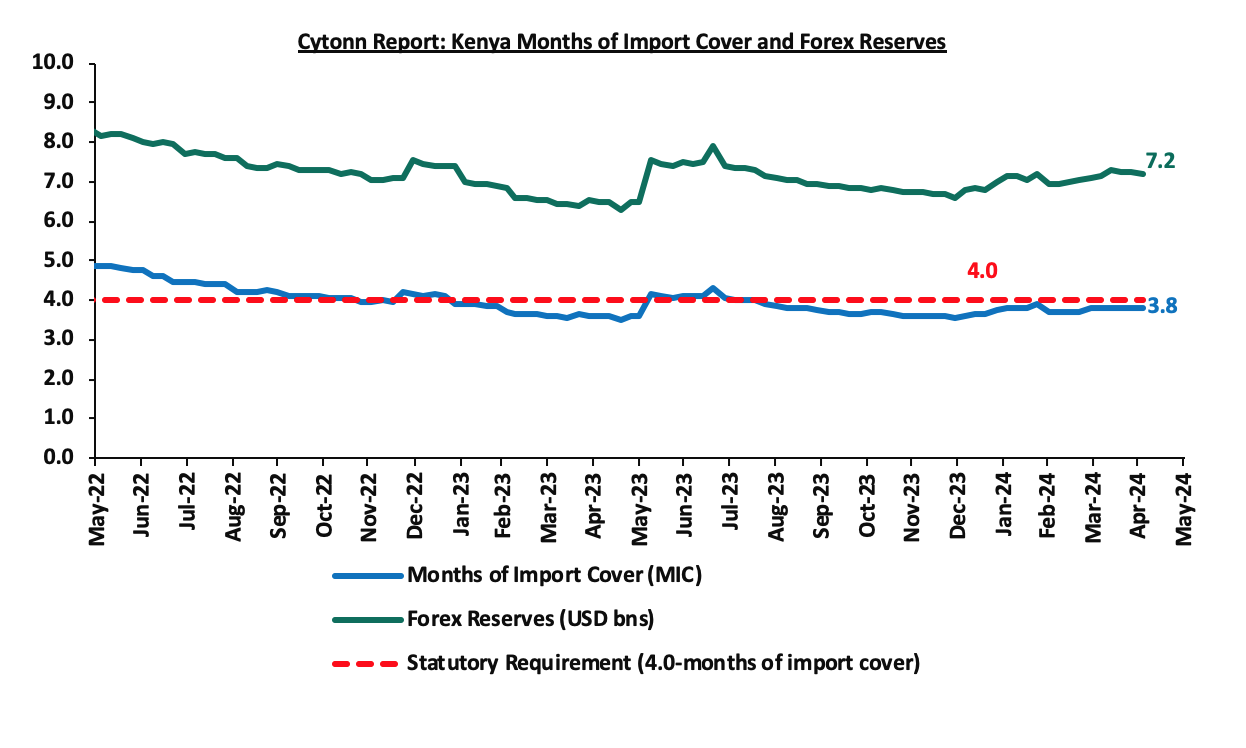
- Dwindling forex reserves, currently at USD 7.2 bn (equivalent to 3.8 months of import cover), which is below the statutory requirement of maintaining at least 4.0 months of import cover.
Key to note, Kenya’s forex reserves decreased by 0.7% during the week to remain relatively unchanged at USD 7.2 bn recorded the previous week, equivalent to 3.8 months of import cover, and remained below the statutory requirement of maintaining at least 4.0 months of import cover. The chart below summarizes the evolution of Kenya’s months of import cover over the years:
Weekly Highlights:
- April 2024 Inflation:
During the week, the Kenya National Bureau of Statistics released data for the y/y inflation rates for the Month of April. Inflation in the month eased by 0.7% points to 5.0%, from the 5.7% recorded in March 2024. This was in line with our expectations of a decrease, but slightly below our projection that it would come within a range of 5.3% to 5.7%. The headline inflation in April 2024 was majorly driven by increase in prices of commodities in the following categories: Transport; Food and Non-Alcoholic Beverages; and Housing, Water, Electricity, Gas, and other fuels by 9.2%, 5.6%, and 3.8%, respectively. The table below shows a summary of both the year-on-year and month-on-month commodity indices performance:
|
Cytonn Report: Major Inflation Changes – 2024 |
||
|
Broad Commodity Group |
Price change y/y (April 2024/April 2023) |
Reason |
|
Transport cost |
9.2% |
The y/y increase in the transport Index was recorded majorly due to the increase in prices of diesel and petrol by 11.2% and 8.0% respectively |
|
Food and Non-Alcoholic Beverages |
5.6% |
The y/y increase was mainly driven by the increase in prices of commodities such as tomatoes, sugar, and potatoes by 10.8%, 9.2%, and 5.3%, respectively. However, the increase was weighed down by the decrease in prices of maize flour-sifted, maize grain-loose, and wheat flour-white by 23.7%, 20.1%, and 4.9%, respectively |
|
Housing, Water, Electricity, Gas and other fuels |
3.8% |
The y/y performance was mainly driven by the decrease in prices of Electricity of 50kWh and 200kWh by 1.0% and 0.8% respectively. However, there was an increase in the price of kerosene per litre and gas/LPG by 16.6% and 3.4% |
|
Overall Inflation |
5.0% |
The y/y increase was mainly on the back of the 9.2% increase in Transport costs |
Notably, April’s overall headline inflation was on the decline for the third consecutive month and is within the CBK’s preferred target of 5.0% and below for the first time since October 2020 and has remained within the Central Bank of Kenya (CBK) target range of 2.5% to 7.5% for the tenth consecutive month. The decrease in headline inflation in April 2024 comes following the decline in the Super Petrol, Diesel, and Kerosene prices, having decreased by Kshs 5.3, Kshs 10.0, and Kshs 18.7 each respectively, and retailed at Kshs 193.8, Kshs 180.4 and Kshs 170.0 per litre respectively, for the period between 15th April 2024 to 14th May 2024. The chart below shows the inflation rates for the past 5 years:
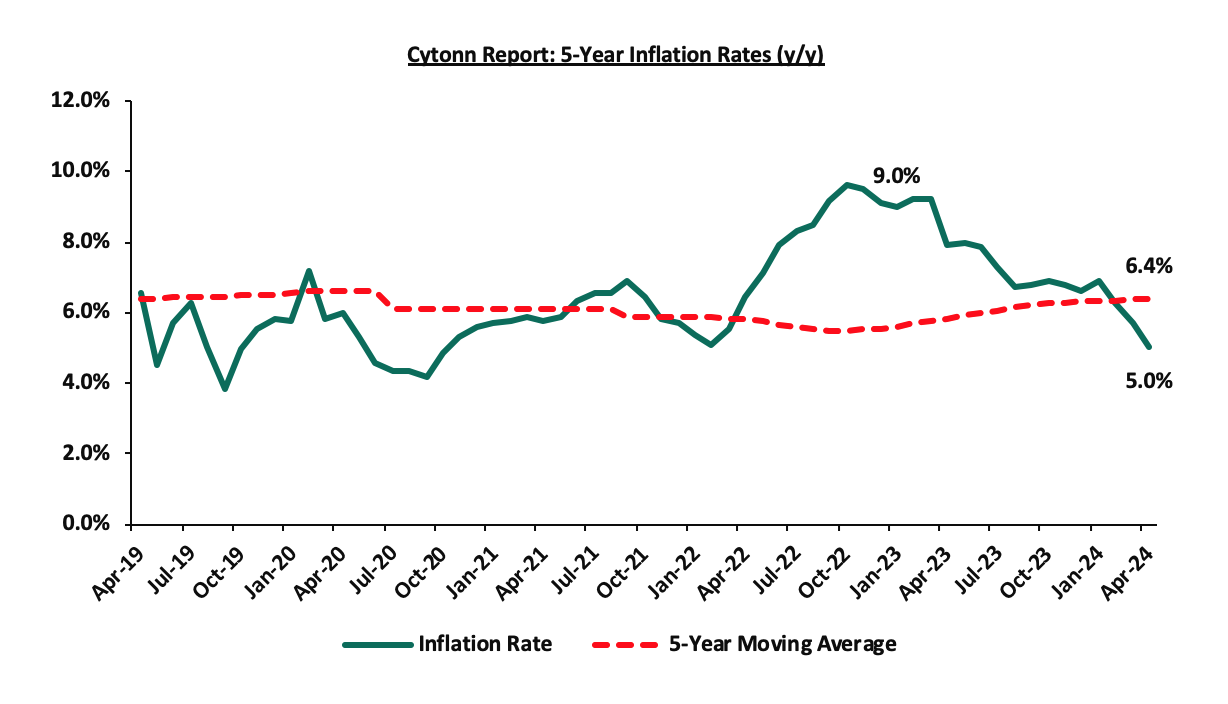
Going forward, we expect inflation to remain within the CBK’s preferred range of 2.5%-7.5%, mainly on the back of a strengthened currency, tight monetary policy, reduced fuel prices, and reduced electricity prices. The risk, however, lies in the fuel prices which despite their decline in April 2024, still remain elevated compared to historical levels, coupled with an upward trend in international fuel prices, owing to geo-political pressures. Key to note is that the Monetary Policy Committee maintained the Central Bank Rate at 13.0% in April 2024, with the aim of anchoring the inflation rate, and is expected to meet again in June 2024. In our view, the rate will be pegged on whether the shilling will sustain its appreciation against the dollar, resulting in a decline in the import bill and costs passed to consumers through hiked consumer prices.
- FY’2024/25 Budget Estimates
During the week, the National Treasury presented its Budget Estimates for the next fiscal year, FY’2024/25. Notably, the budget estimates recorded a 6.4% decrease to Kshs 3.9 tn from the previous estimates of Kshs 4.2 tn in the Budget Policy Statement for FY’2024/25 and a 2.2% increase from the Kshs 3.8 tn in FY’2023/24 as per Supplementary Budget II. Additionally, revenue is set to increase by 16.2% to Kshs 3.4 tn in FY’2024/25 from Kshs 2.9 tn in FY’2023/24. Furthermore, the allocation of resources has been aligned to priority programs and sectors under the Bottom-Up Economic Transformation Agenda, and the Medium-Term Revenue Strategy FY’2024/25-FY’2026/27. This is to ensure spending is directed towards the most critical needs considering the available resources.
Below is a summary of the major changes as per the FY’2024/25 Budget Estimates:
|
Cytonn Report: Budget Estimates FY’2024/25 – FY’2023/2024 Comparison |
|||||
|
FY'2022/2023 Budget Outturn |
FY'2023/2024 Supplementary II Estimates (a) |
FY'2024/2025 BPS |
FY'2024/2025 Budget Estimates (b) |
% change |
|
|
2023/24 to 2024/25 (a/b) |
|||||
|
Total revenue |
2,360.5 |
2,886.1 |
3,435.0 |
3,354.2 |
16.2% |
|
External grants |
23.1 |
42.8 |
49.3 |
51.8 |
21.0% |
|
Total revenue & external grants |
2,383.6 |
2,928.9 |
3,484.3 |
3,406.0 |
16.3% |
|
Recurrent expenditure |
2,311.6 |
2,762.6 |
2,859.3 |
2,781.7 |
0.7% |
|
Development expenditure & Net Lending |
493.7 |
649.8 |
877.8 |
687.9 |
5.9% |
|
County governments + contingencies |
415.8 |
423.9 |
451.1 |
451.1 |
6.4% |
|
Total expenditure |
3,221.0 |
3,837.5 |
4,188.2 |
3,920.7 |
2.2% |
|
Fiscal deficit including grants |
837.4 |
908.6 |
703.9 |
514.7 |
(43.4%) |
|
Deficit as % of GDP |
5.9% |
5.6% |
3.9% |
2.9% |
(2.7%) |
|
Net foreign borrowing |
310.8 |
501.6 |
326.1 |
256.8 |
(48.8%) |
|
Net domestic borrowing |
459.5 |
407 |
377.7 |
257.9 |
(36.6%) |
|
Total borrowing |
770.3 |
908.6 |
703.9 |
514.7 |
(43.4%) |
|
GDP Estimate |
14,274.4 |
16,131.5 |
18,015.2 |
18,015.2 |
11.7% |
Source: National Treasury, Amounts in Kshs bns
Some of the key take-outs include;
- The FY’2024/25 Budget Estimates point to a 2.2% increase of the budget, to Kshs 3.9 tn from Kshs 3.8 tn in the FY’2023/24 supplementary Budget II,
- Recurrent expenditure is set to increase by 0.7% to Kshs 2.78 tn, from Kshs 2.76 tn as per the supplementary Budget II, while development expenditure is projected to increase by 5.9% to Kshs 687.9 bn from Kshs 649.8 bn as per the FY’2023/24 Supplementary Budget II. Under recurrent expenditures, interest payments expenditures increased by 18.3% to Kshs 1,009.9 bn, from Kshs 853.7 bn, while pension expenditures increased by 6.7% to Kshs 169.2 bn from Kshs 158.6 bn in the FY’2023/24 Supplementary Budget II,
- The budget deficit is projected to decline to Kshs 514.7 bn (2.9% of GDP) from the projected Kshs 703.9 bn (3.9% of GDP) in the FY’2023/24 Supplementary Budget II; in line with the International Monetary Fund’s (IMF’s) recommendation, in a bid to reduce Kenya’s public debt requirements,
- Revenue is projected to increase by 16.2% to Kshs 3.4 tn, from Kshs 2.9 tn in the FY’2023/24 Supplementary Budget II, with measures already in place to work towards increasing the amount of revenue collected in the next fiscal year,
- Total borrowing is expected to decline by 43.4% to Kshs 514.7 bn from Kshs 908.6 bn as per the FY’2023/24 Supplementary Budget II, in a bid to reduce Kenya’s public debt burden which is estimated at 67.2% of GDP currently, 12.2% points above the East African Community (EAC) Monetary Union Protocol, the World Bank Country Policy and Institutional Assessment Index, and the IMF threshold of 55.0%, and,
Debt financing of the 2024/25 budget is estimated to consist of 49.9% foreign debt and 50.1% domestic debt, from 55.2% foreign and 44.8% domestic as per the FY’2023/24 Supplementary Budget. For more information, see the FY’2024/25 Budget Estimates Note.
Monthly Highlights:
- During the month, The Monetary Policy Committee (MPC) met on April 3, 2024, to review the outcome of its previous policy decisions against a backdrop of an improved global outlook for growth and inflation, despite persistent geopolitical tensions. The MPC decided to maintain the CBR at 13.00%, which was in line with our expectations. Please see our Cytonn Weekly #14/2024.
- During the month, Stanbic Bank released its monthly Purchasing Manager's Index (PMI) highlighting that the index for the month of March 2024 declined, coming in at 49.7, down from 51.3 in February 2024. Please see our Cytonn Weekly #14/2024.
- During the month, the Energy and Petroleum Regulatory Authority (EPRA) released their monthly statement on the maximum retail fuel prices in Kenya, effective from 15th April 2024 to 14th May 2024. Notably, the maximum allowed price for Super Petrol, Diesel and Kerosene decreased by Kshs 5.3, Kshs 10.0, and Kshs 18.7 each respectively, and will retail at Kshs 193.8, Kshs 180.4 and Kshs 170.0 per litre respectively from the March 2024 prices of Kshs 199.2, Kshs 190.4, and Kshs 188.7 respectively. Please see our Cytonn Weekly #16/2024.
- During the month, the National Treasury gazetted the revenue and net expenditures for the ninth month of FY’2023/2024, ending 28th March 2024, highlighting that the total revenue collected as at the end of March 2024 amounted to Kshs 1,589.7 bn, equivalent to 61.7% of the revised estimates of Kshs 2,576.8 bn for FY’2023/2024 and is 82.3% of the prorated estimates of Kshs 1,932.6 bn.
- During the month, we released our projection for the the y/y inflation rate for April 2024 to come in at the range of 4% - 5.7% mainly on the back of reduced fuel prices in April, the maintenance of the Central Bank Rate at 13.0% in the latest MPC meeting and reduced electricity prices. Please see our Cytonn Weekly #17/2024.
Rates in the Fixed Income market have been on an upward trend given the continued high demand for cash by the government and the occasional liquidity tightness in the money market. The government is 26.0% ahead of its prorated net domestic borrowing target of Kshs 346.6 bn, having a net borrowing position of Kshs 436.6 bn out of the domestic net borrowing target of Kshs 407.0 bn for the FY’2023/2024. However, we expect a downward readjustment of the yield curve in the short and medium term, with the government looking to increase its external borrowing to sustain its spending, hence alleviating pressure in the domestic market. As such, we expect the yield curve to normalize in the medium to long-term and hence investors are expected to shift towards the long-term papers to lock in the high returns.
Market Performance:
During the month of April 2024, the equities market was on a downward trajectory, with NASI declining the most by 5.8%, while NSE 25, NSE 10, and NSE 20 declined by 4.2%, 3.7% and 3.5% respectively. The equities market performance was driven by losses recorded by large-cap stocks such as Cooperative Bank, Standard Chartered Bank, and Safaricom of 17.0%, 15.3%, and 10.1% respectively. The losses were, however, mitigated by gains recorded by large-cap stocks such as EABL, Bamburi, and NCBA of 22.2%, 2.1%, and 1.1% respectively.
During the week, the equities market was on a downward trajectory, with NSE 10 declining the most by 4.5%, while NSE 25, NASI, and NSE 20 declined by 3.4%, 2.7%, and 2.4% respectively, taking the YTD performance to gains of 17.9%, 15.7%, 13.8% and 9.2% for NSE 10, NSE 25, NASI and NSE 20 respectively. The equities market performance was driven by losses recorded by large-cap stocks such as Cooperative Bank, NCBA, and ABSA Group of 12.9%, 10.7%, and 10.5% respectively. The losses were, however, mitigated by gains recorded by large-cap stocks such as Bamburi and Stanbic of 5.2%, and 1.1% respectively.
Equities turnover decreased by 32.9% in the month of April to USD 55.8 mn, from USD 83.1 mn recorded in March 2024. Foreign investors became net buyers, with a net buying position of USD 8.0 mn, from a net selling position of USD 9.0 mn recorded in March 2024.
During the week, equities turnover decreased by 55.6% to USD 4.9 mn from USD 11.0 mn recorded the previous week, taking the YTD total turnover to USD 187.3 mn. Foreign investors remained net buyers for the fourth consecutive week with a net buying position of USD 1.6 mn, from a net buying position of USD 4.7 mn recorded the previous week, taking the YTD foreign net selling position to USD 8.5 mn.
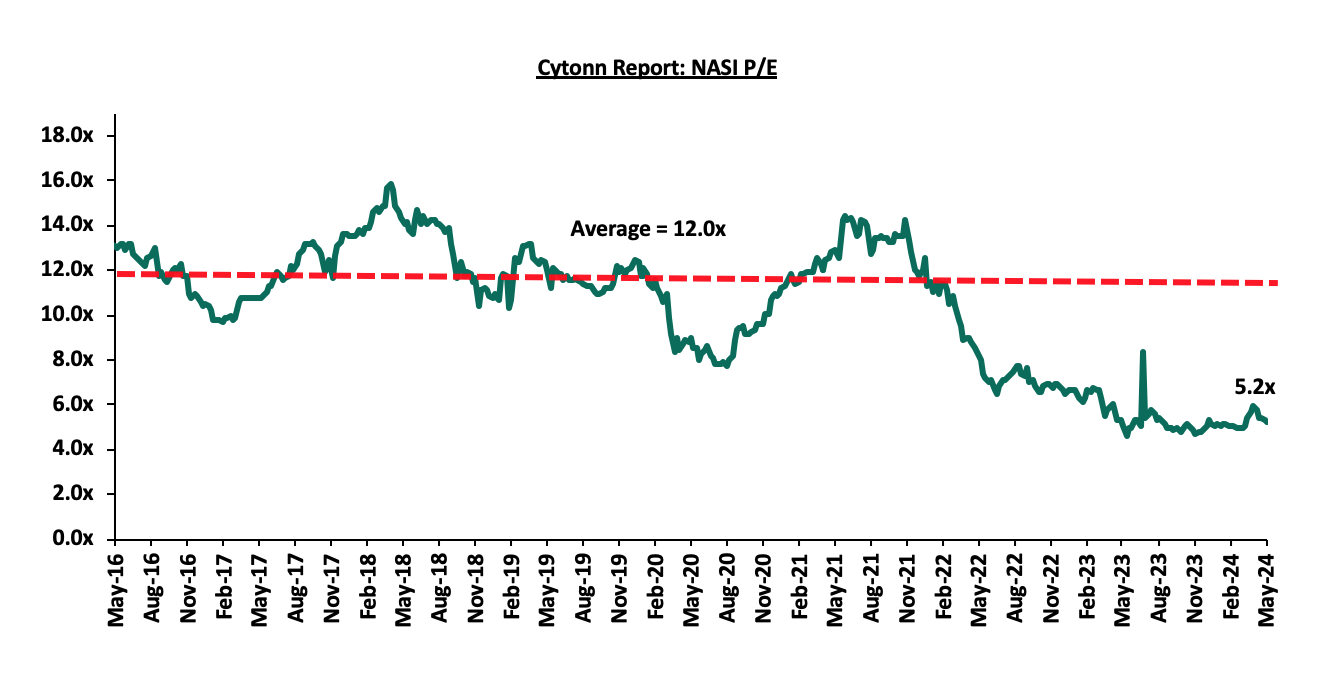
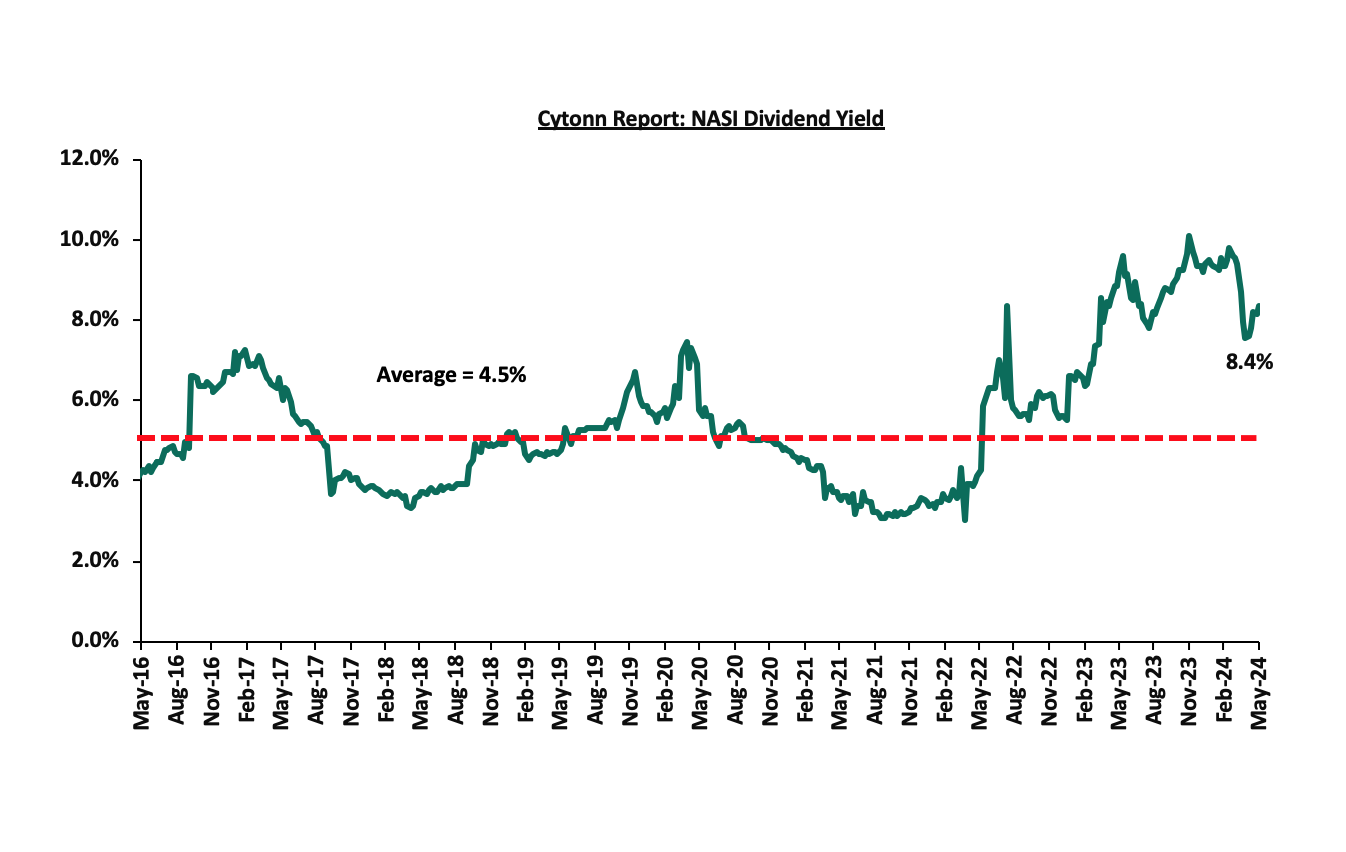
The market is currently trading at a price-to-earnings ratio (P/E) of 5.2x, 56.5% below the historical average of 12.0x. The dividend yield stands at 8.4%, 3.9% points above the historical average of 4.5%. Key to note, NASI’s PEG ratio currently stands at 0.6x, an indication that the market is undervalued relative to its future growth. A PEG ratio greater than 1.0x indicates the market is overvalued while a PEG ratio less than 1.0x indicates that the market is undervalued. The charts below indicate the historical P/E and dividend yields of the market;
Universe of Coverage:
|
Cytonn Report: Equities Universe of Coverage |
|||||||||||
|
Company |
Price as at 26/04/2024 |
Price as at 03/05/2024 |
w/w change |
m/m change |
YTD Change |
Year Open 2024 |
Target Price* |
Dividend Yield |
Upside/ Downside** |
P/TBv Multiple |
Recommendation |
|
Co-op Bank*** |
14.0 |
12.2 |
(1.2%) |
(9.8%) |
24.4% |
11.4 |
19.2 |
12.3% |
69.7% |
0.6x |
Buy |
|
ABSA Bank*** |
13.4 |
12.0 |
(0.4%) |
(3.8%) |
(1.6%) |
11.6 |
17.3 |
13.0% |
57.7% |
0.9x |
Buy |
|
NCBA*** |
44.1 |
39.4 |
(0.3%) |
(15.3%) |
7.0% |
38.9 |
55.2 |
12.1% |
52.4% |
0.7x |
Buy |
|
Equity Group*** |
43.1 |
42.6 |
(1.5%) |
(12.7%) |
3.2% |
34.2 |
60.2 |
9.4% |
50.9% |
0.8x |
Buy |
|
Jubilee Holdings |
182.8 |
182.0 |
0.0% |
(9.1%) |
11.7% |
185.0 |
260.7 |
6.6% |
49.8% |
0.3x |
Buy |
|
Standard Chartered*** |
172.0 |
171.5 |
4.3% |
(16.8%) |
3.2% |
160.3 |
225.2 |
16.9% |
48.2% |
1.1x |
Buy |
|
Kenya Reinsurance |
1.9 |
1.9 |
1.1% |
(0.8%) |
11.8% |
1.9 |
2.5 |
10.5% |
41.9% |
0.2x |
Buy |
|
Diamond Trust Bank*** |
50.0 |
50.0 |
(1.2%) |
(8.0%) |
8.7% |
44.8 |
65.2 |
10.0% |
40.4% |
0.2x |
Buy |
|
I&M Group*** |
17.3 |
18.0 |
(2.2%) |
(0.3%) |
34.4% |
17.5 |
22.5 |
14.2% |
39.2% |
0.4x |
Buy |
|
Stanbic Holdings |
117.3 |
118.5 |
(8.8%) |
(8.1%) |
8.4% |
106.0 |
145.3 |
13.0% |
35.6% |
0.8x |
Buy |
|
Sanlam |
6.6 |
6.5 |
(5.7%) |
2.2% |
(6.1%) |
6.0 |
8.8 |
0.0% |
35.2% |
1.8x |
Buy |
|
KCB Group*** |
30.2 |
29.5 |
3.8% |
3.3% |
41.5% |
22.0 |
37.2 |
0.0% |
26.1% |
0.5x |
Buy |
|
HF Group |
4.1 |
3.7 |
3.2% |
8.4% |
13.2% |
3.5 |
4.6 |
0.0% |
23.8% |
0.2x |
Buy |
|
CIC Group |
2.3 |
2.2 |
(1.2%) |
(9.8%) |
24.4% |
2.3 |
2.5 |
6.0% |
22.3% |
0.7x |
Buy |
|
Liberty Holdings |
5.3 |
5.5 |
(0.4%) |
(3.8%) |
(1.6%) |
3.9 |
6.1 |
6.8% |
18.6% |
0.4x |
Accumulate |
|
Britam |
5.6 |
5.8 |
(0.3%) |
(15.3%) |
7.0% |
5.1 |
6.5 |
0.0% |
11.7% |
0.8x |
Accumulate |
|
Target Price as per Cytonn Analyst estimates **Upside/ (Downside) is adjusted for Dividend Yield ***For Disclosure, these are stocks in which Cytonn and/or its affiliates are invested in |
|||||||||||
Monthly Highlights
- During the month, the board of directors of Bamburi Cement Plc announced a profit warning for the FY’2023, anticipating a decrease of at least 25.0% in net earnings compared to 2022. This decline was primarily attributed to one-off settlements of tax liabilities and legal disputes, notably in Hima Cement Limited, impacting the overall financial performance. For more details please see our Cytonn Weekly #14/2024,
- During the month, The Central Bank of Kenya (CBK) announced the cancellation of Bank of Kigali's (BoK) authority to operate a Representative Office in Kenya, effective April 2, 2024. BoK, headquartered in Kigali and was founded in 1966, opted for the voluntary termination of its Kenya presence as part of a strategic shift towards prioritizing digital service delivery channels. For more details please see our Cytonn Weekly #14/2024,
- During the month, Bamburi Cement Plc released their FY’2023 results, reporting a loss for the year of Kshs 0.4 bn, a significant 321.7% decline from the Kshs 0.2 bn profit after tax recorded in FY’2022. Profit from continued operations, however, increased by 160.7% to Kshs 0.7 bn from Kshs 0.3 bn recorded in FY’2022. Turnover increased by 6.3% to Kshs 22.0 bn from Kshs 20.7 bn in FY’2022, while total operating costs increased by 3.9% to Kshs 20.8 bn from Kshs 20.1 bn recorded in FY’2022. For more details please see our Cytonn Weekly #16/2024,
- Also, during the month, Liberty Kenya Holdings released their FY’2023 results, having fully implemented the new IFRS 17 reporting system. Liberty Kenya Holdings’ Profit After Tax (PAT) increased by 151.0% to Kshs 0.7 bn, from Kshs 0.3 bn recorded in FY’2022, mainly driven by a 148.6% increase in Net insurance income to Kshs 0.9 bn, from Kshs 0.4 bn in FY’2022, and supported by a 41.6% decrease in Net insurance expenses to Kshs 0.3 bn, from Kshs 0.6 bn in FY’2022. For more details please see our Cytonn Weekly #16/2024, and,
- During the month, Sanlam Kenya Holdings released their FY’2023 results, recording a 52.6% increase in Loss After Tax to Kshs 0.13 bn, from Kshs 0.08 bn recorded in FY’2022. The performance was mainly driven by a significant 417.6% increase in Net Expense from reinsurance contracts held to Kshs 1.2 bn, from Kshs 0.2 bn in FY’2022, coupled with the 16.5% decline in insurance revenue to Kshs 6.9 bn from Kshs 8.3 bn in FY’2022. For more details, please see our Cytonn Weekly #17/2024.
We are “Neutral” on the Equities markets in the short term due to the current tough operating environment and huge foreign investor outflows, and, “Bullish” in the long term due to current cheap valuations and expected global and local economic recovery. With the market currently being undervalued for its future growth (PEG Ratio at 0.6x), we believe that investors should reposition towards value stocks with strong earnings growth and that are trading at discounts to their intrinsic value. We expect the current high foreign investors’ sell-offs to continue weighing down the equities outlook in the short term.
- Statutory Review
During the month there was only one notable highlight;
- The Affordable Housing Regulations, 2024 were published for public participation by the State Department for Housing and Urban Development under the framework of the Affordable Housing Act, 2024 outlining crucial guidelines for the development, allocation, and management of affordable housing units. These regulations aim to provide guidance and establish procedures for the implementation of affordable housing initiatives in Kenya. For more information, please see our Cytonn Weekly #16/2024.
- Industry Reports
During the month, the following industry report was released and the key take-outs were as follows;
|
Cytonn Report: Notable Industry Reports During the Month of April 2024 |
|||
|
# |
Theme |
Report |
Key Take-outs |
|
1
|
Residential and Land Sectors |
House Price and Land Price Indices Q1’2024 Reports by Hass Consult |
|
Going forward, we anticipate positive growth and enhanced performance in Kenya's Real Estate sector. This optimistic outlook is primarily fueled by an increasing influx of visitors to the country, contributing to improved metrics in the hospitality industry, including higher room and bed occupancies. Additionally, there is expected to be sustained demand for Real Estate development. Nevertheless, challenges are foreseen in the form of escalated construction costs, attributed to the rise in inflation and more stringent lending prerequisites imposed on developers. Financial institutions, notably banks, are likely to insist on greater collateral due to perceived credit risks within the Real Estate sector. This could impede the sector's optimal performance. Indications of such challenges are evident in the 2.0% surge in gross Non-Performing Loans (NPLs) within the Real Estate sector reported by banks, rising to Kshs 97.9 bn in Q3’2023, from Kshs 96.0 bn in Q2’2022.
- Residential Sector
Notable highlights in the sector during the month include;
- President Ruto presided over the ground-breaking ceremony of the Naivasha Special Economic Zone (SEZ) Affordable Housing Project, which aims to construct 1,000 housing units. The project is located on a 1000-acre piece of land in Mahiu, Nakuru County, along the Nairobi-Naivasha Standard Gauge Railway (SGR) line, with 30 acres set aside for the Affordable Housing Program (AHP). For more information, please see our Cytonn Weekly #17/2024,
- The Kenya Mortgage Refinance Company (KMRC) unveiled the Kenya Mortgage Guarantee Trust (KMGT), a pivotal initiative aimed at mitigating risks for banks and SACCOs providing home loans to high-risk individuals, particularly low to mid-income workers. According to the latest SACCO Supervision Annual Report, regulated SACCOs disbursed Kshs 680.4 bn in loans during 2022, compared to banking institutions at Kshs 3,630.3 bn during the similar period. By providing a partial guarantee for mortgages, KMGT aims to instill confidence in lenders, thus catalyzing the provision of housing finance to income groups previously deemed high risk. For more information, please see our Cytonn Weekly #14/2024.
We expect increased completions and the initiation of more affordable housing projects, reflecting the government's commitment to address the substantial 61.3% current housing deficit across the nation. This is anchored by the levying of the Affordable Housing Levy on employers and employees which came to effect in 2024. We also foresee increased participation from institutional investors in the affordable housing segment, a sector historically overshadowed by mid to high-end projects. Nevertheless, Kenya's housing sector faces persistent challenges, including the prohibitive cost of financing and escalating construction expenses. These hurdles contribute to inflated development costs, presenting barriers for individuals striving to attain homeownership.
- Retail Sector
During the week, Naivas Supermarket, a local retail chain, inaugurated its 105th branch at T-Square Mall in Buruburu Phase 4, bringing its total number of outlets nationwide to 105. Spanning an impressive 28,000 square feet, the newest Naivas store offers a comprehensive shopping experience, featuring dedicated sections for electronics, home goods, apparel, fresh produce, and fast-moving consumer goods. This opening represents a significant milestone for Naivas, marking its return to the area after an absence of ten years. Following closely behind is the recent launch of another branch in Lang’ata on April 23, 2024, underscoring Naivas' rapid expansion strategy. In 2024 alone, Naivas has introduced five new branches, reinforcing its position as a leading player in the retail sector. Recognizing the importance of meeting evolving market demands, retailers have been actively pursuing expansion endeavors in response to the market gaps that were left upon the exit of retailers such as Nakumatt, Uchumi, and Tuskys. Alongside Naivas, other retailers expanding their presence in 2024 include Jaza Stores and Quick Mart. The following table outlines the current store counts of major local and international supermarket chains operating in Kenya
|
Cytonn Report: Main Local and International Retail Supermarket Chains |
||||||||||
|
Name of retailer |
Category |
Branches as at FY’2018 |
Branches as at FY’2019 |
Branches as at FY’2020 |
Branches as at FY’2021 |
Branches as at FY’2022 |
Branches as at FY’2023 |
Branches opened in FY’2024 |
Closed Branches |
Current Branches |
|
Naivas |
Hybrid* |
46 |
61 |
69 |
79 |
91 |
100 |
5 |
0 |
105 |
|
Quick Mart |
Hybrid** |
10 |
29 |
37 |
48 |
55 |
59 |
1 |
0 |
60 |
|
Chandarana |
Local |
14 |
19 |
20 |
23 |
26 |
26 |
0 |
0 |
26 |
|
Carrefour |
International |
6 |
7 |
9 |
16 |
19 |
22 |
0 |
0 |
22 |
|
Cleanshelf |
Local |
9 |
10 |
11 |
12 |
12 |
13 |
0 |
0 |
13 |
|
Jaza Stores |
Local |
0 |
0 |
0 |
0 |
0 |
4 |
2 |
0 |
6 |
|
Tuskys |
Local |
53 |
64 |
64 |
6 |
6 |
5 |
0 |
59 |
5 |
|
Uchumi |
Local |
37 |
37 |
37 |
2 |
2 |
2 |
0 |
35 |
2 |
|
Panda Mart |
International |
0 |
0 |
0 |
0 |
0 |
0 |
1 |
0 |
1 |
|
Game Stores |
International |
2 |
2 |
3 |
3 |
0 |
0 |
0 |
3 |
0 |
|
Choppies |
International |
13 |
15 |
15 |
0 |
0 |
0 |
0 |
15 |
0 |
|
Shoprite |
International |
2 |
4 |
4 |
0 |
0 |
0 |
0 |
4 |
0 |
|
Nakumatt |
Local |
65 |
65 |
65 |
0 |
0 |
0 |
0 |
65 |
0 |
|
Total |
257 |
313 |
334 |
189 |
211 |
231 |
9 |
181 |
240 |
|
|
*51% owned by IBL Group (Mauritius), Proparco (France), and DEG (Germany), while 49% owned by Gakiwawa Family (Kenya) |
||||||||||
|
**More than 50% owned by Adenia Partners (Mauritius), while Less than 50% owned by Kinuthia Family (Kenya) |
||||||||||
Notable highlights during the month include;
- Naivas Supermarket, a local retail chain, opened its Naivas Lang’ata Medlink branch, situated along Lang’ata Road, thereby increasing its nationwide total to 104 outlets. This outlet is poised to benefit from heavy traffic along Lang’ata Road and the growing middle-class population in the area. Naivas continues its expansive agenda, as evidenced by the recent openings of additional branches in Nairobi's Survey and Westlands regions. For more information, please see our Cytonn Weekly #17/2024.
Going forward, we expect to continue witnessing more retailers implementing aggressive expansion strategies. This strategy aims to capitalize on opportunities created by the vacancies left by prominent retailers like Uchumi, Shoprite, Game Stores, and Choppies supermarkets. Furthermore, we foresee the retail sector's positive performance being bolstered by a surge in foreign investments entering the Kenyan retail market.
- Industrial Sector
Notable highlights during the month include;
- NCBA Bank Kenya disclosed that it extended an additional Kshs 1.6 bn (USD 12 mn) in lending to Grit Services Limited, a Mauritius-based Real Estate firm, during the first half of the fiscal year ending December 2023. This brought the total dollar-denominated credit facilities provided by NCBA to Grit Services to Kshs 3.9 bn (USD 29.5 mn) by December 2023, up from Kshs 2.3 bn (USD 17.5 mn) in June 2023. Consequently, NCBA's share of Grit's parent company's total borrowings has increased from 3.8% to 7.1% during the period under review. For more information, please see our Cytonn Weekly #16/2024.
- Regulated Real Estate Funds
- Real Estate Investments Trusts (REITs)
In the Unquoted Securities Platform, Acorn D-REIT and I-REIT traded at Kshs 24.4 and Kshs 21.7 per unit, respectively, as of 26th April 2024. The performance represented a 22.0% and 8.3% gain for the D-REIT and I-REIT, respectively, from the Kshs 20.0 inception price. The volumes traded for the D-REIT and I-REIT came in at 12.3 mn and 30.7 mn shares, respectively, with a turnover of Kshs 257.5 mn and Kshs 633.8 mn, respectively, since inception in February 2021.
We anticipate that the Real Estate sector in Kenya will maintain its resilience, buoyed by several factors. These include positive demographics, such as a relatively high population and urbanization rate, standing at 1.9% and 3.7% respectively. Additionally, ongoing infrastructure development projects initiated by the government, along with increased activities in the residential sector by both government and private entities under the affordable housing program, are expected to contribute positively to sector growth. Moreover, efforts aimed at expanding the mortgage market, spearheaded by industry players like the Kenya Mortgage Refinance Company (KMRC), are likely to stimulate further activity. However, despite these positive indicators, we anticipate limitations such as; i) rising construction costs, ii) prevailing challenging macro-economic conditions, and, iii) limited investor knowledge regarding Real Estate Investment Trusts (REITs) are factors that could constrain growth in the sector
Disclaimer: The views expressed in this publication are those of the writers where particulars are not warranted. This publication, which is in compliance with Section 2 of the Capital Markets Authority Act Cap 485A, is meant for general information only and is not a warranty, representation, advice, or solicitation of any nature. Readers are advised in all circumstances to seek the advice of a registered investment advisor.

- Talk to us
- Kenya
- P.O Box 20695 - 00200, Nairobi, Kenya
- Cell +254709101200
- Tel +254709101200
- WhatsApp +254741676635
- United States
- +254709101200
- DOWNLOAD OUR APP
-


- Kenya
- 8th Floor, Pinetree Plaza, Kaburu Drive, Ngong Road, Nairobi, Kenya
- USA
- Suite 1150, 1775 Eye Street NW, USA, Washington DC 20006, USA
- Investments
- High Yield
- Private Equity
- Real Estate
- Real Estate
- RiverRun Estates
- Cytonn Towers
- The Ridge
- Taraji Heights
- The Alma