Cytonn Monthly - November 2025
By Cytonn Research, Nov 30, 2025
Executive Summary
Fixed Income
During the month of November 2025, T-bills were oversubscribed, with the overall average subscription rate coming in at 143.8%, higher than the subscription rate of 97.6% recorded in October 2025. The overall average subscription rates for the 91-day and 364-day papers increased to 232.5% and 222.0% from 136.6% and 133.2% recorded in October 2025 respectively while the subscription rates for the 182-day paper decreased to 30.2% from the 46.4% and recorded in October 2025. The average yields on the government papers were on a downward trajectory during the month, with the average 182-day, 91-day and 364-day papers yields decreasing by 10.1 bps, 8.4 bps, and 5.5 bps to 7.8%, 7.8% and 9.35% respectively, from an average of 7.9%, 7.9% and 9.41% recorded the previous month. For the month of October, the government accepted a total of Kshs 137.9 bn of the Kshs 138.0 bn worth of bids received in T-Bills, translating to an acceptance rate of 99.9%, compared to an acceptance rate of 99.6% in the month of October;
During the week, T-bills were oversubscribed for the eighth consecutive week, with the overall subscription rate coming in at 186.7%, higher than the subscription rate of 180.9% recorded the previous week. Investors’ preference for the shorter 91-day paper increased, with the paper receiving bids worth Kshs 17.9 bn against the offered Kshs 4.0 bn, translating to a subscription rate of 448.6%, significantly higher than the subscription rate of 336.6%, recorded the previous week. The subscription rates for the 182-day paper decreased to 5.2% from 42.3% recorded the previous week, while that of the 364-day papers increased to 263.5% from 257.3% recorded the previous week. The government accepted a total of Kshs 44.80 bn worth of bids out of Kshs 44.81 bn bids received, translating to an acceptance rate of 99.98%. The yields on the government papers recorded a mixed performance with the yields on the 364-day paper decreasing the most by 0.3 bps to 9.376% from the 9.379% recorded the previous week, and the 91-day paper decreased by 0.1 bps to remain relatively unchanged from the 7.78% recorded the previous week. The yields on the 182-day paper remained unchanged from the 7.8% recorded the previous week;
Additionally, November 2025 bonds were oversubscribed, with the overall average subscription rate coming in at 261.0%, higher than the average subscription rate of 237.8% recorded in October 2025. The reopened bonds FXD3/2019/015, FXD1/2022/025, FXD1/2012/020 and FXD1/2022/015 with tenors to maturity of 8.7 years, 21.9 years, 7.0 years and 11.4 years respectively and fixed coupon rates of 12.3%, 14.2%, 12.0% and 13.9% respectively, received bids worth Kshs 208.8 bn against the offered Kshs 80.0 bn translating to an average subscription rate of 261.0%. The government accepted bids worth Kshs 107.6 bn, translating to an acceptance rate of 51.5%. The weighted average yield for the accepted bids for the FXD3/2019/015, FXD1/2022/025, FXD1/2012/020 and FXD1/2022/015 came in at 12.6%, 13.7%, 12.5% and 13.3% respectively;
During the week, KNBS reported that year-on-year inflation in November 2025 eased slightly to 4.5% from 4.6% in October, driven by increases in Food & Non-Alcoholic Beverages 7.7%, Transport 5.1%, and Housing, Water, Electricity, Gas and Other Fuels 1.9%. Month-on-month inflation was modest at 0.2%, indicating relative price stability;
During the week, Safaricom launched a Kshs 15.0 bn tax‑free green bond, the first tranche of a larger Kshs 40.0 bn programme with a tenor of 5 years. The bond offers investors a fixed annual return of 10.4%, with interest earnings exempt from withholding tax. Subscriptions are open from 25th November to 5th December 2025, with a minimum investment of Kshs 50,000 and top-ups in multiples of Kshs 10,000. Proceeds from the bond will be used to finance or refinance environmentally friendly projects under Safaricom’s green-bond framework, including energy-efficient infrastructure and network upgrades;
During the week, the World Bank raised its 2025 GDP growth forecast for Kenya to 4.9%, up from the 4.5% projected in May 2025. The upgrade reflects a stronger-than-expected rebound in the construction sector, driven by renewed public works and infrastructure projects, which is boosting output across services, industry, and agriculture. The Bank also cited improving private-sector credit growth, easing monetary policy, and stable inflation as factors supporting higher economic activity;
Equities
During the month of November, the equities market was on a downward trajectory, with NASI, NSE 25, NSE 10 and NSE 20 losing by 3.8%, 3.6%, 3.2% and 2.1% respectively. The equities market performance was mainly driven by losses recorded by large-cap stocks such as Stanbic, NCBA and Equity of 6.6%, 5.7% and 5.3% respectively. The performance was, however, supported by gains by large cap stocks such as Cooperative Bank and DTB-K of 8.5% and 5.2% respectively;
During the week, the equities market was on a downward trajectory, with NSE 10 losing the most by 4.2% while NSE 25, NASI and NSE 20 lost by 3.9%, 3.6% and 3.3% respectively, taking the YTD performance to gains of 48.3%, 44.5%, 39.4% and 39.3% for NSE 20, NASI, NSE 25 and NSE 10 respectively. The week on week equities market performance was driven by losses recorded by large-cap stocks such as KCB, EABL and ABSA of 8.6%, 5.3% and 4.6% respectively;
Also, during the month, the banking sector index increased by 26.2% to close at 191.9 from the 152.1 recorded at the end of the October. This was attributable to gains recorded by large-cap stocks such as Cooperative Bank and DTB-K of 8.5% and 5.2% respectively. The performance was, however, weighed down by losses recorded by stocks such as Stanbic, NCBA and Equity of 6.6%, 5.7% and 5.3% respectively;
During the week, the banking sector index declined by 4.1% to 191.9 from 200.1 recorded the previous week. This is attributable to losses recorded by stocks such as KCB, ABSA and Cooperative Bank of 8.6%, 4.6% and 4.4% respectively;
During the week, Standard Chartered released its Q3’ 2025 financial results with its Core Earnings Per Share decreased by 38.2% to Kshs 25.9 in Q3’ 2025, from Kshs 41.9 in Q3’2024. HF Group also released its Q3’ 2025 financial results with its Core Earnings Per Share decreasing by 58.3% to kshs 0.7 in Q3’ 2025 from Kshs 1.7 in Q3’ 2024;
During the week, Centum Investments Company PLC released their HY’2026 financial results for the period ending 30th September 2025, recording a 5.9% decrease in the Loss After Tax to Kshs 0.33 bn in HY’2026, from Kshs 0.35 bn in HY’ 2025. The decrease was mainly attributable to a 46.6% decrease in loss from their Real Estate business to Kshs 0.1 bn, from Kshs 0.2 bn in HY’2025;
Real Estate
During the week, the Kenya National Bureau of Statistics (KNBS) released the Leading Economic Indicators (LEI) September 2025 Reports, which highlighted the performance of major economic indicators,
During the week, Kenya and Malaysia have signed several agreements aimed at strengthening bilateral ties. The two countries finalized an air services agreement that will improve connectivity between Nairobi and Kuala Lumpur, making travel more convenient for traders, investors, and tourists,
During the week, President William Ruto launched the long-awaited dualling of the 170-kilometre Rironi–Nakuru–Mau Summit Road, a major upgrade intended to ease congestion and improve safety along one of Kenya’s busiest transport corridors. The project, undertaken through a public-private partnership by a consortium including China Road and Bridge Corporation (CRBC) and the National Social Security Fund (NSSF), will expand the road into a four-lane dual carriageway from Rironi to Naivasha and a six-lane dual carriageway from Naivasha to Nakuru,
On the Unquoted Securities Platform, Acorn D-REIT and I-REIT traded at Kshs 27.4 and Kshs 23.2 per unit, respectively, as per the last updated data on 21st November 2025. The performance represented a 33.4% and 14.5% gain for the D-REIT and I-REIT, respectively, from the Kshs 20.0 inception price. Additionally, ILAM Fahari I-REIT traded at Kshs 11.0 per share as of 21st November 2025, representing a45.0% loss from the Kshs 20.0 inception price.
Investment Updates:
- Weekly Rates: Cytonn Money Market Fund closed the week at a yield of 12.0% p.a. To invest, dial *809# or download the Cytonn App from Google Play store here or from the Appstore here;
- We continue to offer Wealth Management Training every Tuesday, from 7:00pm to 8:00 pm. The training aims to grow financial literacy among the general public. To register for any of our Wealth Management Trainings, click here;
- If interested in our Private Wealth Management Training for your employees or investment group, please get in touch with us through wmt@cytonn.com;
- Cytonn Insurance Agency acts as an intermediary for those looking to secure their assets and loved ones’ future through insurance namely; Motor, Medical, Life, Property, WIBA, Credit and Fire and Burglary insurance covers. For assistance, get in touch with us through insuranceagency@cytonn.com;
- Cytonn Asset Managers Limited (CAML) continues to offer pension products to meet the needs of both individual clients who want to save for their retirement during their working years and Institutional clients that want to contribute on behalf of their employees to help them build their retirement pot. To more about our pension schemes, kindly get in touch with us through pensions@cytonn.com;
Hospitality Updates:
- We currently have promotions for Staycations. Visit cysuites.com/offers for details or email us at sales@cysuites.com;
Money Markets, T-Bills Primary Auction:
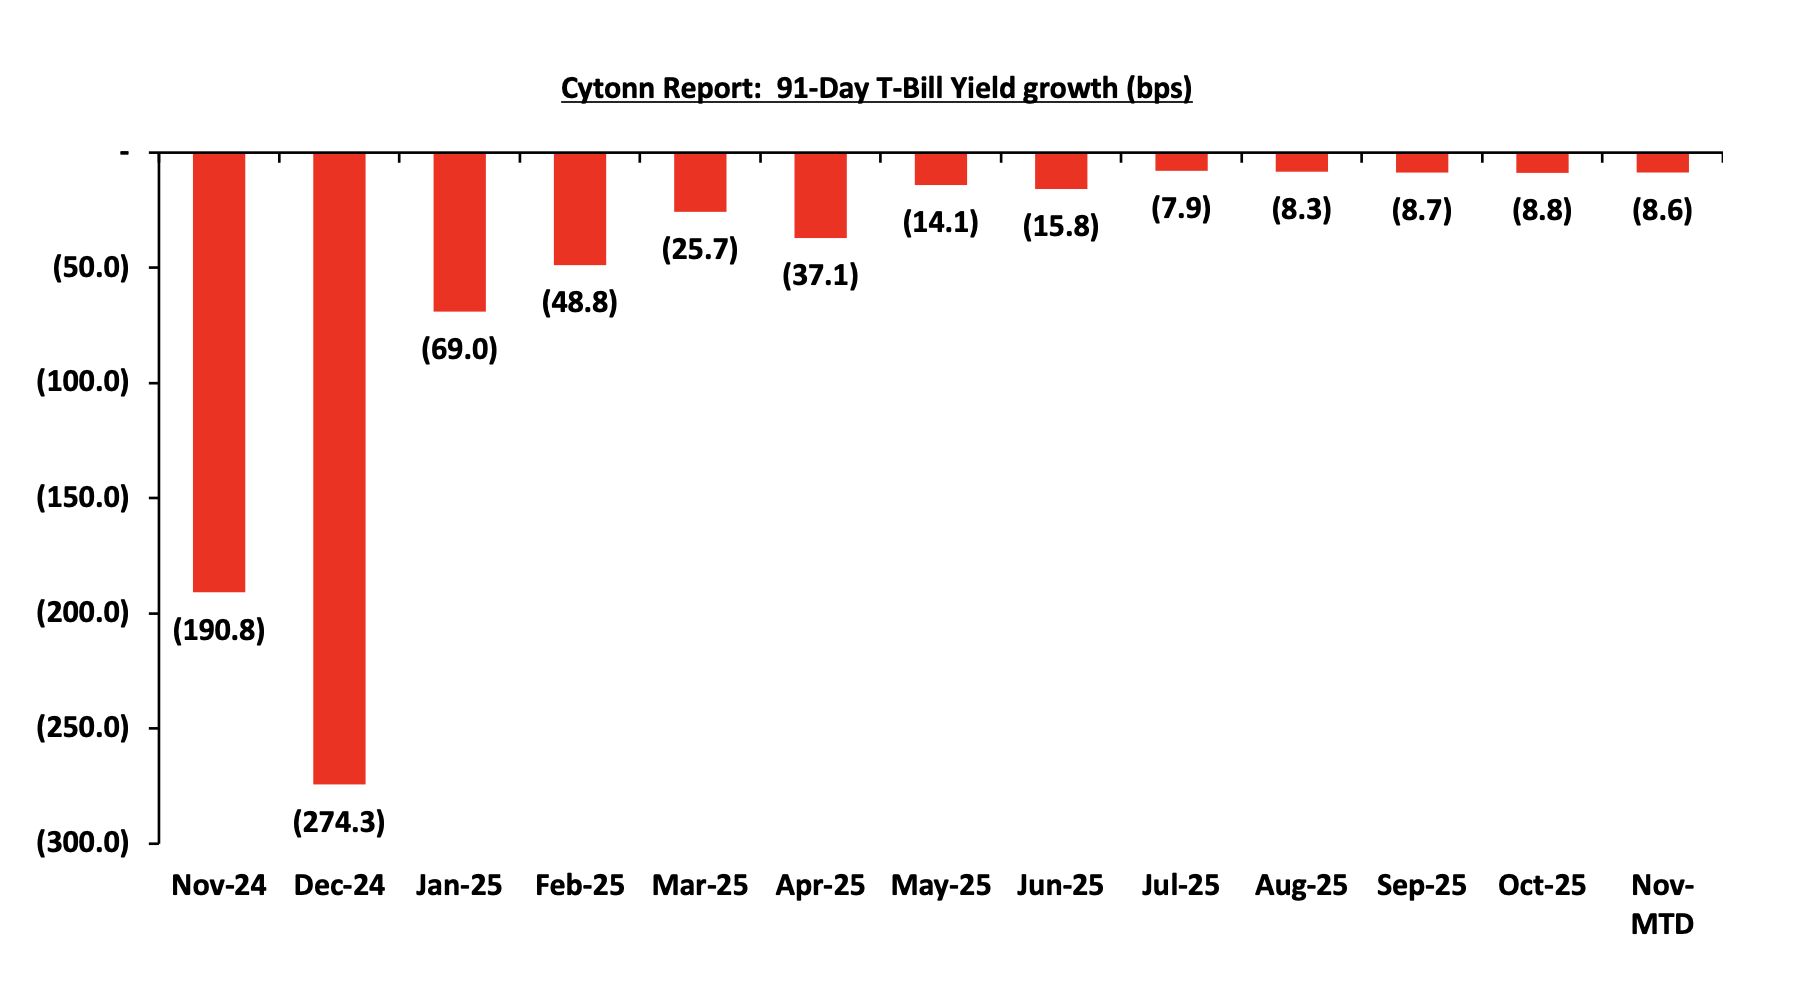
During the month of November 2025, T-bills were oversubscribed, with the overall average subscription rate coming in at 143.8%, higher than the subscription rate of 97.6% recorded in October 2025. The overall average subscription rates for the 91-day and 364-day papers increased to 232.5% and 222.0% from 136.6% and 133.2% recorded in October 2025 respectively while the subscription rates for the 182-day paper decreased to 30.2% from the 46.4% and recorded in October 2025. The average yields on the government papers were on a downward trajectory during the month, with the average 182-day, 91-day and 364-day papers yields decreasing by 10.1 bps, 8.4 bps, and 5.5 bps to 7.8%, 7.8% and 9.35% respectively, from an average of 7.9%, 7.9% and 9.41% recorded the previous month. For the month of October, the government accepted a total of Kshs 137.9 bn of the Kshs 138.0 bn worth of bids received in T-Bills, translating to an acceptance rate of 99.9%, compared to an acceptance rate of 99.6% in the month of October;
The chart below shows the yield growth rate for the 91-day paper in 2024 and during the year:
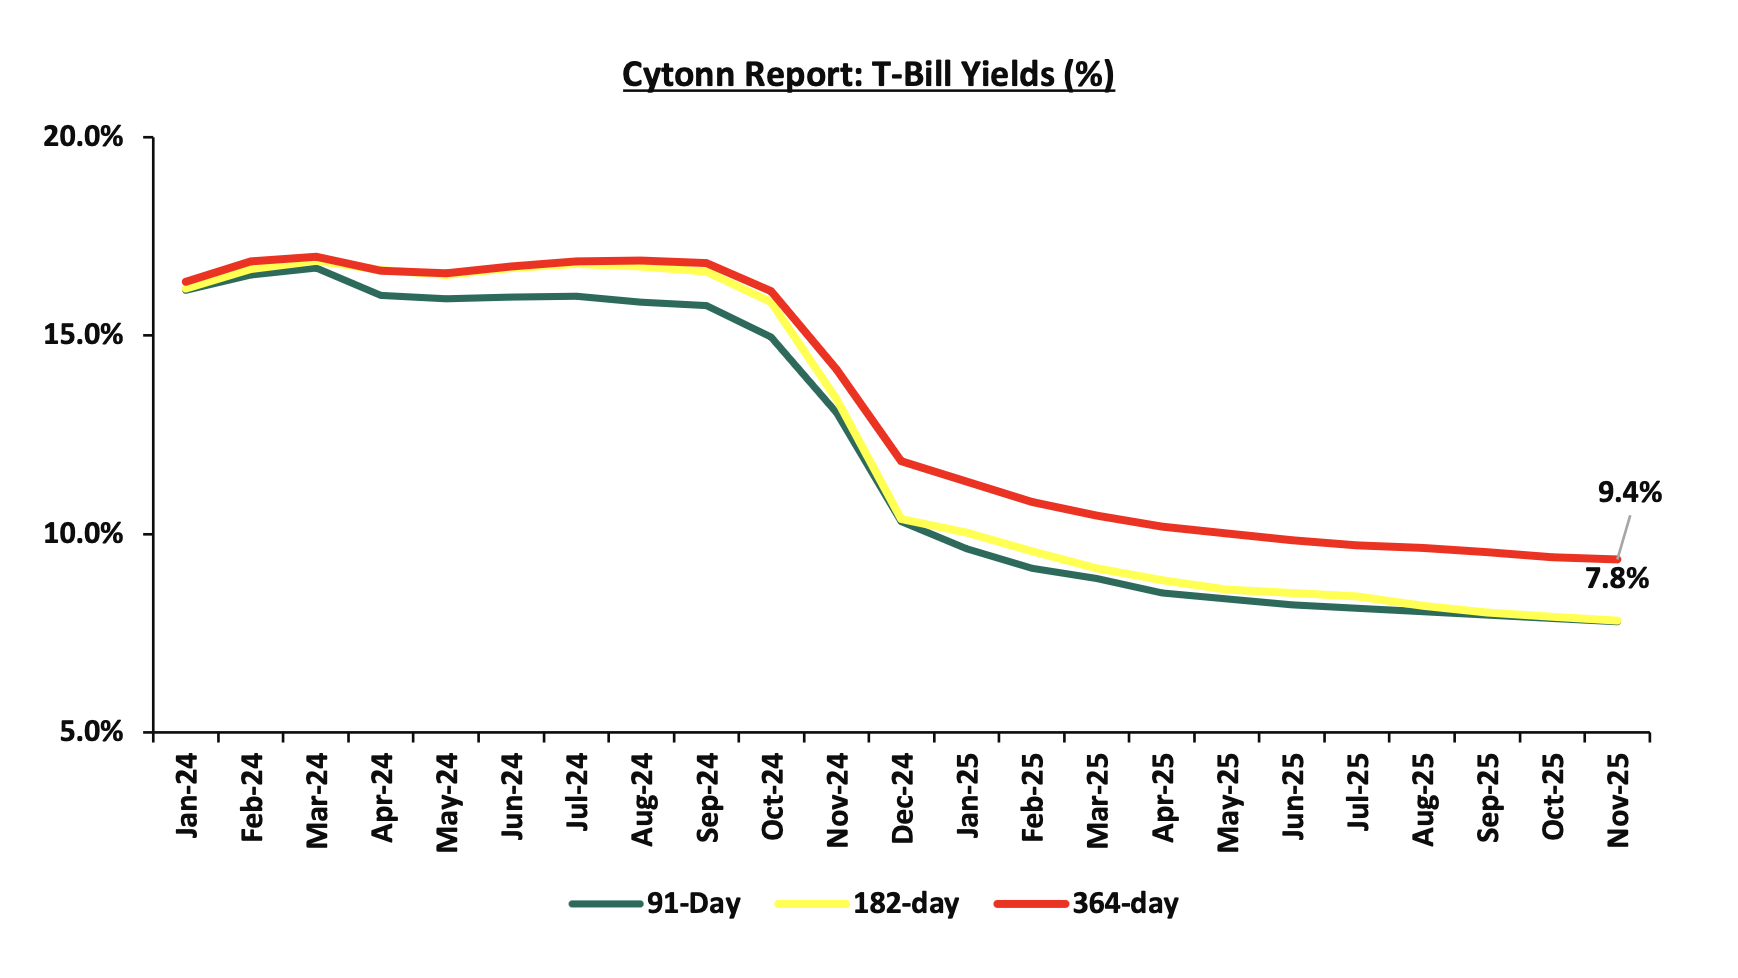
This week, T-bills were oversubscribed for the eighth consecutive week, with the overall subscription rate coming in at 186.7%, higher than the subscription rate of 180.9% recorded the previous week. Investors’ preference for the shorter 91-day paper increased, with the paper receiving bids worth Kshs 17.9 bn against the offered Kshs 4.0 bn, translating to a subscription rate of 448.6%, significantly higher than the subscription rate of 336.6%, recorded the previous week. The subscription rates for the 182-day paper decreased to 5.2% from 42.3% recorded the previous week, while that of the 364-day papers increased to 263.5% from 257.3% recorded the previous week. The government accepted a total of Kshs 44.80 bn worth of bids out of Kshs 44.81 bn bids received, translating to an acceptance rate of 99.98%. The yields on the government papers recorded a mixed performance with the yields on the 364-day paper decreasing the most by 0.3 bps to 9.376% from the 9.379% recorded the previous week, and the 91-day paper decreased by 0.1 bps to remain relatively unchanged from the 7.78% recorded the previous week. The yields on the 182-day paper remained unchanged from the 7.8% recorded the previous week;
The charts below show the performance of the 91-day, 182-day and 364-day papers from January 2024 to November 2025:
So far in the current FY’2025/26, government securities totaling Kshs 884.0 bn have been advertised. The government has accepted bids worth Kshs 1,138.4 bn, of which Kshs 540.2 bn and Kshs 598.1 bn were treasury bills and bonds, respectively. Total redemptions so far in FY’2025/26 equal to Kshs 458.4 bn, with treasury bills accounting for the entire amount. As a result, the government has a domestic borrowing surplus of Kshs 526.2 bn in FY’2025/26.
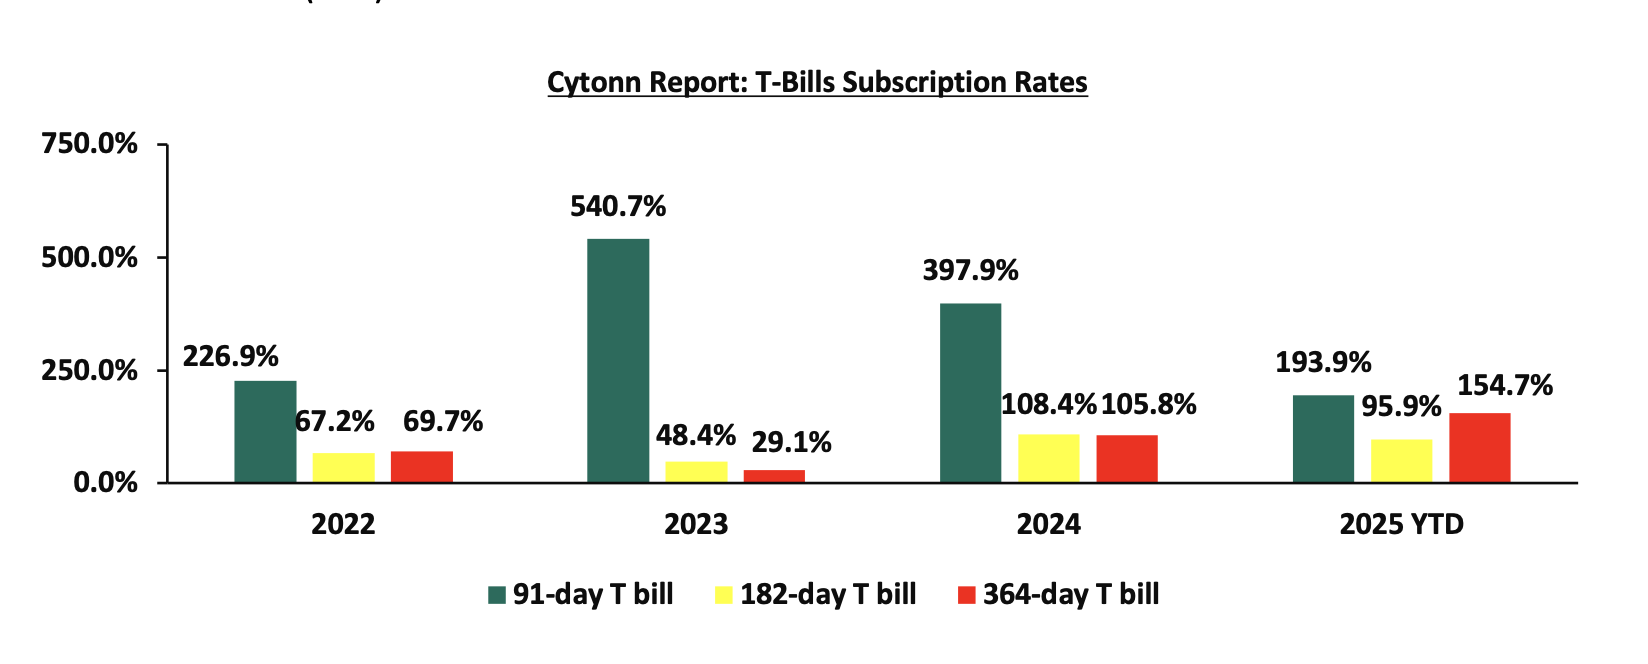
The chart below compares the overall average T-bill subscription rates obtained in 2022,2023, 2024 and 2025 Year-to-date (YTD):
Additionally, November 2025 bonds were oversubscribed, with the overall average subscription rate coming in at 261.0%, higher than the average subscription rate of 237.8% recorded in October 2025. The reopened bonds FXD3/2019/015, FXD1/2022/025, FXD1/2012/020 and FXD1/2022/015 with tenors to maturity of 8.7 years, 21.9 years, 7.0 years and 11.4 years respectively and fixed coupon rates of 12.3%, 14.2%, 12.0% and 13.9% respectively, received bids worth Kshs 208.8 bn against the offered Kshs 80.0 bn translating to an oversubscription rate of 261.0%. The government accepted bids worth Kshs 107.6 bn, translating to an acceptance rate of 51.5%. The weighted average yield for the accepted bids for the FXD3/2019/015, FXD1/2022/025, FXD1/2012/020 and FXD1/2022/015 came in at 12.6%, 13.7%, 12.5% and 13.3% respectively.
The table below provides more details on the bonds issued in November 2025:
|
Issue Date |
Bond Auctioned |
Effective Tenor to Maturity (Years) |
Coupon |
Amount offered (Kshs bn) |
Actual Amount Raised/Accepted (Kshs bn) |
Total bids received (Subscription) |
Average Accepted Yield |
Subscription Rate |
Acceptance Rate |
|
24-Nov |
FXD3/2019/015- Reopened |
8.7 |
12.3% |
40.0 |
20.2 |
33.7 |
12.6% |
289.7% |
59.9% |
|
FXD1/2022/025- Reopened |
21.9 |
14.2% |
34.6 |
82.1 |
13.7% |
42.1% |
|||
|
10-Nov |
FXD1/2012/020- Reopened |
7.0 |
12.0% |
40.0 |
19.5 |
35.3 |
12.5% |
88.3% |
55.1% |
|
|
FXD1/2022/015-Reopened |
11.4 |
13.9% |
|
33.3 |
57.6 |
13.3% |
144.0% |
57.9% |
|
November 2025 Average |
9.2 |
13.0% |
80.00 |
107.6 |
208.8 |
12.9% |
261.0% |
51.5% |
|
|
October 2025 Average |
11.8 |
13.1% |
50.0 |
85.3 |
118.9 |
13.1% |
118.9% |
71.7% |
|
|
2024 Average |
6.7 |
15.6% |
27.7 |
28.9 |
37.9 |
16.7% |
116.8% |
74.9% |
|
During the month, the Central Bank of Kenya released the auction results for the three-year buyback treasury bond issue no. FXD1/2023/003 with a fixed coupon of 14.2% and a tenor to maturity of 0.6 years. The bond was oversubscribed, with the overall subscription rate coming in at 114.3%, receiving bids worth Kshs 34.3 bn against the offered Kshs 30.0 bn. The government accepted bids worth Kshs 20.1 bn, translating to an acceptance rate of 58.5%. The weighted average yield for the accepted bids for the FXD1/2023/003 came in at 7.8%. The yields are largely in line with the T-bill rates making the refinancing cost the same. This is the second time in 2025 that the Kenyan government has bought back treasury bonds since the February 2025 buyback of FXD1/2020/005, FXD1/2022/003 and IFB1/2016/009.
In the primary bond market, the government is seeking to raise Kshs 40.0 bn through the re-opened bonds SDB1/2011/030 and FXD1/2021/025, with fixed coupon rates of 12.0% and 13.9%, and tenors to maturity of 15.2 years and 20.4 years, respectively. The period of sale for the two bonds runs from Thursday, 27th November 2025, to Wednesday, 3rd December 2025. Our bidding ranges for SDB1/2011/030 and FXD1/2021/025 are 12.00%-13.00% and 13.50%-14.0%, respectively.
Secondary Bond Market:
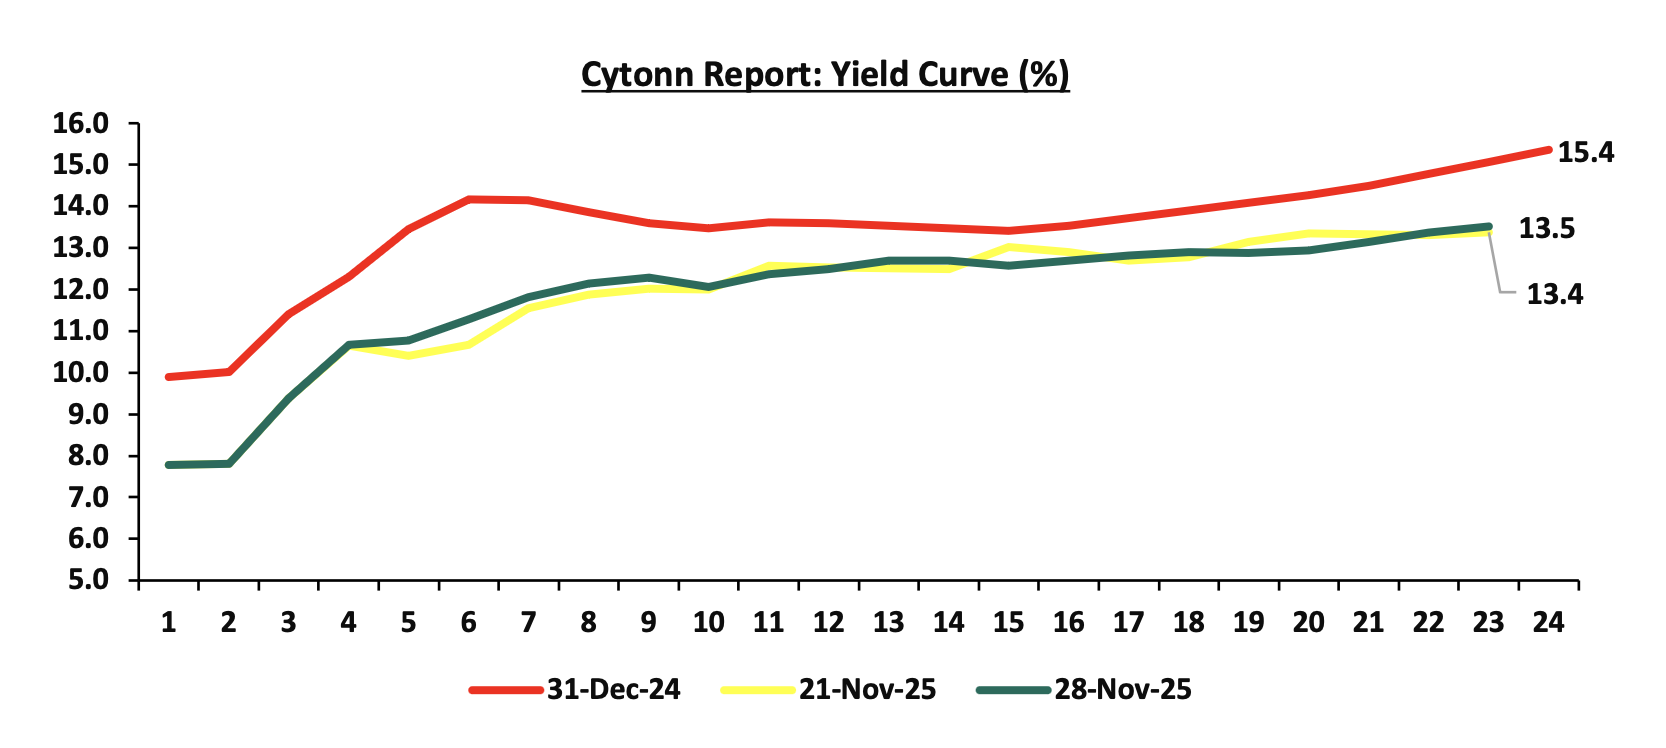
The yields on the government securities recorded a mixed performance during the month of November similar to October. Investors, apprehensive about the economic outlook in the long term, are demanding higher yields for bonds in the 11 to 22-year maturity range to compensate for the perceived risks as they anticipate potential fluctuations in economic conditions in the Kenyan market on the back of the government’s debt sustainability concerns. Notably, the yield curve has adjusted from a humped yield curve observed in most part of 2024, towards a normal upward sloping curve, with long-term bonds registering highest yields. The shift in sentiment indicates increased confidence in the short-term economic landscape, in comparison to the last two years. The chart below shows the yield curve movement during the period:
The secondary bond turnover increased by 13.8% to Kshs 193.4 bn, from Kshs 169.9 bn recorded in October 2025, pointing towards increased activities by commercial banks in the secondary bonds market for the month of November. On a year-on-year basis, the bond turnover increased by 76.8% from Kshs 109.4 bn worth of treasury bonds transacted over a similar period last year. The chart below shows the bond turnover over the past 12 months.

Money Market Performance:
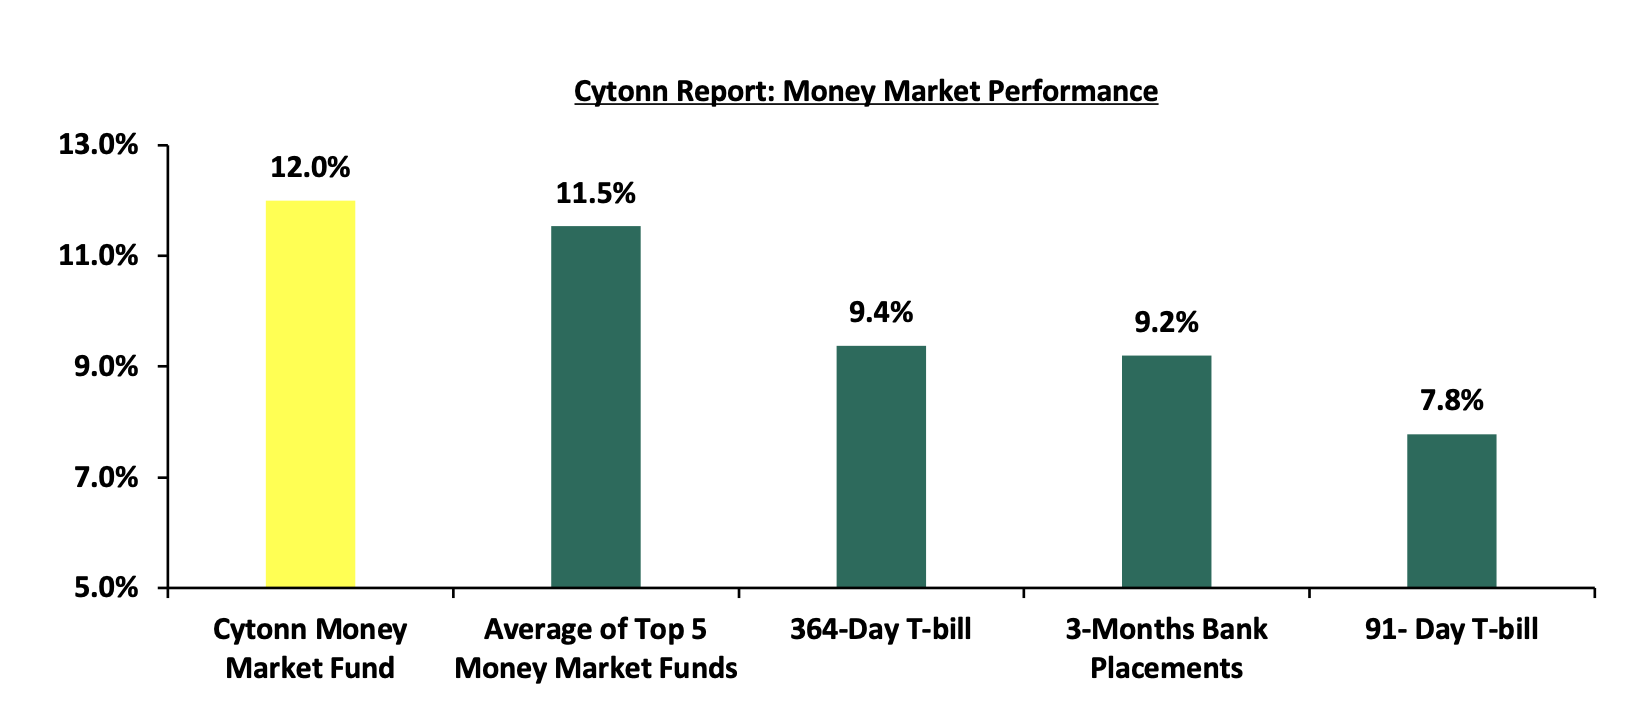
In the money markets, 3-month bank placements ended the week at 9.2% (based on what we have been offered by various banks). The yields on the 91-day paper decreased by 0.1 bps to remain relatively unchanged from the 7.78% recorded the previous week, and 364-day paper decreased by 0.3 bps to 9.376% from 9.379% recorded the previous week and the yield on the Cytonn Money Market Fund decreased by 25.0 bps to 12.0% from 12.3% recorded in the previous week, while the average yields on the Top 5 Money Market Funds increased by 1.6 bps to remain relatively unchanged from the 11.5% recorded the previous week.
The table below shows the Money Market Fund Yields for Kenyan Fund Managers as published on 28th November 2025:
|
Money Market Fund Yield for Fund Managers as published on 28th November 2025 |
||
|
Rank |
Fund Manager |
Effective Annual Rate |
|
1 |
Cytonn Money Market Fund ( Dial *809# or download Cytonn App) |
12.0% |
|
2 |
Nabo Africa Money Market Fund |
11.9% |
|
3 |
Etica Money Market Fund |
11.6% |
|
4 |
Lofty-Corban Money Market Fund |
11.1% |
|
5 |
Enwealth Money Market Fund |
11.1% |
|
6 |
Ndovu Money Market Fund |
11.1% |
|
7 |
Kuza Money Market fund |
11.0% |
|
8 |
Gulfcap Money Market Fund |
10.9% |
|
9 |
Orient Kasha Money Market Fund |
10.7% |
|
10 |
Jubilee Money Market Fund |
10.7% |
|
11 |
Old Mutual Money Market Fund |
10.6% |
|
12 |
British-American Money Market Fund |
10.4% |
|
13 |
Madison Money Market Fund |
10.0% |
|
14 |
GenAfrica Money Market Fund |
9.9% |
|
15 |
Faulu Money Market Fund |
9.8% |
|
16 |
Dry Associates Money Market Fund |
9.8% |
|
17 |
Sanlam Money Market Fund |
9.7% |
|
18 |
Apollo Money Market Fund |
9.5% |
|
19 |
Arvocap Money Market Fund |
9.4% |
|
20 |
KCB Money Market Fund |
9.4% |
|
21 |
ICEA Lion Money Market Fund |
8.6% |
|
22 |
Genghis Money Market Fund |
8.6% |
|
23 |
CIC Money Market Fund |
8.5% |
|
24 |
Co-op Money Market Fund |
8.3% |
|
25 |
CPF Money Market Fund |
8.3% |
|
26 |
Mali Money Market Fund |
8.2% |
|
27 |
Mayfair Money Market Fund |
8.0% |
|
28 |
Absa Shilling Money Market Fund |
7.9% |
|
29 |
AA Kenya Shillings Fund |
6.6% |
|
30 |
Ziidi Money Market Fund |
6.4% |
|
31 |
Stanbic Money Market Fund |
6.3% |
|
32 |
Equity Money Market Fund |
5.0% |
Source: Business Daily
Liquidity:
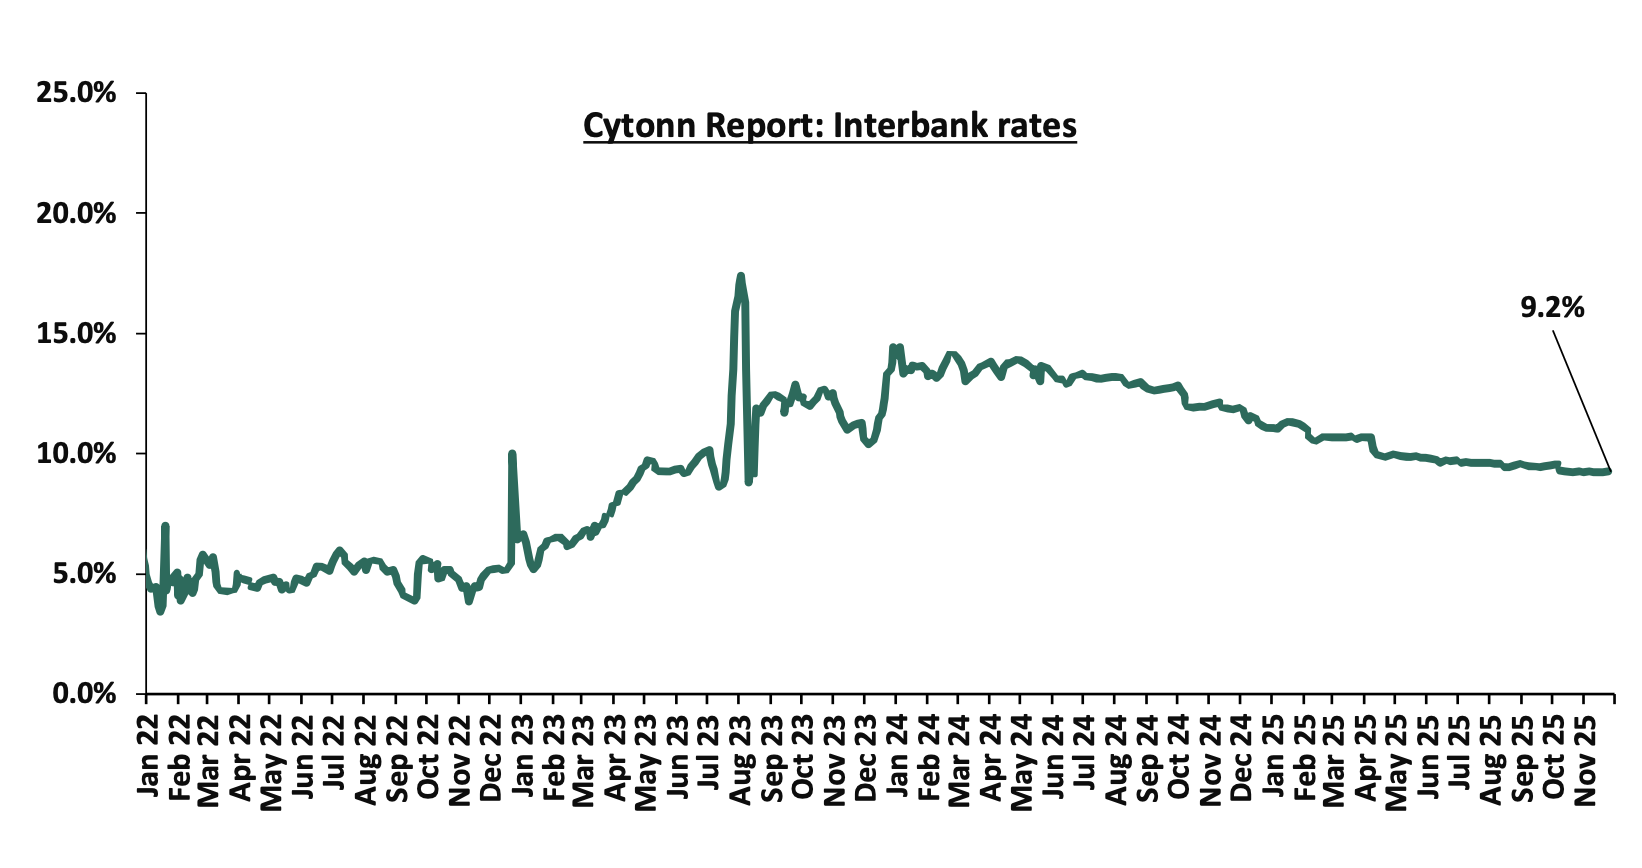
Liquidity in the money markets eased in the month of November 2025, with the average interbank rate decreasing by 8.1 bps to 9.2% from 9.3% recorded the previous month. The average interbank volumes traded decreased by 1.1% to Kshs 11.9 bn, from Kshs 12.0 bn recorded in October 2025. Additionally, during the week, liquidity in the money markets tightened, with the average interbank rate increasing by 1.2 bps, to remain relatively unchanged from the 9.2% from recorded the previous week, partly attributable to tax remittances that offset government payments. The average interbank volumes traded increased by 62.4% to Kshs 16.2 bn from Kshs 10.0 bn recorded the previous week. The chart below shows the interbank rates in the market over the years:
Kenya Eurobonds:
During the month, the yields on the Eurobonds recorded a mixed performance, with the yield on the 10-year Eurobond issued in 2018 increasing the most by 25.9 bps to 6.2% from 6.0% recorded at the beginning of the month. The yield on the 30-year Eurobond issued in 2018 decreased by 1.3 bps to remain relatively unchanged from the 9.2% recorded at the beginning of the month. Similarly, during the week, the yields on the Eurobonds recorded a mixed performance with the yield on the 10-year Eurobond issued in 2018 increasing the most by 11.0 bps to 6.2% from 6.1% recorded the previous week. The yield on the 30-year Eurobond issued in 2018 decreased 4.3 bps to remain relatively unchanged from the 9.2% the previous week. The table below shows the summary performance of the Kenyan Eurobonds as of 27th November 2025;
|
Cytonn Report: Kenya Eurobond Performance |
|||||||
|
|
2018 |
2019 |
2021 |
2024 |
2025 |
||
|
Tenor |
10-year issue |
30-year issue |
7-year issue |
12-year issue |
13-year issue |
7-year issue |
11-year issue |
|
Amount Issued (USD) |
1.0 bn |
1.0 bn |
0.9 bn |
1.2 bn |
1.0 bn |
1.5 bn |
1.5 bn |
|
Years to Maturity |
2.5 |
22.5 |
1.7 |
6.7 |
8.8 |
5.5 |
10.5 |
|
Yields at Issue |
7.3% |
8.3% |
7.0% |
7.9% |
6.2% |
10.4% |
9.9% |
|
2-Jan-25 |
9.1% |
10.3% |
8.5% |
10.1% |
10.1% |
10.1% |
|
|
3-Nov-25 |
6.0% |
9.2% |
- |
8.1% |
8.4% |
7.8% |
|
|
20-Nov-25 |
6.1% |
9.2% |
- |
8.2% |
8.6% |
7.9% |
|
|
21-Nov-25 |
6.4% |
9.3% |
- |
8.3% |
8.9% |
8.1% |
|
|
24-Nov-25 |
6.3% |
9.2% |
- |
8.3% |
8.8% |
8.0% |
|
|
25-Nov-25 |
6.3% |
9.2% |
- |
8.3% |
8.8% |
8.0% |
|
|
26-Nov-25 |
6.2% |
9.2% |
- |
8.2% |
8.7% |
8.0% |
10.0% |
|
27-Nov-25 |
6.2% |
9.2% |
- |
8.2% |
8.7% |
8.0% |
|
|
Weekly Change |
0.1% |
(0.04%) |
- |
0.03% |
0.03% |
0.06% |
- |
|
MTD Change |
0.3% |
0.0% |
- |
0.1% |
0.2% |
0.1% |
- |
|
YTD Change |
(2.8%) |
(1.1%) |
- |
(1.9%) |
(1.4%) |
(2.1%) |
- |
Source: Central Bank of Kenya (CBK) and National Treasury
Kenya Shilling:
During the month, the Kenya Shilling depreciated marginally by 3.7 bps against the US Dollar, to Kshs 129.8 from Kshs 129.2 recorded at the end of October.
During the week, the Kenya Shilling appreciated marginally against the US Dollar by 3.9 bps, to close the week at Kshs 129.8 from the Kshs 129.9 recorded the previous week. On a year-to-date basis, the shilling has depreciated by 39.7 bps against the dollar, lower than the 17.4% appreciation recorded in 2024.
We expect the shilling to be supported by:
- Diaspora remittances standing at a cumulative USD 5,080.0 mn in the twelve months to September 2025, 7.6% higher than the USD 4,722.6 mn recorded over the same period in 2024.These has continued to cushion the shilling against further depreciation. In the September 2025 diaspora remittances figures, North America remained the largest source of remittances to Kenya accounting for 58.6% in the period,
- The tourism inflow receipts which are projected to reach KSh 560.0 bn in 2025 up from KSh 452.2 bn in 2024 a 23.9% increase, and owing to tourist arrivals that improved by 9.9% to 2,424,382 in the 12 months to June 2025 from 2,206,469 in the 12 months to June 2024, and,
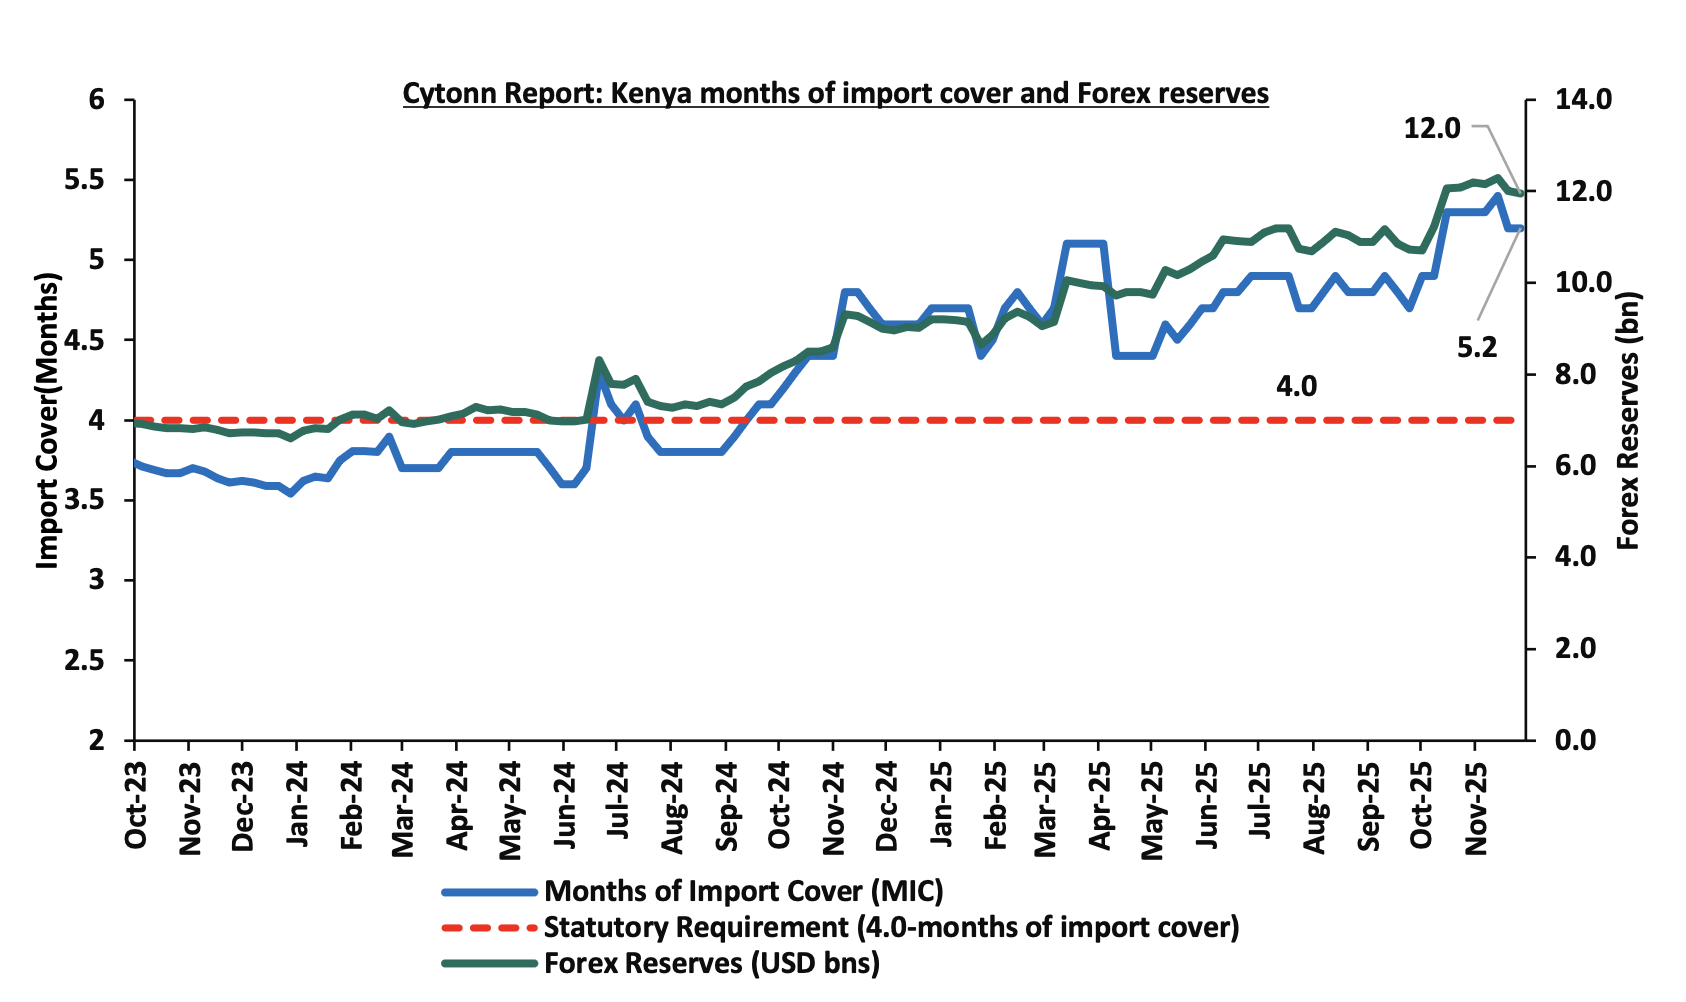
- Improved forex reserves currently at USD 12.0 bn (equivalent to 5.2-months of import cover), which is above the statutory requirement of maintaining at least 4.0-months of import cover and above the EAC region’s convergence criteria of 4.5-months of import cover.
The shilling is however expected to remain under pressure in 2025 as a result of:
- An ever-present current account deficit which came at 2.1% of GDP in the twelve months to August 2025, and,
- The need for government debt servicing, continues to put pressure on forex reserves given that 59.7% of Kenya’s external debt is US Dollar-denominated as of June 2025.
Key to note, Kenya’s forex reserves decreased by 2.0% during the month of November 2025, to USD 12.0 bn, from the USD 12.2 bn recorded in the previous month, equivalent to 5.2 months of import cover and above the statutory requirement of maintaining at least 4.0-months of import cover. Additionally, during the month, the months of import cover decreased to 5.2 months from 5.3 months recorded in the previous month. Additionally, during the week, Kenya’s forex reserves decreased by 0.5% to remain relatively unchanged from the USD 12.0 bn recorded the previous week, equivalent to 5.2 months of import cover, and above the statutory requirement of maintaining at least 4.0-months of import cover.
The chart below summarizes the evolution of Kenya's months of import cover over the years:
Weekly Highlights
- Inflation Highlight November 2025
The year-on-year inflation in November 2025 declined slightly to 4.5% from the 4.6% recorded in October 2025. The headline inflation was primarily driven by price increases in the following categories: Food & Non-Alcoholic Beverages at 7.7%, Transport at 5.1%, and Housing, Water, Electricity, Gas and Other Fuels at 1.9%. The month-on-month inflation rate stood at 0.2% in November 2025. The table below summarizes the performance of commodity indices both on a year-on-year and month-on-month basis:
|
Cytonn Report: Major Inflation Changes –November 2025 |
|||
|
Broad Commodity Group |
Price change m/m (November-2025/ October -2025) |
Price change y/y (November-2025/October-2024) |
Reason |
|
Food and non- alcoholic beverages |
0.3% |
7.7% |
The m/m increase was mainly driven by the rise in prices of onions, oranges and kale/sukuma wiki by 4.9%, 2.9% and 2.7% respectively. However, the increase was weighed down by a decline in prices of fortified maize flour, sifted maize flour and tomatoes of 3.8%, 3.2% and 2.1% respectively while prices of sugar, Irish potatoes, beans, and white bread dropped marginally. |
|
Transport |
0.4% |
5.1% |
The transport index recorded a slight m/m increase mainly due to a 1.4% rise in country bus/matatu fares for travel between towns. However, the increase was weighed down by unchanged prices of petrol and diesel, while international flight prices remained stable. |
|
Housing, water, electricity, gas and other fuels |
(0.1%) |
1.9% |
The m/m decline was mainly due to a fall in electricity prices, with 50 kWh and 200 kWh decreasing by 1.7% and 1.5% respectively. However, the decline was partially offset by a 1.2% increase in the price of firewood and a 0.6% rise in water charges. |
|
Overall Inflation |
0.2% |
4.5% |
The m/m increase was mainly attributable to the 0.4% increase in transport |
In November 2025, overall inflation eased slightly to 4.5% from the 4.6% recorded in October 2025 on a y/y basis, signalling continued moderation in price pressures across major categories. Additionally, the inflation rate remained within the Central Bank of Kenya’s preferred range of 2.5%–7.5% for the twenty-ninth consecutive month, reflecting sustained macroeconomic stability. The increase was mainly driven by a 7.7% y/y rise in food and non-alcoholic beverage prices, a 5.1% increase in transport costs, and a 1.9% rise in housing, water, electricity, gas and other fuels. On a month-to-month basis, inflation remained modest at 0.2%, indicating relative price stability. Prices for Super Petrol and Diesel remained unchanged at Kshs 185.59 and Kshs 172.64 per litre respectively. Electricity costs eased during the month, with 50 kWh and 200 kWh declining by 1.7% and 1.5%, respectively Additionally, the recent reduction in the Central Bank Rate to 9.25% from 9.50% in October is expected to stimulate credit uptake and increase money supply, which could gradually exert upward pressure on inflation in the coming months as monetary easing transmits through the broader economy. Meanwhile, the Kenya Shilling depreciated marginally by 3.7 bps m/m against the US Dollar, to Kshs 129.8 from Kshs 129.2 recorded at the end of October and a 39.7 bps year-to-date depreciation to Kshs 129.8 as of 28th November 2025, from the Kshs 129.3 recorded at the beginning of the year. This stabilization in the exchange rate, combined with manageable fuel price increases, continues to anchor inflation expectations within the CBK’s target range.
The chart below shows the inflation rates for the past 5 years:

Going forward, we expect inflation to remain within the CBK’s preferred range of 2.5%-7.5%, mainly on the back of a stable currency and stable fuel prices. Additionally, favorable weather conditions will also contribute to stabilizing food prices, further supporting stable inflation rates. The risk, however, lies in the fuel prices which despite their stability still remain elevated compared to historical levels. Additionally, the Monetary Policy Committee cut the Central Bank Rate by 25.0 bps to 9.25% from 9.50% in its October 2025 meeting, with the aim of easing the monetary policy, while maintaining exchange rate stability, and will meet again in December 2025. This cut in the Central Bank Rate is likely to elevate inflationary pressures gradually as consumer spending rises from increased money supply. The committee is expected to adopt a more cautious approach to rate adjustments in the coming meetings in a bid to continue supporting the private sector, while also keeping an eye on the effect on the inflation and exchange rate.
- World Bank Kenya economic update
During the week, the World Bank released its latest Kenya Economic Update, offering a cautiously optimistic assessment of the country’s outlook while underscoring persistent fiscal and structural vulnerabilities. Notably, the World Bank revised Kenya’s GDP growth projection upward, now expecting the economy to expand by an average of 4.9% over 2025–2027, reflecting a stronger-than-anticipated recovery in the first half of 2025. This revision follows better quarterly outcomes, 4.9% in Q1’2025 and 5.0% in Q2’2025, driven by resilient agriculture, steady services, and a rebound in construction as pending arrears were cleared and borrowing costs eased. In 2025, the Kenyan economy is expected to rebound, returning to its growth path, with the average projected growth estimated at 5.1% by various organizations as outlined below:
|
No. |
Organization |
2025 GDP Projections |
|
1. |
Cytonn Investments Management PLC |
5.4% |
|
2. |
National Treasury |
5.2% |
|
3. |
Fitch Solutions |
5.1% |
|
4. |
World Bank |
4.9% |
|
5. |
International Monetary Fund |
4.8% |
|
Average |
5.1% |
|
Monetary policy continues to anchor macroeconomic stability. Inflation remains within the Central Bank’s 5 percent ± 2.5 percent target band, supported by stable food prices and easing global supply chains. External buffers strengthened as foreign exchange reserves stayed above USD 10.0 bn, providing more than 4.7 months of import cover. The shilling also remained broadly stable against the US dollar, buoyed by robust diaspora remittances, tourism receipts, and improved export performance.
The credit environment is improving following months of tight conditions. Private sector credit growth turned positive at 5.0% y/y as lending rates eased from 16.9% to 15.1%. This has supported increased borrowing in construction, trade, and agriculture, sectors sensitive to interest rate movements.
However, the World Bank raises strong concern over Kenya’s fiscal dynamics. The FY2024/25 fiscal deficit widened to 5.9% of GDP, exceeding the 4.3% target due to weak revenue performance, particularly in income and excise taxes, combined with rising recurrent expenditures. Interest payments alone reached 5.8% of GDP, underscoring the rigidity in the expenditure framework. As a result, government reliance on domestic borrowing increased to 5.0% of GDP, heightening crowding-out effects on private sector credit. The chart below shows growth in private sector credit growth over the last five years:

Public debt climbed to 68.8% of GDP, maintaining Kenya in high debt distress. While liability management operations such as the Eurobond issuance and partial refinancing of SGR obligations, have reduced short-term refinancing pressures, the shift toward shorter-term domestic debt has raised rollover risks.
Beyond cyclical headwinds, the report highlights deeper structural constraints. Kenya’s product market regulations remain among the most restrictive globally, characterized by heavy state participation in commercial sectors, opaque regulatory processes, and high tariff and non-tariff barriers. These distortions weaken competition, elevate production costs, and dampen private investment incentives. Sector-specific inefficiencies, including fertilizer distribution challenges, high electricity costs from non-competitive procurement, and dominance concerns in telecommunications, further drag productivity.
Overall, the World Bank notes that Kenya’s upward growth revision is encouraging, but sustaining this momentum will require decisive fiscal consolidation and pro-competition reforms to unlock productivity, stimulate private investment, and support broad-based job creation.
- Safaricom Launches Kshs 15.0 bn Green Note
During the week, Safaricom Plc opened the inaugural issuance under its Kshs 40.0 billion Domestic Medium Term Note (MTN) Programme, marking a significant step in deepening its local currency funding base while signaling a stronger tilt toward sustainable financing. The company announced a Kshs 15.0 bn offer, expandable by a Kshs 5.0 billion green shoe, comprising senior, unsecured, 5-year fixed-rate Green Notes priced at 10.40% per annum and targeted for listing on the Nairobi Securities Exchange (NSE).
The issuance structure reflects a deliberate attempt to diversify Safaricom’s capital-raising channels away from bank lending, where the company’s existing facilities carry a materially higher blended cost. According to the Information Memorandum, Safaricom’s weighted average cost of borrowings stood at approximately 16.3% as of March 2025, underscoring the pricing advantage of locking in medium-term capital at 10.40% in a tight domestic liquidity environment. The note therefore provides a pathway for refinancing more expensive facilities and smoothing the maturity profile while reducing overall finance costs.
The green classification of the notes is backed by Safaricom’s Sustainable Finance Framework (May 2025), which outlines eligible project categories including energy efficiency, carbon-reduction initiatives across network operations, fiber-optic expansion, sustainable data-center upgrades and initiatives supporting inclusive digital access. The company commits to allocate 100.0% of the net proceeds to such projects, with full allocation expected within 24 months, accompanied by annual allocation and impact reporting.
On governance and compliance, Safaricom obtained a CMA exemption allowing it to limit verification to annual reviews of the allocation reports until full allocation is achieved, rather than for the entire note tenor, lowering administrative costs but placing greater emphasis on timely and transparent reporting for investor assurance.
From an investor perspective, the paper offers a competitive real return relative to comparable medium-term corporate issuances, supported by Safaricom’s strong market position, robust cash-flow generation and dominant presence in Kenya’s telecom and digital financial services ecosystem. However, the notes remain unsecured, ranking pari passu with other unsecured obligations, and therefore expose investors to the company’s overall leverage position, which includes sizeable secured facilities that rank ahead in claims. Market risk, particularly secondary-market volatility upon listing, also remains a consideration. The table below presents a comparison of tax-adjusted yields against bonds with comparable tenors.
|
Cytonn Report: Tax Adjusted Bond Yield Comparison |
||||||
|
|
Tenor |
Gross Yield to Maturity |
Tax rate |
Net Yield to Maturity |
Tax Equivalent YTM (15.0% basis) |
Tax Equivalent YTM (10.0% basis) |
|
Safaricom Medium Term Note |
5 Years |
10.4% |
0.0% |
10.4% |
12.2% |
11.56% |
|
EABL Medium Term Note |
5 Years |
11.8% |
15.0% |
10.0% |
11.8% |
11.14% |
|
Normal government bond (FXD1/2011/020 |
5.4 Years |
11.9% |
10.0% |
10.7% |
12.6% |
11.85% |
Overall, the transaction represents a strategically coherent move; it lowers Safaricom’s marginal cost of capital, aligns with global sustainability-linked financing trends, and provides domestic institutional investors with a high-quality corporate green instrument in a market dominated by government securities. Its success will ultimately be judged by subscription levels, post-listing performance, and Safaricom’s discipline in delivering transparent, credible green-impact reporting consistent with the commitments in the framework.
Monthly Highlights:
- During the month, Stanbic Bank released its monthly Purchasing Managers’ Index (PMI) highlighting that the index for October 2025 rose further into expansion territory, coming in at 52.5, up from 51.9 in September 2025. This marked the second consecutive month of improvement and the strongest reading since February 2022, signaling a solid upturn in business conditions across Kenya’s private sector. The improvement was mainly driven by stronger demand, higher new orders and increased output levels, supported by easing inflationary pressures and improved supply chain efficiency Cytonn Weekly #45.
- During the month, The Energy and Petroleum Regulatory Authority (EPRA) released their monthly statement on the maximum retail fuel prices in Kenya, effective from 15th November 2025 to 14th December 2025. Notably, the maximum allowed prices for Super Petrol, Diesel and Kerosene remained unchanged from the previous pricing cycle in October. Consequently, Super Petrol, Diesel and Kerosene will continue to retail at Kshs 184.5, Kshs 171.5 and Kshs 154.8 per litre respectively Cytonn Weekly#46
Rates in the Fixed Income market have been on a downward trend due to high liquidity in the money market which allowed the government to front load most of its borrowing. The government is 194.5% ahead of its prorated net domestic borrowing target of Kshs 261.6 bn, having a net borrowing position of Kshs 770.2 bn (inclusive of T-bills). However, we expect a stabilization of the yield curve in the short and medium term, with the government looking to increase its external borrowing to maintain the fiscal surplus, hence alleviating pressure in the domestic market. As such, we expect the yield curve to stabilize in the short to medium-term and hence investors are expected to shift towards the long-term papers to lock in the high returns
Market Performance:
During the month of November, the equities market was on a downward trajectory, with NASI, NSE 25, NSE 10 and NSE 20 losing by 3.8%, 3.6%, 3.2% and 2.1% respectively. The equities market performance was mainly driven by losses recorded by large-cap stocks such as Stanbic, NCBA and Equity of 6.6%, 5.7% and 5.3% respectively. The performance was, however, supported by gains by large cap stocks such as Cooperative Bank and DTB-K of 8.5% and 5.2% respectively.
During the week, the equities market was on a downward trajectory, with NSE 10 losing the most by 4.2% while NSE 25, NASI and NSE 20 lost by 3.9%, 3.6% and 3.3% respectively, taking the YTD performance to gains of 48.3%, 44.5%, 39.4% and 39.3% for NSE 20, NASI, NSE 25 and NSE 10 respectively. The week on week equities market performance was driven by losses recorded by large-cap stocks such as KCB, EABL and ABSA of 8.6%, 5.3% and 4.6% respectively.
Also, during the month, the banking sector index increased by 26.2% to close at 191.9 from the 152.1 recorded at the end of the October. This was attributable to gains recorded by large-cap stocks such as Cooperative Bank and DTB-K of 8.5% and 5.2% respectively. The performance was, however, weighed down by losses recorded by stocks such as Stanbic, NCBA and Equity of 6.6%, 5.7% and 5.3% respectively.
During the week, the banking sector index declined by 4.1% to 191.9 from 200.1 recorded the previous week. This is attributable to losses recorded by stocks such as KCB, ABSA and Cooperative Bank of 8.6%, 4.6% and 4.4% respectively.
Equities turnover increased by 24.5% in the month of November to USD 109.5 mn from USD 88.0 mn recorded during the month of October 2025. Foreign investors remained net sellers, with a net selling position of USD 23.4 mn, from a net selling position of USD 12.4 mn recorded in October 2025.
During the week, equities turnover decreased by 17.2% to USD 24.4 mn from USD 29.4 mn recorded the previous week, taking the YTD total turnover to USD 981.6 mn. Foreign investors remained net sellers for the eighth consecutive week with a net selling position of USD 4.8 mn, from a net selling position of USD 6.4 mn recorded the previous week, taking the YTD foreign net selling position to USD 93.0 mn, compared to a net selling position of USD 88.2 mn recorded the previous week.
The market is currently trading at a price to earnings ratio (P/E) of 6.7x, 41.3% below the historical average of 11.4x, and a dividend yield of 5.5%, 0.8% points above the historical average of 4.7%. Key to note, NASI’s PEG ratio currently stands at 0.8x, an indication that the market is slightly undervalued relative to its future growth. A PEG ratio greater than 1.0x indicates the market may be overvalued while a PEG ratio less than 1.0x indicates that the market is undervalued.
The charts below indicate the historical P/E and dividend yields of the market;

Universe of Coverage:
|
Cytonn Report: Equities Universe of Coverage |
||||||||||||
|
Company |
Price as at 21/11/2025 |
Price as at 28/11/2025 |
w/w change |
m/m change |
YTD Change |
Year Open 2025 |
Target Price* |
Dividend Yield |
Upside/ Downside** |
P/TBv Multiple |
Recommendation |
|
|
Equity Group |
63.8 |
62.8 |
(1.6%) |
(5.3%) |
30.7% |
48.0 |
76.1 |
6.8% |
28.0% |
1.1x |
Buy |
|
|
Standard Chartered Bank |
298.8 |
287.5 |
(3.8%) |
(5.1%) |
0.8% |
285.3 |
320.0 |
15.7% |
27.0% |
1.6x |
Buy |
|
|
ABSA Bank |
22.9 |
21.9 |
(4.6%) |
(5.0%) |
15.9% |
18.9 |
25.3 |
8.0% |
23.8% |
1.4x |
Buy |
|
|
Diamond Trust Bank |
115.0 |
110.5 |
(3.9%) |
5.2% |
65.5% |
66.8 |
128.3 |
6.3% |
22.4% |
0.4x |
Buy |
|
|
Stanbic Holdings |
189.5 |
183.0 |
(3.4%) |
(6.6%) |
30.9% |
139.8 |
202.3 |
11.3% |
21.9% |
1.1x |
Buy |
|
|
KCB Group |
64.3 |
58.8 |
(8.6%) |
(4.5%) |
38.6% |
42.4 |
67.4 |
5.1% |
19.8% |
0.7x |
Accumulate |
|
|
I&M Group |
45.9 |
43.9 |
(4.4%) |
0.0% |
21.9% |
36.0 |
49.3 |
6.8% |
19.1% |
0.8x |
Accumulate |
|
|
Co-op Bank |
24.0 |
22.9 |
(4.4%) |
8.5% |
31.2% |
17.5 |
23.9 |
6.6% |
10.9% |
0.8x |
Accumulate |
|
|
Britam |
8.7 |
8.7 |
(0.2%) |
0.5% |
49.5% |
5.8 |
9.5 |
0.0% |
9.4% |
0.8x |
Hold |
|
|
NCBA |
84.3 |
83.0 |
(1.5%) |
(5.7%) |
62.7% |
51.0 |
79.0 |
6.6% |
1.8% |
1.3x |
Lighten |
|
|
Jubilee Holdings |
325.0 |
325.0 |
0.0% |
1.6% |
86.0% |
174.8 |
312.9 |
4.2% |
0.4% |
0.5x |
Lighten |
|
|
CIC Group |
4.6 |
4.6 |
0.0% |
(1.1%) |
114.5% |
2.1 |
4.0 |
2.8% |
(9.4%) |
1.2x |
Sell |
|
|
*Target Price as per Cytonn Analyst estimates **Upside/ (Downside) is adjusted for Dividend Yield ***Dividend Yield is calculated using FY’2024 Dividends |
||||||||||||
Weekly Highlights
- Standard Chartered Q3’ Financial Results
Below is a summary of Standard Chartered Bank Ltd Q3’2025 performance:
|
Balance Sheet Items |
Q3'2024 |
Q3'2025 |
y/y change |
|
Net loans |
151.3 |
146.4 |
(3.2%) |
|
Government Securities |
68.1 |
106.2 |
55.9% |
|
Total Assets |
370.9 |
384.4 |
3.6% |
|
Customer Deposits |
284.4 |
283.4 |
(0.3%) |
|
Deposits per Branch |
11.4 |
12.9 |
13.2% |
|
Total Liabilities |
304.4 |
320.7 |
5.3% |
|
Shareholder's Funds |
66.5 |
63.8 |
(4.1%) |
|
Balance Sheet Ratios |
Q3'2024 |
Q3'2025 |
y/y change |
|
Loan to deposit ratio |
53.2% |
51.7% |
(1.5%) |
|
Government securities to deposit ratio |
23.9% |
37.5% |
13.5% |
|
Return on Average Equity |
31.6% |
21.5% |
(10.1%) |
|
Return on Average Assets |
5.4% |
3.7% |
(1.7%) |
|
Income Statement |
Q3'2024 |
Q3'2025 |
y/y change |
|
Net Interest Income |
24.8 |
22.3 |
(10.3%) |
|
Net non-Interest Income |
14.2 |
10.2 |
(28.6%) |
|
Total Operating income |
39.1 |
32.4 |
(17.0%) |
|
Loan Loss provision |
2.0 |
1.7 |
(10.9%) |
|
Total Operating expenses |
16.6 |
19.2 |
15.8% |
|
Profit before tax |
22.5 |
13.2 |
(41.2%) |
|
Profit after tax |
15.8 |
9.8 |
(38.2%) |
|
Core EPS |
41.9 |
25.9 |
(38.2%) |
|
Income Statement Ratios |
Q3' 2024 |
Q3' 2025 |
% points change |
|
Yield from interest-earning assets |
11.8% |
10.6% |
(1.2%) |
|
Cost of funding |
1.7% |
1.5% |
(0.3%) |
|
Net Interest Spread |
10.1% |
9.2% |
(0.9%) |
|
Net Interest Margin |
10.2% |
9.3% |
(0.9%) |
|
Cost of Risk |
5.0% |
5.4% |
0.4% |
|
Net Interest Income as % of operating income |
63.6% |
68.7% |
5.1% |
|
Non-Funded Income as a % of operating income |
36.4% |
31.3% |
(5.1%) |
|
Cost to Income Ratio |
42.5% |
59.3% |
16.8% |
|
Cost to Income Ratio without LLP |
37.5% |
53.9% |
16.4% |
|
Cost to Assets |
4.0% |
4.6% |
0.7% |
|
Capital Adequacy Ratios |
Q3'2024 |
Q3'2025 |
% points change |
|
Core Capital/Total Liabilities |
20.2% |
20.2% |
(0.0%) |
|
Minimum Statutory ratio |
8.0% |
8.0% |
0.0% |
|
Excess |
12.2% |
12.2% |
(0.0%) |
|
Core Capital/Total Risk Weighted Assets |
20.9% |
20.6% |
(0.4%) |
|
Minimum Statutory ratio |
10.5% |
10.5% |
0.0% |
|
Excess |
10.4% |
10.1% |
(0.4%) |
|
Total Capital/Total Risk Weighted Assets |
21.0% |
20.6% |
(0.4%) |
|
Minimum Statutory ratio |
14.5% |
14.5% |
0.0% |
|
Excess |
6.5% |
6.1% |
(0.4%) |
|
Liquidity Ratio |
65.4% |
66.6% |
1.2% |
|
Minimum Statutory ratio |
20.0% |
20.0% |
0.0% |
|
Excess |
45.4% |
46.6% |
1.2% |
Key Take-Outs:
- Declined earnings growth - Core earnings per share decreased by 38.2% to Kshs 25.9 in Q3’ 2025, from Kshs 41.9 in Q3’2024, mainly driven by the 17.0% decrease in total operating income to Kshs 32.4 bn in Q3’ 2025, from Kshs 39.1 bn in Q3’ 2024, coupled with the 15.8% increase in total operating expenses to Kshs 19.2 bn in Q3’ 2025, from Kshs 16.6 bn in Q3’2024
- Improved asset quality – The bank’s Asset Quality improved, with Gross NPL ratio decreasing to 5.9% in Q3’ 2025, from 7.5% in Q3’ 2024, attributable to the 24.8% decrease in gross non-performing loans to Kshs 9.1 bn, from Kshs 12.1 bn in Q3’ 2024, which outpaced the 4.6% decrease in gross loans to Kshs 154.2 bn, from Kshs 161.6 bn recorded in Q3’ 2024, and,
- Decreased Lending – The bank’s loan book decreased by 4.6% to Kshs 154.2 bn from Kshs 161.6 bn in Q3’2024.
- Declaration of dividends- The board of directors did not declare an interim dividend for the period, consistent with Q3’ 2024.
For a more detailed analysis, please see the Standard Chartered Q3’ 2025 Earnings Note
- HF Q3’ 2025 Financial Results
Below is a summary of HF Group’s Q3’2025 performance:
|
Balance Sheet Items |
Q3'2024 |
Q3'2025 |
y/y change |
|
Net loans |
38.2 |
39.3 |
2.8% |
|
Government Securities |
13.2 |
25.6 |
94.3% |
|
Total Assets |
65.6 |
79.9 |
21.9% |
|
Customer Deposits |
45.0 |
54.7 |
21.6% |
|
Deposits Per Branch |
2.0 |
2.5 |
21.6% |
|
Total Liabilities |
56.2 |
62.6 |
11.3% |
|
Shareholder's Funds |
9.4 |
17.4 |
85.1% |
|
Balance Sheet Ratios |
Q3'2024 |
Q3'2025 |
y/y change |
|
Loan to deposit ratio |
84.9% |
71.7% |
(13.2%) |
|
Government Securities to deposit ratio |
29.2% |
46.7% |
17.5% |
|
Return on Average Equity |
7.0% |
7.7% |
0.7% |
|
Return on Average Assets |
1.0% |
1.4% |
0.4% |
|
Income Statement |
Q3'2024 |
Q3'2025 |
y/y change |
|
Net Interest Income |
2.0 |
3.2 |
63.3% |
|
Net non-Interest Income |
1.0 |
1.3 |
28.6% |
|
Total Operating income |
3.0 |
4.5 |
51.6% |
|
Loan Loss provision |
(0.2) |
(0.3) |
20.7% |
|
Total Operating expenses |
(2.7) |
(3.4) |
26.5% |
|
Profit before tax |
0.3 |
1.1 |
264.9% |
|
Profit after tax |
0.5 |
1.0 |
104.5% |
|
Core EPS |
1.7 |
0.7 |
(58.3%) |
|
Income Statement Ratios |
Q3'2024 |
Q3'2025 |
y/y change |
|
Yield from interest-earning assets |
11.8% |
12.3% |
0.5% |
|
Cost of funding |
6.8% |
6.1% |
(0.7%) |
|
Net Interest Spread |
5.0% |
6.2% |
1.2% |
|
Net Interest Margin |
5.1% |
6.6% |
1.5% |
|
Cost of Risk |
8.4% |
6.7% |
(1.7%) |
|
Net Interest Income as % of operating income |
66.1% |
71.2% |
5.1% |
|
Non-Funded Income as a % of operating income |
33.9% |
28.8% |
(5.1%) |
|
Cost to Income Ratio |
89.5% |
74.7% |
(14.8%) |
|
Cost to Income Ratio (without LLP) |
81.1% |
68.0% |
(13.1%) |
|
Capital Adequacy Ratios |
Q3'2024 |
Q3'2025 |
y/y change |
|
Core Capital/Total Liabilities |
3.7% |
16.8% |
13.1% |
|
Minimum Statutory ratio |
8.0% |
8.0% |
0.0% |
|
Excess |
(4.3%) |
8.8% |
13.1% |
|
Core Capital/Total Risk Weighted Assets |
4.3% |
21.9% |
17.6% |
|
Minimum Statutory ratio |
10.5% |
10.5% |
0.0% |
|
Excess |
(6.2%) |
11.4% |
17.6% |
|
Total Capital/Total Risk Weighted Assets |
7.7% |
24.6% |
16.9% |
|
Minimum Statutory ratio |
14.5% |
14.5% |
0.0% |
|
Excess |
(6.8%) |
10.1% |
16.9% |
|
Liquidity Ratio |
26.1% |
54.2% |
28.1% |
|
Minimum Statutory ratio |
20.0% |
20.0% |
0.0% |
|
Excess |
6.1% |
34.2% |
28.1% |
Key Take-Outs:
- Improved Profitability – HF posted a 104.5% increase in Profit After Tax to Kshs 1.0 bn from Kshs 0.5 bn in Q3’2024, supported by a 63.3% growth in net interest income to Kshs 3.2 bn from Kshs 2.0 bn in Q3’2024 and a 28.6% increase in non-interest income to Kshs 1.3 bn from Kshs 1.0 bn in Q3’2024. However, operating expenses rose by 26.5% to Kshs 3.4 bn from Kshs 2.7 bn, weighing on performance, while core EPS declined by 58.3% to Kshs 0.7 from Kshs 1.7 due to dilution from the Kshs 6.0 bn rights issue in 2024.
- Improved asset quality – The bank’s asset quality improved, as the Gross NPL ratio declined to 23.3% in Q3’2025 from 24.4% in Q3’2024. This was supported by a 1.2% growth in gross loans to Kshs 47.5 bn from Kshs 46.9 bn in Q3’2024, compared to the 3.3% decline in gross non-performing loans to Kshs 11.1 bn from Kshs 11.5 bn in Q3’2024
- Expanded Balanced sheet - The balance sheet recorded an expansion as total assets increased by 21.9% to Kshs 79.9 bn, from Kshs 65.6 bn in Q3’2024, mainly driven by a 94.3% increase in governments securities holdings to Kshs 25.6 bn, from 13.2 bn in Q3’2024, coupled with a 2.8% increase in net loans and advances to Kshs 39.3 bn, from Kshs 38.2 bn in Q3’2024.
- Increased lending- Customer net loans and advances increased by 2.8% to Kshs 39.3 bn in Q3’2025, from Kshs 38.2 bn in Q3’2024.
Summary Performance
The table below shows the performance of listed banks that have released their Q3’ 2025 results using several metrics:
|
Bank |
Core EPS Growth |
Interest Income Growth |
Interest Expense Growth |
Net Interest Income Growth |
Net Interest Margin |
Non-Funded Income Growth |
NFI to Total Operating Income |
Growth in Total Fees & Commissions |
Deposit Growth |
Growth in Government Securities |
Loan to Deposit Ratio |
Loan Growth |
Return on Average Equity |
COF |
YIEA |
|
Equity Group |
32.7% |
2.9% |
(20.7%) |
16.1% |
7.9% |
2.5% |
40.1% |
7.6% |
2.2% |
19.9% |
63.9% |
7.5% |
24.5% |
3.7% |
11.3% |
|
I&M Group |
24.2% |
0.6% |
(23.1%) |
21.1% |
8.3% |
17.9% |
26.0% |
15.7% |
10.2% |
65.2% |
66.2% |
7.3% |
19.2% |
5.3% |
13.1% |
|
Absa Bank Kenya |
14.7% |
(9.6%) |
(21.9%) |
(4.6%) |
9.6% |
11.2% |
29.2% |
16.3% |
9.2% |
71.1% |
80.6% |
(0.6%) |
26.8% |
3.8% |
12.9% |
|
Diamond Trust Bank |
12.3% |
0.9% |
(14.6%) |
17.9% |
6.1% |
(5.8%) |
26.7% |
10.7% |
15.5% |
22.9% |
58.1% |
7.8% |
11.2% |
5.5% |
11.3% |
|
Co-operative Bank |
12.3% |
10.0% |
(9.0%) |
22.8% |
8.7% |
(0.8%) |
32.8% |
1.6% |
6.7% |
20.7% |
74.1% |
6.6% |
18.8% |
5.4% |
13.4% |
|
NCBA Group |
8.5% |
(11.8%) |
(42.3%) |
27.4% |
7.3% |
(1.9%) |
40.0% |
2.5% |
(5.3%) |
3.0% |
60.0% |
(3.5%) |
21.0% |
5.3% |
12.1% |
|
KCB Group |
0.7% |
1.1% |
(17.6%) |
12.4% |
8.4% |
(10.1%) |
30.2% |
(1.5%) |
(0.8%) |
6.1% |
74.7% |
8.2% |
22.7% |
4.0% |
12.2% |
|
Stanbic Group |
(7.7%) |
(17.2%) |
(41.4%) |
8.0% |
6.3% |
(24.5%) |
27.6% |
1.1% |
4.9% |
32.8% |
73.6% |
15.7% |
13.4% |
4.5% |
11.1% |
|
Standard Chartered Bank |
(38.2%) |
(13.5%) |
(9.2%) |
(10.3%) |
9.3% |
(28.6%) |
31.3% |
(6.9%) |
(0.3%) |
55.9% |
51.7% |
(3.2%) |
21.5% |
1.5% |
10.6% |
|
HF Group |
(58.3%) |
19.4% |
(12.4%) |
63.3% |
6.6% |
28.6% |
28.8% |
(10.1%) |
21.6% |
94.3% |
71.7% |
2.8% |
7.7% |
6.1% |
12.3% |
|
Q3'2025 Mkt Weighted Average* |
7.8% |
(1.8%) |
(20.0%) |
12.4% |
8.3% |
(3.3%) |
32.7% |
4.3% |
3.9% |
31.8% |
68.4% |
5.4% |
21.4% |
4.1% |
12.0% |
|
Q3’2024 Mkt Weighted Average** |
16.9% |
22.5% |
41.4% |
12.5% |
6.6% |
5.4% |
32.3% |
6.2% |
2.6% |
4.8% |
59.6% |
(3.1%) |
19.5% |
4.6% |
10.9% |
|
*Market cap weighted as at 28/11/2025 |
|||||||||||||||
|
**Market cap weighted as at 18/11/2024 |
|||||||||||||||
Key take-outs from the table include:
- The listed banks that have released their Q3’2025 results recorded a 7.8% growth in core Earnings per Share (EPS) in Q3’2025, compared to the weighted average growth of 16.9% in Q3’2024.
- Interest income recorded a weighted average decline of 1.8% in Q3’2025, compared to the 22.5% growth recorded in Q3’2024. Interest expenses recorded a market-weighted average decline of 20.0% in Q3’2025, compared to a 41.4% increase in Q3’2024.
- The Banks’ net interest income recorded a weighted average growth of 12.4% in Q3’2025, from the 12.5% growth recorded over a similar period in 2024, while non-funded income declined by 3.3% in Q3’2025 compared to the 5.4% growth recorded in Q3’2024, and,
- The Banks recorded a weighted average deposit growth of 3.9% in Q3’2025, compared to the market-weighted average deposit growth of 2.6% in Q3’2024.
Asset Quality:
The table below shows the asset quality of listed banks that have released their Q3’2025 results using NPL ratio and NPL coverage:
|
Bank |
Q3'2025 NPL Ratio* |
Q3'2024 NPL Ratio** |
% point change in NPL Ratio |
Q3'2025 NPL Coverage* |
Q3'2024 NPL Coverage** |
% point change in NPL Coverage |
|
Absa Bank Kenya |
13.0% |
12.6% |
0.5% |
67.1% |
65.3% |
1.8% |
|
Equity Group |
13.6% |
14.4% |
(0.8%) |
71.1% |
56.8% |
14.4% |
|
Stanbic Holdings |
8.2% |
10.4% |
(2.2%) |
83.2% |
76.5% |
6.7% |
|
Cooperative Bank |
17.3% |
16.5% |
0.8% |
63.7% |
60.5% |
3.2% |
|
KCB Group |
17.2% |
18.1% |
(0.9%) |
67.9% |
63.8% |
4.1% |
|
I&M Group |
10.2% |
11.8% |
(1.6%) |
69.5% |
61.3% |
8.2% |
|
Diamond Trust Bank |
12.4% |
13.5% |
(1.0%) |
52.1% |
39.1% |
13.0% |
|
Standard Chartered Bank |
5.9% |
7.5% |
(1.6%) |
85.1% |
85.3% |
(0.1%) |
|
NCBA Bank |
12.1% |
12.5% |
(0.4%) |
68.9% |
59.7% |
9.2% |
|
HF Group |
23.3% |
24.1% |
(0.8%) |
74.3% |
74.4% |
(0.2%) |
|
Mkt Weighted Average* |
13.3% |
13.5% |
(0.2%) |
70.7% |
64.5% |
6.2% |
Key take-outs from the table include;
- Asset quality for the listed banks that have released results improved during Q3’2025, with the market-weighted average NPL ratio decreasing by 0.2% points to 13.3%, from 13.5% in Q3’2024. The improvement was supported by reduced NPL ratios across several banks, including Stanbic Holdings, I&M Group, Standard Chartered, DTB, NCBA Bank, Equity Group and HF Group.
- Market-weighted average NPL coverage increased by 6.2% points to 70.7% in Q3’2025 from 64.5% recorded in Q3’2024. The increase was attributable to increases in coverage by individual banks such as Equity Group by 14.4% points, Diamond Trust Bank by 13.0% points, I&M Group by 8.2% points, and NCBA Bank by 9.2% points.
- Centum Investments HY’ 2026 financial performance
During the week, Centum Investments Company PLC released their HY’2026 financial results for the period ending 30th September 2025, recording a 5.9% decrease in the Loss After Tax to Kshs 0.33 bn in HY’2026, from Kshs 0.35 bn in HY’ 2025. The decrease was mainly attributable to a 46.6% decrease in loss from their Real Estate business to Kshs 0.1 bn, from Kshs 0.2 bn in HY’2025, coupled with a 3.0% decrease in loss from their Trading Business to Kshs 0.30 bn in HY’2026, from Kshs 0.31 bn in HY’ 2025. The tables below show the breakdown of the Group’s financial performance;
|
Cytonn Report: Centum Investments Plc Income Statement |
|||
|
|
HY' 2025 |
HY' 2026 |
y/y change |
|
|
(Kshs. Bn) |
(Kshs. Bn) |
(%) |
|
Trading Business |
|
|
|
|
Net income from trading businesses |
0.9 |
0.8 |
(11.4%) |
|
Direct and other operating costs |
(1.2) |
(1.0) |
(9.2%) |
|
Loss from trading businesses |
(0.3) |
(0.3) |
(3.0%) |
|
Financial Services |
|
|
|
|
Income from financial services |
0.2 |
0.3 |
15.9% |
|
Funding and other costs |
(0.2) |
(0.2) |
12.7% |
|
Share of profit from associate |
0.0 |
|
(100.0%) |
|
Profit/(loss) from financial services |
0.1 |
0.05 |
(33.0%) |
|
|
|
|
|
|
Real Estate Business |
|
|
|
|
Gross profit from residential unit sales |
0.1 |
0.1 |
(55.7%) |
|
Gain on disposal of investment properties |
0.0 |
0.0 |
(56.3%) |
|
Other income |
0.0 |
0.0 |
8.0% |
|
Operating costs |
(0.3) |
(0.4) |
17.8% |
|
Operating profit from Centum Real Estate |
(0.1) |
(0.3) |
117.9% |
|
Funding Income/(Costs) |
(0.0) |
0.2 |
(576.6%) |
|
Profit/(loss) |
(0.2) |
(0.1) |
(46.6%) |
|
|
|
|
|
|
Two Rivers Development |
|
|
|
|
Sales and investments income |
0.1 |
0.1 |
3.3% |
|
Direct and other operating costs |
(0.2) |
(0.1) |
(22.9%) |
|
Finance costs |
(0.0) |
(0.1) |
590.5% |
|
Loss from Two Rivers Development Group |
(0.1) |
(0.1) |
33.9% |
|
Two Rivers Special Economic Zone |
|
|
|
|
Sales and investments income |
0.1 |
0.1 |
142.5% |
|
Operating and administrative costs |
(0.1) |
(0.1) |
30.7% |
|
Funding and other costs |
(0.2) |
(0.6) |
144.9% |
|
Profit/(loss) from Two Rivers Special Economic Zone |
(0.3) |
(0.6) |
102.9% |
|
|
|
|
|
|
Investment operations |
|
|
|
|
Investment and other income |
0.9 |
0.6 |
(38.6%) |
|
Operating and administrative costs |
(0.3) |
(0.3) |
7.7% |
|
Finance costs |
(0.1) |
(0.0) |
(64.4%) |
|
Share of profit of joint venture |
|
0.1 |
|
|
Profit/(loss) from investment operations |
0.6 |
0.4 |
(31.7%) |
|
|
|
|
|
|
Profit/ (Loss) before tax |
(0.2) |
(0.6) |
236.4% |
|
Income tax (expense)/credit |
(0.2) |
0.3 |
(283.7%) |
|
Profit/(loss) for the year |
(0.35) |
(0.33) |
(5.9%) |
|
Earnings Per Share |
(0.22) |
(0.18) |
(18.2%) |
Source: Centum Investments Company PLC HY’2026 financial statements
|
Cytonn Report: Centum Investments PLC Balance Sheet |
|||
|
|
HY' 2025 |
HY' 2026 |
y/y change |
|
|
(Kshs. Bn) |
(Kshs. Bn) |
(%) |
|
Investment Portfolio |
8.7 |
9.1 |
4.5% |
|
Cash and cash equivalents |
1.1 |
1.8 |
63.2% |
|
Other assets |
72.6 |
73.7 |
1.6% |
|
Total assets |
82.4 |
84.6 |
2.7% |
|
Borrowings |
17.9 |
21.2 |
19.0% |
|
Other liabilities |
21.3 |
20.4 |
(3.9%) |
|
Total liabilities |
39.1 |
41.7 |
6.6% |
|
Total Equity |
43.2 |
42.9 |
(0.7%) |
|
Total Equity and Liabilites |
82.4 |
84.6 |
2.7% |
Source: Centum Investments Company PLC HY’2026 financial report
Key take outs from the financial performance include;
- Losses from the Group decreased by 5.9% to Kshs 0.33 bn in HY’ 2026, from Kshs 0.35 bn recorded in HY’2025, mainly attributable to a 46.6% decrease in loss from their Real Estate business to Kshs 0.1 bn, from Kshs 0.2 bn in HY’2025, coupled with a 3.0% decrease in loss from their Trading Business to Kshs 0.30 bn in HY’2026, from Kshs 0.31 bn in HY’ 2025.
- Losses from the Group’s trading business decreased by 3.0% to Kshs 0.30 bn in HY’2026, from a loss of Kshs 0.31 bn recorded in HY’2025, mainly attributable to a 11.4% decrease in Net income from trading businesses to Kshs 0.8 bn in HY’2026 from Kshs 0.9 bn recorded in HY’2025.
- The Group witnessed an 33.0% profit decline from finance and investments operations business to Kshs 0.05 bn, from Kshs the 0.08 bn loss recorded in HY’2025.
- The Group’s balance sheet recorded an expansion, with the total assets increasing by 2.7% to Kshs. 84.6 bn in HY’ 2026 from the Kshs 82.4 bn recorded in HY’2025. This is mainly attributable to increase in investment portfolio by 4.5% to Kshs 9.1 bn during the period, from Kshs 8.7 bn in HY’2025, coupled with a 63.2% increase in cash and cash equivalents to Kshs 1.8 bn in HY’2026 from Kshs 1.1 bn in HY’2025.
- Earnings per share decreased by 18.2% to a loss of Kshs 0.18, from the Kshs 0.22 loss per share in HY’2025, largely driven by a 5.9% decrease in loss after tax to Kshs 0.33 bn, from Kshs 0.35 bn loss in HY’2025. Additionally, the Board of Directors did not recommend an interim dividend payment for the period
Going forward, Centum intends to build on the resilience demonstrated in the first half of the year by deepening its focus on cash generation, disciplined capital allocation, and asset quality enhancement. The Group will continue executing targeted exits from mature assets while channeling capital toward high-yield, cash-positive investments that strengthen the balance sheet. Management expects further momentum from the real estate portfolio as completed residential units translate into cash collections, alongside consistent performance from the marketable securities portfolio. Additionally, the Group remains committed to operational efficiency across all subsidiaries, ensuring that operating costs remain aligned with revenue growth. With a strengthened liquidity position and clearer visibility on the completion and monetization of key development projects, Centum is positioning itself for sustained profitability and improved shareholder value in the coming periods.
Monthly Highlights
- During the week, Safaricom Plc released its H1’2026 financial results for the period ending 30th September 2025, highlighting that the profit after tax (PAT) for the Group increased by 191.5% to Kshs 29.2 bn, from Kshs 10.0 bn recorded in H1’2025. The strong performance was largely attributable to a 9.6% decrease in operating expenses to Kshs 103.4 bn from Kshs 114.4 bn recorded in H1’2025, an 8.1% growth in total revenue to Kshs 204.7 bn from Kshs 189.4 bn, a 9.4% reduction in net finance costs to Kshs 9.9 bn from Kshs 10.9 bn, and a 23.2% points decrease in the effective tax rate to 47.2% in H1’2026 from 70.4% in H1’2025. For more information, please see our Cytonn Weekly #45/2025
- During the week, KCB Group Plc revealed its acquisition of an undisclosed minority stake in Pesapal Limited which in 2021 was granted a Payment Service Provider (PSP) License by the Central Bank of Kenya which allowed Pesapal to carry out Payment Gateway Services in compliance with the National Payment System Act, 2011. This move proves to be strategic as KCB strives to capture the biggest market share of the fast-growing fintech market. This also comes after their recent 75.0% majority stake acquisition of Riverbank Solutions, which was valued at Kshs 2.0 bn. For more information, please see our Cytonn Weekly #45/2025
We are “Bullish” on the Equities markets in the short term due to current cheap valuations, lower yields on short-term government papers and expected global and local economic recovery, and, “Neutral” in the long term due to persistent foreign investor outflows. With the market currently trading at a discount to its future growth (PEG Ratio at 0.8x), we believe that investors should reposition towards value stocks with strong earnings growth and that are trading at discounts to their intrinsic value. We expect the current high foreign investors sell-offs to continue weighing down the economic outlook in the short term.
- Industry Report
- September Leading Economic Indicators (LEI)
During the week, the Kenya National Bureau of Statistics (KNBS) released the Leading Economic Indicators (LEI) September 2025 Report, which highlighted the performance of major economic indicators. Key highlights related to the Real Estate sector include:
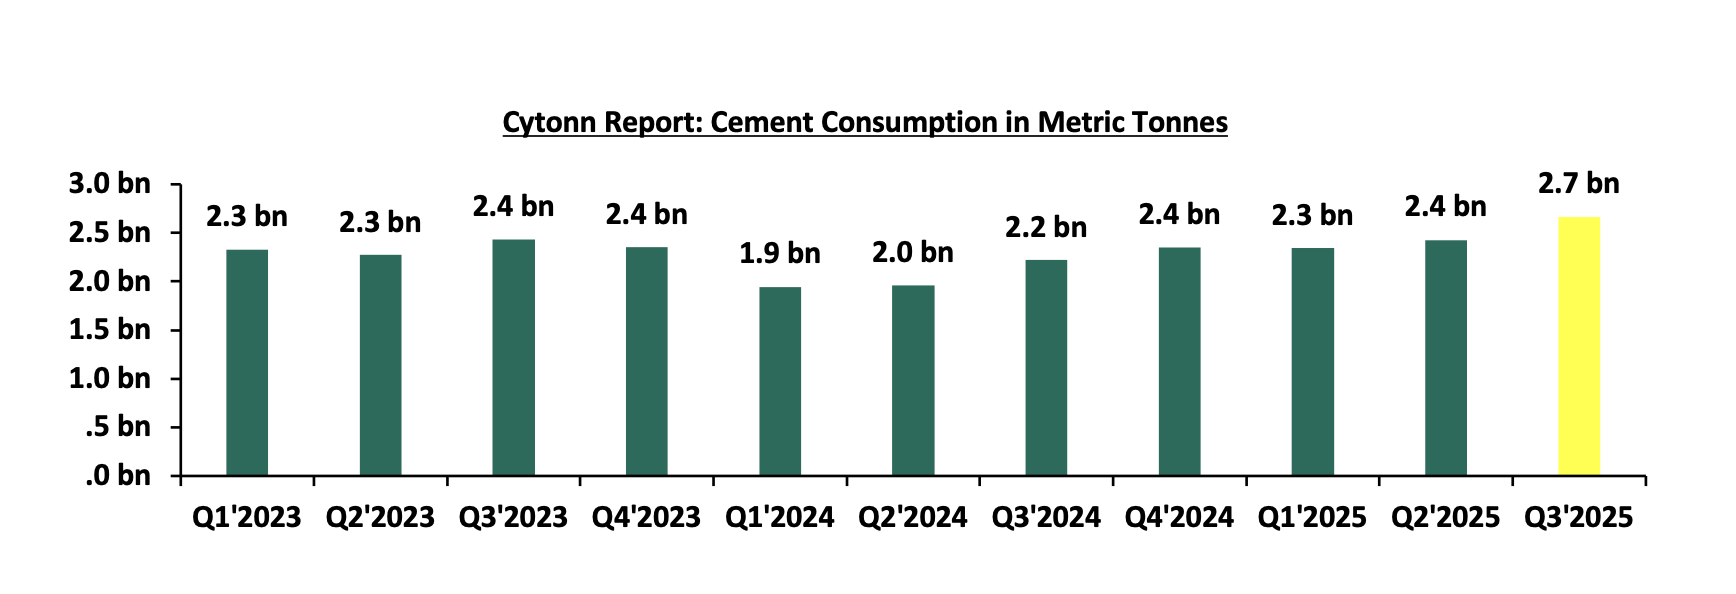
- In Q3’2025, cement consumption increased to 2.7 bn metric tonnes, a 19.9% y/y increase from 2.2 bn in Q3’2024. On a quarter-on quarter basis, cement consumption grew by 9.9%, underscoring resilience in construction demand. The performance was anchored by (i) continued private sector construction activity in urban hubs like Nairobi, Mombasa, and Kisumu, (ii) government-led infrastructure investments under the Bottom-Up Economic Transformation Agenda (BETA), including roads, affordable housing, water, and sanitation projects, and (iii) public works initiatives in rural and semi-urban areas, which both support livelihoods and expand critical infrastructure.
The chart below shows cement consumption in metric tonnes in Kenya between Q1’2023 and Q3’ 2025.
Source: Kenya National Bureau of Statistics (KNBS)
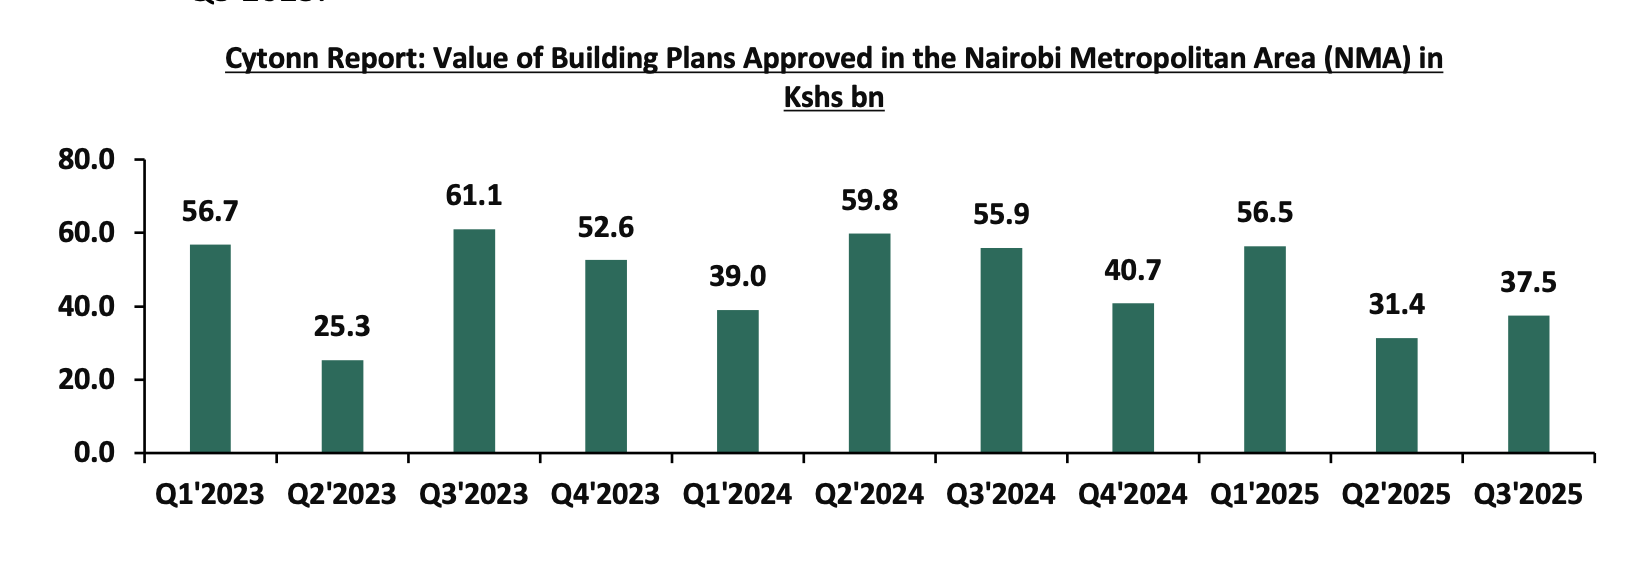
- In Q3’2025, the value of building plans approved in Nairobi City County declined by 33.0% on year-on-year basis to Ksh 37.5 bn from Ksh 55.9 bn in Q3’2024 and a 19.3% increase on quarter-on-quarter basis, pointing to strengthening in overall development activity. The slowdown on year-on-year basis reflects (i) a cautious investment climate in Real Estate amid elevated construction costs, with luxurious office block costs in the Nairobi Metropolitan Area rising by 11.0%, discouraging new project starts, (ii) longer approval timelines due to increased scrutiny and procedural reforms by planning authorities, and (iii) a strategic shift by developers toward completing ongoing projects rather than initiating new ones, especially in oversupplied segments such as commercial office space.
The chart below shows the building plans approved in billions in Kenya between Q1’2023 and Q3’2025.
Source: Kenya National Bureau of Statistics (KNBS)
- In Q3’2025, the number of arrivals was 745,720 reflecting a 35.1% increase from 552,108 arrivals recorded in Q2’2025. On a year-on-year basis, this represented a 52.2% increase compared to 489,831 arrivals in Q3’2024. The improved performance can be attributed to several factors; i) recovery globally in the tourism industry coupled with a strong marketing campaign, ii) visa openness following the introduction of the Electronic Tourist Authorization (eTA) at the beginning of the year, iii) improvements in air connectivity through introduction of new routes and more frequencies by major airlines and the introduction of direct flights by three new airlines—IndiGo (Mumbai-Nairobi), Fly Dubai (Dubai-Mombasa), and Airlink (Johannesburg-Nairobi), iv) the creation of specialized tourism offerings such as cruise, adventure, cultural, and sports tourism, and, v) expanded global promotion of Kenya's tourism by the Ministry of Tourism and the Kenya Tourism Board using platforms like Magical Kenya. The chart below shows the number of international arrivals in Kenya between Q1’2023 and Q3’2025;

Source: Kenya National Bureau of Statistics (KNBS)
Notable industry highlights during the month include:
|
Cytonn Report: Notable Industry Reports during November 2025 |
|||
|
# |
Theme |
Report |
Key Take-outs |
|
1. |
Residential Sector |
Hass Consult Property Index Q3’2025 Report |
The average selling prices for all properties posted a 1.1% increase on a quarter-on-quarter (q/q) basis in Q3’2025, 2.7% points decrease from 3.8% recorded in Q2’2025. For more information, please see our Cytonn Weekly #45/2025 |
|
2 |
Land Sector |
Hass consult Land Price Index Q3’2025 Report |
In Q3’2025, the average quarter-on-quarter selling prices for land in Nairobi suburbs increased by 1.2%, down from the 1.7% recorded in Q2’2025. For more information, please see our Cytonn Weekly #45/2025 |
- Hospitality Sector
- Kenya signs a Bilateral Air Services Agreement with Malaysia
During the week, Kenya and Malaysia signed several agreements aimed at strengthening bilateral ties. The two countries finalized an air services agreement that will improve connectivity between Nairobi and Kuala Lumpur, making travel more convenient for traders, investors, and tourists. They also signed a letter of intent to twin Nairobi and Kuala Lumpur, a partnership designed to enhance collaboration in urban planning, technology, and service delivery. In addition, an MOU between the Kenya National Chamber of Commerce and Industry (KNCCI) and the Malaysian Chamber of Commerce will foster deeper private sector cooperation and expand business opportunities for enterprises in both countries.
This will have a positive impact on Kenya’s Hospitality Sector. For instance,
- Increased tourist arrivals- Improved air connectivity especially through direct or more frequent flights reduces travel barriers and makes trips between Nairobi and Kuala Lumpur more appealing. This convenience encourages more Malaysians to visit Kenya and more Kenyans to explore Malaysia, boosting overall tourist numbers,
- Growth in hospitality and travel services- As more travellers move between the two cities, demand for hotels, restaurants, tour operators, and local transport services will rise. This increased activity stimulates job creation and revenue growth within the wider tourism value chain, and,
- Expansion of Kenya’s tourism source markets- Improved connectivity helps Kenya diversify beyond its traditional tourism markets in Europe and North America. Attracting visitors from Southeast Asia strengthens resilience in the tourism sector by reducing reliance on a few regions and tapping into a fast-growing Asian travel market.
There were two notable hospitality highlights during the month;
- During the month, Jambojet revealed its plans to triple its fleet and launch longer routes, including new destinations in West and Southern Africa over the next five years as revenue surpasses the Kshs 13.0 bn attributable to increased demand. This expansion will allow Jambojet to increase frequency of flights in Kenya under the De Havilland Dash 8-400 plane as well as acquire other aircrafts to deepen presence in East Africa and enter markets in west Africa, South Africa and North Africa. For more information, please see our Cytonn Weekly #47/2025,
- During the week, the Cabinet approved a proposal to establish the Nairobi National Park–Athi-Kapiti Wildlife Migration Corridor, reconnecting vital wildlife routes spanning Machakos and Kajiado counties. For more information, please see our Cytonn Weekly #47/2025.
We expect the hospitality sector to record positive performance, supported by the bilateral air services agreement between Kenya and Malaysia which will improve connectivity between Nairobi and Kuala Lumpur, Jambojet plans to triple its fleet and new destinations in West and South Africa and approval by the cabinet to establish the Nairobi national park-Athi-Kapiti wildlife migration corridor. However, inconsistent infrastructure in rural areas and financial constraints in urban markets remain key challenges that could limit the sector’s optimal growth.
- Infrastructure Sector
- US President Donald Trump cancels the MCC grant
During the week, US President cancelled a Kshs 7.8 bn (USD 60.0 mn) Millennium Challenge Corporation (MCC) Threshold Program that had been agreed upon between his predecessor and Kenya’s President. The programme, signed in September 2023 and effective from May 2024, was designed to support Nairobi’s Bus Rapid Transit (BRT) system by enhancing urban mobility, improving long-term planning, and funding climate-friendly and gender-inclusive transport solutions. It was to run through June 2027, with the US contributing Kshs 5.8 bn and Kenya Kshs 1.6 bn.
The termination comes as part of a broader rollback of foreign aid by the Trump administration. Nairobi’s BRT system is envisioned to include five major lines i.e Ndovu, Simba, Chui, Kifaru, and Nyati supported by various international partners. These lines were to feature dedicated lanes, EV-charging depots, pedestrian facilities, and modern stations.
The cancellation of the MCC grant widens the financing shortfall for Nairobi’s BRT system, causing delays in construction, stalled contractor payments, and increased risk of cost overruns across related transport infrastructure projects.
- President William Ruto launches the dualling of the Rironi-Mau Summit highway
During the week, President William Ruto launched the dualling of the 170-kilometre Rironi–Nakuru–Mau Summit Road, a major upgrade intended to ease congestion and improve safety along one of Kenya’s busiest transport corridors. The project, undertaken through a public-private partnership by a consortium including China Road and Bridge Corporation (CRBC) and the National Social Security Fund (NSSF), will expand the road into a four-lane dual carriageway from Rironi to Naivasha and a six-lane dual carriageway from Naivasha to Nakuru. The cost of the project is estimated to be between Kshs 170 bn and Kshs 200 bn. The adjacent Rironi–Maai Mahiu–Naivasha stretch will also be upgraded.
The improved highway is expected to reduce accidents, lower transport and freight costs, and enhance the movement of goods and people between Nairobi, Nakuru, and the Rift Valley. This will open new markets for farmers and boost trade, commerce, and investment along the corridor. The project, scheduled for completion in June 2027, forms part of the government’s broader infrastructure push to dual 1,000 km of highways and strengthen regional connectivity as part of the national development agenda.
Notable Infrastructure sector highlights during the month include:
- During the month, the Cabinet endorsed the dualling of the heavily congested Muthaiga–Kiambu–Ndumberi 25.0 km road, a project expected to cost Kshs 65.0 bn. The project will expand the existing two-lane road into a dual carriageway with new bypasses, loops, pedestrian walkways, non-motorised transport lanes and enhanced commuter facilities. The corridor serves key residential and commercial zones including Muthaiga, Runda, Ridgeways, Kiambu Town and surrounding estates, all of which suffer severe peak-hour traffic congestion. For more information, please see our Cytonn Weekly #46/2025.
We expect the infrastructure sector to be supported by a combination of new road projects like the cabinet approval of the dualing of Muthaiga Kiambu-Ndumberi road and the dualling of the Rironi-Nakuru-Mau summit highway; attracting contractors, financiers and supply-chain players into regional corridors. However, the sector still faces familiar headwinds such as the cancelation of the MCC grant, slow execution, land acquisition disputes, cost overruns, weak maintenance culture, and reliance on debt-heavy financing, which could dilute the intended impact if not addressed.
- Real Estate Investments Trusts
- REITS Weekly Performance
On the Unquoted Securities Platform, Acorn D-REIT and I-REIT traded at Kshs 27.4 and Kshs 23.2 per unit, respectively, as per the last updated data on 21st November 2025. The performance represented a 33.4% and 14.5% gain for the D-REIT and I-REIT, respectively, from the Kshs 20.0 inception price. The volumes traded for the D-REIT and I-REIT came in at Kshs 12.8 mn and Kshs 40.6 mn shares, respectively, with a turnover of Kshs 323.5 mn and Kshs 791.5 mn, respectively, since inception in February 2021. Additionally, ILAM Fahari I-REIT traded at Kshs 11.0 per share as of 21st November 2025, representing a45.0% loss from the Kshs 20.0 inception price. The volume traded to date came in at 1.2 mn shares for the I-REIT, with a turnover of Kshs 1.5 mn since inception in November 2015.
REITs offer various benefits, such as tax exemptions, diversified portfolios, and stable long-term profits. However, the ongoing decline in the performance of Kenyan REITs and the restructuring of their business portfolios are hindering significant previous investments. Additional general challenges include:
- Insufficient understanding of the investment instrument among investors leading to a slower uptake of REIT products,
- Lengthy approval processes for REIT creation,
- High minimum capital requirements of Kshs 100.0 mn for REIT trustees compared to Kshs 10.0 mn for pension funds Trustees, essentially limiting the licensed REIT Trustee to banks only
- The rigidity of choice between either a D-REIT or and I-REIT forces managers to form two REITs, rather than having one Hybrid REIT that can allocate between development and income earning properties
- Limiting the type of legal entity that can form a REIT to only a trust company, as opposed to allowing other entities such as partnerships, and companies,
- We need to give time before REITS are required to list – they would be allowed to stay private for a few years before the requirement to list given that not all companies maybe comfortable with listing on day one, and,
- Minimum subscription amounts or offer parcels set at Kshs 0.1 mn for D-REITs and Kshs 5.0 mn for restricted I-REITs. The significant capital requirements still make REITs relatively inaccessible to smaller retail investors compared to other investment vehicles like unit trusts or government bonds, all of which continue to limit the performance of Kenyan REITs.
There was one notable highlight during the month.
- During the month, Real Estate Developer, Acorn secured CMA approval to launch a new Build-To-Rent D-REIT in a bid to strengthen its push into Nairobi’s affordable rental market for the young workers. The new Acorn Build-To-Rent D-REIT will focus on rental homes for young urban workers aged between 20-30 Years who work across Nairobi’s major hubs. The Kshs 2.2 bn D-REIT will start with a committed capital of Kshs 1.3 bn from Private Infrastructure Development Group through its InfraCo vehicle, Kshs 258.4 mn from Shelter Afrique Development Bank and Kshs 645.0 bn from Acorn. For more information, please see our Cytonn Weekly #47/2025.
We expect the performance of Kenya’s Real Estate sector to remain resilient, supported by several factors: i) growth in key indicators as highlighted by the September 2025 Leading Economic Indicators report ii) Signing of the bilateral air services agreement which will greatly impact the hospitality sector and iii) improving investor confidence in structured real estate securities, evidenced by gains in Acorn’s D-REIT and I-REIT. However, challenges such as rising construction costs, infrastructure constraints, weak investor appetite in listed REITs such as ILAM Fahari I-REIT, oversupply in select real estate classes, and high capital demands will continue to impede the sector’s optimal performance.
Disclaimer: The views expressed in this publication are those of the writers where particulars are not warranted. This publication, which is in compliance with Section 2 of the Capital Markets Authority Act Cap 485A, is meant for general information only and is not a warranty, representation, advice, or solicitation of any nature. Readers are advised in all circumstances to seek the advice of a registered investment advisor.

- Talk to us
- Kenya
- P.O Box 20695 - 00200, Nairobi, Kenya
- Cell +254709101200
- Tel +254709101200
- WhatsApp +254741676635
- United States
- +254709101200
- DOWNLOAD OUR APP
-


- Kenya
- 8th Floor, Pinetree Plaza, Kaburu Drive, Ngong Road, Nairobi, Kenya
- USA
- Suite 1150, 1775 Eye Street NW, USA, Washington DC 20006, USA
- Investments
- High Yield
- Private Equity
- Real Estate
- Real Estate
- RiverRun Estates
- Cytonn Towers
- The Ridge
- Taraji Heights
- The Alma