Review of Insolvency in Kenya, & Cytonn Weekly #46/2025
By Research Team, Nov 16, 2025
Executive Summary
Fixed Income
This week, T-bills were oversubscribed for the sixth consecutive week, with the overall subscription rate coming in at 127.3%, lower than the subscription rate of 166.1% recorded the previous week. Investors’ preference for the shorter 91-day paper waned, with the paper receiving bids worth Kshs 6.5 bn against the offered Kshs 4.0 bn, translating to a subscription rate of 163.5%, significantly lower than the subscription rate of 383.1%, recorded the previous week. The subscription rates for the 182-day paper increased to 36.9% from 26.0% recorded the previous week, while that of the 364-day papers decreased to 203.1% from 219.3% recorded the previous week. The government accepted a total of Kshs 30.4 bn worth of bids out of Kshs 30.5 bn bids received, translating to an acceptance rate of 99.7%. The yields on the government papers recorded a mixed performance with the yields on the 364-day paper increasing the most by 1.2 bps to 9.4% from the 9.3% recorded the previous week, while the 91-day paper decreased by 0.5 bps to remain relatively unchanged from the 7.8% recorded the previous week. The yield on the 182-day paper remained unchanged from the 7.8% recorded the previous week;
In the primary bond market, the government is looking to raise Kshs 40.0 bn through the reopened bonds; FXD3/2019/015 and FXD1/2022/025 with fixed coupon rates of 12.3% and 14.2% respectively and tenors to maturity of 8.7 years and 21.9 years respectively. The period of sale for the two bonds opened on Tuesday, 11th November 2025 and will close on Wednesday, 19th November 2025. Our bidding ranges for FXD3/2019/015 and FXD1/2022/025 are 12.00%-13.00% and 13.50%-14.50% respectively;
During the week, The Energy and Petroleum Regulatory Authority (EPRA) released their monthly statement on the maximum retail fuel prices in Kenya, effective from 15th November 2025 to 14th December 2025. Notably, the maximum allowed prices for Super Petrol, Diesel and Kerosene remained unchanged from the previous pricing cycle in October. Consequently, Super Petrol, Diesel and Kerosene will continue to retail at Kshs 184.5, Kshs 171.5 and Kshs 154.8 per litre respectively;
During the week, the National Treasury gazetted the revenue and net expenditures for the fourth month of FY’2025/2026, ending 31st October 2025, highlighting that the total revenue collected as at the end of October 2025 amounted to Kshs 776.8 bn, equivalent to 28.2% of the original estimates of Kshs 2,754.7 bn for FY’2025/2026 and is 84.6%
Equities
During the week, the equities market was on a downward trajectory, with NSE 10, NSE 25, NASI and NSE 20 declining by 3.2%, 2.9%, 2.4% and 2.3% respectively, taking the YTD performance to gains of 54.4%, 49.5%, 46.7% and 46.1% of NSE 20, NASI, NSE 10 and NSE 25 respectively. The equities market performance was mainly driven by losses recorded by large-cap stocks such as Equity, KCB and EABL, of 8.2%, 7.1% and 4.2%, respectively. The performance was, however, supported by gains by large cap stocks such as Cooperative Bank and DTB-K of 8.3% and 0.7% respectively;
Also, during the week, the banking sector index declined by 3.2% to close at 203.6 from the 210.3 recorded the previous week. This was attributable to losses recorded by large-cap stocks such as Equity, KCB and ABSA, of 8.2%, 7.1% and 3.3%, respectively. The performance was, however, supported by gains recorded by stocks such as Cooperative Bank and DTB-K of 8.3% and 0.7% respectively;
During the week Cooperative Bank released their Q3’2025 financial results highlighting their Profit After Tax (PAT) increased by 12.3% to Kshs 21.6 bn, from Kshs 19.2 bn in Q3’2024. The performance was mainly driven by a 13.9%increase in Total Operating Income to Kshs 67.4 bn, from Kshs 59.2 bn in Q3’2024, which was however weighed down by the 15.4% increase in Total Operating expense to Kshs 37.7 bn in Q3’2025, from Kshs32.7 bn in Q3’2024.The increase in Operating expenses was largely driven by the 31.9% increase in loan loss provisions expense to Kshs 7.4 bn from Kshs 5.6 bn in Q3’2024.
Real Estate
During the week, Mi Vida Homes announced the signing of a major development partnership with International Housing Solutions (IHS) to construct 240 housing units in Riruta, Nairobi. The project will incorporate IFC’s EDGE sustainability standards, emphasising energy efficiency, water conservation and reduced carbon footprints.
During the week, the Cabinet endorsed the dualling of the heavily congested Muthaiga–Kiambu–Ndumberi 25.0 km road, a project expected to cost Kshs 65.0 bn. The project will expand the existing two-lane road into a dual carriageway with new bypasses, loops, pedestrian walkways, non-motorised transport lanes and enhanced commuter facilities.
During the week, the Cabinet approved a proposal to establish the Nairobi National Park–Athi-Kapiti Wildlife Migration Corridor, reconnecting vital wildlife routes spanning Machakos and Kajiado counties.
On the Unquoted Securities Platform, Acorn D-REIT and I-REIT traded at Kshs 27.4 and Kshs 23.2 per unit, respectively, as per the last updated data on 7th November 2025. The performance represented a 33.4% and 14.5% gain for the D-REIT and I-REIT, respectively, from the Kshs 20.0 inception price in February 2021. The volumes traded for the D-REIT and I-REIT came in at Kshs 12.8 mn and Kshs 40.6 mn shares, respectively, with a turnover of Kshs 323.5 mn and Kshs 791.5 mn, respectively, since inception in February 2021. Additionally, ILAM Fahari I-REIT traded at Kshs 11.0 per share as of 7th November 2025, representing a 45.0% loss from the Kshs 20.0 inception price. The volume traded to date came in at 1.2 mn shares for the I-REIT, with a turnover of Kshs 1.5 mn since inception in November 2015.
Focus of the Week
Insolvency refers to a financial situation where an individual, business or entity, such as a fund, is unable to meet their financial obligations or settle their debts as they become due. In most cases, the state of insolvency occurs due to an increase in business expenses, poor cash management, law suits, poor budgeting, fraud, business expansion, a reduction in sales or unforseable events such as Covid 19. In previous Cytonn Topicals, we have extensively analysed Kenya’s insolvency and restructuring landscape, with a focus on enhancing understanding of the Insolvency Act of 2015 and its practical implications for distressed businesses. These publications have examined the definition and types of insolvency, cash flow and balance sheet insolvency. The forthcoming Court of Appeal ruling, arising from the High Court decision on Cytonn High Yields Solutions [2024] KEHC 14726 and expected on 21st November 2025, is anticipated to set an important precedent for how the Insolvency Act, 2015 is applied, particularly on the balance between business rescue and liquidation.
Investment Updates:
- Weekly Rates: Cytonn Money Market Fund closed the week at a yield of 12.05% p.a. To invest, dial *809# or download the Cytonn App from Google Play store here or from the Appstore here;
- We continue to offer Wealth Management Training every Monday, from 10:00 am to 12:00 pm. The training aims to grow financial literacy among the general public. To register for any of our Wealth Management Trainings, click here;
- If interested in our Private Wealth Management Training for your employees or investment group, please get in touch with us through wmt@cytonn.com;
- Cytonn Insurance Agency acts as an intermediary for those looking to secure their assets and loved ones’ future through insurance namely; Motor, Medical, Life, Property, WIBA, Credit and Fire and Burglary insurance covers. For assistance, get in touch with us through insuranceagency@cytonn.com;
- Cytonn Asset Managers Limited (CAML) continues to offer pension products to meet the needs of both individual clients who want to save for their retirement during their working years and Institutional clients that want to contribute on behalf of their employees to help them build their retirement pot. To more about our pension schemes, kindly get in touch with us through pensions@cytonn.com;
Money Markets, T-Bills Primary Auction:
This week, T-bills were oversubscribed for the sixth consecutive week, with the overall subscription rate coming in at 127.3%, lower than the subscription rate of 166.1% recorded the previous week. Investors’ preference for the shorter 91-day paper waned, with the paper receiving bids worth Kshs 6.5 bn against the offered Kshs 4.0 bn, translating to a subscription rate of 163.5%, significantly lower than the subscription rate of 383.1%, recorded the previous week. The subscription rates for the 182-day paper increased to 36.9% from 26.0% recorded the previous week, while that of the 364-day papers decreased to 203.1% from 219.3% recorded the previous week. The government accepted a total of Kshs 30.4 bn worth of bids out of Kshs 30.5 bn bids received, translating to an acceptance rate of 99.7%. The yields on the government papers recorded a mixed performance with the yields on the 364-day paper increasing the most by 1.2 bps to 9.4% from the 9.3% recorded the previous week, while the 91-day paper decreased by 0.5 bps to remain relatively unchanged from the 7.8% recorded the previous week. The yield on the 182-day paper remained unchanged from the 7.8% recorded the previous week
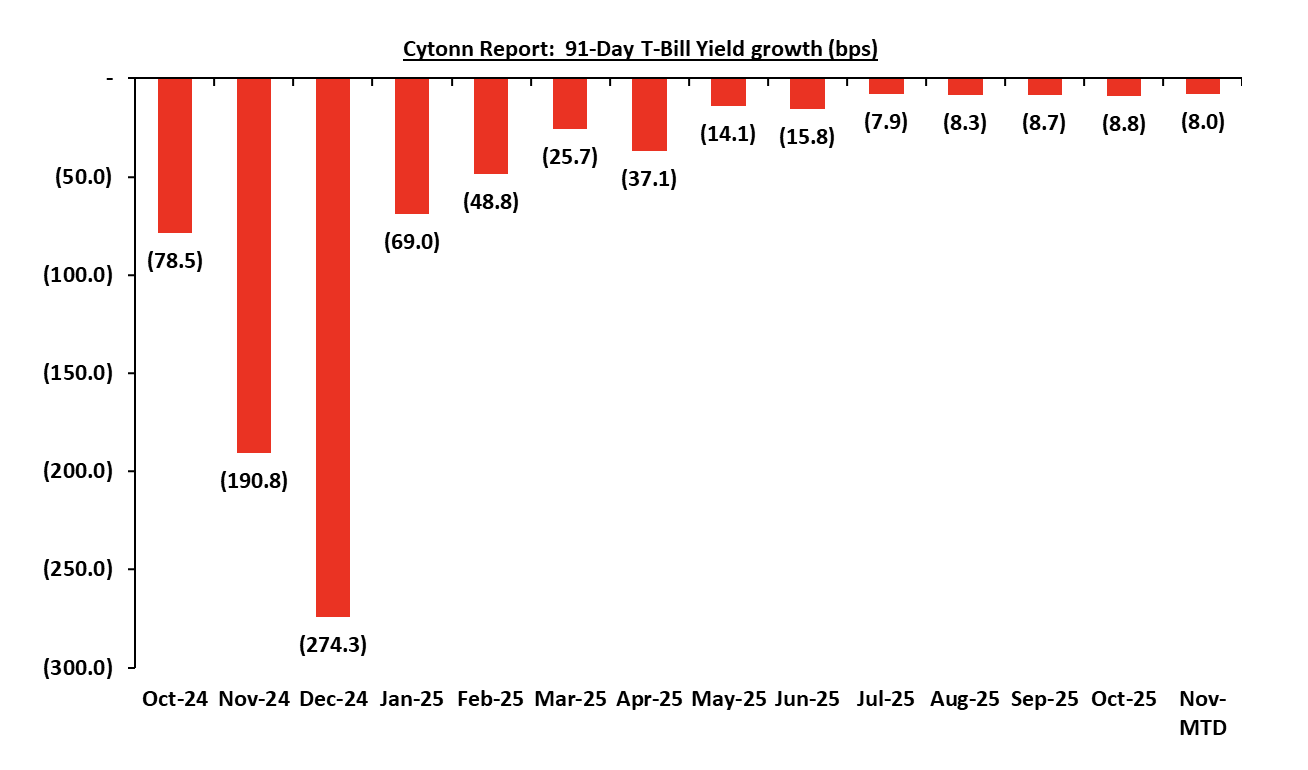
The chart below shows the yield growth rate for the 91-day paper in the year to October 2025 and November month-to-date:
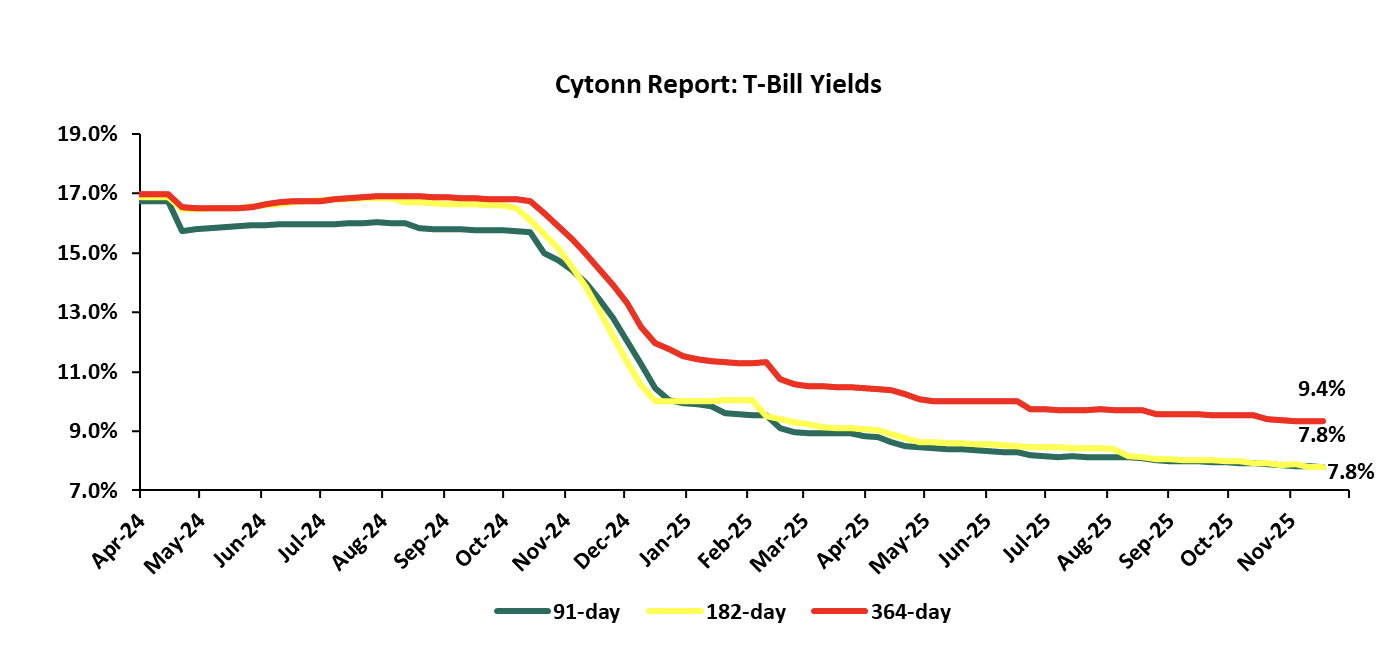
The charts below show the performance of the 91-day, 182-day and 364-day papers from January 2024 to November 2025:
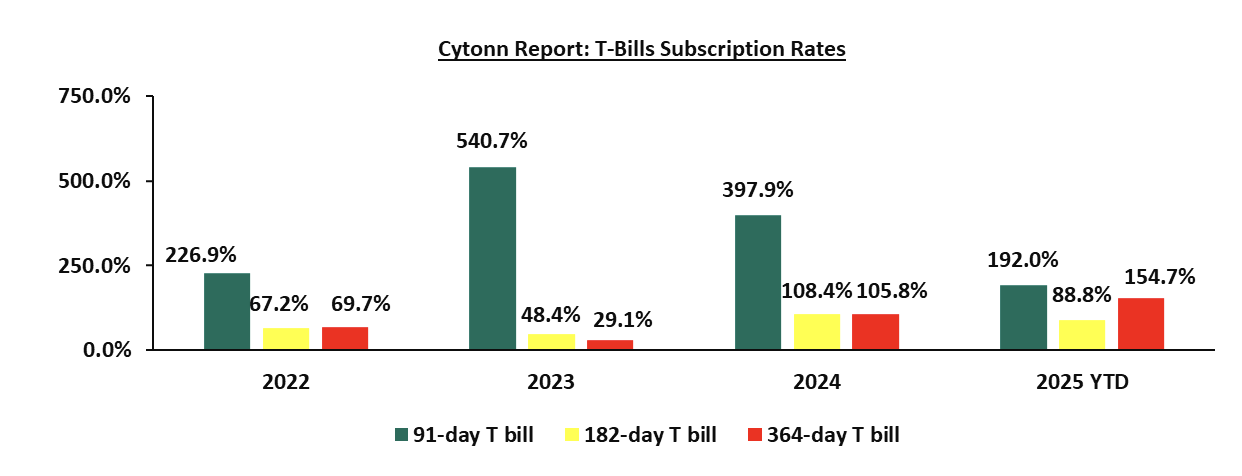
The chart below compares the overall average T-bill subscription rates obtained in 2022,2023, 2024 and 2025 Year-to-date (YTD):
In the primary bond market, the government is looking to raise Kshs 40.0 bn through the reopened bonds; FXD3/2019/015 and FXD1/2022/025 with fixed coupon rates of 12.3% and 14.2% respectively and tenors to maturity of 8.7 years and 21.9 years respectively. The period of sale for the two bonds opened on Tuesday, 11th November 2025 and will close on Wednesday, 19th November 2025. Our bidding ranges for FXD3/2019/015 and FXD1/2022/025 are 12.00%-13.00% and 13.50%-14.50% respectively.
Money Market Performance:
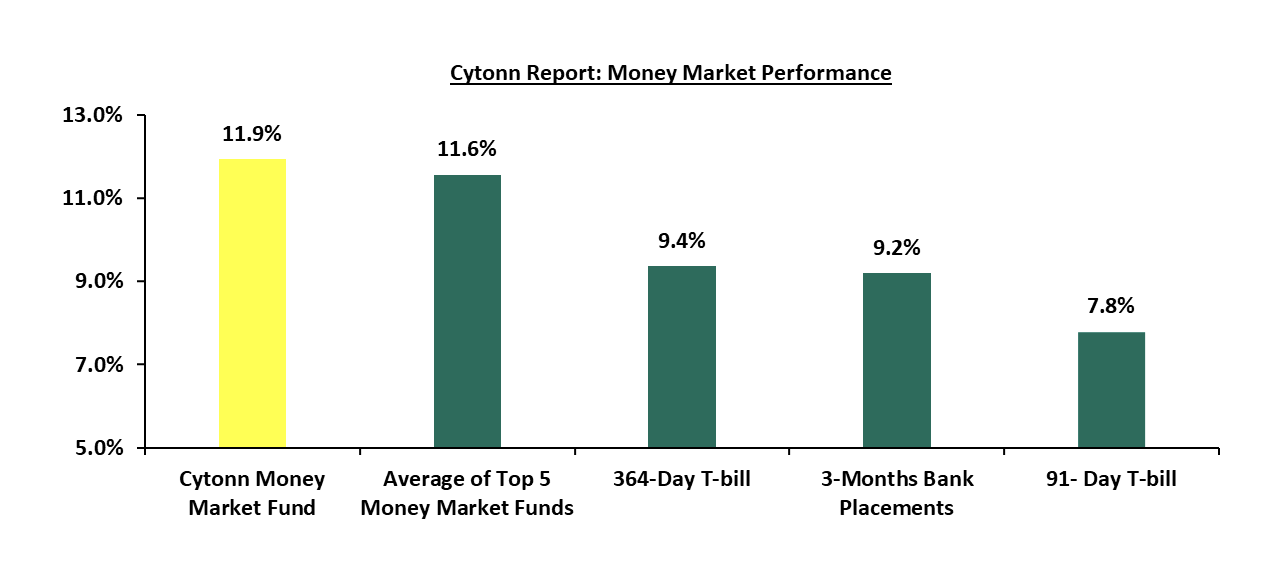
In the money markets, 3-month bank placements ended the week at 9.2% (based on what we have been offered by various banks). The yields on the 91-day paper decreased by 0.5 bps to remain relatively unchanged from the 7.8% recorded the previous week while the yields on the 364-day paper increased by 1.2 bps to 9.4% from the 9.3% recorded the previous week and the yield on the Cytonn Money Market Fund decreased by 8.0 bps to 11.9% from 12.0% recorded in the previous week, while the average yields on the Top 5 Money Market Funds decreased by 14.8 bps to 11.6% from the 11.7% recorded the previous week.
The table below shows the Money Market Fund Yields for Kenyan Fund Managers as published on 14th November 2025:
|
Money Market Fund Yield for Fund Managers as published on 14th November 2025 |
||
|
Rank |
Fund Manager |
Effective Annual Rate |
|
1 |
Cytonn Money Market Fund (Dial *809# or download Cytonn App) |
11.9% |
|
2 |
Etica Money Market Fund |
11.7% |
|
3 |
Nabo Africa Money Market Fund |
11.5% |
|
4 |
Lofty-Corban Money Market Fund |
11.4% |
|
5 |
Orient Kasha Money Market Fund |
11.2% |
|
6 |
Enwealth Money Market Fund |
11.1% |
|
7 |
Ndovu Money Market Fund |
11.1% |
|
8 |
Gulfcap Money Market Fund |
10.9% |
|
9 |
Kuza Money Market fund |
10.9% |
|
10 |
Arvocap Money Market Fund |
10.8% |
|
11 |
Old Mutual Money Market Fund |
10.7% |
|
12 |
British-American Money Market Fund |
10.5% |
|
13 |
Jubilee Money Market Fund |
10.3% |
|
14 |
Faulu Money Market Fund |
10.2% |
|
15 |
Madison Money Market Fund |
10.1% |
|
16 |
GenAfrica Money Market Fund |
9.8% |
|
17 |
Dry Associates Money Market Fund |
9.8% |
|
18 |
KCB Money Market Fund |
9.4% |
|
19 |
Apollo Money Market Fund |
9.2% |
|
20 |
Sanlam Money Market Fund |
9.1% |
|
21 |
CPF Money Market Fund |
9.1% |
|
22 |
ICEA Lion Money Market Fund |
8.6% |
|
23 |
Genghis Money Market Fund |
8.6% |
|
24 |
CIC Money Market Fund |
8.5% |
|
25 |
Co-op Money Market Fund |
8.4% |
|
26 |
Mayfair Money Market Fund |
8.3% |
|
27 |
Mali Money Market Fund |
7.9% |
|
28 |
Absa Shilling Money Market Fund |
7.9% |
|
29 |
AA Kenya Shillings Fund |
6.6% |
|
30 |
Ziidi Money Market Fund |
6.4% |
|
31 |
Stanbic Money Market Fund |
6.4% |
|
32 |
Equity Money Market Fund |
5.0% |
Source: Business Daily
Liquidity:
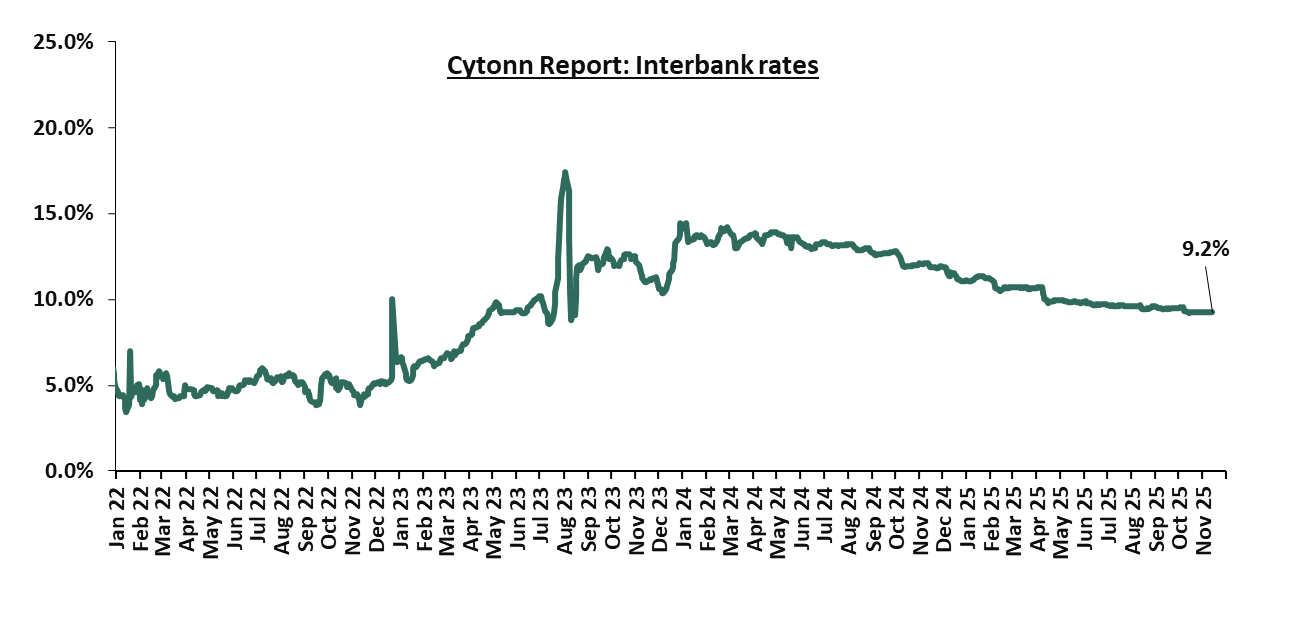
During the week, liquidity in the money markets eased with the average interbank rate decreasing by 1.5 bps to remain unchanged from 9.2% recorded the previous week, partly attributable to government payments that offset tax remittances. The average interbank volumes traded increased by 102.3% to Kshs 13.9 bn from Kshs 6.9 bn recorded the previous week. The chart below shows the interbank rates in the market over the years:
Kenya Eurobonds:
During the week, the yields on the Eurobonds were on a downward trajectory with the yield on the 12-year Eurobond issued in 2019 decreasing the most by 11.4 bps to 8.1% from 8.2% recorded the previous week. The table below shows the summary performance of the Kenyan Eurobonds as of 13th November 2025;
|
Cytonn Report: Kenya Eurobond Performance |
|||||||
|
|
2018 |
2019 |
2021 |
2024 |
2025 |
||
|
Tenor |
10-year issue |
30-year issue |
7-year issue |
12-year issue |
13-year issue |
7-year issue |
11-year issue |
|
Amount Issued (USD) |
1.0 bn |
1.0 bn |
0.9 bn |
1.2 bn |
1.0 bn |
1.5 bn |
1.5 bn |
|
Years to Maturity |
2.5 |
22.5 |
1.7 |
6.7 |
8.8 |
5.5 |
10.5 |
|
Yields at Issue |
7.3% |
8.3% |
7.0% |
7.9% |
6.2% |
10.4% |
9.9% |
|
2-Jan-25 |
9.1% |
10.3% |
8.5% |
10.1% |
10.1% |
10.1% |
|
|
3-Nov-25 |
6.0% |
9.2% |
- |
8.1% |
8.4% |
7.8% |
|
|
6-Nov-25 |
6.1% |
9.3% |
- |
8.2% |
8.6% |
7.9% |
|
|
7-Nov-25 |
6.1% |
9.4% |
- |
8.3% |
8.7% |
8.0% |
|
|
10-Nov-25 |
6.1% |
9.3% |
- |
8.2% |
8.6% |
8.0% |
|
|
11-Nov-25 |
6.1% |
9.3% |
- |
8.2% |
8.6% |
8.0% |
|
|
12-Nov-25 |
6.1% |
9.1% |
- |
8.1% |
8.5% |
7.8% |
10.0% |
|
13-Nov-25 |
6.1% |
9.2% |
- |
8.1% |
8.5% |
7.9% |
|
|
Weekly Change |
(0.0%) |
(0.1%) |
- |
(0.1%) |
(0.1%) |
(0.1%) |
- |
|
MTD Change |
0.1% |
0.0% |
- |
0.0% |
0.1% |
0.1% |
0.0% |
|
YTD Change |
(3.0%) |
(1.1%) |
- |
(1.9%) |
(1.6%) |
(2.2%) |
0.0% |
Source: Central Bank of Kenya (CBK) and National Treasury
Kenya Shilling:
During the week, the Kenya Shilling depreciated against the US Dollar by 3.6 bps, to close the week at Kshs 129.3, from Kshs 129.2 recorded the previous week. On a year-to-date basis, the shilling has appreciated marginally by 1.5 bps against the dollar, lower than the 17.6% appreciation recorded in 2024.
We expect the shilling to be supported by:
- Diaspora remittances standing at a cumulative USD 5,081.6 mn in the twelve months to October 2025, 5.8% higher than the USD 4,804.1 mn recorded over the same period in 2024. This has continued to cushion the shilling against further depreciation. In the October 2025 diaspora remittances figures, North America remained the largest source of remittances to Kenya accounting for 59.9% in the period,
- The tourism inflow receipts which are projected to reach KSh 560.0 bn in 2025 up from KSh 452.2 bn in 2024, a 23.9% increase, and owing to tourist arrivals that improved by 9.9% to 2,424,382 in the 12 months to June 2025 from 2,206,469 in the 12 months to June 2024, and,
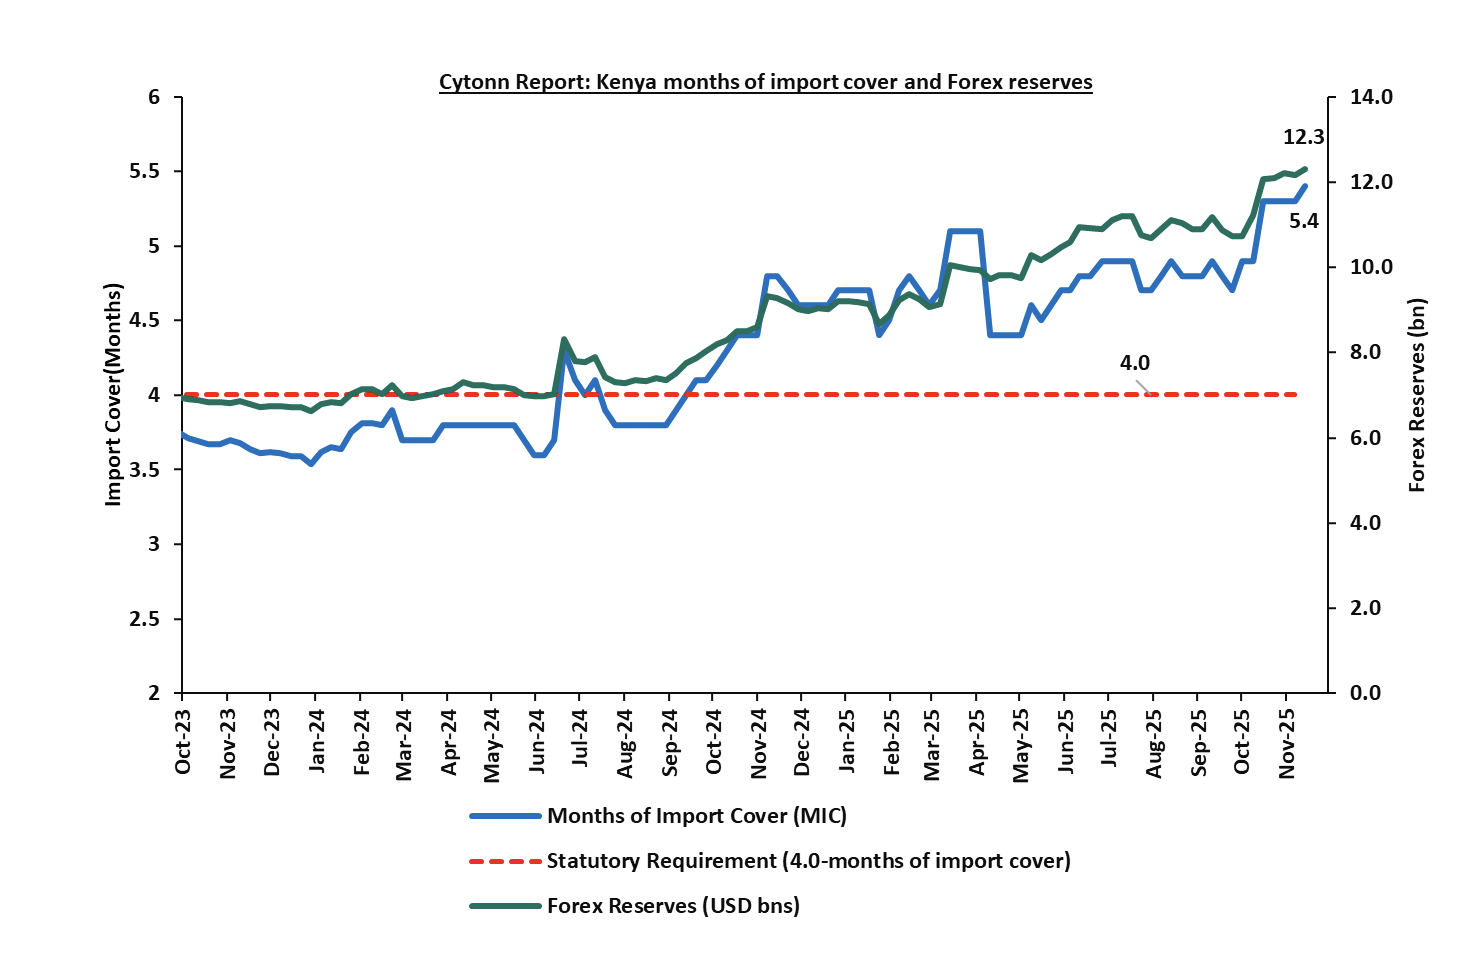
- Improved forex reserves currently at USD 12.3 bn (equivalent to 5.4-months of import cover), which is above the statutory requirement of maintaining at least 4.0-months of import cover and above the EAC region’s convergence criteria of 4.5-months of import cover.
The shilling is however expected to remain under pressure in 2025 as a result of:
- An ever-present current account deficit which came at 2.1% of GDP in the twelve months to August 2025, and,
- The need for government debt servicing, continues to put pressure on forex reserves given that 59.7% of Kenya’s external debt is US Dollar-denominated as of June 2025.
Kenya’s forex reserves increased by 1.1% during the week to USD 12.3 bn from the USD 12.2 bn recorded the previous week, equivalent to 5.4 months of import cover, and above the statutory requirement of maintaining at least 4.0-months of import cover.
The chart below summarizes the evolution of Kenya's months of import cover over the years:
Weekly Highlights
- Fuel Highlight, November – December 2025
During the week, The Energy and Petroleum Regulatory Authority (EPRA) released their monthly statement on the maximum retail fuel prices in Kenya, effective from 15th November 2025 to 14th December 2025. Notably, the maximum allowed prices for Super Petrol, Diesel and Kerosene remained unchanged from the previous pricing cycle in September. Consequently, Super Petrol, Diesel and Kerosene will continue to retail at Kshs 184.5, Kshs 171.5 and Kshs 154.8 per litre respectively.
Other key take-outs from the performance include,
- The average landing cost per cubic metre of Super Petrol decreased slightly by 0.2% to USD 619.1 in October 2025 from USD 620.2 recorded in September 2025. However, the average landing cost of Kerosene and Diesel increased by 0.7% and 1.8% to USD 632.2 and USD 635.1 respectively from USD 627.7 and USD 623.8 respectively over the same period.
- The Kenyan Shilling remained stable against the US Dollar remaining relatively unchanged from the Kshs 129.5 recorded in September 2025.
We note that fuel prices in the country have stabilized in recent months largely due to the government's efforts to stabilize pump prices through the petroleum pump price stabilization mechanism which expended Kshs 13.7 bn in the FY’2024/25 to cushion the increases applied to the petroleum pump prices, coupled with the stabilization of the Kenyan Shilling against the dollar and other major currencies.
Going forward, we expect that fuel prices will stabilize in the coming months as a result of the government's efforts to mitigate the cost of petroleum through the pump price stabilization mechanism and a stable exchange rate. As such, we expect the business environment in the country to improve as fuel is a major input cost, as well as continued stability in inflationary pressures, with the inflation rate expected to remain within the CBK’s preferred target range of 2.5%-7.5% in the short to medium term.
- October Exchequer Highlight
The National Treasury gazetted the revenue and net expenditures for the fourth month of FY’2025/2026, ending 31st October 2025. Below is a summary of the performance:
|
Item |
12-months Original Estimates |
Actual Receipts/Release |
Percentage Achieved |
Prorated |
% achieved of the Prorated |
|
Opening Balance |
|
6.4 |
|
|
|
|
Tax Revenue |
2,627.1 |
736.3 |
28.0% |
875.7 |
84.1% |
|
Non-Tax Revenue |
127.6 |
34.0 |
26.7% |
42.5 |
80.0% |
|
Total Revenue |
2,754.7 |
776.8 |
28.2% |
918.2 |
84.6% |
|
External Loans & Grants |
569.8 |
216.4 |
38.0% |
189.9 |
113.9% |
|
Domestic Borrowings |
1,098.3 |
513.8 |
46.8% |
366.1 |
140.4% |
|
Other Domestic Financing |
10.8 |
6.1 |
56.5% |
3.6 |
169.6% |
|
Total Financing |
1,678.9 |
736.3 |
43.9% |
559.6 |
131.6% |
|
Recurrent Exchequer issues |
1,470.4 |
485.5 |
33.0% |
490.1 |
99.1% |
|
CFS Exchequer Issues |
2,141.0 |
753.4 |
35.2% |
713.7 |
105.6% |
|
Development Expenditure & Net Lending |
407.1 |
97.5 |
24.0% |
135.7 |
71.9% |
|
County Governments + Contingencies |
415.0 |
101.4 |
24.4% |
138.3 |
73.3% |
|
Total Expenditure |
4,433.6 |
1,437.8 |
32.4% |
1,477.9 |
97.3% |
|
Fiscal Deficit excluding Grants |
1,678.9 |
661.1 |
39.4% |
559.6 |
118.1% |
|
Total Borrowing |
1,668.1 |
730.2 |
43.8% |
556.0 |
131.3% |
|
Public Debt |
1,901.4 |
705.9 |
37.1% |
633.8 |
111.4% |
The Key take-outs from the release include;
- Total revenue collected as at the end of October 2025 amounted to Kshs 776.8 bn, equivalent to 28.2% of the original estimates of Kshs 2,754.7 bn for FY’2025/2026 and is 84.6% of the prorated estimates of Kshs 918.2 bn. Cumulatively, tax revenues amounted to Kshs 736.3 bn, equivalent to 28.0% of the original estimates of Kshs 2,627.1 bn and 84.1% of the prorated estimates of Kshs 875.7 bn,
- Total financing amounted to Kshs 736.3 bn, equivalent to 43.9% of the original estimates of Kshs 1,678.9 bn and is equivalent to 131.6% of the prorated estimates of Kshs 559.6 bn. Additionally, domestic borrowing amounted to Kshs 513.8 bn, equivalent to 46.8% of the original estimates of Kshs 1,098.3 bn and is 140.4% of the prorated estimates of Kshs 366.1 bn,
- The total expenditure amounted to Kshs 1,437.8 bn, equivalent to 32.4% of the original estimates of Kshs 4,433.6 bn, and is 97.3% of the prorated target expenditure estimates of Kshs 1,477.9 bn. Additionally, the net disbursements to recurrent expenditures came in at Kshs 485.5 bn, equivalent to 33.0% of the original estimates of Kshs 1,470.4 and are equivalent to 99.1% of the prorated estimates of Kshs 490.1 bn,
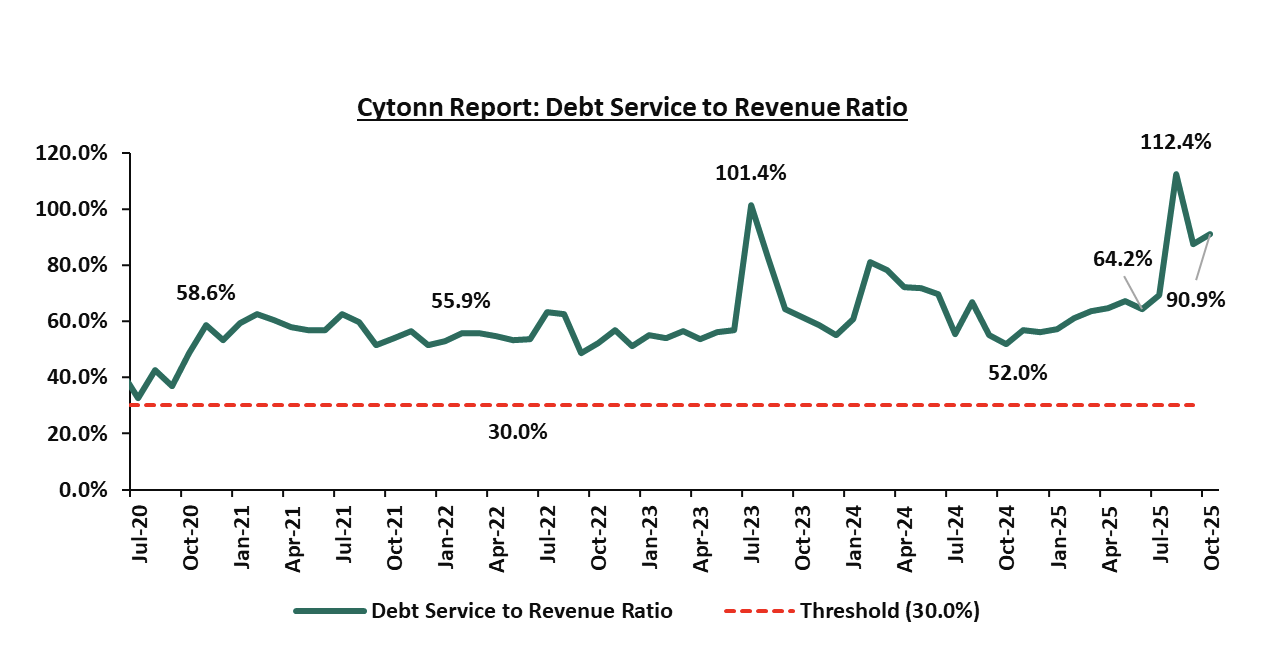
- Consolidated Fund Services (CFS) Exchequer issues came in at Kshs 753.4 bn, equivalent to 35.2% of the original estimates of Kshs 2,141.0 bn, and are 105.6% of the prorated amount of Kshs 713.7 bn. The cumulative public debt servicing cost amounted to Kshs 705.9 bn which is 37.1% of the original estimates of Kshs 1,901.4 bn and is 111.4% of the prorated estimates of Kshs 633.8 bn. Additionally, the Kshs 705.9 bn debt servicing cost is equivalent to 90.9% of the actual cumulative revenues collected as at the end of October 2025. The chart below shows the debt servicing cost to revenue ratio over the period;
- Total Borrowings as at the end of October 2025 amounted to Kshs 730.2 bn, equivalent to 43.8% of the original estimates of Kshs 1,668.1 bn for FY’2025/2026 and are 131.3% of the prorated estimates of Kshs 556.0 bn. The cumulative domestic borrowing of Kshs 1,098.3 bn comprises of Net Domestic Borrowing Kshs 634.8 bn and Internal Debt Redemptions (Rollovers) Kshs 463.5 bn.
The government underachieved its prorated revenue targets for the fourth month of the FY’2025/2026, achieving 84.6% of the prorated revenue targets in October 2025, higher than the 84.5% recorded in September 2025. This was driven by shortfall in both tax and non-tax revenues, which stood at 84.1% and 80.0% of prorated levels, respectively. External loans and grants remained significantly below target at 38.0%, increasing reliance on domestic borrowing, which came in at 140.4% of the prorated target. The business environment, however, showed signs of recovery, with the Purchasing Managers’ Index (PMI) rising to 52.5 in October 2025 from 51.9 in September 2025, crossing over the 50.0 neutral mark and signalling a slowdown in the contraction of business activity. Expenditure absorption stood at 97.3% of prorated levels, with development spending still lagging at 71.9%, reflecting slow implementation of capital projects. Future revenue performance will depend on how quickly private sector activity strengthens, supported by a stable Shilling, easing credit conditions following the 25.0 bps reduction in the Central Bank Rate to 9.25% from 9.50% in October, and continued efforts to broaden the tax base, curb evasion, and stimulate economic growth.
Rates in the Fixed Income market have been on a downward trend due to high liquidity in the money market which allowed the government to front load most of its borrowing. The government is 51.3% ahead of its prorated net domestic borrowing target of Kshs 242.4 bn, having a net borrowing position of Kshs 366.8 bn (inclusive of T-bills). However, we expect a stabilization of the yield curve in the short and medium term, with the government looking to increase its external borrowing to maintain the fiscal surplus, hence alleviating pressure in the domestic market. As such, we expect the yield curve to stabilize in the short to medium-term and hence investors are expected to shift towards the long-term papers to lock in the high returns
Market Performance:
During the week, the equities market was on a downward trajectory, with NSE 10, NSE 25, NASI and NSE 20 declining by 3.2%, 2.9%, 2.4% and 2.3% respectively, taking the YTD performance to gains of 54.4%, 49.5%, 46.7% and 46.1% of NSE 20, NASI, NSE 10 and NSE 25 respectively. The equities market performance was mainly driven by losses recorded by large-cap stocks such as Equity, KCB and EABL, of 8.2%, 7.1% and 4.2%, respectively. The performance was, however, supported by gains by large cap stocks such as Cooperative Bank and DTB-K of 8.3% and 0.7% respectively.
During the week, the banking sector index declined by 3.2% to close at 203.6 from the 210.3 recorded the previous week. This was attributable to losses recorded by large-cap stocks such as Equity, KCB and ABSA, of 8.2%, 7.1% and 3.3%, respectively. The performance was, however, supported by gains recorded by stocks such as Cooperative Bank and DTB-K of 8.3% and 0.7% respectively.
During the week, equities turnover decreased by 0.5% to USD 27.8 mn from USD 27.9 mn recorded the previous week, taking the YTD turnover to USD 927.8 mn. Foreign investors remained net sellers for the sixth consecutive week, with a net selling position of USD 3.0 mn, from a net selling position of USD 9.2 mn recorded the previous week, taking the YTD net selling position to USD 81.8 mn.
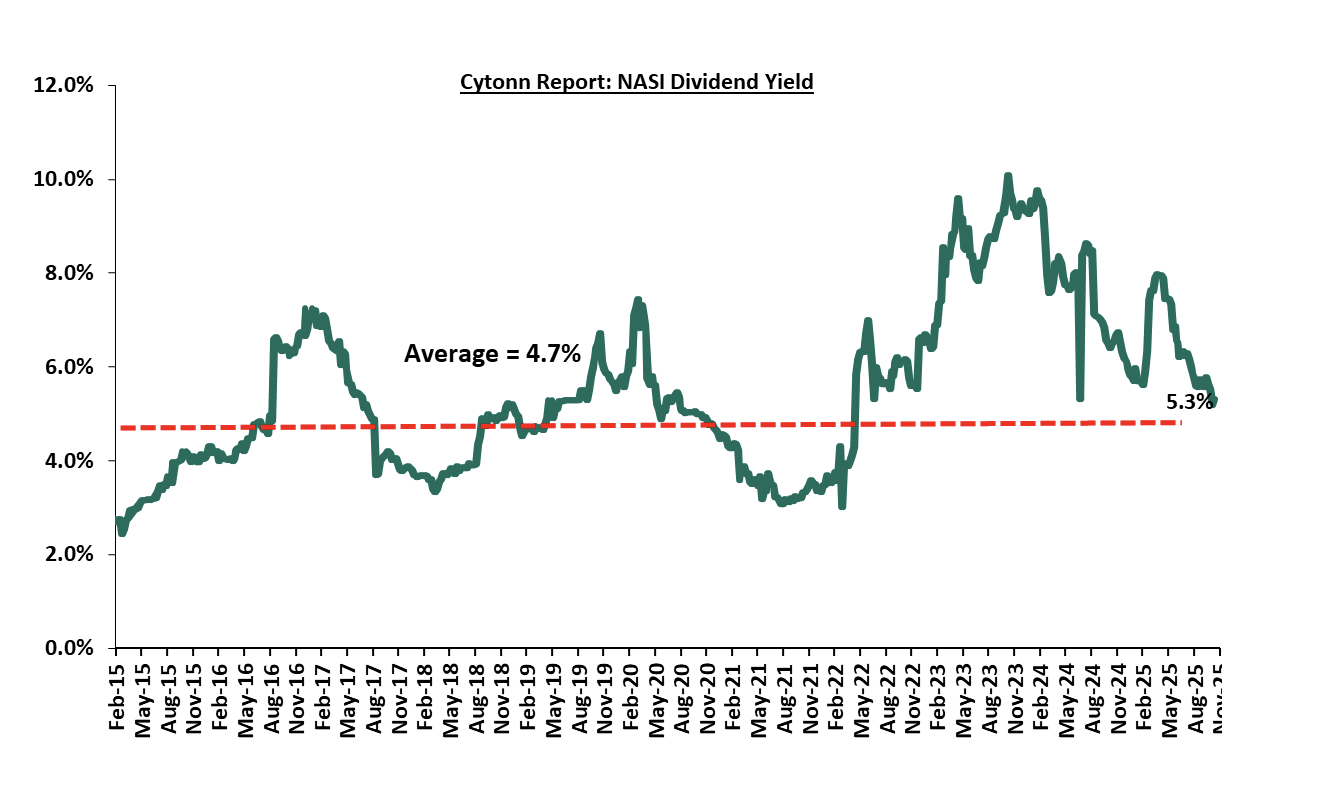
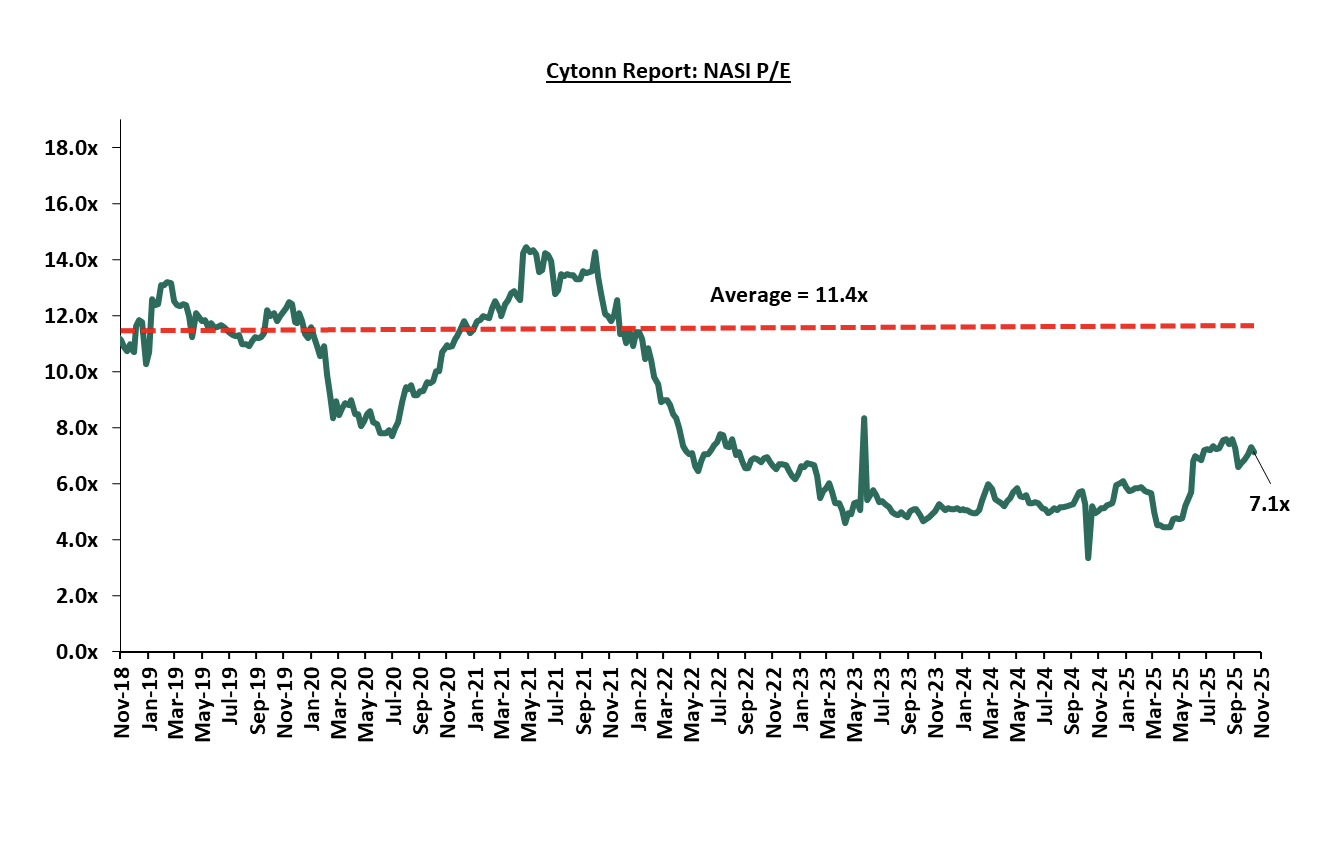
The market is currently trading at a price to earnings ratio (P/E) of 7.1x, 37.2% below the historical average of 11.4x, and a dividend yield of 5.3%, 0.6% points above the historical average of 4.7%. Key to note, NASI’s PEG ratio currently stands at 0.9x, an indication that the market is slightly undervalued relative to its future growth. A PEG ratio greater than 1.0x indicates the market may be overvalued while a PEG ratio less than 1.0x indicates that the market is undervalued.
The charts below indicate the historical P/E and dividend yields of the market;
Universe of Coverage:
|
Cytonn Report: Equities Universe of Coverage |
||||||||||||
|
Company |
Price as at 7/11/2025 |
Price as at 14/11/2025 |
w/w change |
YTD Change |
Year Open 2025 |
Target Price* |
Dividend Yield |
Upside/ Downside** |
P/TBv Multiple |
Recommendation |
||
|
Standard Chartered Bank |
311.5 |
302.5 |
(2.9%) |
6.0% |
285.3 |
314.1 |
14.9% |
18.7% |
1.7x |
Accumulate |
||
|
Diamond Trust Bank |
115.3 |
116.0 |
0.7% |
73.8% |
66S.8 |
128.3 |
6.0% |
16.6% |
0.4x |
Accumulate |
||
|
I&M Group |
46.0 |
45.8 |
(0.4%) |
27.1% |
36.0 |
48.2 |
6.6% |
11.9% |
0.8x |
Accumulate |
||
|
Stanbic Holdings |
194.8 |
194.5 |
(0.1%) |
39.2% |
139.8 |
194.8 |
10.7% |
10.8% |
1.2x |
Accumulate |
||
|
Britam |
8.8 |
8.8 |
(0.5%) |
50.5% |
5.8 |
9.5 |
0.0% |
8.7% |
0.8x |
Hold |
||
|
ABSA Bank |
25.9 |
25.0 |
(3.3%) |
32.6% |
18.9 |
24.1 |
7.0% |
3.3% |
1.6x |
Lighten |
||
|
KCB Group |
70.0 |
65.0 |
(7.1%) |
53.3% |
42.4 |
63.6 |
4.6% |
2.5% |
0.8x |
Lighten |
||
|
Equity Group |
69.8 |
64.0 |
(8.2%) |
33.3% |
48.0 |
61.2 |
6.6% |
2.2% |
1.1x |
Lighten |
||
|
NCBA |
85.0 |
83.0 |
(2.4%) |
62.7% |
51.0 |
79.0 |
6.6% |
1.8% |
1.3x |
Lighten |
||
|
Jubilee Holdings |
323.8 |
328.0 |
1.3% |
87.7% |
174.8 |
312.9 |
4.1% |
(0.5%) |
0.5x |
Sell |
||
|
CIC Group |
4.8 |
4.5 |
(5.4%) |
111.7% |
2.1 |
4.0 |
2.9% |
(8.2%) |
1.2x |
Sell |
||
|
Co-op Bank |
22.9 |
24.8 |
8.3% |
42.1% |
17.5 |
21.1 |
6.0% |
(8.7%) |
0.9x |
Sell |
||
|
*Target Price as per Cytonn Analyst estimates **Upside/ (Downside) is adjusted for Dividend Yield ***Dividend Yield is calculated using FY’2024 Dividends |
||||||||||||
Weekly Highlights
- Cooperative Bank Kenya Q3’2025 Financial Results
During the week, Cooperative Bank Kenya released their Q3’2025 financial results. Below is a summary of the performance:
|
Balance Sheet Items |
Q3'2024 |
Q3'2025 |
y/y change |
|
Government Securities |
211.6 |
255.4 |
20.7% |
|
Net Loans and Advances |
381.3 |
406.5 |
6.6% |
|
Total Assets |
750.8 |
815.3 |
8.6% |
|
Customer Deposits |
514.0 |
548.6 |
6.7% |
|
Deposits per branch |
2.7 |
2. 7 |
(1.6%) |
|
Total Liabilities |
620.0 |
650.7 |
5.0% |
|
Shareholders’ Funds |
131.8 |
164.2 |
24.5% |
|
Balance Sheet Ratios |
Q3'2024 |
Q3'2025 |
% points change |
|
Loan to Deposit Ratio |
74.2% |
74.1% |
(0.1%) |
|
Government Securities to Deposits Ratio |
41.2% |
46.6% |
5.4% |
|
Return on average equity |
20.0% |
18.8% |
(1.2%) |
|
Return on average assets |
3.4% |
3.6% |
0.2% |
|
Income Statement |
Q3'2024 |
Q3'2025 |
y/y change |
|
Net Interest Income |
36.9 |
45.3 |
22.8% |
|
Non-Interest Income |
22.3 |
22.1 |
(0.8%) |
|
Total Operating income |
59.2 |
67.4 |
13.9% |
|
Loan Loss provision |
(5.6) |
(7.4) |
31.9% |
|
Total Operating expenses |
(32.7) |
(37.7) |
15.4% |
|
Profit before tax |
26.8 |
30.0 |
12.1% |
|
Profit after tax |
19.2 |
21.6 |
12.3% |
|
Core EPS |
3.3 |
3.7 |
12.3% |
|
Dividend per Share |
- |
1.0 |
- |
|
Dividend Payout Ratio |
- |
27.2% |
27.2% |
|
Dividend Yield |
- |
10.1% |
10.1% |
|
Income Statement Ratios |
Q3'2024 |
Q3'2025 |
% points change |
|
Yield from interest-earning assets |
13.3% |
13.4% |
0.1% |
|
Cost of funding |
5.9% |
5.4% |
(0.5%) |
|
Net Interest Spread |
7.4% |
8.0% |
0.6% |
|
Net Interest Income as % of operating income |
62.3% |
67.2% |
4.9% |
|
Non-Funded Income as a % of operating income |
37.7% |
32.8% |
(4.9%) |
|
Cost to Income |
55.2% |
56.0% |
0.7% |
|
CIR without provisions |
45.8% |
45.1% |
(0.8%) |
|
Cost to Assets |
3.6% |
3.7% |
0.1% |
|
Net Interest Margin |
8.0% |
8.7% |
0.7% |
|
Capital Adequacy Ratios |
Q3'2024 |
Q3'2025 |
% points change |
|
Core Capital/Total deposit Liabilities |
22.8% |
24.3% |
1.5% |
|
Minimum Statutory ratio |
8.0% |
8.0% |
|
|
Excess |
14.8% |
16.3% |
1.5% |
|
Core Capital/Total Risk Weighted Assets |
18.5% |
20.3% |
1.8% |
|
Minimum Statutory ratio |
10.5% |
10.5% |
|
|
Excess |
8.0% |
9.8% |
1.8% |
|
Total Capital/Total Risk Weighted Assets |
21.6% |
22.7% |
1.1% |
|
Minimum Statutory ratio |
14.5% |
14.5% |
|
|
Excess |
7.1% |
8.2% |
1.1% |
|
Liquidity Ratio |
57.8% |
61.0% |
3.2% |
|
Minimum Statutory ratio |
20.0% |
20.0% |
|
|
Excess |
37.8% |
41.0% |
3.2% |
Key Take-Outs:
- Increased earnings - Core earnings per share grew by 12.3% to Kshs 3.7, from Kshs 3.3 in Q3’2024, driven by the 13.9% increase in total operating income to Kshs 67.4 bn, from Kshs 59.2 bn in Q3’2024. However, the performance was weighed down by a 15.4% increase in total operating expenses to Kshs 37.7 bn from Kshs 32.7 bn in Q3’ 2024,
- Deteriorated asset quality – The bank’s Asset Quality deteriorated, with Gross NPL ratio increasing to 17.3% in Q3’2025, from 16.5% in Q3’2024, attributable to a 12.7% increase in Gross non-performing loans to Kshs 78.9 bn, from Kshs 70.0 bn in Q3’2024, relative to the 7.8% increase in gross loans to Kshs 456.8 bn, from Kshs 423.7 bn recorded in Q3’2024,
- Expanded Balanced sheet - The balance sheet recorded an expansion as total assets increased by 8.6% to Kshs 815.3 bn, from Kshs 750.8 bn in Q3’2024, mainly driven by a 20.7% increase in governments securities holdings to Kshs 255.4 bn, from 211.6 bn in Q3’2024, Notably, Net loans and advances increased by 6.6% to Kshs 406.5 bn, from Kshs 381.3 bn in Q3’2024.
- Increased lending- Customer net loans and advances increased by 6.6% to Kshs 406.5 bn in Q3’2025, up from Kshs 381.3 bn in Q3’2024, as the lender continued to expand lending despite high industry NPLs, a move possibly supported by the gradual easing of the Central Bank Rate to 9.5% in August from 9.75% in June 2025.
For a more detailed analysis, please see the Cooperative Bank Kenya’s Q3’2025 Earnings Note
Summary Performance
The table below shows the performance of listed banks that have released their Q3’2025 results using several metrics:
|
Cytonn Report: Listed Banks Performance in Q3’2025 |
|||||||||||||
|
Bank |
Core EPS Growth |
Interest Income Growth |
Interest Expense Growth |
Net Interest Income Growth |
Net Interest Margin |
Non-Funded Income Growth |
NFI to Total Operating Income |
Growth in Total Fees & Commissions |
Deposit Growth |
Growth in Government Securities |
Loan to Deposit Ratio |
Loan Growth |
Return on Average Equity |
|
Equity Group |
32.7% |
2.9% |
(20.7%) |
16.1% |
7.9% |
2.5% |
40.1% |
7.6% |
2.2% |
19.9% |
63.9% |
7.5% |
24.5% |
|
Co-operative Bank |
12.3% |
10.0% |
(9.0%) |
22.8% |
8.7% |
(0.8%) |
32.8% |
1.6% |
6.7% |
20.7% |
74.1% |
6.6% |
18.8% |
|
Q3'2025 Mkt Weighted Average* |
8.8% |
1.9% |
(5.7%) |
6.5% |
2.9% |
0.4% |
13.1% |
1.9% |
1.4% |
7.1% |
23.8% |
2.5% |
7.8% |
|
Q3’2024 Mkt Weighted Average** |
24.6% |
25.5% |
52.5% |
14.7% |
7.8% |
14.5% |
36.9% |
10.0% |
2.3% |
10.4% |
66.3% |
(2.3%) |
23.5% |
|
*Market cap weighted as at 14/11/2025 |
|||||||||||||
|
**Market cap weighted as at 29/11/2024 |
|||||||||||||
Key take-outs from the table include:
- The listed banks that have released their Q3’2025 results recorded an 8.8% increase in core Earnings per Share (EPS) in Q3’2025, compared to the weighted average growth of 24.6% in Q3’2024,
- Interest income recorded a weighted average growth of 1.9% in Q3’2025, compared to 25.5% in Q3’2024. Interest expenses recorded a market-weighted average decline of 5.7% in Q3’2025 compared to a growth of 52.5% in Q3’2024,
- The Banks’ net interest income recorded a weighted average growth of 6.5% in Q3’2025, a decline from the 14.7% growth recorded over a similar period in 2024, while the non-funded income increased by 0.4% in Q3’2025 compared to the 14.5% growth recorded in Q3’2024 due to the revenue diversification strategies implemented by most banks, and,
- The Banks recorded a weighted average deposit growth of 1.4%, compared to the market-weighted average deposit growth of 2.3% in Q3’2024
Asset Quality:
The table below shows the asset quality of listed banks that have released their Q3’2025 results using NPL ratio and NPL coverage:
|
|
Q3'2025 NPL Ratio* |
Q3'2024 NPL Ratio** |
% point change in NPL Ratio |
Q3'2025 NPL Coverage* |
Q3'2024 NPL Coverage** |
% point change in NPL Coverage |
|
Equity Group |
13.6% |
14.4% |
(0.8%) |
71.1% |
56.8% |
14.4% |
|
Cooperative Bank |
17.3% |
16.5% |
0.8% |
63.7% |
60.5% |
3.2% |
|
Mkt Weighted Average* |
5.2% |
5.3% |
(0.1%) |
24.0% |
20.4% |
3.6% |
|
*Market Cap weighted as at 14/11/2025 |
||||||
|
**Market Cap weighted as at 29/11/2024 |
||||||
Key take-outs from the table include;
- Asset quality for the listed banks that have released results improved during Q3’2025, with market-weighted average NPL ratio decreasing by 0.1% points to 5.2% from 5.3% in Q3’2024 largely due to Equity Group’s numbers, and,
- Market-weighted average NPL Coverage for the two listed banks increased by 3.6% points to 24.0% in Q3’2025 from 20.4% recorded in Q3’2024. The increase was attributable to Equity Group’s coverage ratio increasing by 14.4% points to 71.1% from 56.8% in Q1’2024, coupled with Cooperative Bank’s NPL coverage ratio increasing by 3.2% points to 63.7% from 60.5% in Q3’2024.
We are “Bullish” on the Equities markets in the short term due to current cheap valuations, lower yields on short-term government papers and expected global and local economic recovery, and, “Neutral” in the long term due to persistent foreign investor outflows. With the market currently trading at a discount to its future growth (PEG Ratio at 0.9x), we believe that investors should reposition towards value stocks with strong earnings growth and that are trading at discounts to their intrinsic value. We expect the current high foreign investors sell-offs to continue weighing down the economic outlook in the short term.
- Residential Sector
- Mi Vida to develop 204 Affordable Housing Units
During the week, Mi Vida Homes announced the signing of a major development partnership with International Housing Solutions (IHS) to construct 240 housing units in Riruta, Nairobi. The project will incorporate IFC’s EDGE sustainability standards, emphasizing energy efficiency, water conservation and reduced carbon footprints. The housing units will include studio, one-bedroom and three-bedroom apartments, designed to meet growing demand for modern, affordable homes in urban centres.
This new development follows previous successful collaborations between Mi Vida and IHS, including the delivery of 200 units at Garden City. The partnership highlights the rising investor appetite for climate-conscious housing solutions and strengthens participation of institutional investors in the affordable housing segment. Mi Vida noted that green certification will lower utility costs for residents while improving long-term building performance. The project also supports Kenya’s affordable housing agenda and expanding middle-income housing needs in Nairobi’s peri-urban areas.
We expect that the project will boost supply of affordable and sustainable housing, attract more institutional investors into residential development, and set higher standards for green building practices across Kenya’s real estate market. This initiative aims at addressing the housing deficit in Kenya, which stands at over 2.0 mn units, and aligns with the government’s initiative to deliver 200,000 units per year to close this gap.
- Infrastructure Sector
- Nairobi-Kiambu Road Dualling
During the week, the Cabinet endorsed the dualling of the heavily congested Muthaiga–Kiambu–Ndumberi 25.0 km road, a project expected to cost Kshs 65.0 bn. The project will expand the existing two-lane road into a dual carriageway with new bypasses, loops, pedestrian walkways, non-motorised transport lanes and enhanced commuter facilities. The corridor serves key residential and commercial zones including Muthaiga, Runda, Ridgeways, Kiambu Town and surrounding estates, all of which suffer severe peak-hour traffic congestion.
The upgrade is part of broader infrastructure modernization under Kenya Vision 2030 and the UN Sustainable Development Goals. The government noted that the road improvement will complement ongoing works such as the Rironi–Nakuru–Mau Summit upgrade, enhancing mobility in the Nairobi Metropolitan Region. The project, supported through public–private partnerships, is expected to improve trade, reduce travel time and stimulate economic activity in one of Kenya’s fastest-growing urban corridors.
The dualling is expected to boost property values, stimulate new residential and commercial developments along the corridor, attract investors to Kiambu and surrounding areas, and support the expansion of mixed-use developments due to improved accessibility, rising land values and growing demand for integrated live-work-play environments.
- Hospitality Sector
- Nairobi National Park–Athi-Kapiti Wildlife Migration Corridor
During the week, the Cabinet approved a proposal to establish the Nairobi National Park–Athi-Kapiti Wildlife Migration Corridor, reconnecting vital wildlife routes spanning Machakos and Kajiado counties. The corridor will secure key land parcels, including portions of the Export Processing Zone (EPZ), which will be surrendered to the Kenya Wildlife Service (KWS) for conservation purposes. This follows a 2023 directive aimed at addressing rising habitat fragmentation and escalating human–wildlife conflict.
The three-year initiative will involve construction of key wildlife infrastructure, including a Kshs 50.0 mn overpass across Namanga Road, a Kshs 50.0 mn underpass on Viwandani Road within the EPZ, and a 15.0 km fence costing Kshs 22.5 mn. The project aligns with the Wildlife Corridors and Dispersal Areas Report (2016), Vision 2030 and Kenya’s biodiversity conservation goals and is expected to enhance ecological resilience for species such as wildebeest, zebra and gazelle.
The project is expected to enhance wildlife mobility and strengthen conservation outcomes, ultimately improving the appeal of Nairobi National Park as a tourism destination. By improving the ecological health of the park, the corridor will support increased visitor interest, boost occupancy levels for hospitality establishments surrounding the park and encourage new investment in eco-tourism and conservation-aligned developments in the wider Nairobi ecosystem.
- Real Estate Investment Trusts
- Real Estate Investment Trusts (REITs)
On the Unquoted Securities Platform, Acorn D-REIT and I-REIT traded at Kshs 27.4 and Kshs 23.2 per unit, respectively, as per the last updated data on 7th November 2025. The performance represented a 33.4% and 14.5% gain for the D-REIT and I-REIT, respectively, from the Kshs 20.0 inception price in February 2021. The volumes traded for the D-REIT and I-REIT came in at Kshs 12.8 mn and Kshs 40.6 mn shares, respectively, with a turnover of Kshs 323.5 mn and Kshs 791.5 mn, respectively, since inception in February 2021. Additionally, ILAM Fahari I-REIT traded at Kshs 11.0 per share as of 7th November 2025, representing a 45.0% loss from the Kshs 20.0 inception price. The volume traded to date came in at 1.2 mn shares for the I-REIT, with a turnover of Kshs 1.5 mn since inception in November 2015.
REITs offer various benefits, such as tax exemptions, diversified portfolios, and stable long-term profits. However, the ongoing decline in the performance of Kenyan REITs and the restructuring of their business portfolios are hindering significant previous investments. Additional general challenges include:
- Insufficient understanding of the investment instrument among investors leading to a slower uptake of REIT products,
- Lengthy approval processes for REIT creation,
- High minimum capital requirements of Kshs 100.0 mn for REIT trustees compared to Kshs 10.0 mn for pension funds Trustees, essentially limiting the licensed REIT Trustee to banks only
- The rigidity of choice between either a D-REIT or and I-REIT forces managers to form two REITs, rather than having one Hybrid REIT that can allocate between development and income earning properties
- Limiting the type of legal entity that can form a REIT to only a trust company, as opposed to allowing other entities such as partnerships, and companies,
- We need to give time before REITS are required to list – they would be allowed to stay private for a few years before the requirement to list given that not all companies maybe comfortable with listing on day one, and,
- Minimum subscription amounts or offer parcels set at Kshs 0.1 mn for D-REITs and Kshs 5.0 mn for restricted I-REITs. The significant capital requirements still make REITs relatively inaccessible to smaller retail investors compared to other investment vehicles like unit trusts or government bonds, all of which continue to limit the performance of Kenyan REITs.
We expect Kenya’s real estate sector to maintain a positive growth trajectory, driven by key developments across residential, infrastructure, and hospitality segments. Mi Vida’s 240-unit EDGE-certified development in Riruta highlights growing investment potential in sustainable housing. Infrastructure upgrades, including the Muthaiga–Kiambu road dualling, are set to improve accessibility and stimulate new developments, while the Nairobi National Park–Athi-Kapiti Wildlife Migration Corridor is expected to boost tourism and eco-friendly hospitality investments. The REITs market shows mixed performance, with gains in Acorn D-REIT and I-REIT, though high capital requirements and limited investor uptake continue to constrain growth.
Insolvency refers to a financial situation where an individual, business or entity, such as a fund, is unable to meet their financial obligations or settle their debts as they become due. In most cases, the state of insolvency occurs due to an increase in business expenses, poor cash management, law suits, poor budgeting, fraud, business expansion, a reduction in sales or an unforeseen black swan event like Covid 19. In Kenya, insolvency proceedings are primarily governed by the Insolvency Act of 2015. The act provides for how insolvent companies can be assisted to service creditors obligations and protect the interests of all stakeholders. The options available for an insolvent company include Administration, Receivership, voluntary arrangements, and liquidation. In this week’s focus, we shall look into the following;
- Introduction,
- Current Context and background,
- Recent case studies,
- Challenges affecting insolvency practice, and,
- Recommendations and Conclusion.
Section I: Introduction
In previous Cytonn Topicals, we have extensively analysed Kenya’s insolvency and restructuring landscape, with a focus on enhancing understanding of the Insolvency Act of 2015 and its practical implications for distressed businesses. These publications have examined the definition and types of insolvency, cash flow and balance sheet insolvency, and the economic, operational, and governance factors that typically drive businesses into financial distress. They have also explored the objectives of the Insolvency Act, which seeks to facilitate the rescue of viable firms, protect creditor and investor interests, preserve jobs, and promote economic stability by encouraging business rehabilitation over liquidation. Additionally, past reports have reviewed the main restructuring options available to companies in distress, including administration, receivership, company voluntary arrangements, and liquidation, while evaluating their effectiveness in achieving business continuity. The preceding thematic reports include;
- Real Estate Insolvency in Kenya (Cytonn Weekly #33/2025)
In this report we provided an in-depth analysis of the growing insolvency cases within Kenya’s real estate sector. We examined the structural causes such as excessive debt reliance, poor project governance, delayed off-plan sales, and macroeconomic pressures like high interest rates and inflation. The report also explored types and causes of insolvency in real estate, presented key Kenyan case studies, including Banda Homes, Mitini Scapes Development, Kings Pride Properties, and Runda Royal Limited and drew lessons from international examples such as Evergrande in China and the U.S. subprime crisis. Read the full report here.
- Restructuring and Insolvency in Kenya (Cytonn Weekly #03/2025)
In this comprehensive report we analyzed Kenya’s insolvency landscape, focusing on the Insolvency Act of 2015 how it enables distressed companies to restructure, safeguard assets, and continue operating instead of collapsing into liquidation. It examined key indicators of corporate financial health, business restructuring mechanisms such as administration, receivership, voluntary arrangements, and liquidation, and assessed their effectiveness in practice. The report also reviewed major insolvency cases including Blueshield Insurance, Mastermind Tobacco, Kaluworks, and Mobius Motors, highlighting lessons on governance, creditor coordination, and restructuring timelines. Read the full report here
- Administration as a Business Restructuring Option (Cytonn Weekly #37/2022)
In this report we analyzed administration as a key alternative to liquidation under the Insolvency Act, 2015. We examined how administration offers distressed companies a chance to reorganize, protect creditor interests, and maintain business continuity. Through case studies of Nakumatt Holdings, ARM Cement, and Kaluworks Limited, the publication demonstrated both the potential and challenges of administration in Kenya, highlighting issues such as delayed interventions, high administrative costs, and lack of creditor collaboration. Read the full report here
- Debt Restructuring in Kenya (Cytonn Weekly #25/2022)
In this report we examined debt restructuring as a vital lifeline for companies facing financial distress, particularly in the wake of the COVID-19 pandemic. It explored the key processes, types, and practical examples of restructuring in Kenya, including debt-to-equity swaps, recapitalizations, and informal repayment agreements. Through examples such as Kenya Airways, TransCentury, and TPS Eastern Africa (Serena Hotels), the report illustrated how timely restructuring can preserve value for both creditors and shareholders. It also highlighted challenges such as high restructuring costs, protracted negotiations, and potential credit score impacts. Read the full report here
- Business Restructuring Options under the Insolvency Act (Cytonn Topical, 2020)
In this report we explored the restructuring pathways available to struggling businesses under Kenya’s Insolvency Act, 2015 specifically administration, company voluntary arrangements, and liquidation. It illustrated how these mechanisms can help technically insolvent firms reorganize and protect stakeholder interests while avoiding liquidation. Through case studies such as Nakumatt Holdings, Athi River Mining (ARM) Cement, and Deacons East Africa PLC, the report highlighted how early intervention, professional management, and stakeholder collaboration are critical to successful recovery. Read the full report here
Section II: Current Context and Background
Building on the previous background, this topical examines the challenges facing insolvency in Kenya, highlighting why successful corporate turnarounds have historically been rare. Despite the modern framework under the Insolvency Act 2015, implementation challenges, such as delayed intervention, limited use of rescue tools like company voluntary arrangements, weak creditor coordination, and shallow turnaround expertise have hindered effective restructuring. In this report, we will present recent case studies, outline the key challenges facing insolvency, provide recommendations for more effective turnarounds, and conclude with insights on how Kenya’s insolvency regime can be strengthened. The forthcoming Court of Appeal ruling, arising from the High Court decision on Cytonn High Yields Solutions [2024] KEHC 14726 and expected on 21 November 2025, is anticipated to set an important precedent for how the Insolvency Act, 2015 is applied, particularly on the balance between business rescue and liquidation.
According to the latest statistics by the Kenya’s State Receiver’s office, the total number of petitions for liquidation of companies by courts has averaged 29 every year. Additionally, since 2015, the average annual number of companies under administration, companies under receivership, and companies under voluntary liquidation during each year is 5, 3, and 7, respectively. This situation is partly attributable to the increase in Gross non-performing loans, with the banking sector recording a 5-year CAGR growth of 13.8% to Kshs 728.5 bn in June 2025 from Kshs 382.0 bn in June 2020. Similarly, the Gross Non-Performing Loans (NPL) ratio has increased to 17.6% as of June 2025, from 16.3% in Q2’2024. Additionally, the tough business operating environment is reflected in the 4.2% decline in the average Purchasing Managers’ Index (PMI) to 50.4 for the year to October 2025, down from the 2019 average of 52.6 has led to a significant increase in business operating expenses, which has affected the profitability of the business. The graph below shows the trend in the number of applications for insolvency during each year:
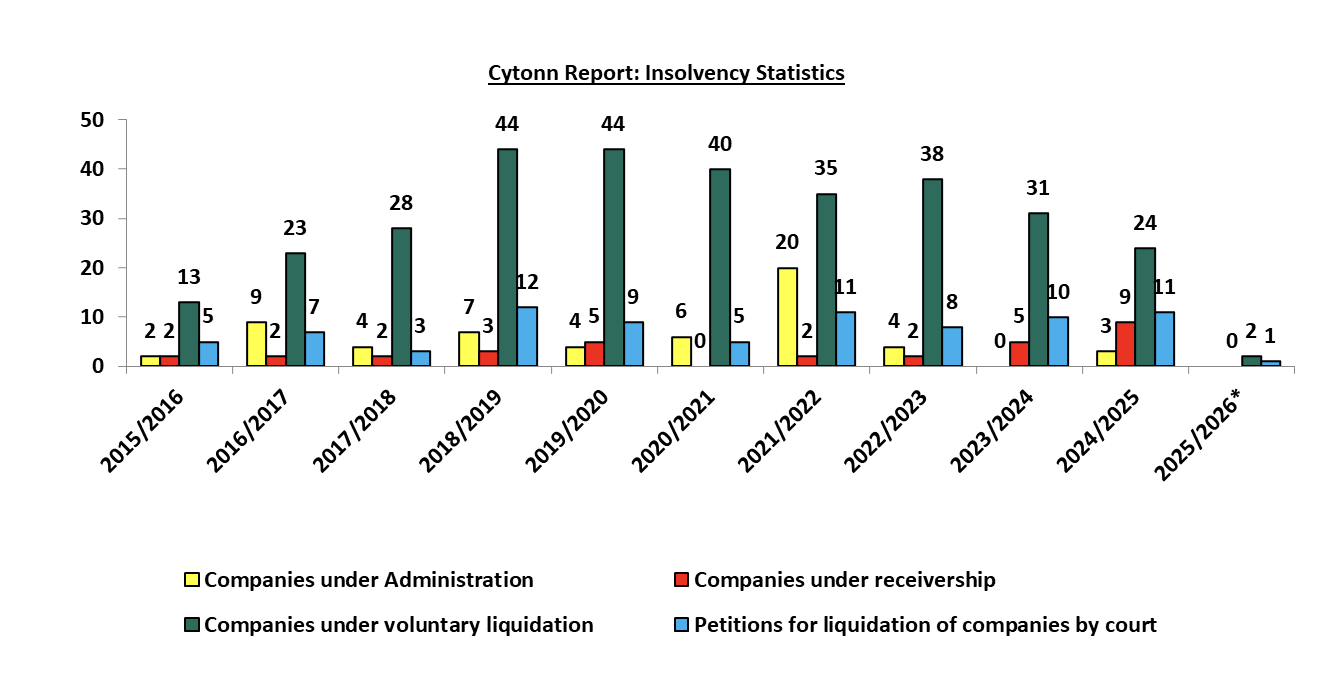
Source: Office of the Official Receiver *data up to November 2025
The following graph shows commercial banks’ gross non-performing loan for the past five years;
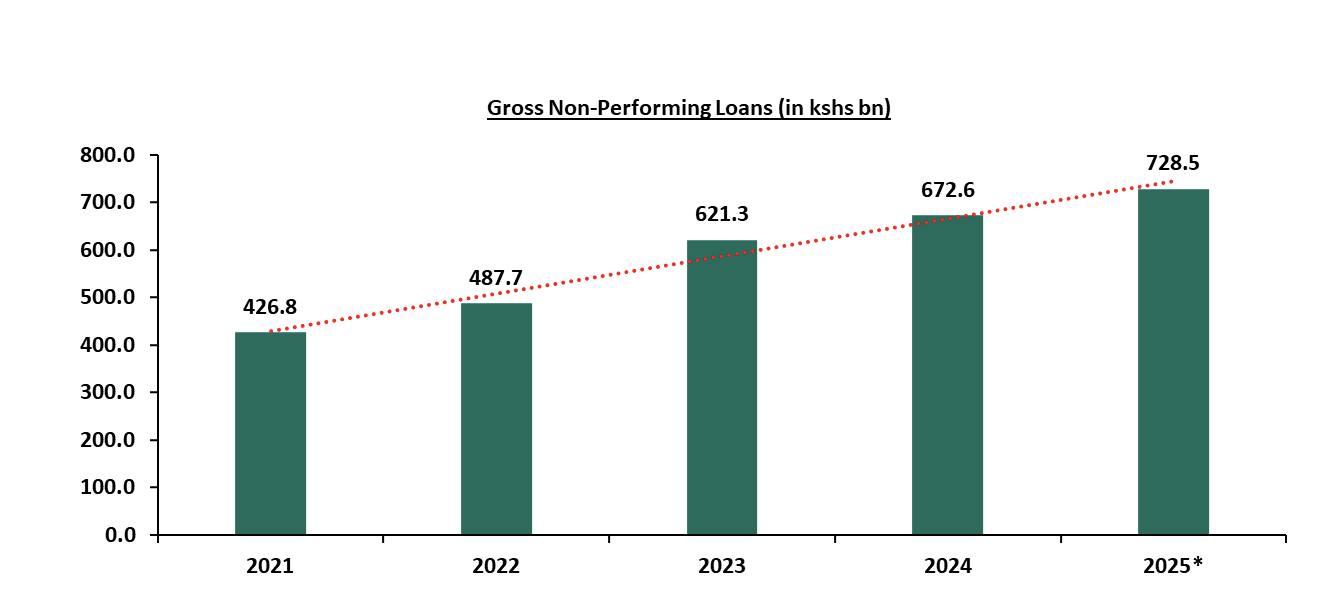
Source: CBK *data up to June 2025
Section III: Case Studies
- Multiple Hauliers E.A. Limited
Multiple Hauliers E.A. Limited, one of Kenya’s largest transport and logistics companies, has been undergoing a complex and protracted insolvency process that underscores the challenges facing corporate restructuring in the country. The company, which employs over 1,500 people, was placed under administration on June 7, 2021, following a liquidation petition by its creditors. The major creditors include;
|
Cytonn Report: Multiple Hauliers Creditors |
|
|
Creditor |
Amount owed (in Kshs bn) |
|
NCBA |
7.2 |
|
Synergy Credit Ltd |
0.5 |
|
Co-operative Bank |
1.2 |
|
NSSF |
0.01 |
|
Diro Advocates LLP |
0.2 |
Source: Cytonn Research
The table below shows the financial position of Multiple Hauliers E.A. Limited;
|
Cytonn Report: Multiple Hauliers E.A. Limited Financial Position (In Kshs bn) |
|
|
Assets |
|
|
Total Assets |
17.0 |
|
Liabilities |
|
|
Verified liaibilities |
31.4 |
|
Equity Position |
(14.4) |
Source: Official Receiver
The company’s financial distress has its roots in a build-up of debt linked to aggressive expansion and falling freight margins. Following the resignation of the NCBA-appointed joint administrators in April 2024, the High Court appointed the Official Receiver, operating under the Business Registration Service, as the new administrator in September 2024. The appointment was intended to facilitate a rescue plan involving a South African investor, Amava Group Capital (Pty) Ltd, which had signed a time sheet with the company to inject USD 8.5 mn to help stabilize operations and repay creditors.
The court directed the Official Receiver to oversee the completion of the investment deal and ensure a smooth transition to the new investor by December 2024. It further required periodic progress reports every sixty days, noting that the proposed investment was in the best interest of all creditors. The court also suspended ongoing suits against the company to prevent asset dismemberment and to allow the restructuring process to proceed in an orderly manner.
In February 2025, the High Court extended the administration period by another six months, emphasizing that the ongoing suits filed by individual creditors, including Prime Bank, would jeopardize the collective restructuring efforts. The court underscored that allowing creditors to act independently would result in a chaotic sale of assets and substantial losses for all parties. The court, therefore, directed that the Official Receiver continue overseeing the company’s affairs under Section 594(1)(b) of the Insolvency Act. It also issued injunctive relief barring KCB Bank, Co-operative Bank, and other secured creditors from auctioning company assets pending the completion of the Amava transaction, although this injunction was limited to the six-month extension period.
However, the rescue process was realigned when the Court of Appeal suspended the appointment of the Official Receiver and all associated High Court orders, following NCBA Bank’s application. The court held that the appointment had not adhered to the procedural requirements of the Insolvency Act and that NCBA’s statutory right to appoint administrators had been disregarded. It further upheld the bank’s position that, because the Official Receiver’s mandate was confined primarily to the Amava investment issue, the company’s remaining assets were left unprotected and susceptible to dissipation under the control of the directors.
In granting the stay orders, a three-judge bench of the Court of Appeal agreed that NCBA’s right to recover its Kshs 7.2 bn debt was potentially at risk. The court observed that the validity of the Official Receiver’s appointment without a formal application was an arguable legal issue and that proceeding with the administration could cause irreparable harm to NCBA if the appeal succeeded. The stay order effectively froze the restructuring process and placed the fate of the company’s rescue in uncertainty.
- Labh Singh Harnam Singh Limited (LSHS),
Labh Singh Harnam Singh Limited (LSHS), Kenya’s oldest and one of the largest truck, coach, and bus body builders, was placed under administration on February 4, 2025, after failing to service a Kshs 1.1 bn loan owed to KCB Group. The High Court appointed Ponangipalli Venkata Ramana Rao and Swaroop Rao Ponangipalli as joint administrators to take over the management of the company’s affairs, in line with the provisions of the Insolvency Act. The appointment effectively suspended the powers of the company’s directors and imposed a moratorium on all legal proceedings against the firm, offering it temporary relief as efforts to restructure or sell its assets commenced.
The administrators’ notice indicated that all claims against LSHS had to be submitted by creditors by March 15, 2025, and emphasized that they were acting as agents of the company without personal liability. The administrators assumed control of all assets and undertakings of the company, with the mandate to either rescue the business and return it to profitability or to realize the assets for the benefit of creditors.
Six months into the administration, efforts to revive LSHS stalled and on August 26, 2025, Phillips International Auctioneers, acting on behalf of the joint administrators and chargees, invited sealed bids for the sale of LSHS’s property, plant, and machinery to recover the KCB loan. The assets on offer included the company’s 5-acre industrial property in Syokimau, Machakos County, equipped with interconnected godowns, a factory for the fabrication and repair of buses and commercial vehicles, office blocks, and auxiliary outbuildings. The factory is fully fitted with machinery for producing and repairing tankers, flatbeds, tippers, rigid containers, and side loaders, and is connected to electricity with water sourced from rain harvesting and external bowsers.
- Put Sarajevo General Engineering Company Limited,
Put Sarajevo General Engineering Company Limited, once a dominant force in Kenya’s road construction sector during the 1980s and 1990s, was placed under liquidation after failing to settle debts amounting to Kshs 800.0 mn owed to three creditors, Hamilton Harrison & Mathews (HHM) Advocates, Arrow Cars Limited and the National Bank of Kenya (NBK). The High Court declared the company insolvent and ordered its liquidation under Section 424(1)(e) of the Insolvency Act, citing overwhelming evidence that the firm was unable to pay its debts.
HHM Advocates initiated the liquidation proceedings in June 2020, claiming Kshs 5.8 mn in unpaid legal fees. Despite being served with a statutory demand, Put Sarajevo did not settle the debt or respond substantively to the petition. As the case progressed, two more creditors; Arrow Cars Limited and NBK, were enjoined in the matter. Arrow Cars claimed Kshs 4.8 mn arising from a commercial dispute over unpaid supplies of tyres, while NBK’s claim stood at a staggering Kshs 876.0 mn. The bank’s exposure stemmed from a range of facilities extended to the company, including overdrafts, asset financing, bonds, and guarantees to support infrastructure projects with the Kenya Rural Roads Authority (KeRRA) and the Kenya National Highways Authority (KeNHA).
The court held that the petitioner and the additional creditors had demonstrated beyond doubt that the company was unable to meet its financial obligations. The court appointed the Official Receiver, or a nominee thereof, as the liquidator to oversee the sale of the company’s assets and distribution of proceeds to creditors. In its ruling the court referenced Section 384 of the Insolvency Act, which outlines the conditions under which a company is deemed unable to pay its debts, including failure to comply with a statutory demand exceeding Kshs 100,000 within 21 days or where its liabilities surpass its assets. The court observed that Put Sarajevo had made no attempt to settle or negotiate its debts despite being afforded sufficient time.
- East African Cables
East African Cables (EAC) is one of Kenya’s oldest manufacturers of electrical cables, with an operational history that spans several decades and a market footprint that extends across East and Central Africa. The company produces a wide range of cables used in construction, power distribution, telecommunications, and industrial applications, positioning it as a critical supplier in the region’s infrastructure value chain. For years, the firm leveraged its strong brand recognition, extensive distribution channels, and regional presence to grow its business. However, its fortunes deteriorated significantly alongside those of its parent company, TransCentury Plc, as both entities became weighed down by excessive leverage, costly debt restructuring attempts, and persistent liquidity constraints.
EAC’s downward spiral became irreversible when it defaulted on a Kshs 2.2 bn loan owed to Equity Bank. These obligations were secured by four prime Nairobi properties, LR. No. 209/4235, LR. No. 209/8176, LR. No. 209/6982/1 and LR. No. 209/6982/2, used as collateral for facilities issued to both East African Cables and TransCentury. As cash flows tightened and restructuring negotiations faltered, Equity issued statutory notices in November 2024 demanding full repayment of the indebtedness, signalling the beginning of an aggressive recovery effort.
EAC challenged the notices in the High Court, arguing that they were procedurally defective, but the court dismissed the application. The company then escalated the matter to the Court of Appeal, hoping to secure interim relief that would stop the bank from exercising its statutory power of sale. However, in May 2025, the Court of Appeal declined to restrain Equity Bank, holding that while the appeal was arguable, the bank, being a tier-1 financial institution, had the capacity to compensate the firm should the appeal later succeed. This ruling effectively opened the door for Equity to proceed with the disposal of the secured properties once temporary protections lapsed.
In the meantime, EAC secured a 90-day reprieve from the High Court in an earlier ruling. The court instructed the firm to continue servicing the debt while seeking alternative financing. During this period, EAC and TransCentury made efforts to secure new capital, including engaging TLG Africa Growth Impact Fund Corporate Management Solutions (Cayman) Limited, which expressed interest in financing the outstanding debt. The companies tabled a non-binding term sheet for an USD 8.0 mn facility, and further correspondence indicated that TLG was collaborating with Kuramo Capital to put together a broader refinancing package. Despite these efforts, the process stalled due to the complexity of the transaction, the large capital outlay involved. As a result, the firm failed to meet the timelines stipulated by the court.
With refinancing attempts faltering and court protections weakening, Equity Bank moved to the next phase of recovery by appointing administrators to take control of EAC and its parent company. In June 2025, Muniu Thoithi, one of the appointed administrators from PwC, attempted to take over the company’s operations. TransCentury, however, physically blocked the takeover by locking out the administrators from the company’s Lavington premises, escalating tensions between the lender, the appointed administrators, and the corporate leadership of the indebted group.
By July 2025, the insolvency process shifted significantly when the PwC-appointed joint administrators, George Weru and Muniu Thoithi, formally opened a structured transaction window aimed at rescuing the business. Through a public notice, they invited both financial and strategic investors to submit proposals for recapitalising the company, refinancing its debt, or acquiring its assets. In line with the Insolvency Act 2015, the administrators emphasised that the principal goal of administration was to rescue the company as a going concern or to achieve a better outcome for creditors than would be realised in liquidation. They signalled flexibility in transaction structures, noting that any credible proposal capable of stabilising the company’s financial position would be considered.
- TransCentury Plc
TransCentury Plc was once one of Kenya’s most prominent investment holding companies, celebrated for its bold strategy of acquiring and scaling infrastructure-related businesses across East Africa. Established in 1997, the firm sought to be a vehicle for regional growth, channelling local capital into strategic sectors such as energy, engineering, transport, and manufacturing.
During its early years, TransCentury built a reputation as a deal-making powerhouse. By 2007, it had acquired controlling stakes in East African Cables (EAC), ABB Tanelec Limited in Tanzania, and Kewberg Cables & Braids in South Africa, positioning itself as a key player in Africa’s growing industrial and infrastructure space. Its investments were buoyed by a favourable macroeconomic climate in the mid-2000s and strong connections to policymakers, which helped it secure opportunities in the electricity and transport sectors, including the establishment of Simba Energy to participate in Kenya’s nascent independent power generation market.
In 2011, seeking to diversify its funding base, TransCentury listed by introduction on the Nairobi Securities Exchange (NSE). The listing gave it access to public capital markets, but the company increasingly relied on debt to fuel growth. This aggressive leverage strategy soon became its undoing. Several of its subsidiaries, including East African Cables, began experiencing operational and financial challenges, weighed down by rising finance costs and shrinking margins.
TransCentury’s debt spiral began with the issuance of a Kshs 6.7 bn convertible bond in Mauritius shortly before its listing on the Nairobi Securities Exchange (NSE). By the time the bond matured in March 2016, a weaker shilling and accrued interest had ballooned the liability to Kshs 8.0 bn. TransCentury argued that it had made “significant progress” in its debt restructuring plan, which included a proposed sale of 51.0% in EA Cables (Tanzania) to Msufini Ltd. .
Kuramo Capital’s initial injection of Kshs 2.0 billion in 2016 was used to partially redeem the Mauritius-issued convertible bond, following a negotiated haircut by bondholders. However, the balance was restructured repeatedly over the years, and by June 2025, over Kshs 1.0 billion remained outstanding, just days before Equity Bank moved to enforce its security. Notably, TransCentury’s financial position remains deeply distressed, with total liabilities exceeding assets by Kshs 12.9 billion, underscoring the severity of the company’s insolvency. A breakdown of assets and liabilities is provided in the table below.
|
Cytonn Report: TransCentury Financial Position as of December 2024 |
|
|
Assets |
|
|
Non-Current Assets |
6.6 |
|
Current Assets |
4.2 |
|
Total assets |
10.8 |
|
Liabilities |
|
|
Non-Current liabilities |
2.8 |
|
Current Liabilities |
20.9 |
|
Total liabilities |
23.7 |
Source: TransCentury 2024 financials
Summary of Various Recent Insolvencies:
The table below shows a summary table of various recent insolvencies in Kenya;
|
Company |
Amount Owed |
Amount Recovered |
|
(Kshs bn) |
(Kshs bn) |
|
|
Multiple Hauliers |
14.0 |
-* |
|
Labh Singh Harnam Singh |
1.1 |
-* |
|
Put Sarajevo General Engineeering Limited |
0.8 |
-* |
|
TransCentury |
4.4 |
-* |
|
East African Cables |
0.3 |
-* |
|
Average |
4.1 |
|
|
*Not disclosed as the recovery is still ongoing. |
|
|
Source: Cytonn Research
Below is a list of recently announced insolvencies;
|
Cytonn Report: Recently announced insolvencies |
|
|
Company |
Date announced |
|
Betway (Liquidation) |
Apr-25 |
|
Kabianga Dairy Limited (Administration) |
May-25 |
|
Redhouse Group Limited(Liquidation) |
May-25 |
|
Mitini Scapes Development Limited (Receivership) |
May-25 |
|
Banda Homes Limited(Receivership) |
Jun-25 |
|
Kwese Free TV LTD(Liquidation) |
Jun-25 |
|
Africa Spirits Limited(Administration) |
Jun-25 |
|
Runda Royal Limited(Receivership) |
Jun-25 |
|
Midland Energy Limited(Liquidation) |
Jun-25 |
|
ECP Kenya Limited(Liquidation) |
Jul-25 |
|
Ecom Services Limited (Voluntary Liquidation) |
Jul-25 |
|
Kings pride properties Limited (subsidiary of telegan) (Liquidation) |
Jul-25 |
|
Telegan Investments Limited(Voluntary Liquidation) |
Aug-25 |
|
Chiedo Developers Limited(Receivership) |
Aug-25 |
|
DT. Dobie & Company LTD(Liquidation) |
Aug-25 |
|
Surgi Sel Limited(Liquidation) |
Aug-25 |
|
Nairobi Upperhill Hotel Limited(Receivership) |
Aug-25 |
|
Citytaps Kenya LTD(Administration) |
Aug-25 |
|
PEBO (Kenya) Limited(Receivership) |
Aug-25 |
|
Mt Kenya Tea Factory Limited(Administration) |
Aug-25 |
|
Zingo Investmensts Limited(Receivership) |
Aug-25 |
|
Eastland Hotel Limited(Receivership) |
Sept-25 |
|
PayU(Liquidation) |
Sept-25 |
|
Blue Nile (East Africa) Limited(Liquidation) |
Sept-25 |
|
Oriental Herbal Company Limited(Liquidation) |
Sept-25 |
|
Land Project Limited(Administration) |
Sept-25 |
|
Mount Kenya Breweries Limited(Administration) |
Sept-25 |
|
Korara Highlands Tea Factory(Administration) |
Sept-25 |
|
Elson Plastics of Kenya Limited(Receivership) |
Sept-25 |
|
Tecof Limited(Administration) |
Sept-25 |
|
Njeru Industries Limited(Administration) |
Sept-25 |
|
KENATCO Taxis Limited(Administration) |
Oct-25 |
|
One Twiga Road Limited(Administration) |
Oct-25 |
|
Collection Africa Limited(Administration) |
Oct-25 |
Source: Kenya Gazette, Various issues
Section IV: Challenges facing insolvency practice
Insolvency practice in Kenya has evolved significantly with the enactment of the Insolvency Act, 2015. This legislation was intended to streamline insolvency processes and offer a more structured framework for handling financial distress in both corporate and personal contexts. However, practitioners and stakeholders continue to grapple with a variety of challenges that hinder the effective realization of the Act's objectives. Below are some of the key challenges facing insolvency practice:
- Corruption – Insolvency is seen as an avenue to dismantle companies and sell their assets for cheap, usually to pre-identified individuals rather than an avenue to resuscitate struggling businesses as was the original statutory intent.
- Poor track record- The greatest challenge facing insolvency in Kenya today is its poor track record, with no notable examples of successful restructuring. The Insolvency Act was intended to deliver better outcomes for creditors and stakeholders by preserving value, safeguarding jobs, and maintaining the tax base. However, the insolvency framework has largely functioned as a process for orderly winddowns or bankruptcies. While the current regime ensures a more organized process compared to the previous system, the anticipated benefits of business survival and continuity have yet to materialize,
- Lengthy and costly processes-The insolvency process in Kenya is often characterized by delays and high costs. Court processes, which form a significant part of insolvency proceedings, are typically slow due to backlog and procedural complexities. Additionally, insolvency process often involves engaging professionals such as lawyers and accountants, whose fees can be substantial. These costs, which are given first claim during asset realization, can significantly reduce the value available for creditors. For example, the administration cost of ARM Cement incurred a total of Kshs 2.5 billion which was too high considering it was over 40.3% of the total amount recovered. Keeping administration costs low ensures creditors recover meaningful amounts and aligns service providers with the interests of creditors,
- Liquidation being most popular option- Many creditors, regulators, and businesses lack sufficient knowledge about administration, leading to hesitation in accepting it as a viable restructuring option. In contrast, liquidation is often preferred because of its simplicity, providing a clear and definitive process for realizing and distributing value. This straightforwardness appeals to creditors, suppliers, and stakeholders. Additionally, liquidation is typically faster than other restructuring methods, making it more attractive to creditors. For instance, the administration of ARM Cement, which began in 2018 and concluded in 2022, almost 5 years, benefiting service providers rather than creditors. Accelerating the administration process would ensure better outcomes for creditors,
- Weak corporate governance and financial reporting- Poor corporate governance and inadequate financial reporting are common issues in Kenya. These problems often come to light during insolvency proceedings, complicating the efforts of administrators or liquidators to assess the true financial position of a distressed entity. The case of Chase Bank Kenya revealed significant gaps in governance and accounting practices, for example, two differing FY’2015 statements were released. The bank’s initial FY’2015 statements showed that Chase Bank had loaned out a total of Kshs 5.7 bn to employees, directors and shareholders while the restated statements indicated the insider loan amounts were Kshs 13.6 bn, Kshs 7.9 bn higher than the previously published statements,
- Managing stakeholders interests – Insolvency practitioners need to manage the task of balancing the interests of diverse stakeholders, including creditors, shareholders, employees, and regulators. These conflicting interests can complicate decision-making and negotiations. For example, in Nakumatt case, retail creditors holding commercial paper resisted collaboration with the administrator, demanding either full repayment or liquidation. This approach resulted in a total loss for the creditors, whereas an equity restructuring could have preserved value, now being capitalized on by competitors like Carrefour,
- Lack of good will from companies in distress –Transparent and accurate information is essential for informed decision-making and effective strategy development. However, insolvency practitioners often report a lack of cooperation from distressed companies in sharing critical information. This hinders practitioners' ability to fully understand the company’s financial situation, leading to potentially flawed decisions. Additionally, the Office of the Official Receiver has observed an increase in cases where company owners secure court injunctions to delay proceedings, using the time to strip company assets while litigation drags on,
- Negative publicity around administration-Administration, particularly when not fully understood by all stakeholders, can jeopardize business continuity. The process often generates negative publicity and uncertainty, which can significantly harm the business and potentially lead to its total collapse, and,
- Complexity of cases - Insolvency cases are often highly complex, involving numerous stakeholders, intricate financial arrangements, and a range of legal and operational challenges. Successfully managing these complexities demands significant expertise and experience. Moreover, insolvency practitioners must manage large volumes of information, which can be time-consuming and potentially delay progress toward their objectives.
Section V: Recommendations and Conclusion
Improving insolvency practice involves addressing various aspects of the process to enhance efficiency, transparency, stakeholder cooperation, and overall effectiveness. These include:
- Effective Oversight: Parliament should play a more effective oversight role. It’s now 10 years of the Insolvency Act 2015 without anything concrete to show in terms of realizing the statutory intent of the legislation. Parliament should review the 10-year track record versus the statutory intent.
- Early Intervention: Taking timely action to address financial distress can lead to more viable and cost-effective solutions. Proactive measures might prevent the situation from deteriorating further and becoming more complex.
- Need for a Success Story to Change the Narrative: The industry urgently requires a success story to counter the negative perception of insolvency professionals as "business undertakers" and highlight their role in fostering business recovery and continuity.
- Transparent Communication: Clear and open communication among stakeholders and insolvency professionals helps streamline processes and avoids misunderstandings that could lead to additional costs.
- Encourage Out-of-Court Settlements: Establishing mechanisms to promote mediation and out-of-court agreements between creditors and debtors can significantly reduce the time and cost associated with formal restructuring processes.
- Efficient Asset Realization: Developing a well-planned strategy for selling assets ensures maximum returns and minimizes associated costs. Streamlined marketing and sales processes reduce unnecessary expenses.
- Incorporating Debt-to-Equity Swaps: Promoting the use of debt-to-equity swaps for companies with strong recovery potential can be highly effective. Businesses with solid market positions, promising revenue streams, or strategic assets can benefit from this approach. Creditors, in turn, gain a stake in the company’s future success, incentivizing their support for turnaround efforts.
- Appropriate Professional Selection: Selecting experienced and reputable insolvency professionals with relevant expertise in restructuring ensures high-quality service delivery while managing costs effectively.
- Streamline Regulatory Frameworks: Governments and regulatory bodies should focus on creating clear and consistent insolvency regulations that facilitate efficient processes, protect creditors, and ensure fair treatment of stakeholders.
The Insolvency Act of 2015 aims to establish a robust and effective insolvency framework in Kenya, fostering a conducive business environment and safeguarding the interests of all stakeholders involved in the insolvency process. By restructuring debts, reducing financial pressures, and maintaining business continuity, the Act provides mechanisms to help businesses recover. However, the success of any restructuring process depends on the company’s ability to adhere to repayment plans, secure creditor support, and implement restructuring strategies effectively.
Disclaimer: The views expressed in this publication are those of the writers where particulars are not warranted. This publication, which is in compliance with Section 2 of the Capital Markets Authority Act Cap 485A, is meant for general information only and is not a warranty, representation, advice or solicitation of any nature. Readers are advised in all circumstances to seek the advice of a registered investment advisor

- Talk to us
- Kenya
- P.O Box 20695 - 00200, Nairobi, Kenya
- Cell +254709101200
- Tel +254709101200
- WhatsApp +254741676635
- United States
- +254709101200
- DOWNLOAD OUR APP
-


- Kenya
- 8th Floor, Pinetree Plaza, Kaburu Drive, Ngong Road, Nairobi, Kenya
- USA
- Suite 1150, 1775 Eye Street NW, USA, Washington DC 20006, USA
- Investments
- High Yield
- Private Equity
- Real Estate
- Real Estate
- RiverRun Estates
- Cytonn Towers
- The Ridge
- Taraji Heights
- The Alma