Education Investment Plans in Kenya, & Cytonn Weekly #29/2023
By Cytonn Research, Jul 23, 2023
Executive Summary
Fixed Income
During the week, T-bills were oversubscribed for the third consecutive week, with the overall subscription rate coming in at 164.5%, up from a subscription rate of 151.8% recorded the previous week. Investor’s preference for the shorter 91-day paper persisted as they sought to avoid duration risk, with the paper receiving bids worth Kshs 28.5 bn against the offered Kshs 4.0 bn, translating to an oversubscription rate of 711.6%, albeit lower than the 833.1% recorded the previous week. The subscription rate for the 364-day and 182-day papers increased to 23.8% and 86.4% respectively, up from 17.7% and 13.5% recorded the previous week. The government accepted a total of Kshs 36.7 bn worth of bids out of Kshs 39.5 bn of bids received, translating to an acceptance rate of 92.9%. The yields on the government papers continued to rise, with the yields on the 364-day, 182-day, and 91-day papers increasing by 25.6 bps, 5.1 bps, and 12.4 bps to 12.7%, 12.3%, and 12.2%, respectively;
In the primary market, the Central Bank of Kenya released the auction results for the tap sale of the re-opened bond FXD1/2016/10 with a 3.2-year tenor to maturity and the newly issued bond FXD1/2023/05 with a tenor to maturity of 5 years. The tap sale was oversubscribed, receiving bids worth Kshs 44.4 bn against the offered Kshs 20.0 bn, translating to a 222.1% oversubscription rate. The government accepted bids worth Kshs 43.4 bn, translating to an acceptance rate of 97.8%. The coupon rates for FXD1/2016/10 and FXD1/2023/05 are 15.0% and 16.8%, respectively, and the allocated average rates for accepted bids are 16.3% and 16.8% for FXD1/2016/10 and FXD1/2023/05, respectively;
During the week, the International Monetary Fund (IMF) announced that it had completed the fifth review of the 38-month Extended Fund Facility (EFF) and Extended Credit Facility (ECF) financing for Kenya allowing for an immediate disbursement of USD 415.4 mn (Kshs 58.9 bn), inclusive of USD 110.3 mn (Kshs 15.6 bn) from an augmentation of access. The board also approved Kenya’s request for a 20-month arrangement under the Resilience and Sustainability Facility (RSF), amounting to USD 551.4 mn (Kshs 78.1 bn) in a bid to build resilience against the impacts of climate change and attract additional private investment towards climate-related initiatives;
Also during the week, Fitch Ratings, a global credit rating agency, revised the outlook on Kenya's Long-Term Foreign-Currency Issuer Default Rating (IDR) to negative from stable and affirmed the IDR at 'B', mainly due to external financing constraints amid high funding requirements, including a USD 2.0 bn Eurobond maturity in 2024, weakening forex reserves, rising financing costs, and uncertainty regarding the fiscal trajectory;
Equities
During the week, the equities market was on a downward trajectory with NASI, NSE 20 and NSE 25 declining by 2.9%, 0.7% and 1.3% respectively, taking the YTD performance to losses of 13.1%, 3.7%, and 8.7% for NASI, NSE 20 and NSE 25, respectively. The equities market performance was mainly driven by losses recorded by large-cap stocks such as Safaricom, NCBA, Bamburi and KCB Group of 6.3%, 3.3%, 2.5%, and 2.0% respectively. The losses were however mitigated by gains recorded by stocks such as Equity Group and Absa Bank of 3.3% and 1.2% respectively;
Recently, the Cooperative Bank of Kenya disclosed that it had received a USD 100.0 mn (Kshs 13.8 bn) loan facility with a maturity of 7 years from the consortium of financial institutions led by DEG which is aimed at providing loans to Micro Small and Medium Enterprises ( MSMEs) operating in Kenya;
Real Estate
During the week, International Finance Corporation (IFC), the development and investment affiliate of the World Bank Group, disclosed details of its proposed Kshs 3.0 bn (USD 20.9 mn) equity co-investment package to support the development and acquisition of approximately 5,000 newly built, resource-efficient, and affordable green housing properties in the Nairobi Metropolitan Area, with a minimum of 15.0% of the committed funds set to be allocated selectively to other counties in Kenya. In the Real Estate Investment Trusts (REITs), Fahari I-REIT closed the week trading at an average price of Kshs 6.2 per share in the Nairobi Securities Exchange, representing a 0.6% decline from the Kshs 6.3 per share recorded the previous week. On the Unquoted Securities Platform as at 14 July 2023, Acorn D-REIT and I-REIT closed the week trading at Kshs 23.9 and Kshs 21.6 per unit, respectively, a 19.5% and 8.0% gain for the D-REIT and I-REIT, respectively, from the Kshs 20.0 inception price. In addition, Cytonn High Yield Fund (CHYF) closed the week with an annualized yield of 13.6%, remaining relatively unchanged from the previous week;
Focus of the Week
Education plays a central role in a household’s consumption budget, with education being the second priority after food at 30.2%, compared to food which had a priority of 31.8%, according to the Kenya National Bureau of Statistics Finaccess Household Survey report. This week, we seek to enlighten the market on education investment plans, why one should invest in an education plan, some of the options available for investors, and the various factors that come into play when selecting an education plan;
Investment Updates:
- Weekly Rates:
- Cytonn Money Market Fund closed the week at a yield of 12.07%. To invest, dial *809# or download the Cytonn App from Google Playstore here or from the Appstore here;
- Cytonn High Yield Fund closed the week at a yield of 13.56% p.a. To invest, email us at sales@cytonn.com and to withdraw the interest, dial *809# or download the Cytonn App from Google Playstore here or from the Appstore here;
- We continue to offer Wealth Management Training every Wednesday, from 9:00 am to 11:00 am. The training aims to grow financial literacy among the general public. To register for any of our Wealth Management Trainings, click here;
- If interested in our Private Wealth Management Training for your employees or investment group, please get in touch with us through wmt@cytonn.com;
- Cytonn Insurance Agency acts as an intermediary for those looking to secure their assets and loved ones’ future through insurance namely; Motor, Medical, Life, Property, WIBA, Credit and Fire and Burglary insurance covers. For assistance, get in touch with us through insuranceagency@cytonn.com;
- Cytonn Asset Managers Limited (CAML) continues to offer pension products to meet the needs of both individual clients who want to save for their retirement during their working years and Institutional clients that want to contribute on behalf of their employees to help them build their retirement pot. To more about our pension schemes, kindly get in touch with us through pensions@cytonn.com;
Real Estate Updates:
- For more information on Cytonn’s real estate developments, email us at sales@cytonn.com;
- Phase 3 of The Alma is now ready for occupation and the show house is open daily. To join the waiting list to rent, please email properties@cytonn.com;
- For Third Party Real Estate Consultancy Services, email us at rdo@cytonn.com;
- For recent news about the group, see our news section here;
Hospitality Updates:
- We currently have promotions for Staycations. Visit cysuites.com/offers for details or email us at sales@cysuites.com;
Money Markets, T-Bills Primary Auction:
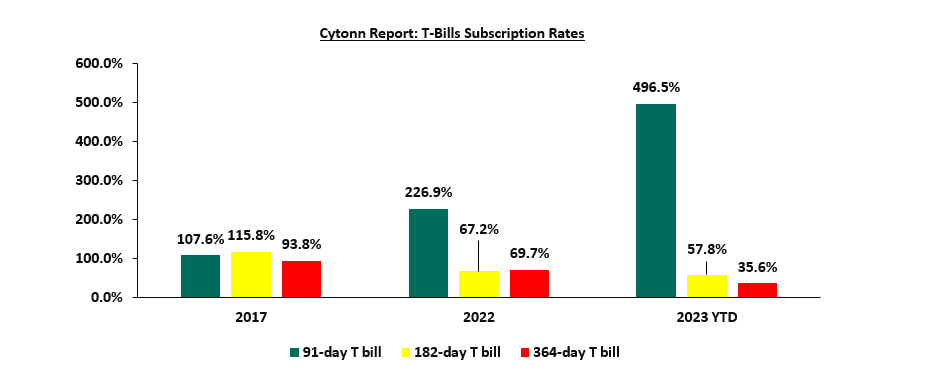
During the week, T-bills were oversubscribed for the third consecutive week, with the overall subscription rate coming in at 164.5%, up from an oversubscription rate of 151.8% recorded the previous week. Investor’s preference for the shorter 91-day paper persisted as they sought to avoid duration risk, with the paper receiving bids worth Kshs 28.5 bn against the offered Kshs 4.0 bn, translating to an oversubscription rate of 711.6%, albeit lower than the 833.1% recorded the previous week. The subscription rate for the 364-day and 182-day papers increased to 23.8% and 86.4% respectively, up from 17.7% and 13.5% recorded the previous week. The government accepted a total of Kshs 36.7 bn worth of bids out of Kshs 39.5 bn of bids received, translating to an acceptance rate of 92.9%. The yields on the government papers continued to rise, with the yields on the 364-day, 182-day, and 91-day papers increasing by 25.6 bps, 5.1 bps, and 12.4 bps to 12.7%, 12.3%, and 12.2%, respectively. The chart below compares the overall average T- bills subscription rates obtained in 2017, 2022 and 2023 Year to Date (YTD):
In the primary market, the Central Bank of Kenya released the auction results for the tap sale of the re-opened bond FXD1/2016/10 with a 3.2-year tenor to maturity and the newly issued bond FXD1/2023/05 with a tenor to maturity of 5 years. The tap sale was oversubscribed, receiving bids worth Kshs 44.4 bn against the offered Kshs 20.0 bn, translating to a 222.1% oversubscription rate. The government accepted bids worth Kshs 43.4 bn, translating to an acceptance rate of 97.8%. The coupon rates for FXD1/2016/10 and FXD1/2023/05 are 15.0% and 16.8%, respectively, and the allocated average rates for accepted bids are 16.3% and 16.8% for FXD1/2016/10 and FXD1/2023/05, respectively.
Money Market Performance:
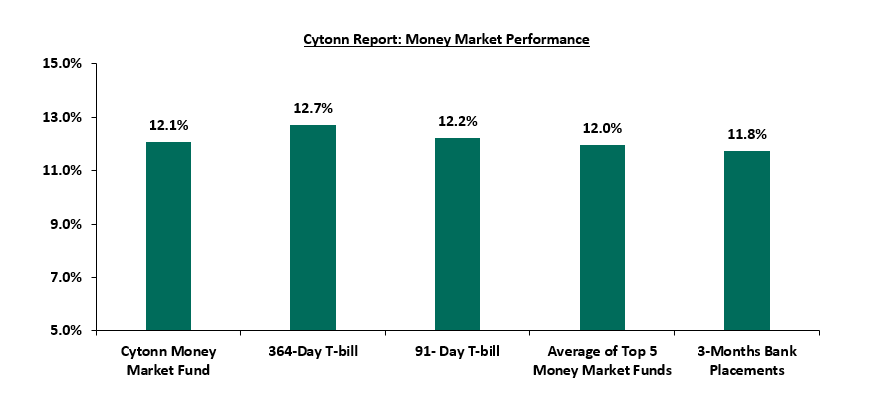
In the money markets, 3-month bank placements ended the week at 11.8% (based on what we have been offered by various banks), while the yields on the 364-day and 91-day papers increased by 25.6 bps and 12.4 bps to 12.7% and 12.2%, respectively. The yield of the Cytonn Money Market Fund decreased by 1.0 bp to remain relatively unchanged at 12.1% from what was recorded the previous week. However, the average yields of the Top 5 Money Market Funds increased by 31.4 bps to 12.0% from 11.6% recorded the previous week:
The table below shows the Money Market Fund Yields for Kenyan Fund Managers as published on 21 July 2023:
|
Cytonn Report: Money Market Fund Yield for Fund Managers as published on 21st July 2023 |
||
|
Rank |
Fund Manager |
Effective Annual Rate |
|
1 |
Etica Money Market Fund |
12.4% |
|
2 |
Cytonn Money Market Fund (dial *809# or download Cytonn App) |
12.1% |
|
3 |
Enwealth Money Market Fund |
12.1% |
|
4 |
Madison Money Market Fund |
11.8% |
|
5 |
GenAfrica Money Market Fund |
11.5% |
|
6 |
GenCap Hela Imara Money Market Fund |
11.4% |
|
7 |
Jubilee Money Market Fund |
11.4% |
|
8 |
Old Mutual Money Market Fund |
11.3% |
|
9 |
Co-op Money Market Fund |
11.2% |
|
10 |
AA Kenya Shillings Fund |
11.0% |
|
11 |
Apollo Money Market Fund |
11.0% |
|
12 |
Kuza Money Market fund |
10.9% |
|
13 |
Nabo Africa Money Market Fund |
10.8% |
|
14 |
Sanlam Money Market Fund |
10.8% |
|
15 |
ICEA Lion Money Market Fund |
10.5% |
|
16 |
Dry Associates Money Market Fund |
10.4% |
|
17 |
KCB Money Market Fund |
10.3% |
|
18 |
NCBA Money Market Fund |
10.3% |
|
19 |
CIC Money Market Fund |
10.0% |
|
20 |
Absa Shilling Money Market Fund |
10.0% |
|
21 |
Zimele Money Market Fund |
9.9% |
|
22 |
British-American Money Market Fund |
9.8% |
|
23 |
Orient Kasha Money Market Fund |
9.4% |
|
24 |
Mali Money Market Fund |
9.1% |
|
25 |
Equity Money Market Fund |
8.5% |
Source: Business Daily
Liquidity:
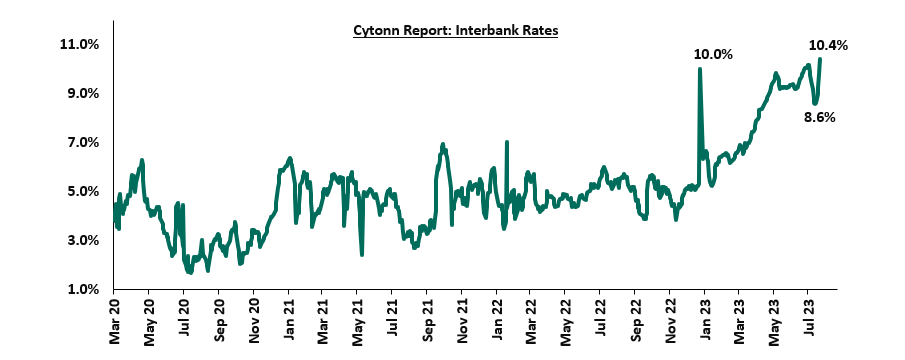
During the week, liquidity in the money markets tightened, with the average interbank rate increasing to 9.4% from 8.8% recorded the previous week, partly attributable to tax remittances that offset government payments. The average interbank volumes traded increased by 22.6% to Kshs 21.8 bn from Kshs 17.8 bn recorded the previous week. The chart below shows the interbank rates in the market over the years:
Source: CBK
Kenya Eurobonds:
During the week, the yields on Eurobonds recorded mixed performance, with the yield of the 10-year Eurobond issued in 2014 increasing the most by 0.3% points to 12.8% from 12.5% recorded the previous week. The table below shows the summary of the performance of the Kenyan Eurobonds as of 20th July 2023;
|
Cytonn Report: Kenya Eurobonds Performance |
||||||
|
|
2014 |
2018 |
2019 |
2021 |
||
|
Date |
10-year issue |
10-year issue |
30-year issue |
7-year issue |
12-year issue |
12-year issue |
|
Amount Issued (USD) |
2.0 bn |
1.0 bn |
1.0 bn |
0.9 bn |
1.2 bn |
1.0 bn |
|
Years to Maturity |
0.9 |
4.6 |
24.7 |
3.8 |
8.9 |
10.5 |
|
Yields at Issue |
6.6% |
7.3% |
8.3% |
7.0% |
7.9% |
6.2% |
|
02-Jan-23 |
12.9% |
10.5% |
10.9% |
10.9% |
10.8% |
9.9% |
|
03-Jul-23 |
12.5% |
11.0% |
11.0% |
11.2% |
11.0% |
10.3% |
|
13-Jul-23 |
12.5% |
11.5% |
11.4% |
11.9% |
11.4% |
10.8% |
|
14-Jul-23 |
12.6% |
11.5% |
11.4% |
11.9% |
11.4% |
10.8% |
|
17-Jul-23 |
12.7% |
11.5% |
11.4% |
12.0% |
11.4% |
10.8% |
|
18-Jul-23 |
12.6% |
11.5% |
11.4% |
12.0% |
11.4% |
10.8% |
|
19-Jul-23 |
12.5% |
11.4% |
11.4% |
11.9% |
11.4% |
10.8% |
|
20-Jul-23 |
12.8% |
11.4% |
11.3% |
12.0% |
11.3% |
10.8% |
|
Weekly Change |
0.3% |
(0.1%) |
(0.1%) |
0.1% |
(0.0%) |
0.1% |
|
MTD Change |
0.3% |
0.5% |
0.3% |
0.8% |
0.4% |
0.5% |
|
YTD Change |
(0.1%) |
0.9% |
0.4% |
1.1% |
0.6% |
1.0% |
Source: Central Bank of Kenya (CBK) and National Treasury
Kenya Shilling:
During the week, the Kenya Shilling remained under pressure, having depreciated by 0.3% against the US dollar to close the week at Kshs 141.8 from Kshs 141.4 recorded the previous week, partly attributable to the persistent high dollar demand from importers, especially in the oil and energy sectors. On a year-to-date basis, the shilling has depreciated by 14.9% against the dollar, adding to the 9.0% depreciation recorded in 2022. We expect the shilling to remain under pressure in 2023 as a result of:
- An ever-present current account deficit, which came at 2.3% of GDP in Q1’2023 from 4.2% recorded in a similar period last year, and,
- The need for government debt servicing, continues to put pressure on forex reserves given that 66.8% of Kenya’s external debt is US Dollar denominated as of April 2023, and,
The shilling is however expected to be supported by:
- Diaspora remittances standing at a cumulative USD 2,033.8 mn in 2023 as of June 2023, albeit 0.5% lower than the USD 2,044.6 mn recorded over the same period in 2022, and,
- The tourism inflow receipts which came in at Kshs 268.1 bn in 2022, a significant 82.9% increase from Kshs 146.5 bn inflow receipts recorded in 2021.
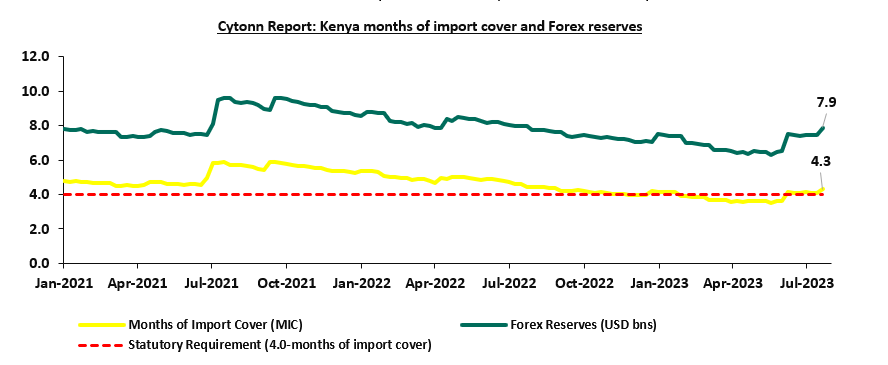
- Sufficient forex reserves currently at USD 7.9 bn (equivalent to 4.3-months of import cover), which is above the statutory requirement of maintaining at least 4.0-months of import cover.
The chart below summarizes the evolution of Kenya months of import cover over the years:
Weekly Highlights:
- International Monetary Fund (IMF) Loan facility
During the week, the International Monetary Fund (IMF) announced that it had completed the fifth review of the 38-month Extended Fund Facility (EFF) and Extended Credit Facility (ECF) financing for Kenya allowing for an immediate disbursement of USD 415.4 mn (Kshs 58.9 bn), inclusive of USD 110.3 mn (Kshs 15.6 bn) from an augmentation of access. The board also approved Kenya’s request for a 20-month arrangement under the Resilience and Sustainability Facility (RSF), amounting to USD 551.4 mn (Kshs 78.1 bn) in a bid to build resilience against the impacts of climate change and attract additional private investment towards climate-related initiatives. Additionally, the board approved a 10-month extension of the current 38-month EFF/ECF arrangements to a 48-month arrangement running through to April 2025 to allow the government sufficient time to implement its economic reform agenda. The disbursement brings the total amount disbursed under the EFF and ECF arrangements to USD 2,056.6 mn (Kshs 291.2 bn). To the country’s reprieve, the Board approved changes to program conditions, waivers of non-observance of the continuous performance criteria on accumulation of external arrears and end-June 2023 tax revenue target, and waivers of applicability for all other end-June 2023 and continuous quantitative performance criteria. While concluding the review, the IMF commended Kenya’s economic resilience despite going through the worst drought in many decades and the challenging economic environment, and lauded the government’s commitment to robust policies, such as the approval of the FY2023/24 Budget and the 2023 Finance Act, to sustain reforms that promote resilient and inclusive growth. The Board expressed continued support for Kenya's positive medium-term prospects. The table below shows the funding the government has received so far out of the original amount:
|
Cytonn Report: International Monetary Fund (IMF) EFF and ECF Financing Programme |
||
|
Date |
Amount Received (USD mn) |
Amount Received (Kshs bn, 1 USD= Kshs 141.6) |
|
Apr-21 |
307.5 |
43.5 |
|
Jun-21 |
407.0 |
57.6 |
|
Dec-21 |
258.1 |
36.5 |
|
Jul-22 |
235.6 |
33.4 |
|
Nov-22 |
433.0 |
61.3 |
|
Jul-23 |
415.4 |
58.8 |
|
Total Amount Received |
2,056.6 |
291.2 |
|
Amount Pending |
283.4 |
40.1 |
The disbursement is expected to shore up and increase the country’s foreign exchange reserves, which have been under pressure during the first half of the year, and consequently help support the Kenya shilling from further depreciation, which has depreciated by 14.9% year to date. Additionally, the loan disbursement will support the country’s Medium Term Debt Strategy, which aims to optimize the use of concessional loans and reduce the use of costly commercial loans, and the new administration’s plans to cut public expenditure to reduce the budget deficit. According to the IMF, Kenya’s economy growth rate is projected to improve to 5.0% in 2023 from the 4.8% growth rate recorded in 2022, mainly attributable to favourable weather conditions boosting agricultural production, which is one of Kenya’s main GDP contributors. However, the tighter fiscal and monetary environment, such as the suspension of subsidies and increased taxes, put in place by the national treasury to maintain macroeconomic stability and the ongoing political tension disrupting supply chains are expected to weigh on growth in the year.
- Kenya’s Fitch Ratings
During the week, Fitch Ratings, a global credit rating agency, revised the outlook on Kenya's Long-Term Foreign-Currency Issuer Default Rating (IDR) to negative from stable and affirmed the IDR at 'B', mainly due to external financing constraints amid high funding requirements, including a USD 2.0 bn Eurobond maturity in 2024, weakening forex reserves, rising financing costs, and uncertainty regarding the fiscal trajectory. Notably, this confirms the global ratings agency Moody's decision in May 2023 to cut Kenya's senior unsecured debt rating as well as long-term foreign-currency and local-currency issuer ratings to B3 from B2 mainly due to an increase in government liquidity risks.
According to Fitch Ratings, the downgrade in Kenya’s IDR was on the back of:
- Increased External Financing Challenges: Kenya’s external debt service costs is expected to rise sharply by 53.6% to USD 4.3 bn in FY’2023/2024 up from USD 2.8 bn that was spent on debt service in the previous year, FY’2022/2023. The high debt servicing cost is mainly due to the USD 2.0 bn Eurobond maturing in June 2024. Due to the expected continuation of the global tightening cycle, Kenya is likely to face headwinds in servicing the Eurobond since the government plans to refinance the Eurobond in external markets,
- Increased Pressures on Reserves: The forex reserves remain under pressure despite the recovery and the disbursements from the IMF due to increased commercial demands. Notably, for the majority of the first half of the year, the Forex Reserves remained below the statutory minimum requirement of maintaining at least 4 months of import cover. Fitch projects that reserves will decline further to USD 7.0 bn which translates to 2.8 months of import cover at the end of 2024, below the projected ‘B’ median (3.4 months), reflecting financing constraints and persistent depreciation pressures on the Kenyan Shilling,
- High Debt and Currency Risk: Fitch estimates that the government Debt to GDP ratio rose by 3.7% points, to 71.0% in FY’2022/2023 from 67.3% in FY’2021/22, mainly due to currency risk since half of Kenya’s debt is foreign currency denominated and 66.8% of external debt is denominated in USD as of April 2023. Therefore, the continued depreciation of the Kenya shillings continues to inflate external debt in local currency terms , with the shilling having depreciated by 14.9% year to date. Additionally, following the parliament's approval of the debt to GDP anchor of 55.0% in terms of present value, to replace the current nominal benchmark debt ceiling of Kshs 10.0 tn, Fitch projects government debt to decline to 68.5% of GDP in 2025,
- Tighter Domestic Financing Conditions: The country’s inability to access international markets in recent years has increased its reliance on domestic financing, putting upward pressure on interest costs, mainly on the back of tight monetary policy. Shorter-dated government paper yields have increased, with the 91-day, 182-day, and 364-day papers all having yields above 12.0%. As a result, the sustainability of debt is at risk due to the rising trend in debt servicing costs. Fitch projects government interest payments to reach 28% of revenue in FY’2024/2025, about 3 times the current ‘B’ median forecast of 10.0%,
- Fiscal Consolidation Faces Risks: The government has remained committed to fiscal consolidation, with Fitch projecting the budget deficit to decline to 5.5% of GDP FY’2024/2025 from an estimate of 6% of GDP in FY’2023/2024. However, the budget spending cuts are expected to experience offsetting pressure from rising government costs, especially increases in debt servicing costs and government pensions and gratuities. Additionally, the Finance Bill 2023, which seeks to enhance revenue mobilization through measures such as increasing the VAT rate on petroleum products, continues to face execution challenges due to protests and legal challenges. Therefore, further delays could undermine the government's fiscal consolidation strategy, increase financing needs, and negatively impact domestic financing conditions,
- Protests Threaten the Socio-Political Climate: The ongoing anti-government protests addressing the high cost of living, fueled by the Finance Bill 2023 present heightened social pressures on the government.
- Elevated Inflation amidst Currency Depreciation: Inflation has persistently remained above the Central Bank of Kenya's (CBK) inflation target band of 2.5-7.5%, in the last 13 months to June 2023, mainly due to high food and energy prices amid the weaker shilling. Currently, inflation rate stands at 7.9% as of June 2023, and Fitch forecasts that average annual inflation will rise by 0.4% points, to 8.0% in 2023 from 7.6% in 2022, before falling back below 7.0% in 2024.
The agency noted that despite the ongoing policy tightening, higher inflation, and external headwinds, the Kenyan economy remains resilient. The economic growth slowed down to 4.8% in 2022 compared to a growth rate of 7.6% in 2021 and this remains strong. As such, the agency expects economic growth to rebound to 5.2% in 2023, supported by growth in the services sector and improved weather conditions expected to support the agriculture sector.
Rates in the Fixed Income market have been on an upward trend given the continued high demand for cash by the government and the occasional liquidity tightness in the money market. The government is 61.0% ahead its prorated net domestic borrowing target of Kshs 37.8 bn, having a net borrowing position of Kshs 60.9 bn of the domestic net borrowing target of Kshs 598.3 bn for the FY’2023/2024. Therefore, we expect a continued upward readjustment of the yield curve in the short and medium term, with the government looking to bridge the fiscal deficit through the domestic market. Owing to this, our view is that investors should be biased towards short-term fixed-income securities to reduce duration risk
Market Performance:
During the week, the equities market was on a downward trajectory with NASI, NSE 20 and NSE 25 declining by 2.9%, 0.7% and 1.3% respectively, taking the YTD performance to losses of 13.1%, 3.7% and 8.7% for NASI, NSE 20 and NSE 25, respectively. The equities market performance was mainly driven by losses recorded by large-cap stocks such as Safaricom, NCBA, Bamburi and KCB Group of 6.3%, 3.3%, 2.5%, and 2.0% respectively. The losses were however mitigated by gains recorded by stocks such as Equity Group and Absa Bank of 3.3% and 1.2% respectively;
During the week, equities turnover decreased by 4.1% to USD 5.7 mn from USD 5.9 mn, recorded the previous week, taking the YTD turnover to USD 476.2 mn. Foreign investors remained net buyers for the sixth consecutive week with a net buying position of USD 1.5 mn, from a net buying position of USD 0.5 mn recorded the previous week, taking the YTD net selling position to USD 253.9 mn.
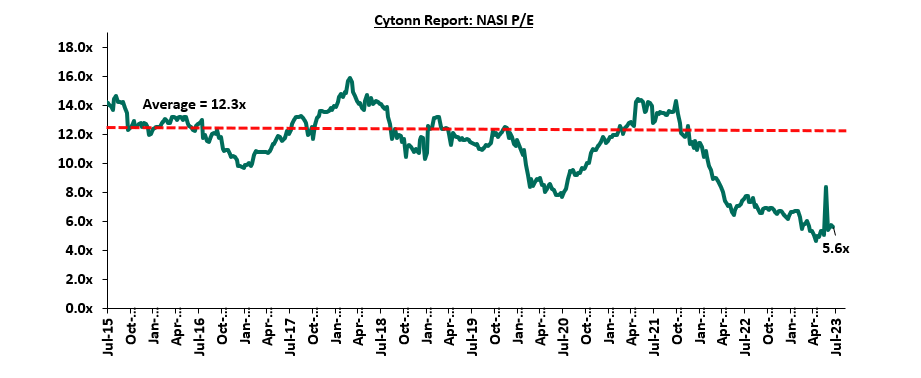
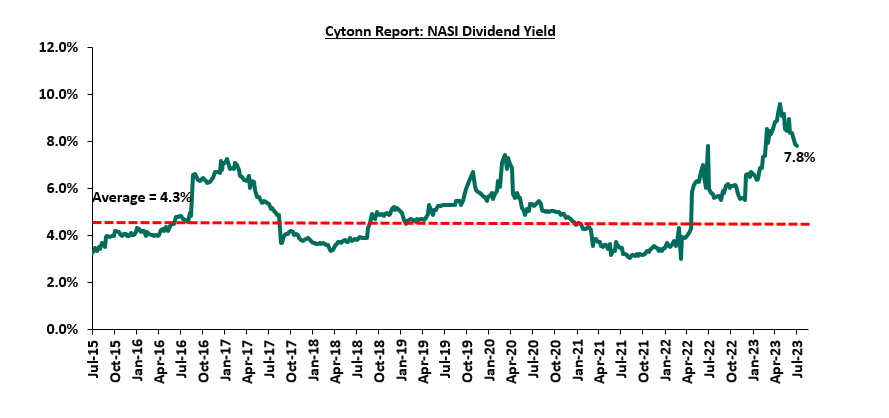
The market is currently trading at a price to earnings ratio (P/E) of 5.6x, 54.6% below the historical average of 12.3x. The dividend yield stands at 7.8%, 3.5% points above the historical average of 4.3%. Key to note, NASI’s PEG ratio currently stands at 0.7x, an indication that the market is undervalued relative to its future growth. A PEG ratio greater than 1.0x indicates the market is overvalued while a PEG ratio less than 1.0x indicates that the market is undervalued. The charts below indicate the historical P/E and dividend yields of the market;
Weekly Highlight
- DEG-Led Consortium Loan Facility to Cooperative Bank
Recently, the Cooperative Bank of Kenya disclosed that it had received a USD 100.0 mn (Kshs 13.8 bn) loan facility with a maturity of 7 years from the consortium of financial institutions led by DEG which is aimed at providing loans to Micro Small and Medium Enterprises ( MSMEs) operating in Kenya. The consortium comprises DEG- Deutsche Investitions is a German lending institution that offers financing, advice, and support to private sector enterprises operating in developing and emerging-market countries such as Kenya, The Africa Agriculture & Trade Investment Fund (AATIF), Micro Small Medium Enterprises Bonds (MSMEB), European Development Finance Institutions namely Finnfund, Norfund, and the co-financing facility European Financing Partners (EFP).
This becomes the first credit facility organized by DEG to the Cooperative bank of Kenya, following other similar fundings from International Finance Cooperation (IFC) of USD 75 mn (Kshs 8.25 bn) and USD 105 mn (Kshs 10.8 bn) in 2021 and 2016 respectively, which were geared towards boosting lending to MSMEs.
In addition to credit provisions to MSMEs, the facility will help to:
- Enhance the bank’s assets and liability match where long-term loans can be financed using the long-term debt,
- Diversify the bank’s asset and funding portfolio,
- Expand the bank’s client base, especially among MSMEs, and,
- Boost the bank’s competitive position on account of affordable lending.
Universe of coverage:
|
Company |
Price as at 14/07/2023 |
Price as at 21/07/2023 |
w/w change |
YTD Change |
Target Price* |
Dividend Yield |
Upside/ Downside** |
P/TBv Multiple |
Recommendation |
|
Kenya Reinsurance |
1.9 |
1.8 |
(2.2%) |
(3.2%) |
2.5 |
11.0% |
49.7% |
0.1x |
Buy |
|
Jubilee Holdings |
190.0 |
185.3 |
(2.5%) |
(6.8%) |
260.7 |
6.5% |
47.2% |
0.3x |
Buy |
|
KCB Group*** |
30.2 |
29.6 |
(2.0%) |
(22.9%) |
41.3 |
6.8% |
46.4% |
0.5x |
Buy |
|
Liberty Holdings |
4.2 |
4.3 |
3.1% |
(15.1%) |
5.9 |
0.0% |
38.3% |
0.3x |
Buy |
|
NCBA*** |
39.9 |
38.6 |
(3.3%) |
(1.0%) |
48.9 |
11.0% |
37.7% |
0.8x |
Buy |
|
Co-op Bank*** |
12.1 |
12.0 |
(1.2%) |
(1.2%) |
15.0 |
12.6% |
37.7% |
0.6x |
Buy |
|
ABSA Bank*** |
12.2 |
12.4 |
1.2% |
1.2% |
14.7 |
10.9% |
29.7% |
1.0x |
Buy |
|
Standard Chartered*** |
161.8 |
162.5 |
0.5% |
12.1% |
183.9 |
13.5% |
26.7% |
1.1x |
Buy |
|
Sanlam |
8.4 |
8.2 |
(2.4%) |
(14.4%) |
10.3 |
0.0% |
25.5% |
2.3x |
Buy |
|
Diamond Trust Bank*** |
47.7 |
47.8 |
0.2% |
(4.2%) |
54.6 |
10.5% |
24.8% |
0.2x |
Buy |
|
Equity Group*** |
43.1 |
44.5 |
3.3% |
(1.3%) |
51.2 |
9.0% |
24.1% |
1.0x |
Buy |
|
HF Group |
4.5 |
4.8 |
5.5% |
51.4% |
5.8 |
0.0% |
21.8% |
0.2x |
Buy |
|
CIC Group |
2.0 |
2.2 |
10.6% |
15.2% |
2.5 |
5.9% |
19.5% |
0.7x |
Accumulate |
|
Stanbic Holdings |
120.0 |
119.0 |
(0.8%) |
16.7% |
127.9 |
10.6% |
18.0% |
0.9x |
Accumulate |
|
Britam |
5.1 |
5.2 |
0.8% |
(0.4%) |
6.0 |
0.0% |
15.3% |
0.7x |
Accumulate |
|
I&M Group*** |
18.1 |
18.9 |
4.1% |
10.6% |
19.5 |
11.9% |
15.2% |
0.4x |
Accumulate |
We are “Neutral” on the Equities markets in the short term due to the current tough operating environment and huge foreign investor outflows, and, “Bullish” in the long term due to current cheap valuations and expected global and local economic recovery.
With the market currently being undervalued to its future growth (PEG Ratio at 0.7x), we believe that investors should reposition towards value stocks with strong earnings growth and that are trading at discounts to their intrinsic value. We expect the current high foreign investors' sell-offs to continue weighing down the equities outlook in the short term.
- Residential Sector
During the week, the International Finance Corporation (IFC), the development and investment affiliate of the World Bank Group, disclosed details of its proposed Kshs 3.0 bn (USD 20.9 mn) equity co-investment package to support the development and acquisition of approximately 5,000 newly built, resource-efficient, and affordable green housing properties in the Nairobi Metropolitan Area (NMA), with a minimum of 15.0% of the committed funds set to be allocated selectively to other counties in Kenya. IFC will be partnering with IHS Kenya Green Housing Partnership LLP, and IHS Kenya Green Housing SCS, with the IFC investing up to Kshs 1.6 bn (USD 10.9 mn) from its own account and up to Kshs 1.4 bn (USD 10.0 mn) from the Market Accelerator for Green Construction Program (MAGC), which is a partnership entity between the United Kingdom and the IFC. This blended concessional finance will be 1.2% of the total fund estimated to be worth Kshs 19.9 bn (USD 140.0 mn) from various institutional investors. The management of the Fund will be handled by IHS Kenya Green Housing Fund GP Limited, which is a Nairobi-based private equity firm specializing in affordable housing in Africa. Currently, IHS manages four affordable housing funds in the Southern African region and owns a listed Real Estate Investment Trust (REIT) on the Johannesburg Stock Exchange. With operations in South Africa, Namibia, Botswana, and Kenya, IHS has a strong track record in the African affordable housing sector. However, IFC has not made public the counties that will benefit from its investment or when the affordable housing projects in the country will commence after securing the funds.
We expect the investment by the IFC to be crucial in supporting the prioritized efforts of the current administration to address the annual housing deficit in Kenya, which is estimated to be at 80.0% according to the National Housing Corporation (NHC). The government aims to address this deficit by partnering with the private sector and implementing public sector interventions to provide supporting infrastructure, and streamline transactions in the sector for execution of affordable housing options for its citizens. Additionally, this major move will assist boost the low home ownership rate in Kenya, particularly in urban centers, which stands at 21.3% in contrast to other countries such as South Africa and Ghana, where the home-ownership rates in urban areas are much higher at 69.7% and 52.0%, respectively. The graph below shows the urban home-ownership rate in Kenya compared to select countries as of 2022;

Source: Centre for Affordable Housing Africa, US Census Bureau, UK Office for National Statistics
However, exorbitant cost of financing in the development of housing units remains one of the key challenges facing the Kenyan residential sector. This is influenced by factors such as; i) expensive land prices, ii) rising costs of construction, iii) low income levels, iv) undermined capital markets, and, v) limited access to affordable long-term home loans. As a countermeasure to address some of these factors, the government, together with the World Bank, Primary Mortgage Lenders (PMls), and other financial institutions, established the Kenya Mortgage Refinancing Company (KMRC) in 2018. The KMRC, the sole mortgage refinancer in the country, continuously provides long-term funds to PMLs, such as banks, with the goal of unlocking affordable home loans for Kenyan citizens.
- Real Estate Regulated Funds
- Real Estate Investment Trusts (REITs)
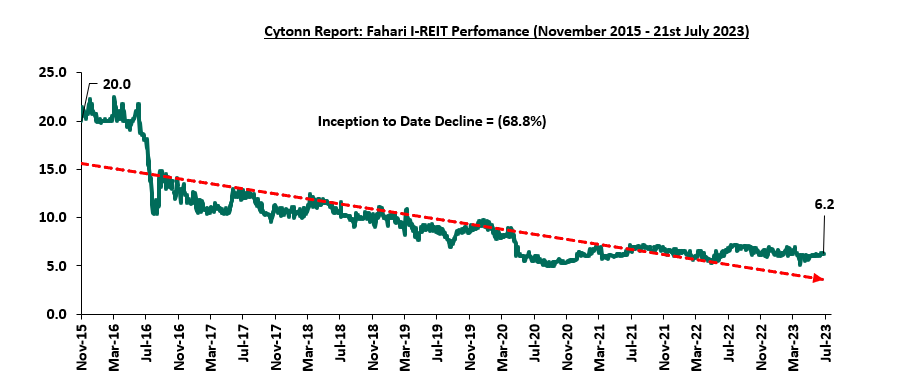
In the Nairobi Securities Exchange, ILAM Fahari I-REIT closed the week trading at an average price of Kshs 6.2 per share. The performance represented a 0.6% decline from Kshs 6.3 per share recorded the previous week, taking it to an 8.0% Year-to-Date (YTD) decline from Kshs 6.8 per share recorded on 3 January 2023. In addition, the performance represented a 68.8% Inception-to-Date (ITD) loss from the Kshs 20.0 price. The dividend yield currently stands at 10.4%. The graph below shows Fahari I-REIT’s performance from November 2015 to 14 July 2023;
In the Unquoted Securities Platform, Acorn D-REIT and I-REIT traded at Kshs 23.9 and Kshs 21.6 per unit, respectively, as at 14 July 2023. The performance represented a 19.5% and 8.0% gain for the D-REIT and I-REIT, respectively, from the Kshs 20.0 inception price. The volumes traded for the D-REIT and I-REIT came in at 12.3 mn and 30.1 mn shares, respectively, with a turnover of Kshs 257.5 mn and Kshs 620.7 mn, respectively, since inception in February 2021.
REITs provide numerous advantages, including; access to larger capital pools, consistent and prolonged profits, tax exemptions, diversified portfolios, transparency, liquidity, and flexibility as an asset class. Despite these benefits, the performance of the Kenyan REITs market remains limited by several factors, such as; i) insufficient investor understanding of the investment instrument, ii) time-consuming approval procedures for REIT creation, iii) high minimum capital requirements of Kshs 100.0 mn for trustees, and, iv) high minimum investment amounts set at Kshs 5.0 mn discouraging investments.
- Cytonn High Yield Fund (CHYF)
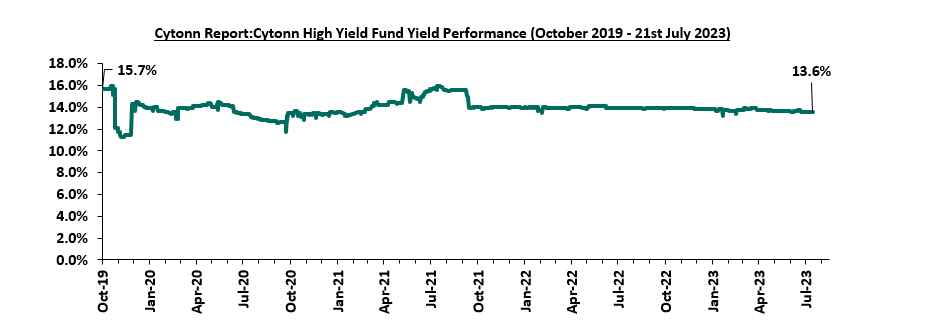
Cytonn High Yield Fund (CHYF) closed the week with an annualized yield of 13.6%, remaining relatively unchanged from the previous week. The performance also represented a 0.3% points Year-to-Date (YTD) decline from 13.9% yield recorded on 1st January 2023, and 2.1% points Inception-to-Date (ITD) loss from the 15.7% yield. The graph below shows Cytonn High Yield Fund’s performance from October 2019 to 21 July 2023;
Notably, the CHYF has outperformed other regulated Real Estate funds with an annualized yield of 13.6%, as compared to Fahari I-REIT and Acorn I-REIT with yields of 10.4%, and 6.8% respectively. As such, the higher yields offered by CHYF makes the fund one of the best alternative investment resource in the Real Estate sector. The graph below shows the yield performance of the Regulated Real Estate Funds:

*FY’2022
Source: Cytonn Research
We expect the performance of Kenya’s Real Estate sector to remain on an upward trajectory, supported by factors such as; i) initiatives by the government and private sector to prioritize affordable housing, ii) infrastructure developments facilitating investments, and iii) positive demographic trends facilitating increased housing demand. There are, however, a number of challenges that remain, including oversupply in certain real estate sectors, including commercial office and retail, which are both oversupplied, ii) escalating construction costs due to rising inflation, and iii) limited investor knowledge and interest in REITs, which is expected to hinder the sector's optimal performance.
Education plays a central role in households' consumption budget, with education being the second priority after food, at 30.2%, compared to food which had a priority of 31.8%, according to the Kenya National Bureau of Statistics Finaccess Household Survey report. Previously, we have covered the following topics on Education investment plans:
- Education Investment Plans in Kenya in Cytonn Weekly #07/2020 - We focused on analyzing the various education investment plans in the market and the factors to be considered when selecting a suitable investment plan, and,
- Financial Planning for Education in Cytonn Weekly #10/2021 - We focused on how to plan your finances in preparation for future Education cost that one might incurred
In order to continue sensitizing the market on the importance of Education Investment Plans, we found it timely to reiterate the topic and this week we will cover the following sections:
- Introduction
- Understanding the concept of Savings and Investments,
- Importance of Education Investment Plans,
- Key Considerations when choosing an Education Investment plan,
- Education investment plans in Kenya,
- Limitations of Uptake of Education Investment Plans,
- Alternatives to Education Investment Plans, and,
- Conclusions
Section I: Introduction
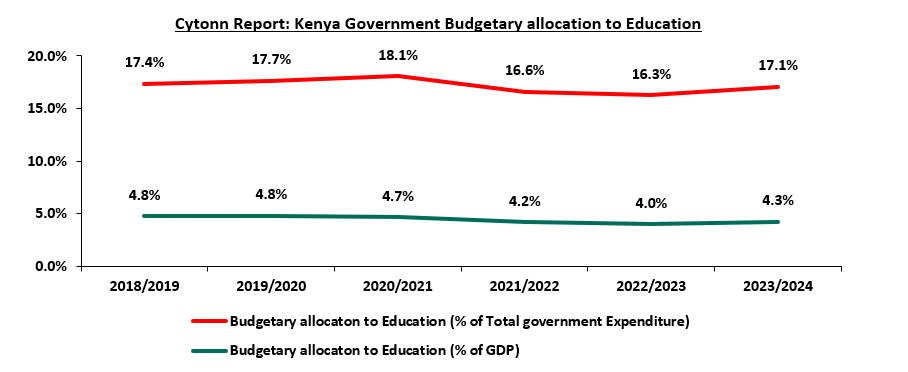
Education is a key aspect of any economy, with the Kenyan government making significant allocations towards education expenditure in every fiscal year. In FY’2023/2024, the education sector received the second largest share of the government expenditure, with the government increasing its allocation to the sector by 15.5% to Kshs 628.6 bn from Kshs 544.4 bn in FY'2022/2023. The allocation represented 4.3% of the GDP, up from 4.0% of GDP in FY’2022/2023. Below is a chart showing a percentage of education expenditure against total government expenditure and against GDP:
Source: The National Treasury
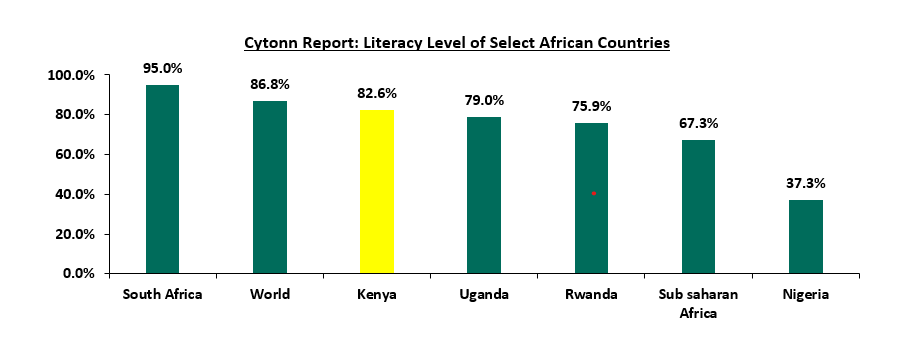
According to World bank Kenya has a literacy level of 82.6%, which is 15.3% points higher than the Sub-Saharan average literacy level of 67.3%. The graph below shows the literacy level of select African countries to the Sub-Saharan and global averages.
Source: World Bank
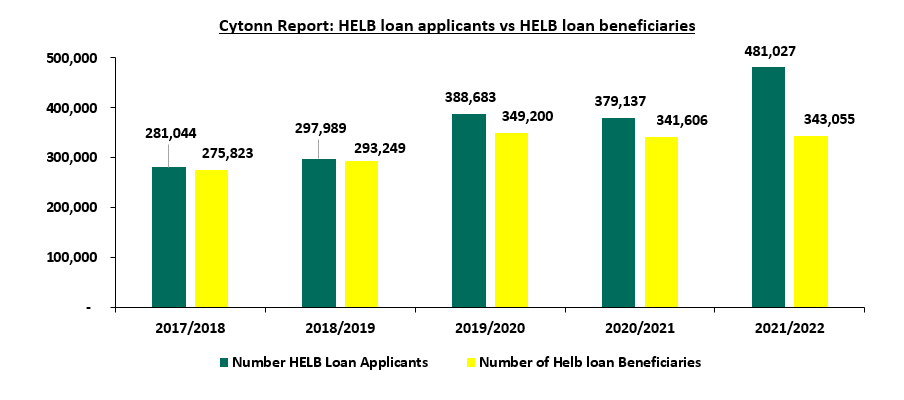
Despite government interventions in funding the education sector, education costs are still a burden to guardians, leading to a growth in the number of applicants for the loans issued by the Higher Education Loan Board (HELB). According to the Kenya National Bureau of Statistics (KNBS) Economic Survey 2023, the total number of HELB loan applicants increased by 27.9% to 481,027 applicants in FY’2021/22 from 376,137 applicants in FY’2020/21. However, despite the increase in applicants, the number of loan beneficiaries only rose by a paltry 0.4% to 343,055 from 341,606 in FY’2020/21. As a result, the number of unsuccessful applicants increased by 299.7% to 137,900 in FY’2021/22 from 34,500 in FY’2020/21. The graph below shows the growth of HELB loan applicants and beneficiaries in the last 5 years.
Source: KNBS Economy Survey report
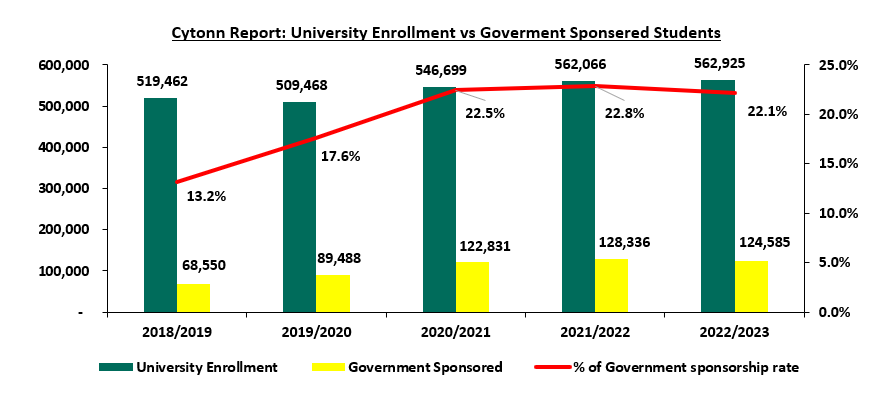
Additionally, there were 481,027 applicants for bursaries from the HELB in FY’2021/2022, out of which only 37,982 applicants were awarded bursaries, a 2.7% decline from the 39,055 in FY’2020/21. As a result, the rate of students transitioning from secondary schools to universities remains marginal, with the number of university enrolments growing at a 5-year CAGR of 1.6% to 562,925 students in FY’2022/23 from 519,462 students in FY’2017/18. Additionally, the low rate of government sponsorship has contributed to the low transition, with the number of government-sponsored students enrolled in the universities decreasing by 2.9% to 124,585 students in FY’2023/24 from 124,585 in FY’2022/2023. This translates to a 22.1% sponsorship rate in FY’2022/2023 compared to 22.8% in FY’2021/2022. The graph below shows the number of university enrollments and government-sponsored students in the last 5 years:
Source: KNBS Economic Survey
This highlights the importance of guardians looking for alternate ways to support education expenses. Financial services firms have seized the chance to solve these challenges by developing products (Education Investment Plans) to assist parents in saving and investing for their children's education. Education Investment Plans are medium to long-term savings and investment plans promoted by a financial institution, such as an insurance company or an asset manager. In terms of structure, Education Investment Plans are clearly distinguished by the fact that they frequently have an investment lock-in period during which the guardian is expected to make periodic contributions. These funds then gain interest and help the contributor attain their financial goals. The beneficiary of the funds could be a dependent or one may save for their own education.
Section II: Understanding the concept of Savings and Investment
Savings and investments are essential components of any financial strategy. Saving entails consuming less of a given amount of resources in the present in order to consume more in the future by setting aside a portion of your income in some form of an asset. This may involve opening a savings account with a financial institution such as a bank or a Sacco and making regular contributions to the account until you attain the desired amount. Investments, on the other hand, involve the purchase of an asset with the hope of generating some income in the future or the asset appreciating, hence being able to sell it at a profit. Saving is often confused with investing, but they are not the same. Saving focuses on capital preservation, whereas investing focuses on capital appreciation as well as wealth generation. The decision to invest or save depends on various factors, such as:
- Time horizon – Savings are convenient to access when needed and are typically appropriate for short-term objectives. It involves creating an emergency fund to cover unforeseen costs such as medical expenses and car repairs Compared to savings, investments have less liquidity as one has to wait longer to access the funds. Usually preferred for medium to long-term goals such as saving for retirement and Education planning,
- Risk tolerance – Savings are low-risk as the funds are not invested anywhere, minimizing the possibility of a decrease in the total amount. They are usually suitable for risk-averse individuals. However, investments involve risks, and there is no guarantee of the safety of the invested amounts due to day-to-day market changes,
- Returns – Investments have a higher potential for higher returns as compared to savings accounts, as money is used to purchase an asset to generate a return, while savings remain as they are and therefore do not generate any income
The decision to save or invest should correlate with one’s financial situation so as to meet the intended financial goals. Ultimately, combining both saving and investing enables one to reap the benefits of capital preservation while at the same time creating wealth. This is especially beneficial for Education investment plans so as to enable the guardian to meet the intended future education expense.
Section III: Importance of Education Investment plan
To achieve Education financial goals, Educations Investments Plans are one of the avenues that can be used. Education investment plans have a number of benefits such as:
- Financial Freedom – An education investment plan ensures that the guardian has the needed funds to cater for the future education needs when the needs arrives and still be able to meet the other budgeted expenses as planned, without having to dip into other funds to settle the education expenses. Additionally, with education investment plans, you are able to spread the expected education cost over a period of time, thereby reducing significant pressure on your pocket when the need arises
- Avoid debts – An education investment plan enables one to avoid future loans that their children or dependents will have to pay as they start working such as Higher Education Loans Board (HELB) loans. Upon reaching university, the student will not find himself or herself in a situation where they have to take loans for their studies, as the education investment plan would cater of that. This avails more cash to the students when they start working as the monthly HELB loan repayment amount may be saved or even invested
- Serves as a Contingency Measure – With the tough economic times affecting business or job security not assured, a parent can rest assured that they will be able to provide for their dependent’s education should their source of income be affected, and
- Peace of Mind – Having an Education investment plan relieves situations such as overlapping of expenses and financial stress in the event of unexpected expenses, thereby bringing about peace of mind.
- Tax Benefit - Education Investment plans are entitled to a tax relief of 15.0% of the premium, subject to a maximum tax relief of Kshs 5,000.0 per month or Kshs 60,000.0 per year, provided that the time horizon of the plan is more than 10 years.
Section IV: Key considerations when choosing an Education Investment Plan
A guardian or parent has to choose an education plan that can provide safety, preservation, and growth, as well as fit into their overall investment objectives. The following are key factors to consider:
- The financial profile of the Investor - This refers to the different and unique characteristics each investor has. Before making any financial decisions, one should consider their age because it has an impact on their risk tolerance as well as the time horizon they are ready to commit to an investment. A young couple with a young child can choose to invest in a longer education plan, while an older couple with more mature children does not have the need for saving for such a long time. A longer tenor also affords the younger couple the opportunity to have a more aggressive portfolio as they have more time to recover from any losses. It is also key for guardians to profile themselves based on the financial goals they hope to achieve with the investment plan. If they want to invest for a short period they should consider other investment vehicles, whereas if they would like a longer-term investment then education investment plans are the best option for them,
- Inflation - The value of money now is higher than a similar amount in the future due to the effect of inflation. To ensure that you preserve the strength of your education savings, it is important that you save in a plan that offers above-inflation interest rates. Inflation refers to the continuous rise in the prices of commodities and services. This means that if you were saving for university fees, say Kshs 1.0 mn, then the fees in 10 years would be higher for the same service. It is recommended to have a financial goal higher than the current market conditions. Guardians should also save their money with an issuer that offers interest rates significantly higher than inflation rates to cushion inflationary effects,
- Affordability – One should buy into a plan that they can comfortably afford so as to make sure they meet the premium payment schedule as agreed. Some plans usually penalize you for delayed or late submission of premiums, and the penalties will eat into your final payout. Sometimes the inability to meet premiums might see you abandon the plan half-way, leading to the guardian not achieving the intended goal of the education investment plan,
- Additional Benefits with the plan - Most education plans have additional benefits such as life insurance, which is sometimes subject to payment of an additional premium. Life insurance serves to provide financial protection to the beneficiary in the unfortunate event that the guardian passes on. The guardian may also choose to have the education plan and the life insurance separately insured with different firms,
- Lock in period – Educations plans usually have a minimum lock-in period, which is the minimum time period for which the contributions cannot be withdrawn by the guardian after joining the education plan. At times, withdrawing before the lock-in period is over comes with some consequences, such as losing the interest earned during the period and the contributions being subjected to a redemption fee, resulting in the guardian receiving less than the aggregate amount. In case the guardian's investment time horizon is shorter than the lock-in period, the guardian should look for an education plan that is suitable for his or her needs,
- Mode of Payout – The mode of payout from Education investment plans differs from one issuer to another. There are education plans that give out the total amount contributed plus interest as a lump sum, while other plans make a number of partial payments during the tenure of the plan,
- The Issuer of the Plan - When seeking an Education plan provider, it is important for one to do their due diligence on the plan provider. Education plans are often long-term investments that are hard to get out of; therefore, one should think about whether to buy an insurance-based product or an investment manager-based product. An important practice is to consult individuals who have already bought such plans and get to hear their experiences, as well as seek the advice of qualified financial advisors who are familiar with the product.
Section v: Education Investments Plans in Kenya
Education Investment Plans have a relatively longer lock-in period, which helps promote investor discipline. Ideally, an investment plan that caters to a long-term goal should have low liquidity. In Kenya, most market players have set the minimum tenor at 5 years. This serves the logic that most parents and guardians save for secondary and university education, and they often start saving early on. The plans require a minimum monthly investment amount ranging from Kshs 1,000.0 to Kshs 6,000.0. However, the payments are flexible in that one may pay monthly, quarterly, semiannually, or annually. Other key features of Education plans include:
- Riders – This entails additional benefits that Education investment plans offer. They are compulsory or optional, depending on the issuer. In most cases, Education investment plans have life cover as an added benefit to protect the beneficiaries from unforeseen events such as death, permanent disability, or critical illness. Other riders include job loss cover and accidents cover,
- Minimum sum assured – This is the minimum amount to be paid to the beneficiary in the unfortunate event of the death or permanent disability of the guardian, in case it occurs before the maturity of the Education investment plan
- Surrender value – This is the total amount that can be withdrawn when the guardian withdraws from the Education investment plan before maturity. It is usually the total amount contributed less the redemption fees and penalties
- Paid-up option – This refers to the option of having the education plan run to maturity without having to make any additional premium during the tenor of the plan. However, for the guardian to enjoy this benefit, they must have contributed a minimum amount set by the issuer as stipulated in the policy document, thereby protecting the beneficiary from losing out on some of the benefits of the plan
- Tax relief – Education plans are entitled to a tax relief of 15.0% of the premium, subject to a maximum tax relief of Kshs 5,000.0 per month or Kshs 60,000.0 per year. However, for the guardian to enjoy this benefits, the contributions to the Education investment plan have to be done through salary deduction.
- Bonuses – These are periodic payments made by the issuer to the policyholder during the tenor of the plan and constitute a portion of the sum assured and the accrued interest.
- Grace period – This is the time period that the education plan can run in case of delayed remittance of contributions by the policy holder, without having the policy holder penalized
Below is a list of some of the existing education plans in Kenya
|
Cytonn Report: Select Education Plans in Kenya |
|||
|
Education Plan |
Investment Period |
Minimum Investment amount |
Other Features |
|
CIC Academia Policy |
5 -14 Years (premium payment term) 9-18 years (policy term) |
Kshs 2,500 |
On the unfortunate death of the policy holder, the beneficiary receives 50.0% of the sum assured together with all accrued bonuses. The remaining 50.0% is paid up upon maturity. |
|
The policy can be surrendered after 3 years |
|||
|
The benefits are paid out after the completion of the premium payment and maturity of the policy, in 4 installments of 15.0% of the sum assured spread out in a time period of 4 years. Upon maturity 45% of sum assured is paid |
|||
|
Britam Boresha Elimiu |
6-18 years |
Kshs 1,500 |
Guarantees a total cash payout of 200% of the sum assured |
|
The payouts are made in the last 2 years before the policy matures |
|||
|
Waiver of future premiums in the event of guardians death |
|||
|
Liberty Scholar plan |
10-20 years |
Kshs 1,600 |
Cash payments in the last 5 years before the policy matures spread out in 4 installments of 14.0% of the sum assured and upon maturity 50.0% of the sum assured Is paid |
|
Policy bonuses at each policy anniversary |
|||
|
Death benefits are 100.0% of the sum assured plus accumulated bonuses |
|||
|
Waiver of future premiums in the event of guardians death |
|||
|
Life cover and accident benefits |
|||
|
Madison Bima ya Karo |
10-21 years |
Kshs 3,100 |
Cash payments are made during the last 5 years before the policy matures |
|
Life cover constitute of death benefit (50.0% of sum assured), Critical Illness ( 25.0% of the sum assured) and last expense ( Adult - 100,000, Children - 50,000) |
|||
|
Standard Chartered Education plus |
10 years |
Depends on the Age of the Policy holder(5,000 - 6,000) |
Premium amount is based on age |
|
Minimum Sum assured is Kshs 2 mn |
|||
|
Maturity benefits paid out from year 6 to Year 9. |
|||
|
Life cover constitute of death benefit (Kshs 2 mn), Critical Illness ( Kshs 1 mn) |
|||
|
APA elimu |
5-20 years |
Depends on the Age of the Policy holder with Mininum sum assured of Kshs 3 mn |
The policy can be surrendered after 3 years |
|
Waiver of future premiums in the event of guardians death |
|||
|
Life cover constitute of death benefit (100.0% of sum assured) and Critical Illness ( 30.0% of the sum assured) |
|||
|
ICEA Lion Usomi Bora |
8-18 years |
Kshs 2,100 |
Waiver of future premiums in the event of guardians death |
|
Life cover constitute of death benefit (100.0% of sum assured) and Critical Illness ( 100.0% of the sum assured) |
|||
|
The policy can be surrendered after 3 years |
|||
|
The benefits are paid out after the completion of the premium payment and maturity of the policy, in 4 installments of 25.0% of the sum assured spread out in a time period of 4 years. |
|||
|
Cytonn Education Investment Plan (CEIP) |
3-20 years |
Kshs 1,000 |
Minimum investment and top up of Kshs 1,000 |
|
Contributions can be done monthly, quarterly, half yearly and yearly depending on guardians decision |
|||
From the above table, the below are the key take-outs:
- Insurance companies all provide life insurance together with their education policies. The sum assured in this case refers to the amount that is paid out to a client’s next of kin should they die. This amount varies with the monthly contribution amount and the tenor of investment. These insurance companies incorporate life insurance premiums into the monthly payments in order to avoid clients making two separate payments,
- Insurance Companies however, offer less returns than education products by investment managers. This is mainly because education policies in insurance companies are taken as more of a savings plan rather than an investment plan,
- The minimum investment amounts vary from Kshs 1,500 to Kshs 5,000
Section VI: Limitations of Education Investment Plans Uptake
Education Investment plans continue to face a number of challenges which has continue to hamper the growth of these products. Some of these challenges include:
- Low returns – Most Education investment plans in Kenya offer low returns, with some giving out zero returns for the time period the plan was active. This makes other investments options in the market to look more attractive given that they are offering not just high returns but returns that are above the inflation rate thereby preserving the value of the amounts saved,
- Bad Publicity – There have been a number of cases of people receiving less than they had contributed to the Education investment plans and this has created the perception of Education plans being an unsafe way to save, especially given the fact that they are long-term investments. For example, some Education plans have penalties for early withdrawals which reduces the total payouts, and,
- Complexity of Education Plans – Education Investment plans have a complex structure which make it difficult for people to understand. For example, calculating premium and the total cash payout is a complex process since a lot of factors are considered such as the age of the parent. The lack of understanding of the plans, coupled with the negative publicity have made people to view them as scams and therefore shy away for them.
Section VII: Alternative to Education Investment plans
In addition to the Education Investment Plans discussed above, there are various investments avenues whereby individuals can take advantage of when financially planning for education. They include:
- Collective Investment Schemes (CIS) – These are schemes that pool money from multiple investors and are managed by professional fund managers. The Fund managers invest the pooled funds with a view to paying a return in accordance with the investment objectives that have been established for the scheme. An example of CIS:
- Money market funds: These are CIS that invest in short-term debt securities with high credit quality such as bank deposits, treasury bills, and commercial paper. They are best suited for investors who require a low-risk investment that offers capital stability, liquidity, and a high income yield.
- Savings Account - These are deposit accounts offered by banking and non-banking institutions. They are preferably used for short term time horizon as their interest rate are low.
To illustrate the different returns one would get under various alternatives, we assumed a person who starts with a Kshs 10,000.0 initial investment and makes monthly top-ups of Kshs 5,000 saves in a money market fund, an insurance firm, and a bank savings account. Below are the amounts at maturity they would get:
|
Cytonn Report: Analysis of Education Investment Plans |
|||
|
|
Money Market Fund |
Insurance companies |
Bank Savings |
|
Initial Amount (Kshs) |
10,000 |
10,000 |
10,000 |
|
Monthly Top-ups (Kshs) |
5,000 |
5,000 |
5,000 |
|
Tenor (Years) |
10 |
10 |
10 |
|
Average Rate of Return |
12.0% |
7.9% |
3.6% |
|
Amount after Maturity (Kshs) |
1,108,831 |
876,056 |
683,852 |
|
Source: Money Market Fund Interest rates – Effective annual rate of the Top 5 Money market Funds i.e Cytonn, Etica, Enwealth, Madison and GenAfrica Money Market Funds as published on 21st July 2023 |
|||
|
Insurance Companies – Average Rates of CIC, Britam , Liberty and ICEA lion |
|||
|
Bank Savings Rate – Central Bank of Kenya |
|||
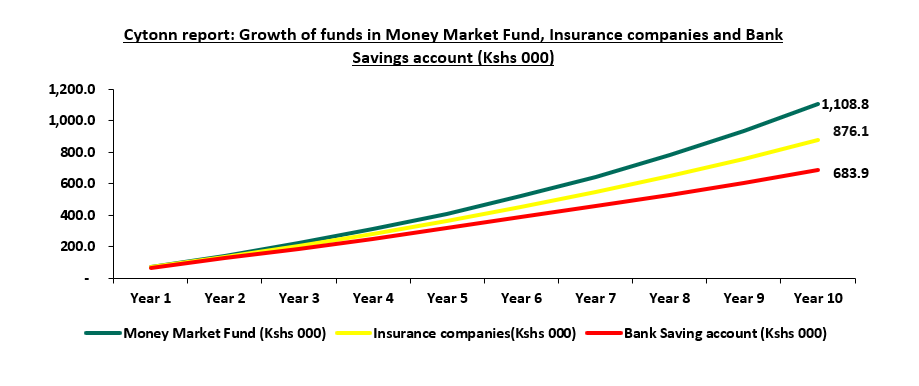
Evidently, the returns from saving in a money market fund are the highest. At the end of 10 years, saving in a money market fund will give returns of Kshs 1,108,831 compared to Kshs 876,056 and Kshs 683,852 when saving in an insurance education policy and in a bank savings account, respectively.
Section VIII: Conclusion
Education Investment Plans play a crucial role in enabling parents to plan for their children’s future. However, in order to increase the uptake of education plans, issuers should:
- Increase the returns – Issuers, especially insurance companies, have focused a lot on the insurance component and failed to work on the investment components, which has led people to receive little or zero return from their long-term investments. Due to the high rates of inflation, issuers must actively strike a balance between the insurance and investment components in order to safeguard the value of the sum assured.
- Simplification of the product – Parents and guardians should be able to at least have a rough estimate of the total premium and payout that will be done by the company. That way, the cases of insurance companies not meeting their obligations are addressed at the root of the problem
It is essential that before making any investment decision consult a financial advisor is in order to better understand what you are getting into, before signing any binding agreement. Different Savings plans have their understand advantages and disadvantages and therefore it is important to choose a product that matches your needs and goals. A guardian may decide to invest in both money market funds and an Education plan so as to ensure that their contributions are earning returns and to protect their beneficiaries from unforeseen future occurrences such as death, permanent disability, critical illness, and even retrenchment. This will ensure that the child’s future is well protected irrespective of any situation that may occur in the future
Disclaimer: The views expressed in this publication are those of the writers where particulars are not warranted. This publication, which is in compliance with Section 2 of the Capital Markets Authority Act Cap 485A, is meant for general information only and is not a warranty, representation, advice or solicitation of any nature. Readers are advised in all circumstances to seek the advice of a registered investment advisor.

