Effects of Elections on Investments Environment in Kenya, & Cytonn Weekly #21.2022
By Cytonn Research, May 29, 2022
Executive Summary
Fixed Income
During the week, T-bills were undersubscribed, with the overall subscription rate coming in at 54.4%, down from 116.3% recorded the previous week, partly attributable to the tightened liquidity in the money market with the average interbank rates rising to 4.6%, from the 4.4% recorded the previous week. The 364-day paper recorded the highest subscription rate, receiving bids worth Kshs 9.7 bn against the offered Kshs 10.0 bn, translating to a subscription rate of 97.2%, a decrease from the 121.9% recorded the previous week. The subscription rate for the 182-day and 91-day papers decreased to 28.5% and 12.4%, from 102.5% and 136.9%, respectively, recorded the previous week. The yields on the government papers recorded mixed performance, with the yields on the 364-day and 182-day papers increasing by 0.2 bps and 6.9 bps to 8.9% and 9.9%, respectively while the yields on the 91-day paper declined by 1.4 bps to 7.7%. In the Primary Bond Market, the government issued a new 18-year Infrastructure bond, IFB1/2022/18, whose period of sale runs from 23rd May 2022 to 7th June 2022. Key to note, the bond’s coupon rate will be market determined;
We are projecting the y/y inflation rate for May 2022 to fall within the range of 6.7%-7.1% with the key drivers being increasing food and fuel prices;
Equities
During the week, the equities market recorded a mixed performance, with NSE 20 gaining by 0.4%, while NASI and NSE 25 declined by 2.0% and 0.7% respectively. This week’s performance took the indices’ YTD performance to losses of 22.3%, 18.4% and 11.8% for NASI, NSE 25 and NSE 20 respectively. The equities market performance was driven by losses recorded by large cap stocks such as Safaricom, Bamburi, Equity Group and EABL which declined by 4.9%, 2.8%, 1.6% and 1.2%, respectively. The losses were however mitigated by gains recorded by banking stocks such as KCB of 7.6%, Co-operative Bank and ABSA of 3.0% each, while NCBA gained by 2.3%.
During the week, Co-operative Bank, KCB Group, I&M Group Holdings, ABSA Bank Kenya Plc and Diamond Trust Bank Kenya released their Q1’2022 financial results, indicating an increase in Earnings per share of 68.9%, 54.6%, 43.6%, 22.1% and 8.5%, respectively;
Real Estate
During the week the Central Bank of Kenya (CBK), released the Bank Supervision Annual Report 2021, highlighting that residential mortgage market recorded a 0.9% decline in the number of mortgage loans accounts in the market, to 26,723 in December 2021 from 26,971 in December 2020. In the mixed-use developments sector, Heri Homes, a Kenyan property developer, in partnership with Finsco Africa, a Real Estate consultancy firm, announced plans to construct 384 affordable apartments in Ruiru Town, as part of its 200- acre mixed-use development project dubbed Legacy Ridges. Additionally, Purple Dot International Limited, launched construction of a Kshs 2.5 bn mixed-use commercial project along Mombasa Road dubbed Purple Tower. In the industrial sector, Botswana’s listed real estate firm Letlole La Rona Limited (LLR) signed a deal with Mauritius-based Grit Real Estate Income Group, to buy a 30.0% stake, in Orbit Products Africa’s manufacturing facilities in Mlolongo, at an initial cost of Kshs 842.0 mn. In Listed Real Estate the ILAM Fahari I-REIT closed the week trading at an average price of 5.3 per share. This represented a 3.6% and 17.2% Week-to-Date (WTD) and Year-to-Date (YTD) decline respectively, from Kshs 5.5 per share and Kshs 6.4 per share, respectively;
Focus of the Week
Historically, election cycles have driven increased market volatility which has seen households and enterprises adopt a precautionary behaviour with regards to investments. As such, more people deposit their money as either savings, time or demand deposits as they seek safer havens for their funds. This leads to increased deposits in the local banks and increased selloffs as both local and foreign investors offload their equities investments a short period before the elections. Similarly, the business environment is characterized by increased uncertainty leading to a wait and see approach by investors in the quoted equities market and foreign direct investments. This week we look at the effects of elections on the investment and real estate environment in Kenya in the past and our expectations this year ahead of the upcoming 9th August 2022 general elections.
Investment Updates:
- Weekly Rates:
- Cytonn Money Market Fund closed the week at a yield of 10.54%. To invest, dial *809# or download the Cytonn App from the Google Play Store or Apple App Store;
- Cytonn High Yield Fund closed the week at a yield of 14.13% p.a. To invest, email us at sales@cytonn.com and to withdraw the interest, dial *809# or download the Cytonn App from Google Play Store or Apple App Store;
- On our weekly Twitter Spaces session, we had a discussion on the Draft Public Offers, Listing and Disclosures Regulations. The panel included Elizabeth Nkukuu, Founder – Liz Consulting, Doreen Onwong’a, Partner - KN Law and was moderated by Edwin H. Dande – CEO, Cytonn Investments. Listen to the conversation here,
- We continue to offer Wealth Management Training every Thursday and every third Saturday of the month, from 9:00 am to 11:00 am, through our Cytonn Foundation. The training aims to grow financial literacy among the general public. To register for any of our Wealth Management Trainings, click here;
- If interested in our Private Wealth Management Training for your employees or investment group, please get in touch with us through wmt@cytonn.com;
- Any CHYS and CPN investors still looking to convert through assignment of debt are welcome to consider one of the five projects currently available for assignment, click here for the latest term sheet;
- Cytonn Insurance Agency acts as an intermediary for those looking to secure their assets and loved ones’ future through insurance namely; Motor, Medical, Life, Property, WIBA, Credit and Fire and Burglary insurance covers. For assistance, get in touch with us through insuranceagency@cytonn.com;
- Cytonnaire Savings and Credit Co-operative Society Limited (SACCO) provides a savings and investments avenue to help you in your financial planning journey. To enjoy competitive investment returns, kindly get in touch with us through clientservices@cytonn.com;
Real Estate Updates:
- For an exclusive tour of Cytonn’s Real Estate developments, visit: Sharp Investor's Tour, and for more information, email us at sales@cytonn.com;
- Phase 3 of The Alma is now ready for occupation. To rent please email properties@cytonn.com;
- We expect to go back to site in June to complete Phase 4 of the Alma
- We have 8 investment-ready projects, offering attractive development and buyer targeted returns; See further details here: Summary of Investment-ready Projects;
- For recent news about the group, see our news section here;
Hospitality Updates:
We currently have promotions for Staycations. Visit cysuites.com/offers for details or email us at sales@cysuites.com;
Money Markets, T-Bills & T-Bonds Primary Auction:
During the week, T-bills were undersubscribed, with the overall subscription rate coming in at 54.4%, down from 116.3% recorded the previous week, partly attributable to the tightened liquidity in the money market with the average interbank rates rising to 4.6%, from the 4.4% recorded the previous week. The 364-day paper recorded the highest subscription rate, receiving bids worth Kshs 9.7 bn against the offered Kshs 10.0 bn, translating to a subscription rate of 97.2%, a decrease from the 121.9% recorded the previous week. The subscription rate for the 182-day and 91-day papers decreased to 28.5% and 12.4%, from 102.5% and 136.9%, respectively, recorded the previous week. The yields on the government papers recorded mixed performance, with the yields on the 364-day and 182-day papers increasing by 0.2 bps and 6.9 bps to 8.9% and 9.9%, respectively while the yields on the 91-day paper declined by 1.4 bps to 7.7%. The government continued to reject expensive bids accepting only Kshs 12.5 bn worth of bids out of Kshs 13.1 bn received, translating to an acceptance rate of 95.8%.
During the week, the government issued a new 18-year infrastructure bond, IFB1/2022/18 with a tenor of 18 years in a bid to raise Kshs 75.0 bn for funding Infrastructure projects. The period of sale runs from 23rd May 2022 to 7th June 2022. Key to note, the bond’s coupon rate will be market-determined. We anticipate an oversubscription and a higher acceptance rate given the relatively ample liquidity in the money market coupled with the attractive tax-free nature of the bond and expected high coupon rate. Our recommended bidding range for the bond is 12.8%-13.2% within which bonds of a similar tenor are trading.
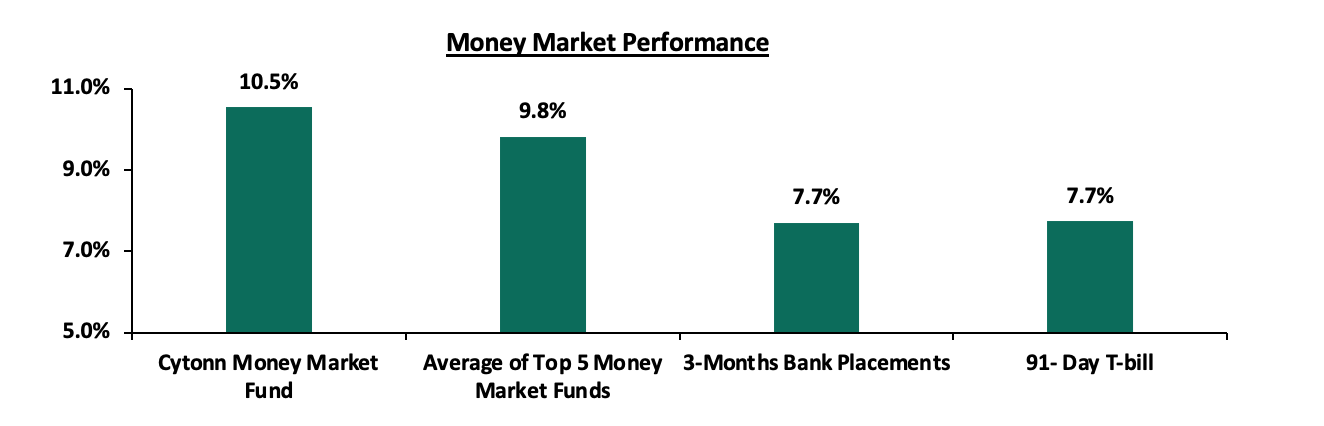
In the money markets, 3-month bank placements ended the week at 7.7% (based on what we have been offered by various banks), while the yield on the 91-day T-bill declined by 1.4 bps to 7.7%. The average yield of the Top 5 Money Market Funds and the yield on the Cytonn Money Market Fund remained relatively unchanged at 9.8% and 10.5%, respectively as recorded the previous week.
The table below shows the Money Market Fund Yields for Kenyan Fund Managers as published on 27th May 2022:
|
Money Market Fund Yield for Fund Managers as published on 27th May 2022 |
||
|
Rank |
Fund Manager |
Effective Annual Rate |
|
1 |
Cytonn Money Market Fund |
10.5% |
|
2 |
Zimele Money Market Fund |
9.9% |
|
3 |
Nabo Africa Money Market Fund |
9.8% |
|
4 |
Apollo Money Market Fund |
9.4% |
|
5 |
Madison Money Market Fund |
9.4% |
|
6 |
Sanlam Money Market Fund |
9.4% |
|
7 |
CIC Money Market Fund |
9.0% |
|
8 |
Dry Associates Money Market Fund |
8.9% |
|
9 |
Co-op Money Market Fund |
8.8% |
|
10 |
ICEA Lion Money Market Fund |
8.7% |
|
11 |
GenCap Hela Imara Money Market Fund |
8.7% |
|
12 |
Orient Kasha Money Market Fund |
8.5% |
|
13 |
NCBA Money Market Fund |
8.4% |
|
14 |
AA Kenya Shillings Fund |
7.9% |
|
15 |
Old Mutual Money Market Fund |
7.7% |
|
16 |
British-American Money Market Fund |
7.4% |
Source: Business Daily
Liquidity:
During the week, liquidity in the money markets tightened, with the average interbank rate rising to 4.6% from 4.4% recorded the previous week, partly attributable to tax remittances which offset government payments. The average interbank volumes traded decreased by 21.2% to Kshs 14.4 bn from Kshs 18.3 bn recorded the previous week.
Kenya Eurobonds:
During the week, the yields on Eurobonds were on a downward trajectory, an indication of easing risk concerns over the economy by investors despite the prevailing risks surrounding the rising inflation and the upcoming elections. The yields on the 10-year Eurobonds issued in 2014 and 2018 declined by 1.8% and 1.1% points to 10.7% and 10.4%, from 12.5% and 11.5%, respectively, recorded the previous week. Similarly, the 7-year and 12-year Eurobonds issued in 2019 declined by 2.1% points and 1.4% points to 10.5% and 10.3%, from 12.6% and 11.7%, respectively. The 30-year Eurobond issued in 2018, and the 12-year Eurobond issued in 2021 declined by 1.0% and 1.2% points to 11.0% and 9.7% from 12.0% and 10.9% respectively.
|
Kenya Eurobond Performance |
||||||
|
|
2014 |
2018 |
2019 |
2021 |
||
|
Date |
10-year issue |
10-year issue |
30-year issue |
7-year issue |
12-year issue |
12-year issue |
|
03-Jan-22 |
4.4% |
8.1% |
8.1% |
5.6% |
6.7% |
6.6% |
|
02-May-22 |
8.8% |
10.0% |
11.1% |
10.5% |
10.8% |
10.3% |
|
20-May-22 |
12.5% |
11.5% |
12.0% |
12.6% |
11.7% |
10.9% |
|
23-May-22 |
12.1% |
11.4% |
11.9% |
12.2% |
11.5% |
10.6% |
|
24-May-22 |
12.1% |
11.2% |
11.6% |
11.8% |
11.3% |
10.6% |
|
25-May-22 |
11.7% |
11.0% |
11.4% |
11.3% |
11.2% |
10.2% |
|
26-May-22 |
10.7% |
10.4% |
11.0% |
10.5% |
10.3% |
9.7% |
|
Weekly Change |
(1.8%) |
(1.1%) |
(1.0%) |
(2.1%) |
(1.4%) |
(1.2%) |
|
MTD Change |
1.9% |
0.4% |
(0.1%) |
0.0% |
(0.5%) |
(0.6%) |
|
YTD Change |
6.3% |
2.3% |
2.9% |
4.9% |
3.6% |
3.1% |
Source: Central Bank of Kenya (CBK)
Kenya Shilling:
During the week, the Kenyan shilling depreciated by 0.2% against the US dollar to close the week at Kshs 116.7, from Kshs 116.4 recorded the previous week, partly attributable to increased dollar demand from the oil and energy sectors. Key to note, this is the lowest the Kenyan shilling has ever depreciated against the dollar. On a year to date basis, the shilling has depreciated by 3.1% against the dollar, in comparison to the 3.6% depreciation recorded in 2021. We expect the shilling to remain under pressure in 2022 as a result of:
- Rising global crude oil prices on the back of supply constraints and geopolitical pressures at a time when demand is picking up with the easing of COVID-19 restrictions and as economies reopen. Key to note, risks abound the recovery following the emergence of the new COVID-19 variants,
- Increased demand from merchandise traders as they beef up their hard currency positions in anticipation for more trading partners reopening their economies globally,
- An ever-present current account deficit due to an imbalance between imports and exports, with Kenya’s current account deficit estimated to come in at 5.1% of GDP in the 12 months to April 2022 compared to the 4.8% for a similar period in 2021. The wider deficit reflects a higher import bill, particularly for oil, which more than offset increased receipts from agricultural and services exports, and remittances, and,
- The aggressively growing government debt, with Kenya’s public debt having increased at a 10-year CAGR of 18.6% to Kshs 8.2 tn in December 2021, from Kshs 1.5 tn in December 2011 thus putting pressure on forex reserves to service some of the public debt. It is worth noting that the average GDP growth over the same period has been 3.9%, an indicator that the increase in debt is not translating into GDP growth.
The shilling is however expected to be supported by:
- High Forex reserves currently at USD 8.2 bn (equivalent to 4.9-months of import cover), which is above the statutory requirement of maintaining at least 4.0-months of import cover, and the EAC region’s convergence criteria of 4.5-months of import cover. In addition, the reserves were boosted by the USD 750.0 mn World Bank loan facility received in March 2022 and are expected to be boosted further by the expected USD 244.0 mn from the International Monetary Fund (IMF), and,
- Improving diaspora remittances evidenced by an 18.6% y/y increase to USD 355.0 mn as of April 2022, from USD 299.3 mn recorded over the same period in 2021which has continued to cushion the shilling against further depreciation. In the recently released April 2022 diaspora remittances figures, North America remained the largest source of remittances to Kenya accounting for 61.7% in the period, followed by Europe at 17.2% while the rest of the world accounted for 21.1% of the total.
Weekly Highlight:
May 2022 inflation projections
We are projecting the y/y inflation rate for May 2022 to fall within the range of 6.7%-7.1%. The key drivers include:
- Increasing fuel prices - Fuel prices for the period 15th May 2022 to 14th June 2022 increased by 3.8% to Kshs 150.1 per litre for Super Petrol, 4.4% to Kshs 131.0 per litre for Diesel and 4.9% to Kshs 118.9 per litre for Kerosene. With fuel being a major contributor to Kenya's headline inflation, we expect the increasing fuel prices to continue to exerting upward pressure on the inflation basket,
- Increasing food prices - This was evidenced by the 12.2% y/y increase in the prices food & non-alcoholic beverages as of April 2022 due to increased costs of production. Food prices increased by 3.0% m/m from March 2022 mainly due to increases in the prices of potatoes, fresh milk and wheat flour among other food items occasioned by adverse weather conditions in most parts of the country, and,
- The price of electricity which reduced by 15.7% in January 2022 marking the first phase of compliance with President Uhuru Kenyatta’s directive to cut the cost of electricity by 30.0% in order to reduce the cost of living. The reduction in electricity costs helped prices of goods remain stable during the month of April 2022 due to lower production costs.
Going forward, we expect the inflation rate to remain within the government’s set range of 2.5% - 7.5%. However, concerns remain high on the inflated import bill and widening trade deficit as global fuel prices continue to rise due to supply bottlenecks worsened by the geopolitical tensions arising from the Russia-Ukraine invasion. We expect increased inflationary pressure mainly due to the rising global fuel prices as fuel prices are a substantial input cost in the bulk of Kenya’s sectors such as manufacturing, transport and energy. Further, the erratic rainfall being witnessed in majority of the country is expected to continue driving food prices upwards, which will in turn continue to exert upward pressure on the inflation basket.
Key to note the Central Bank of Kenya’s Monetary Policy Committee (MPC) is set to meet on Monday, 30th May 2022, to review the outcome of its previous policy decisions and recent economic developments, and to decide on the direction of the Central Bank Rate (CBR). We anticipate the MPC taking a wait-and-see approach as it continues to monitor the country's economic conditions and maintain the Central Bank Rate
(CBR) at 7.00%. For a detailed analysis on this, please see our MPC Note here.
Rates in the Fixed Income market have remained stable due to the relatively ample liquidity in the money market. The government is 1.3% ahead of its prorated borrowing target of Kshs 612.9 bn having borrowed Kshs 620.8 bn of the Kshs 664.0 bn borrowing target for the FY’2021/2022. We expect a gradual economic recovery as evidenced by the revenue collections of Kshs 1.5 tn during the first ten months of the current fiscal year, which was equivalent to 102.0% of the prorated revenue collection target. However, despite the projected high budget deficit of 8.1% and the affirmation of the `B+’ rating with negative outlook by Fitch Ratings, we believe that the support from the IMF and World Bank will mean that the interest rate environment will remain stable since the government is not desperate for cash. Owing to this, our view is that investors should be biased towards short-term fixed-income securities to reduce duration risk.
Markets Performance
During the week, the equities market recorded a mixed performance, with NSE 20 gaining by 0.4%, while NASI and NSE 25 declined by 2.0% and 0.7% respectively. This week’s performance took the indices’ YTD performance to losses of 22.3%, 18.4% and 11.8% for NASI, NSE 25 and NSE 20 respectively. The equities market performance was driven by losses recorded by large cap stocks such as Safaricom, Bamburi, Equity Group and EABL which declined by 4.9%, 2.8%, 1.6% and 1.2%, respectively. The losses were however mitigated by gains recorded by banking stocks such as KCB of 7.6%, Co-operative Bank and ABSA of 3.0% each, while NCBA gained by 2.3%.
During the week, equities turnover increased by 157.3% to USD 36.3 mn, from USD 14.1 mn recorded the previous week, taking the YTD turnover to USD 378.3 mn. Foreign investors remained net sellers, with a net selling position of USD 14.2 mn, from a net selling position of USD 5.0 mn recorded the previous week, taking the YTD net selling position to USD 63.5 mn.
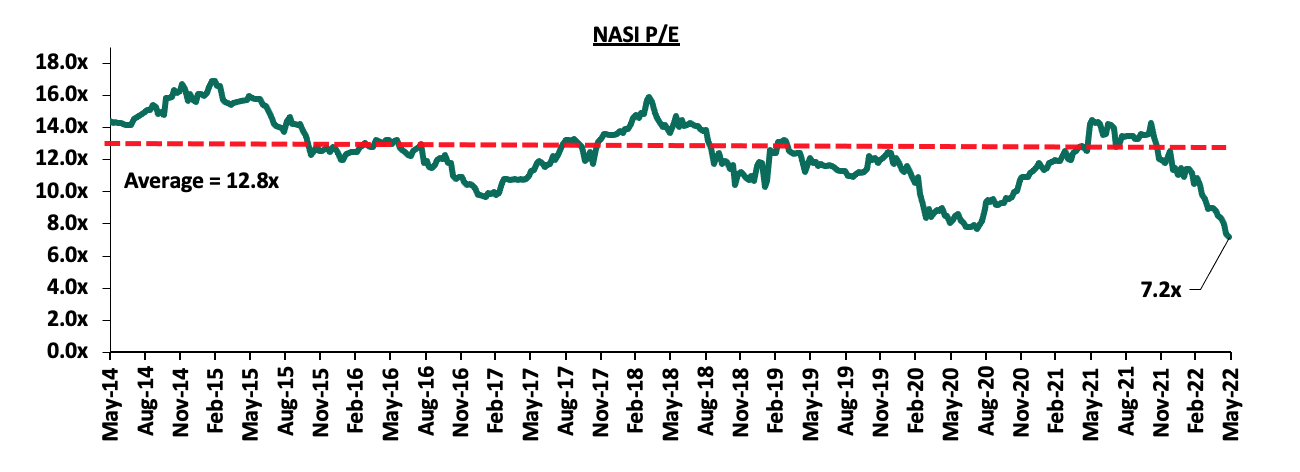
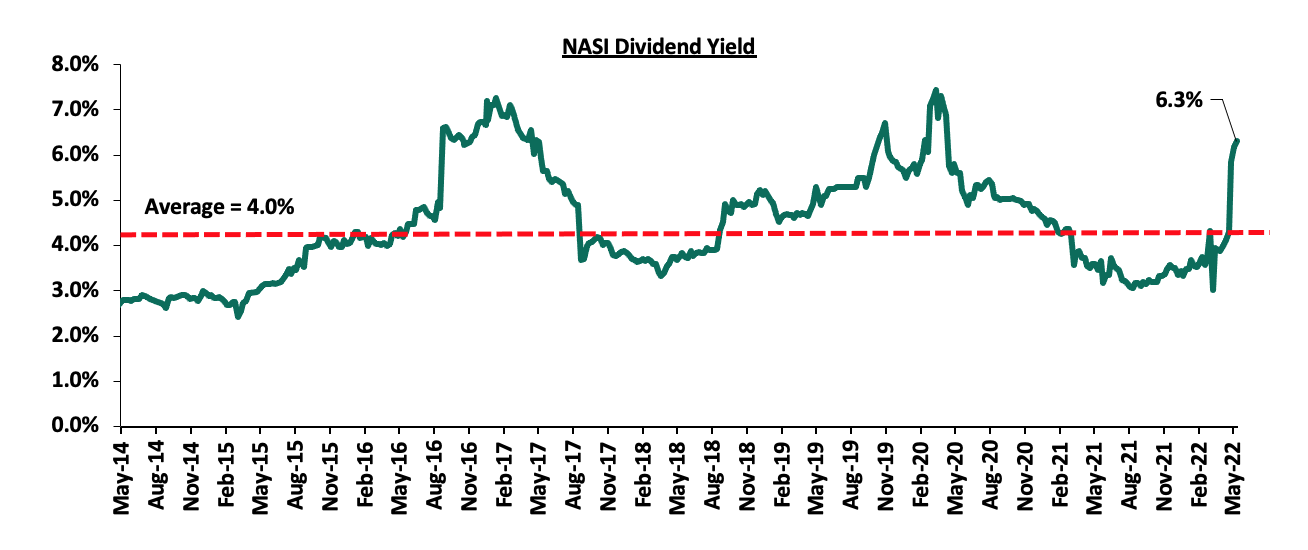
The market is currently trading at a price to earnings ratio (P/E) of 7.2x, 44.1% below the historical average of 12.8x, and a dividend yield of 6.3%, 2.3% points above the historical average of 4.0%. The rise in dividend yield is attributable to price declines recorded by most stocks due to increased foreign investor sell-offs as they exit perceived higher risk markets. Safaricom, which currently accounts for 53.3% of the total NASI market capitalization, has recorded a 30.7% share price decline, year to date. Additionally, the current P/E valuation of 7.2x is the lowest on record in the last thirteen years. Key to note, NASI’s PEG ratio currently stands at 0.9x, an indication that the market is undervalued relative to its future growth. A PEG ratio greater than 1.0x indicates the market may be overvalued while a PEG ratio less than 1.0x indicates that the market is undervalued. The charts below indicate the historical P/E and dividend yields of the market:
Weekly Highlight:
Earnings Release
During the week, the ABSA Bank of Kenya Plc, Co-operative Bank, KCB Group, I&M Holdings and Diamond Trust Bank- Kenya (DTB-K) released their Q1’2022 financial results. Below is a summary of their performance;
- ABSA Bank Kenya Plc
|
ABSA Bank Kenya Plc Q1’2022 Key Highlights |
|||||
|
Balance Sheet |
|||||
|
Balance Sheet Items |
Q1'2021 (Kshs bn) |
Q1'2022 (Kshs bn) |
y/y change |
||
|
Net Loans and Advances |
218.3 |
242.7 |
11.2% |
||
|
Government Securities |
126.7 |
136.7 |
7.9% |
||
|
Total Assets |
384.1 |
438.5 |
14.2% |
||
|
Customer Deposits |
257.1 |
269.5 |
4.8% |
||
|
Deposits per branch |
3.1 |
3.2 |
4.8% |
||
|
Total Liabilities |
335.4 |
379.3 |
13.1% |
||
|
Shareholders’ Funds |
48.7 |
59.2 |
21.6% |
||
|
Income Statement |
|||||
|
Income Statement Items |
Q1'2021 (Kshs bn) |
Q1'2022 (Kshs bn) |
y/y change |
||
|
Net Interest Income |
6.0 |
6.9 |
15.4% |
||
|
Net non-Interest Income |
2.9 |
3.0 |
5.8% |
||
|
Total Operating income |
8.8 |
9.9 |
12.3% |
||
|
Loan Loss provision |
(1.4) |
(1.2) |
(15.3%) |
||
|
Total Operating expenses |
(5.4) |
(5.6) |
3.6% |
||
|
Profit before tax |
3.4 |
4.3 |
26.1% |
||
|
Profit after tax |
2.4 |
3.0 |
22.1% |
||
|
Core EPS |
0.4 |
0.5 |
22.1% |
||
|
Key Ratios |
|||||
|
Income Statement Ratios |
Q1’2021 |
Q1’2022 |
% points y/y change |
||
|
Yield from interest-earning assets |
9.3% |
9.1% |
(0.2%) |
||
|
Cost of funding |
3.0% |
2.6% |
(0.4%) |
||
|
Net Interest Margin |
7.0% |
7.1% |
0.1% |
||
|
Net Interest Income as % of operating income |
67.7% |
69.5% |
1.8% |
||
|
Non-Funded Income as a % of operating income |
32.3% |
30.5% |
(1.8%) |
||
|
Cost to Income Ratio |
61.3% |
56.6% |
(4.7%) |
||
|
Cost to Income Ratio without LLP |
45.6% |
44.5% |
(10.9%) |
||
|
Cost to Assets |
1.0% |
1.0% |
- |
||
|
Capital Adequacy Ratios |
|||||
|
Ratios |
Q1'2021 |
Q1'2022 |
% Points Change |
||
|
Core Capital/Total Liabilities |
17.5% |
18.4% |
0.9% |
||
|
Minimum Statutory ratio |
8.0% |
8.0% |
- |
||
|
Excess |
9.5% |
10.4% |
0.9% |
||
|
Core Capital/Total Risk Weighted Assets |
14.4% |
14.5% |
0.1% |
||
|
Minimum Statutory ratio |
10.5% |
10.5% |
- |
||
|
Excess |
3.9% |
4.0% |
0.1% |
||
|
Total Capital/Total Risk Weighted Assets |
17.0% |
17.0% |
- |
||
|
Minimum Statutory ratio |
14.5% |
14.5% |
- |
||
|
Excess |
2.5% |
2.5% |
- |
||
Key take-outs from the earnings release include;
- Core earnings per share increased by 22.1% to Kshs 0.5 in Q1’2022, from Kshs 0.4 in Q1’2021, in line with our expectations of an 18.7% increase to Kshs 0.5. Total operating income increased by 12.3% to Kshs 9.9 bn, from Kshs 8.8 bn recorded in Q1’2021, while total operating expenses recorded a 3.6% increase to Kshs 5.6 bn, from Kshs 5.4 bn recorded in Q1’2021,
- Interest income grew by 15.6% to Kshs 8.8 bn in Q1’2022, from Kshs 7.6 bn in Q1’2021, mainly driven by a 14.1% increase in interest income from loans and advances to Kshs 6.3 bn, from Kshs 5.5 bn in Q1’2021, coupled with a 8.3% increase in interest income from Government securities to Kshs 2.2 bn, from Kshs 2.0 bn in Q1’2021,
- The Yield on Interest-Earning Assets (YIEA) however declined to 9.1%, from 9.3% recorded in Q1’2021, attributable to the faster 6.0% growth in average interest earning assets which outpaced the 5.7% growth in trailing interest income,
- Interest expenses increased by 16.2% to Kshs 1.9 bn, from Kshs 1.6 bn in Q1’2021, following a 55.7% increase in interest expenses from deposits and placements with banking institutions to Kshs 0.3 bn, from Kshs 0.2 bn in Q1’2021, coupled with a 12.3% increase in other interest expenses from customer deposits to Kshs 1.6 bn, from Kshs 1.4 bn in Q1’2021. However, other interest expenses declined by 18.1% by Kshs 27.9 mn from Kshs 33.9 mn in Q1’2021. The bank was able to mobilize cheaper deposits with the Cost of funds (COF) declining by 0.4% points to 2.6%, from 3.0% in Q1’2021, owing to the 8.6% decline in the trailing interest expense coupled with a 6.0% growth in average interest-bearing liabilities,
- Net Interest Margin (NIM) increased to 7.1% from 7.0% in Q1’2021, attributable to the faster 10.4% increase in trailing net interest income, which outpaced the 6.0% growth in interest earning assets,
- Total operating expenses increased by 3.6% to Kshs 5.6 bn in Q1’2022, from Kshs 5.0 bn in Q1’2021, mainly attributable to a 26.4% increase in other operating expenses to Kshs 2.2 bn from Kshs 1.7 bn in Q1’2021. On the other hand, Loan Loss Provisions (LLPs) declined by 15.3% to Kshs 1.2 bn, from Kshs 1.4 bn in Q1’2021, while staff costs declined by 2.0% to Kshs 2.26 bn from Kshs 2.30 bn in Q1’2021. The reduced provisioning level was due to declining credit risk on the back of increased business activity in Q1’2022 driven by the gradual economic recovery,
- The balance sheet recorded an expansion as total assets grew by 14.2% to Kshs 438.5 bn in Q1’2022, from Kshs 384.1 bn in Q1’2021. This growth was largely driven by an 11.2% growth in the loan book to Kshs 242.7 bn, from Kshs 218.3 bn in Q1’2021 coupled with a 7.9% increase in investments in government and other securities to Kshs 136.7 bn, from Kshs 126.7 bn in Q1’2021. Placements in other banks increased significantly by 129.9% to Kshs 6.5 bn, from Kshs 2.8 bn recorded in Q1’2021,
- Total liabilities rose by 13.1% to Kshs 379.3 bn, from Kshs 335.4 bn in Q1’2021, driven by a 4.8% increase in customer deposits to Kshs 269.5 bn, from Kshs 257.1 bn in Q1’2021. Placements by other banking institutions increased by 28.5% increase to Kshs 4.3 bn, from Kshs 6.0 bn in Q1’2021,
- Deposits per branch rose by 4.8% to Kshs 3.2 bn, from Kshs 3.1 bn in Q1’2021 with the number of branches remaining unchanged at 84,
- Gross Non-Performing Loans (NPLs) increased by 12.9% to Kshs 19.5 bn in Q1’2022, from Kshs 17.3 bn recorded in Q1’2021. Non-Performing loans continue to increase given that the bank lends to sectors like manufacturing which are yet to fully recover from the effects of the pandemic,
- Consequently, the NPL ratio rose to 7.6%, from 7.5% recorded in Q1’2021. The asset quality deterioration is attributable to the faster 12.9% growth in Gross Non-Performing Loans (NPLs), compared to the relatively slower 11.5% increase in gross loans,
- The NPL coverage increased to 76.2% in Q1’2022, from 73.4% in Q1’2021, owing to the faster 21.9% increase in General Loan Loss Provisions, which outpaced the 12.9% growth in Gross Non-Performing Loans (NPLs) during the same period, an indication of sufficient provisioning, and,
- ABSA Bank Kenya is currently sufficiently capitalized with a core capital to risk-weighted assets ratio of 14.5%, 4.0% points above the 10.5% statutory requirement. In addition, the total capital to risk-weighted assets ratio was 17.0%, exceeding the 14.5% statutory requirement by 2.5% points. Adjusting for IFRS 9, the core capital to risk-weighted assets stood at 14.6% while total capital to risk-weighted assets came in at 17.1%.
For a comprehensive analysis, please see our ABSA Bank Plc’s Q1’2022 Earnings Note
- Co-operative Bank of Kenya Plc
|
Co-operative Bank of Kenya Plc Q1’2022 Key Highlights |
|||||
|
Balance Sheet |
|||||
|
Balance Sheet Items |
Q1'2021 (Kshs bn) |
Q1'2022 (Kshs bn) |
y/y change |
||
|
Net Loans and Advances |
298.2 |
324.5 |
8.8% |
||
|
Government Securities |
166.2 |
183.4 |
10.4% |
||
|
Total Assets |
552.9 |
597.0 |
8.0% |
||
|
Customer Deposits |
393.8 |
410.8 |
4.3% |
||
|
Deposits per branch |
2.2 |
2.3 |
3.7% |
||
|
Total Liabilities |
335.4 |
379.3 |
13.1% |
||
|
Shareholders’ Funds |
48.7 |
59.2 |
21.6% |
||
|
Income Statement |
|||||
|
Income Statement Items |
Q1'2021 (Kshs bn) |
Q1'2022 (Kshs bn) |
y/y change |
||
|
Net Interest Income |
6.0 |
6.9 |
15.4% |
||
|
Net non-Interest Income |
2.9 |
3.0 |
5.8% |
||
|
Total Operating income |
8.8 |
9.9 |
12.3% |
||
|
Loan Loss provision |
(1.4) |
(1.2) |
(15.3%) |
||
|
Total Operating expenses |
(5.4) |
(5.6) |
3.6% |
||
|
Profit before tax |
3.4 |
4.3 |
26.1% |
||
|
Profit after tax |
2.4 |
3.0 |
22.1% |
||
|
Core EPS |
0.4 |
0.5 |
22.1% |
||
|
Key Ratios |
|||||
|
Income Statement Ratios |
Q1’2021 |
Q1’2022 |
% points y/y change |
||
|
Yield from interest-earning assets |
11.6% |
11.2% |
(0.4%) |
||
|
Cost of funding |
3.2% |
3.2% |
- |
||
|
Net Interest Spread |
8.4% |
8.0% |
(0.4%) |
||
|
Net Interest Margin |
8.6% |
8.3% |
(0.3%) |
||
|
Net Interest Income as % of operating income |
68.5% |
61.8% |
(6.7%) |
||
|
Non-Funded Income as a % of operating income |
31.5% |
38.2% |
6.7% |
||
|
Cost to Income Ratio |
64.5% |
53.8% |
(10.7%) |
||
|
Cost to Income Ratio without LLP |
48.6% |
44.6% |
(4.0%) |
||
|
Cost to Assets |
1.3% |
1.3% |
- |
||
|
Capital Adequacy Ratios |
|||||
|
Ratios |
Q1'2021 |
Q1'2022 |
% Points Change |
||
|
Core Capital/Total Liabilities |
18.4% |
19.8% |
1.4% |
||
|
Minimum Statutory ratio |
8.0% |
8.0% |
- |
||
|
Excess |
10.4% |
11.8% |
1.4% |
||
|
Core Capital/Total Risk Weighted Assets |
15.2% |
15.3% |
0.1% |
||
|
Minimum Statutory ratio |
10.5% |
10.5% |
- |
||
|
Excess |
4.7% |
4.8% |
0.1% |
||
|
Total Capital/Total Risk Weighted Assets |
16.9% |
16.6% |
(0.3%) |
||
|
Minimum Statutory ratio |
14.5% |
14.5% |
- |
||
|
Excess |
2.4% |
2.1% |
(0.3% |
||
Key take-outs from the earnings release include;
- Core earnings per share increased by 68.9% to Kshs 0.8 in Q1’2022, from Kshs 0.5 in Q1’2021, in line with our projections of a 64.7% increase to Kshs 0.8. The performance was driven by a 16.9% increase in total operating income to Kshs 16.8 bn in Q1’2022, from Kshs 14.4 bn in Q1’2021, coupled with a 2.5% decline in the total operating expenses to Kshs 9.0 bn in Q1’2022, from Kshs 9.3 bn in Q1’2021,
- Interest income rose by 4.1% to Kshs 14.0 bn in Q1’2022, from Kshs 13.4 bn in Q1’2021 driven by a 19.5% increase in interest income from government securities to Kshs 4.9 bn, from Kshs 4.1 bn in Q1’2021, coupled with a 99.2% rise in interest income from placements with other banking institutions to Kshs 82.6 mn from, Kshs 41.5 mn,
- The Yield on Interest-Earning Assets declined by 0.4% points to 11.2%, from 11.6% in Q1’2021 due to the faster 12.3% growth in the average interest-earning assets, which outpaced the 8.6% growth in trailing interest income,
- Interest expense increased by 0.3% to Kshs 3.63 bn in Q1’2022, from Kshs 3.62 bn in Q1’2021, largely due to a 3.1% rise in interest expense from customer deposits to Kshs 3.3 bn, from Kshs 3.2 bn in Q1’2021. The increase in interest expense was however mitigated by a 6.7% decline in other interest expenses to Kshs 0.3 bn in Q1’2022, from Kshs 0.4 bn in Q1’2021. As such, cost of funds (COF) remained relatively unchanged at 3.2%, as recorded in Q1’2021, owing to the 11.7% increase in trailing interest expense, as compared to the 11.3% rise in the average interest-bearing liabilities,
- Net Interest Margin (NIM) declined to 8.3% in Q1’2022, from 8.6% in Q1’2021, attributable to the 12.3% growth in average interest-earning assets (NII), which outpaced the 7.6% growth of trailing Net Interest Income,
- Total operating expenses declined by 2.5% to Kshs 9.3 bn in Q1’2022, from Kshs 9.0 bn in Q1’2021, largely driven by the 32.3% reduction in Loan Loss Provisions (LLP) to Kshs 1.5 bn, from Kshs 2.3 bn in Q1’2021. The reduced provisioning levels are indicative of the reduced credit risk as a result of the improved business environment,
- The balance sheet recorded an expansion as total assets grew by 8.0% to Kshs 597.0 bn in Q1’2022, from Kshs 552.9 bn in Q1’2021, mainly attributable to the 10.4% growth in government securities to Kshs 183.4 bn, from Kshs 166.2 bn recorded in Q1’2021, coupled with an 8.8% growth in net loans and advances to Kshs 324.5 bn in Q1’2022, from Kshs 298.2 bn in Q1’2021. The faster increase in allocation to government securities highlights the bank’s cautious lending strategy considering the relatively lower asset quality, as evidenced by the bank’s NPL ratio of 13.9% in Q1’2022 compared to the average 13.1% gross NPL ratio of the banking sector as at end of FY’2021,
- Total liabilities grew by 7.8% to Kshs 493.9 bn, from Kshs 458.3 bn in Q1’2021, which was largely attributable to a 4.3% rise in customer deposits to Kshs 410.8 bn in Q1’2022, from Kshs 393.8 bn in Q1’2021,
- Deposits per branch increased by 3.7% to Kshs 2.3 bn, from Kshs 2.2 bn in Q1’2021, with the number of branches increasing to 178 in Q1’2022, from 177 recorded in Q1’2021,
- Gross Non-Performing Loans (NPLs) decreased by 4.9% to Kshs 49.5 bn in Q1’2022, from Kshs 52.0 bn in Q1’2021,
- The NPL ratio reduced to 13.9% in Q1’2022, from 15.8% in Q1’2021, owing to the 4.9% decline in gross non-performing loans coupled with the 8.6% growth in gross loans. The improved asset quality is attributable to the economic recovery witnessed in Kenya in Q1’2022 and improved business environment, which saw significant recovery in sectors such as Transport and Communication. Personal consumer, Trade and Transport and Communication, made up 72.2% of Cooperative Bank’s loan book as of FY’2021,
- The NPL coverage ratio consequently improved to 65.3% in Q1’2022, from 58.4% in Q1’2021, due to the 10.4% growth in General Loan Loss Provisions coupled with the 4.9% decline in Gross Non-Performing Loans (NPLs) during the same period, an indication of sufficient provisioning, and,
- Co-operative Bank remains sufficiently capitalized with a core capital to risk-weighted assets ratio of 15.3%, 4.8% points above the statutory requirement of 10.5%. The total capital to risk-weighted assets ratio came in at 16.6%, exceeding the statutory requirement of 14.5% by 2.1% points. Adjusting for IFRS 9, the core capital to risk-weighted assets stood at 12.3%, while total capital to risk-weighted assets came in at 13.6%.
For a comprehensive analysis, please see our Co-operative Bank of Kenya’s Q1’2022 Earnings Note
- KCB Group
|
KCB Group Q1’2022 Key Highlights |
|||||
|
Balance Sheet |
|||||
|
Balance Sheet Items |
Q1'2021 (Kshs bn) |
Q1'2022 (Kshs bn) |
y/y change |
||
|
Net Loans and Advances |
597.1 |
704.4 |
18.0% |
||
|
Government Securities |
212.1 |
274.4 |
29.4% |
||
|
Total Assets |
977.5 |
1,166.9 |
19.4% |
||
|
Customer Deposits |
749.4 |
845.8 |
12.9% |
||
|
Deposits per branch |
2.1 |
1.7 |
(19.2%) |
||
|
Total Liabilities |
830.0 |
983.2 |
18.5% |
||
|
Shareholders’ Funds |
147.5 |
181.8 |
23.3% |
||
|
Income Statement |
|||||
|
Income Statement Items |
Q1'2021 (Kshs bn) |
Q1'2022 (Kshs bn) |
y/y change |
||
|
Net Interest Income |
16.7 |
19.7 |
18.0% |
||
|
Net non-Interest Income |
6.3 |
9.3 |
47.2% |
||
|
Total Operating income |
23.0 |
29.0 |
26.0% |
||
|
Loan Loss provision |
(2.9) |
(2.1) |
(27.5%) |
||
|
Total Operating expenses |
(13.9) |
(15.0) |
7.7% |
||
|
Profit before tax |
9.1 |
14.0 |
53.9% |
||
|
Profit after tax |
6.4 |
9.9 |
54.6% |
||
|
Core EPS |
2.0 |
3.1 |
54.6% |
||
|
Key Ratios |
|||||
|
Income Statement Ratios |
Q1’2021 |
Q1’2022 |
% points y/y change |
||
|
Yield from interest-earning assets |
10.9% |
11.4% |
0.5% |
||
|
Cost of funding |
2.6% |
3.0% |
0.4% |
||
|
Net Interest Spread |
8.3% |
8.4% |
0.1% |
||
|
Net Interest Margin |
8.4% |
8.6% |
0.2% |
||
|
Net Interest Income as % of operating income |
72.6% |
68.0% |
(4.6%) |
||
|
Non-Funded Income as a % of operating income |
27.4% |
32.0% |
4.6% |
||
|
Cost to Income Ratio |
60.4% |
51.7% |
(8.7%) |
||
|
Cost to Income Ratio without LLP |
48.0% |
44.5% |
(3.5%) |
||
|
Capital Adequacy Ratios |
|||||
|
Ratios |
Q1'2021 |
Q1'2022 |
% Points Change |
||
|
Core Capital/Total Liabilities |
22.3% |
20.0% |
2.3% |
||
|
Minimum Statutory ratio |
8.0% |
8.0% |
- |
||
|
Excess |
14.3% |
12.0% |
2.3% |
||
|
Core Capital/Total Risk Weighted Assets |
18.1% |
15.8% |
(2.3%) |
||
|
Minimum Statutory ratio |
10.5% |
10.5% |
- |
||
|
Excess |
7.6% |
5.3% |
(2.3%) |
||
|
Total Capital/Total Risk Weighted Assets |
21.6% |
20.6% |
(1.0%) |
||
|
Minimum Statutory ratio |
14.5% |
14.5% |
- |
||
|
Excess |
7.1% |
6.1% |
(1.0%) |
||
Key take-outs from the earnings release include;
- Core earnings per share rose by 54.6% to Kshs 3.1, from Kshs 2.0 in Q1’2021, higher than our expectations of a 20.1% increase to Kshs 2.4, with the variance stemming from the 26.0% increase in total operating income, which was higher than our projection of a 13.9% increase. The performance was driven by the 26.0% growth in total operating income to Kshs 29.0 bn, from Kshs 23.0 bn in Q1’2021, coupled with a 27.5% decline in Loan Loss Provisions to Kshs 2.1 bn, from Kshs 2.9 bn in Q1’2021. The decline in Loan Loss Provisions is attributable to the declining credit risk in the market on the back of increased business activities in 2022 driven by the gradual economic recovery,
- Interest income grew by 21.2% to Kshs 26.6 bn, from Kshs 22.0 bn in Q1’2021, mainly driven by a 28.6% increase in interest income from government securities which increased to Kshs 7.7 bn, from Kshs 6.0 bn in Q1’2021, coupled with an 18.9% increase in interest income from loans and advances, which increased to Kshs 18.8 bn, from Kshs 15.8 bn in Q1’2021,
- The Yield on Interest-Earning Assets (YIEA) rose by 0.5% points to 11.4%, from 10.9% recorded in Q1’2021, attributable to the faster 18.0% growth in trailing interest income which outpaced the 12.9% growth in Average Interest Earning Assets (AIEA,
- Interest expense rose by 31.4% to Kshs 6.9 bn, from Kshs 5.2 bn in Q1’2021, following a 48.0% rise in Interest expense on deposits and placements to Kshs 1.0 bn, from Kshs 0.7 bn in Q1’2021, coupled with a 26.4% increase in interest expense on customer deposits to Kshs 5.7 bn, from Kshs 4.5 bn in Q1’2021. Consequently, Cost of funds (COF) increased by 0.4% points to 3.0%, from 2.6% recorded in Q1’2021, following a faster 24.9% increase in Trailing interest expense, which outpaced the 3.9% increase in average interest bearing liabilities,
- Net Interest Margin (NIM) increased to 8.6%, from 8.4% in Q1’2021 due to the faster 15.9% increase in trailing Net Interest Income, which outpaced the 12.9%,growth in average interest-earning assets,
- Total operating expenses increased by 7.7% to Kshs 15.0 bn, from Kshs 13.9 bn in Q1’2021, largely driven by an 11.0% increase in staff costs to Kshs 6.7 bn, from Kshs 6.1 bn in Q1’2021. Loan Loss Provisions (LLP), on the other hand, recorded a 27.5% decline to Kshs 2.1 bn, from Kshs 2.9 bn in Q1’2021. The reduced provisioning level was due to declining credit risk on the back of increased business activities in 2022,
- The balance sheet recorded an expansion as total assets grew by 19.4% to Kshs 1.2 tn, from Kshs 1.0 tn in Q1’2021. The growth was supported by a 29.4% increase in government securities to Kshs 274.4 bn, from Kshs 212.1 bn in Q1’2021, coupled with an 18.0% loan book expansion to Kshs 704.4 bn, from Kshs 597.1 bn in Q1’2021,
- Total liabilities rose by 18.5% to Kshs 983.2 bn, from Kshs 830.0 bn in Q1’2021, driven by a 162.7% increase in placements due to other banking institutions to Kshs 45.3 bn, from Kshs 17.2 bn in Q1’2021. Customer deposits increased as well by 12.9% to Kshs 845.8 bn, from Kshs 749.4 bn, with customer deposits from NBK amounting to Kshs 98.7 bn in Q1’2022,
- Deposits per branch decreased by 18.6% to Kshs 1.7 bn, from Kshs 2.1 bn in Q1’2021, with the number of branches increasing to 492, from 355 in Q1’2021,
- Gross non-performing loans increased by 33.6% to Kshs 130.9 bn, from Kshs 98.0 bn in Q1’2021. The group’s Asset Quality therefore deteriorated, with the NPL ratio increasing to 16.9% in Q1’2022, from 14.9% in Q1’2021, attributable to the faster 33.6% growth in Non-Performing loans, which outpaced the 18.0% growth in loans,
- The NPL coverage decreased to 52.7% in Q1’2022, from 61.6% in Q1’2021, attributable to the faster 33.6% growth in Gross non-performing loans, which outpaced the 17.7% growth in general Loan Loss Provisions during the same period, an indication of reduced provisioning, and,
- KCB Group remains sufficiently capitalized with a core capital to risk-weighted assets ratio of 19.2%, 8.7% points above the statutory requirement. In addition, the total capital to risk-weighted assets ratio came in at 22.8%, exceeding the statutory requirement by 8.3% points. Adjusting for IFRS 9, the core capital to risk-weighted assets stood at 19.3%, while total capital to risk-weighted assets came in at 22.9%.
For a comprehensive analysis, please see our KCB Group Q1’2022 Earnings Note
- I&M Group Holdings
|
I&M Group Holdings Q1’2022 Key Highlights |
|||||
|
Balance Sheet |
|||||
|
Balance Sheet Items |
Q1'2021 (Kshs bn) |
Q1'2022 (Kshs bn) |
y/y change |
||
|
Net Loans and Advances |
193.2 |
218.4 |
13.1% |
||
|
Government Securities |
102.4 |
124.0 |
21.0% |
||
|
Total Assets |
364.4 |
430.8 |
18.2% |
||
|
Customer Deposits |
263.1 |
309.4 |
17.6% |
||
|
Deposits per branch |
3.0 |
3.6 |
21.7% |
||
|
Total Liabilities |
294.9 |
355.6 |
20.6% |
||
|
Shareholders’ Funds |
65.6 |
70.5 |
7.6% |
||
|
Income Statement |
|||||
|
Income Statement Items |
Q1'2021 (Kshs bn) |
Q1'2022 (Kshs bn) |
y/y change |
||
|
Net Interest Income |
4.3 |
5.2 |
20.7% |
||
|
Net non-Interest Income |
1.8 |
2.2 |
20.3% |
||
|
Total Operating income |
6.1 |
7.4 |
20.6% |
||
|
Loan Loss provision |
(0.8) |
(0.5) |
(36.7%) |
||
|
Total Operating expenses |
(3.6) |
(3.9) |
8.1% |
||
|
Profit before tax |
2.7 |
3.7 |
38.0% |
||
|
Profit after tax |
1.9 |
2.7 |
43.6% |
||
|
Core EPS |
1.1 |
1.6 |
43.6% |
||
|
Key Ratios |
|||||
|
Income Statement Ratios |
Q1’2021 |
Q1’2022 |
% points y/y change |
||
|
Yield from interest-earning assets |
9.4% |
10.1% |
0.7% |
||
|
Cost of funding |
4.4% |
4.0% |
(0.4%) |
||
|
Net Interest Spread |
5.0% |
6.1% |
1.1% |
||
|
Net Interest Margin |
5.4% |
6.4% |
1.0% |
||
|
Net Interest Income as % of operating income |
70.3% |
70.3% |
- |
||
|
Non-Funded Income as a % of operating income |
29.7% |
29.7% |
- |
||
|
Cost to Income Ratio |
58.0% |
52.0% |
(6.0%) |
||
|
Cost to Income Ratio without LLP |
45.7% |
45.5% |
(0.2%) |
||
|
Cost to Assets |
0.8% |
0.8% |
- |
||
|
Capital Adequacy Ratios |
|||||
|
Ratios |
Q1'2021 |
Q1'2022 |
% Points Change |
||
|
Core Capital/Total Liabilities |
22.3% |
20.0% |
(2.3%) |
||
|
Minimum Statutory ratio |
8.0% |
8.0% |
0.0% |
||
|
Excess |
14.3% |
12.0% |
(2.3%) |
||
|
Core Capital/Total Risk Weighted Assets |
18.1% |
15.8% |
(2.3%) |
||
|
Minimum Statutory ratio |
10.5% |
10.5% |
0.0% |
||
|
Excess |
7.6% |
5.3% |
(2.3%) |
||
|
Total Capital/Total Risk Weighted Assets |
21.6% |
20.6% |
(1.0%) |
||
|
Minimum Statutory ratio |
14.5% |
14.5% |
0.0% |
||
|
Excess |
7.1% |
6.1% |
(1.0%) |
||
Key take-outs from the earnings release include;
- Core earnings per share increased by 43.6% to Kshs 1.6, from Kshs 1.1 recorded in Q1’2021. This was mainly attributable to the 20.6% increase in the total operating income to Kshs 7.4 bn in Q1’2022 from Kshs 6.1 bn in Q1’2021,
- Interest income increased by 20.6% to Kshs 8.6 bn from Kshs 7.1 bn in Q1’2021, driven by a 23.8% growth in the interest income from government securities that came in at Kshs 2.6 bn in Q1’2022, from Kshs 2.1 bn in Q1’2021. This is also in addition to the 19.0% increase in the interest income from loans and advances to Kshs 6.0 bn, from Kshs 5.0 bn realized in Q1’2021,
- The Yield on Interest-Earning Assets increased to 10.1% from 9.4% in Q1’2021, attributable to a 21.2% increase in the trailing interest income, as compared to the 13.1% increase in average interest earning assets,
- Interest expense increased by 20.6% to Kshs 3.4 bn from Kshs 2.8 bn in Q1’2021, attributable to an 18.3% increase in the interest expense on deposits to Kshs 2.8 bn, from Kshs 2.4 bn realized in Q1’2021, as well as a 28.2% growth in the interest expense on placements to Kshs 0.3 bn from Kshs 0.2 bn in Q1’2021. The bank was able to mobilize cheap deposits, with the cost funds declining by 0.4% points to 4.0% from 4.4% recorded in Q1’2022, following a 14.7% increase in average interest bearing liabilities, which outpaced the 5.7% increase in trailing interest expense,
- Net Interest Margin (NIM) increased by 1.0% points to 6.4%, from 5.4% in Q1’2021, driven by the 32.6% increase in the trailing net Interest Income (NII) which outpaced the 13.1% growth in average interest earning assets,
- Total operating expenses rose by 8.1% to Kshs 3.9 bn from Kshs 3.6 bn in Q1’2021, largely driven by a 24.8% increase in other operating expenses to Kshs 2.0 bn, from Kshs 1.6 bn in Q1’2021, coupled with a 13.8% increase in staff costs to Kshs 1.3 bn, from Kshs 1.2 bn in Q1’2021. On the other hand, Loan Loss Provisions (LLPs) declined by 36.7% to Kshs 0.5 bn, from Kshs 0.8 bn in Q1’2021, attributable to the reduced credit risk on the back of improved business environment,
- The balance sheet recorded an expansion as total assets grew by 18.2% to Kshs 430.8 bn, from Kshs 364.4 bn in Q1’2021, attributable to a 13.0% loan book expansion to Kshs 218.4 bn, from Kshs 193.2 bn in Q1’2021, coupled with a 6.0% increase in government securities to Kshs 218.4 bn, from Kshs 193.2 bn in Q1’2021,
- Total liabilities rose by 20.6% to Kshs 355.6 bn from Kshs 294.9 bn in Q1’2021, driven by a 17.6% rise in customer deposits to Kshs 309.4 bn from Kshs 263.1 bn in Q1’2021, coupled with a 73.1% increase in placements liabilities to Kshs 17.7 bn from Kshs 10.2 bn in Q1’2021,
- Deposits per branch increased by 21.7% to Kshs 3.6 bn from Kshs 3.0 bn in Q1’2021, with the number of branches reduced to 86 branches from 89 branches in Q1’2021,
- Gross non-performing loans declined by 4.4% to Kshs 23.6 bn in Q1’2022, from Kshs 24.7 bn in Q1’2021. Consequently, the NPL ratio declined to 10.0% in Q1’2022 from 11.9% in Q1’2021, attributable to the faster 15.4% increase in gross Loans, coupled with the 4.4% decline in gross Non-Performing loans. The improved asset quality is attributable to the economic recovery witnessed in Kenya in Q1’2022 and improved business environment,
- The NPL coverage on the other hand improved to 72.1% in Q1’2022 from 61.1% in Q1’2021, as general Loan Loss Provisions increased by 16.1% coupled with the 4.4% decline in gross Non-Performing loans (NPLs) during the same period, an indication of sufficient provisioning, and,
- I&M Holdings Plc remains sufficiently capitalized with a core capital to risk-weighted assets ratio of 15.8%, 5.3% points above the statutory requirement. In addition, the total capital to risk-weighted assets ratio came in at 20.6%, exceeding the statutory requirement by 6.1% points. Adjusting for IFRS 9, the core capital to risk-weighted assets stood at 15.9%, while total capital to risk-weighted assets came in at 20.6%.
For a comprehensive analysis, please see our I&M Group Holdings Q1’2022 Earnings Note
- Diamond Trust Bank Kenya
|
Diamond Trust Bank Kenya Q1’2022 Key Highlights |
|||||
|
Balance Sheet |
|||||
|
Balance Sheet Items |
Q1'2021 (Kshs bn) |
Q1'2022 (Kshs bn) |
y/y change |
||
|
Net Loans and Advances |
205.8 |
224.8 |
9.2% |
||
|
Government Securities |
113.9 |
127.7 |
12.1% |
||
|
Total Assets |
417.3 |
471.3 |
12.9% |
||
|
Customer Deposits |
301.8 |
343.1 |
13.7% |
||
|
Deposits per branch |
2.3 |
2.7 |
18.1% |
||
|
Total Liabilities |
346.9 |
394.7 |
13.8% |
||
|
Shareholders’ Funds |
64.0 |
69.1 |
8.0% |
||
|
Income Statement |
|||||
|
Income Statement Items |
Q1'2021 (Kshs bn) |
Q1'2022 (Kshs bn) |
y/y change |
||
|
Net Interest Income |
5.0 |
5.5 |
11.6% |
||
|
Net non-Interest Income |
1.6 |
1.8 |
14.1% |
||
|
Total Operating income |
6.5 |
7.3 |
12.2% |
||
|
Loan Loss provision |
(0.7) |
(0.6) |
(14.9%) |
||
|
Total Operating expenses |
(3.5) |
(3.9) |
10.7% |
||
|
Profit before tax |
3.0 |
3.4 |
13.2% |
||
|
Profit after tax |
2.1 |
2.4 |
16.3% |
||
|
Core EPS |
7.3 |
8.5 |
16.3% |
||
|
Key Ratios |
|||||
|
Income Statement Ratios |
Q1’2021 |
Q1’2022 |
% points y/y change |
||
|
Yield from interest-earning assets |
8.9% |
8.9% |
- |
||
|
Cost of funding |
4.0% |
3.9% |
(0.1%) |
||
|
Net Interest Spread |
4.9% |
5.0% |
0.1% |
||
|
Net Interest Margin |
5.2% |
5.3% |
0.1% |
||
|
Net Interest Income as % of operating income |
76.1% |
75.7% |
(0.4%) |
||
|
Non-Funded Income as a % of operating income |
23.9% |
24.3% |
0.4% |
||
|
Cost to Income Ratio |
54.0% |
53.2% |
(0.7%) |
||
|
Cost to Income Ratio without LLP |
43.5% |
45.3% |
1.8% |
||
|
Capital Adequacy Ratios |
|||||
|
Ratios |
Q1'2021 |
Q1'2022 |
% Points Change |
||
|
Core Capital/Total Liabilities |
22.8% |
21.7% |
(1.1%) |
||
|
Minimum Statutory ratio |
8.0% |
8.0% |
- |
||
|
Excess |
14.8% |
13.7% |
(1.1%) |
||
|
Core Capital/Total Risk Weighted Assets |
20.8% |
20.5% |
(0.3%) |
||
|
Minimum Statutory ratio |
10.5% |
10.5% |
- |
||
|
Excess |
10.3% |
10.0% |
(0.3%) |
||
|
Total Capital/Total Risk Weighted Assets |
22.4% |
21.8% |
(0.6%) |
||
|
Minimum Statutory ratio |
14.5% |
14.5% |
- |
||
|
Excess |
7.9% |
7.3% |
(0.6%) |
||
Key take-outs from the earnings release include;
- The bank’s core earnings per share increased by 16.3% to Kshs 8.5, from Kshs 7.3 in Q1’2021, lower than our expectations. The bank’s performance was driven by the 12.2% increase in total operating income to Kshs 7.3 bn, from Kshs 6.5 bn in Q1’2021, which outpaced the 10.7% increase in total operating expenses to Kshs 3.9 bn from Kshs 3.5 bn in Q1’2021,
- Interest income increased by 10.7% to Kshs 9.2 bn, from Kshs 8.3 bn in Q1’2021. This was driven by a 23.0% increase in interest income from government securities to Kshs 4.3 bn, from Kshs 3.5 bn in Q1’2021, coupled with a 1.5% increase in Interest income from loans and advances to Kshs 4.84 bn from Kshs 4.77 bn in Q1’2021. Interest income from deposit placements also increased by 20.3% to Kshs 50.4 mn, from Kshs 41.9 mn in Q1’2021,
- The Yield on Interest-Earning Assets remained unchanged at 8.9% in Q1’2022 similar to what was recorded in Q1’2021, attributable to a similar 10.7% growth in trailing interest income as in 10.1% % growth in average interest-earning assets to Kshs 391.1 bn, from Kshs 340.9 bn in Q1’2021,
- Interest expense increased by 9.5% to Kshs 3.7 bn, from Kshs 3.4 bn in Q1’2021, following a 13.5% increase in interest expense on customer deposits to Kshs 3.3 bn, from Kshs 2.9 bn in Q1’2021. The increase was however mitigated by a 5.7% decline in other interest expenses to Kshs 270.3 mn, from Kshs 286.5 mn in Q1’2021. Cost of funds reduced marginally to 3.9% in Q1’2022 from 4.0% recorded in Q1’2021, owing to the slower 8.6% increase in trailing interest expenses, compared to the 11.1% growth in average interest-bearing liabilities to Kshs 360.6 bn, from Kshs 324.7 bn,
- Net Interest Margin (NIM) marginally increased by 0.1% point to 5.3%, from 5.2% in Q1’2021 due to the faster 12.0% growth in trailing Net Interest Income, compared to the 10.1% growth seen in the average interest-earning assets,
- Total operating expenses rose by 10.7% to Kshs 3.9 bn from Kshs 3.5 bn in Q1’2021, largely driven by the 17.0% increase in staff costs to Kshs 1.4 bn from Kshs 1.2 bn in Q1’2021, coupled with 16.7% increase in other operating expenses to Kshs 1.9 bn from Kshs 1.6 bn in Q1’2021. However, Loan Loss Provision declined by 14.9% to Kshs 0.6 bn from Kshs 0.7 bn recorded in Q1’2021,
- The balance sheet recorded an expansion as total assets increased by 12.9% to Kshs 471.3 bn, from Kshs 417.3 bn recorded in Q1’2021. The growth was largely driven by a 9.2% increase in net loans to Kshs 224.8 bn, from Kshs 205.8 bn in Q1’2021 coupled with a 12.1% increase in government securities to Kshs 127.7 bn, from Kshs 113.9 bn in Q1’2021,
- Total liabilities grew by 13.8% to Kshs 394.7 bn, from Kshs 346.9 bn in Q1’2021, driven by a 13.7% increase in customer deposits to Kshs 343.1 bn from Kshs 301.8 bn in Q1’2021, coupled with a 62.2% increase in placements to Kshs 23.8 bn, from Kshs 14.7 bn, in Q1’2021,
- Deposits per branch increased by 18.1% to Kshs 2.7 bn from Kshs 2.3 bn, as the number of branches declined to 129 in Q1’2022 from 134 branches in Q1’2021 after the Group closed 6 branches in Kenya, in order to reduce operational costs, but opened 1 branch in Uganda,
- Gross Non-Performing Loans (NPLs) rose by 30.7% to Kshs 30.0 bn in Q1’2022, from Kshs 22.9 bn recorded in Q1’2021. Consequently, the NPL ratio deteriorated to 12.6% from 10.6% recorded in Q1’2021, due to the faster 30.7% growth in gross NPLs which outpaced the 9.7% growth in gross loans,
- The NPL coverage declined to 42.2% in Q1’2022, from 46.5% in Q1’2021, owing to the faster 30.7% increase in Gross NPLs, which outpaced the 11.1% growth in general provisions during the same period, an indication of reduced provisioning, and,
- Diamond Trust Bank is currently sufficiently capitalized with a core capital to risk-weighted assets ratio of 20.5%, 10.0% points above the statutory requirement of 10.5%. Additionally, the total capital to risk-weighted assets ratio was 21.8%, exceeding the 14.5% statutory requirement by 7.3% points. Adjusting for IFRS 9, the core capital to risk-weighted assets stood at 20.6%, while total capital to risk-weighted assets came in at 21.8%.
For a comprehensive analysis, please see our Diamond Trust Bank-Kenya Q1’2022 Earnings Note
Asset Quality
The table below is a summary of the asset quality for the listed banks
|
|
Q1'2021 NPL Ratio** |
Q1'2022 NPL Ratio* |
Q1'2021 NPL Coverage** |
Q1'2022 NPL Coverage* |
% point change in NPL Ratio |
% point change in NPL Coverage |
|
ABSA Bank Kenya |
7.5% |
7.6% |
76.2% |
73.4% |
0.1% |
(2.8%) |
|
Equity Group |
12.1% |
9.0% |
55.0% |
66.0% |
(3.1%) |
11.0% |
|
I&M Holdings |
11.9% |
10.0% |
61.1% |
72.1% |
(1.9%) |
11.0% |
|
Stanbic Bank |
15.1% |
11.1% |
63.9% |
59.1% |
(4.0%) |
(4.8%) |
|
Diamond Trust Bank |
10.6% |
12.6% |
46.5% |
42.2% |
2.0% |
(4.3%) |
|
Co-operative Bank |
15.8% |
13.9% |
58.4% |
65.3% |
(1.9%) |
6.9% |
|
SCBK |
16.4% |
15.4% |
81.1% |
81.8% |
(1.0%) |
0.7% |
|
NCBA Group |
14.7% |
16.3% |
65.0% |
72.6% |
1.6% |
7.6% |
|
KCB |
14.9% |
16.9% |
61.6% |
52.7% |
2.0% |
(8.9%) |
|
HF Group |
24.7% |
20.5% |
64.7% |
76.1% |
(4.2%) |
11.4% |
|
Mkt Weighted Average |
13.4% |
12.4% |
62.3% |
64.9% |
(1.0%) |
2.6% |
|
*Market cap weighted as at 27/05/2022 **Market cap weighted as at 08/06/2021 |
||||||
Key take-outs from the table include;
- Asset quality for the listed banks improved during the period, with the weighted average NPL ratio declining by 1.0% points to a market cap weighted average of 12.4, from an average of 13.4% for the listed banking sector in Q1’2021. The improvement in asset quality is attributable to declining credit risk on the back of increased business activities in the period driven by the gradual economic recovery, and,
- NPL Coverage for the listed banks increased to a market cap weighted average of 64.9% in Q1’2022, from 62.3% recorded in Q1’2021, as the banks increased their provisioning levels to proactively manage risks brought about by the emergence of new COVID-19 variants coupled with the slow recovery of some sectors such as tourism, agriculture and manufacturing. However, it is key to note that KCB Group’s NPL coverage came in at 52.7%, a decline from the 61.6% Q1’2022, despite the increase in the Gross NPL’s by 33.6% y/y, an indication of reduced provisioning.
Summary Performance
The table below highlights the performance of the listed banks, showing the performance using several metrics, and the key take-outs of the performance;
|
Bank |
Core EPS Growth |
Interest Income Growth |
Interest Expense Growth |
Net Interest Income Growth |
Net Interest Margin |
Non-Funded Income Growth |
NFI to Total Operating Income |
Growth in Total Fees & Commissions |
Deposit Growth |
Growth in Government Securities |
Loan to Deposit Ratio |
Loan Growth |
Return on Average Equity |
|
HF Group |
117.8% |
1.1% |
(6.5%) |
9.7% |
4.4% |
87.2% |
26.8% |
44.1% |
3.1% |
26.5% |
90.8% |
(2.7%) |
(4.5%) |
|
Co-op |
68.9% |
4.1% |
0.3% |
5.5% |
8.3% |
41.7% |
16.9% |
45.2% |
4.3% |
10.4% |
79.0% |
8.8% |
19.3% |
|
KCB |
54.6% |
21.2% |
31.4% |
18.0% |
8.6% |
47.2% |
26.0% |
49.1% |
12.9% |
29.4% |
83.3% |
18.0% |
22.9% |
|
I&M |
43.6% |
20.7% |
20.6% |
20.7% |
6.4% |
20.3% |
20.6% |
28.4% |
17.6% |
21.0% |
70.6% |
13.1% |
13.5% |
|
Equity |
36.0% |
31.1% |
32.6% |
30.6% |
7.2% |
9.7% |
21.7% |
21.7% |
14.0% |
24.9% |
69.2% |
27.8% |
28.7% |
|
ABSA |
22.1% |
15.6% |
16.2% |
15.4% |
7.1% |
5.8% |
12.3% |
(10.0%) |
4.8% |
7.9% |
90.0% |
11.2% |
21.2% |
|
NCBA |
20.3% |
10.4% |
14.9% |
7.6% |
5.8% |
15.5% |
11.1% |
0.0% |
7.2% |
22.6% |
52.4% |
0.3% |
14.0% |
|
SCBK |
15.6% |
1.8% |
(23.6%) |
7.2% |
6.3% |
0.1% |
34.0% |
(11.0%) |
0.1% |
(1.0%) |
48.3% |
8.7% |
17.4% |
|
Stanbic |
12.0% |
9.5% |
(5.2%) |
16.9% |
6.3% |
9.6% |
13.5% |
21.8% |
3.7% |
(14.6%) |
87.8% |
30.7% |
21.6% |
|
DTB |
8.5% |
10.7% |
9.5% |
11.6% |
5.4% |
14.1% |
12.2% |
10.0% |
13.7% |
12.1% |
65.5% |
9.2% |
7.1% |
|
Q1'22 Mkt Weighted Average* |
37.9% |
18.0% |
17.4% |
18.1% |
7.3% |
21.3% |
20.5% |
23.1% |
9.6% |
17.1% |
73.6% |
17.4% |
21.9% |
|
Q1'21 Mkt Weighted Average** |
28.4% |
14.7% |
12.7% |
17.5% |
7.4% |
2.9% |
35.3% |
(2.4%) |
21.8% |
20.3% |
69.2% |
11.0% |
13.8% |
|
*Market cap weighted as at 27/05/2022 **Market cap weighted as at 08/06/2021 |
|||||||||||||
Key takeaways from the table above include:
- The listed banks recorded a 37.9% weighted average growth in core Earnings per Share (EPS), compared to a weighted average increase of 28.4% in Q1’2021 for the listed banking sector,
- The Banks have recorded a weighted average deposit growth of 9.6%, slower than the 21.8% growth recorded in Q1’2021, an indication of reduced investment risk in the business environment,
- Interest income grew by 18.0%, compared to a growth of 14.7% recorded in Q1’2021 while the weighted average Yield on Interest Earning Assets (YIEA) increased to 10.0%, from the 9.5% recorded in Q1’2021 for the listed banking sector. On the other hand, the Net Interest Margin (NIM) now stands at 7.3%, 0.1% points lower than the 7.4% recorded in Q1’2021 for the whole listed banking sector, and,
- Non-Funded Income grew by 21.3%, compared to the 2.9% growth recorded in Q1’2022. This can be attributable to the faster growth in the fees and commission which grew by 23.1% compared to a decline of 2.4% in Q1’2021, following the expiry of the waiver on fees on mobile transactions.
Cytonn coverage:
|
Company |
Price as at 20/05/2022 |
Price as at 27/05/2022 |
w/w change |
YTD Change |
Year Open 2022 |
Target Price* |
Dividend Yield |
Upside/ Downside** |
P/TBv Multiple |
Recommendation |
|
Kenya Reinsurance |
2.1 |
2.1 |
0.0% |
(10.5%) |
2.3 |
3.2 |
4.9% |
59.9% |
0.2x |
Buy |
|
I&M Group*** |
17.5 |
17.1 |
(2.6%) |
(20.3%) |
21.4 |
25.4 |
8.8% |
57.7% |
0.5x |
Buy |
|
Jubilee Holdings |
264.0 |
267.0 |
1.1% |
(15.7%) |
316.8 |
381.7 |
5.2% |
48.2% |
0.5x |
Buy |
|
ABSA Bank*** |
9.8 |
10.1 |
3.0% |
(14.5%) |
11.8 |
13.4 |
10.9% |
44.5% |
1.0x |
Buy |
|
KCB Group*** |
35.3 |
38.0 |
7.6% |
(16.6%) |
45.6 |
50.5 |
7.9% |
40.8% |
0.8x |
Buy |
|
Liberty Holdings |
5.2 |
5.5 |
5.4% |
(22.4%) |
7.1 |
7.7 |
0.0% |
39.8% |
0.4x |
Buy |
|
Diamond Trust Bank*** |
50.0 |
50.0 |
0.1% |
(16.0%) |
59.5 |
65.6 |
6.0% |
37.2% |
0.2x |
Buy |
|
Equity Group*** |
44.7 |
44.0 |
(1.6%) |
(16.6%) |
52.8 |
56.2 |
6.8% |
34.5% |
1.1x |
Buy |
|
Co-op Bank*** |
11.6 |
12.0 |
3.0% |
(8.1%) |
13.0 |
14.6 |
8.4% |
30.5% |
0.9x |
Buy |
|
Standard Chartered*** |
124.0 |
124.0 |
0.0% |
(4.6%) |
130.0 |
147.1 |
11.3% |
29.9% |
1.0x |
Buy |
|
Britam |
6.5 |
6.4 |
(0.9%) |
(14.8%) |
7.6 |
7.9 |
0.0% |
22.3% |
1.1x |
Buy |
|
NCBA*** |
26.3 |
26.9 |
2.3% |
5.5% |
25.5 |
28.2 |
11.2% |
16.2% |
0.6x |
Accumulate |
|
Stanbic Holdings |
104.0 |
108.0 |
3.8% |
24.1% |
87.0 |
107.2 |
8.3% |
7.6% |
1.0x |
Hold |
|
CIC Group |
2.0 |
2.0 |
0.5% |
(8.3%) |
2.2 |
1.9 |
0.0% |
(5.3%) |
0.7x |
Sell |
|
Sanlam |
14.9 |
14.0 |
(5.7%) |
21.2% |
11.6 |
12.1 |
0.0% |
(13.8%) |
1.5x |
Sell |
|
HF Group |
3.0 |
3.0 |
0.0% |
(21.3%) |
3.8 |
2.5 |
0.0% |
(17.4%) |
0.2x |
Sell |
|
*Target Price as per Cytonn Analyst estimates **Upside/ (Downside) is adjusted for Dividend Yield ***For Disclosure, these are stocks in which Cytonn and/or its affiliates are invested in |
||||||||||
We are “Neutral” on the Equities markets in the short term due to the current adverse operating environment and huge foreign investor outflows, and, “Bullish” in the long term due to current cheap valuations and expected global and local economic recovery. With the market currently trading at an undervalued value to its future growth (PEG Ratio at 0.9x), we believe that investors should reposition towards value stocks with strong earnings growth and that are trading at discounts to their intrinsic value. We expect the discovery of new COVID-19 variants, the upcoming Kenyan general elections and the slow vaccine rollout to continue weighing down the economic outlook. On the upside, we believe that the relaxation of COVID-19 containment measures in the country will lead to improved investor sentiments.
- Industry Reports
During the week, the Central Bank of Kenya (CBK), released the Bank Supervision Annual Report 2021, and the key take-outs were as follows;
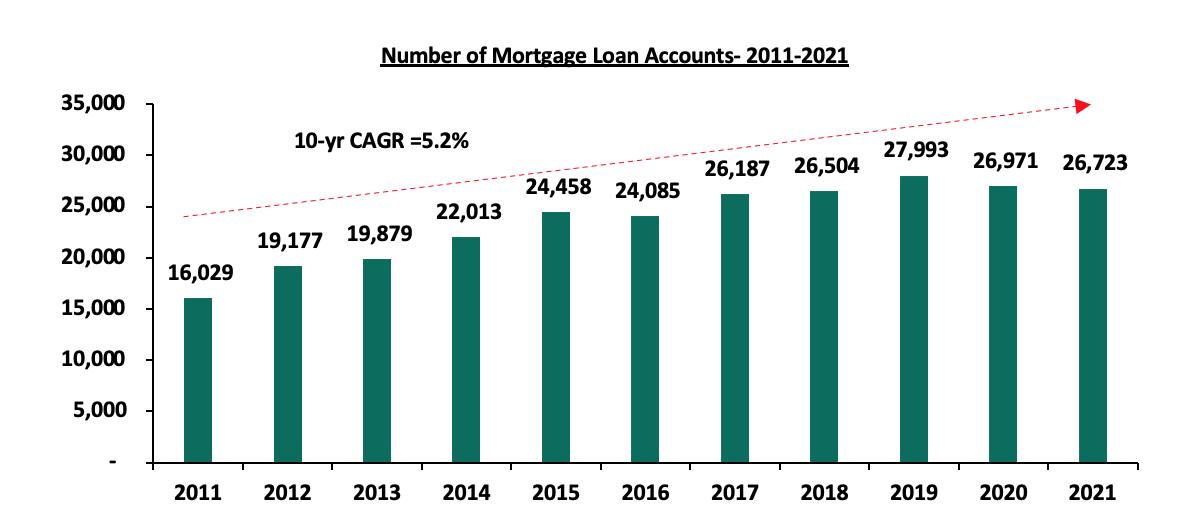
- The residential mortgage market recorded a 0.9% decline in the number of mortgage loans accounts in the market, to 26,723 in December 2021 from 26,971 in December 2020. The decline was mainly attributed to a higher number of existing mortgage loan repayments outpacing the number of new loans issued. The fewer mortgage loans advanced by banks is on the other hand partly due to the effect of the Covid-19 depressed economy. The graph below shows the number of mortgage loan accounts in Kenya over the last 11 years;
Source: Central Bank of Kenya (CBK)
- The overall value of mortgage loans outstanding to registered a 5.3% increase to Kshs 245.1 bn in December 2021 from Kshs 232.7 bn in December 2020. Additionally, the average mortgage loan size increased to Kshs 9.2 mn in 2021 from Kshs 8.6 mn in 2020, attributed to higher value of mortgage loans advanced in the year. The graph below shows the average mortgage loan size from 2011 to 2021;
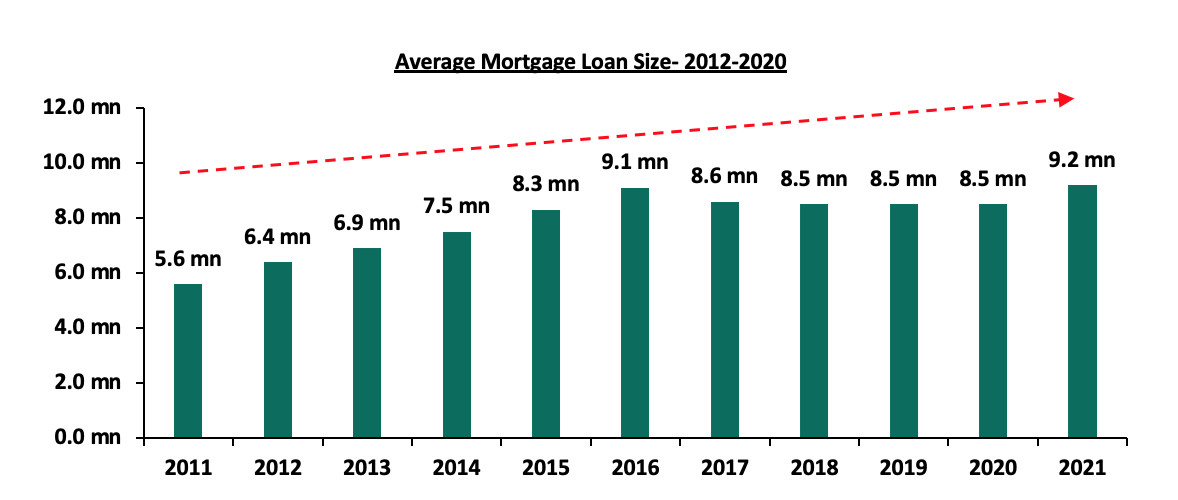
Source: Central Bank of Kenya (CBK)
- The average interest rate charged on mortgages in 2021, was 11.3% and it ranged between 7.1% and 15.0% compared to an average of 10.9% with a range of 7.0% to 15.0% in 2020. With an average mortgage size of Kshs 9.2 mn, an average interest rate of 11.3% and a maximum tenor of 20 years, one is required to make monthly repayments of approximately Kshs 96,847 per month which is unaffordable assuming a gross salary of Kshs 50,000 per month, which is the median household income in Kenya. Given the above, the Kenya mortgage to GDP ratio has continued to lag behind at 2.2% as of 2021 compared to countries such as Namibia and South Africa at 25.5% and 23.3%, respectively as shown in the graph below;
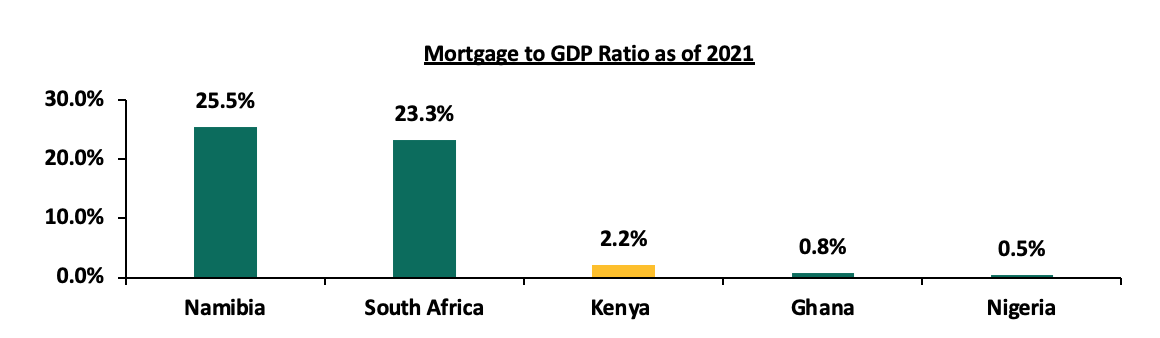
Source: Online Research
- Key to note, the mortgage Non-Performing Loans (NPLs) to gross mortgage loans ratio was 11.6% in December 2021, 0.4% points lower compared to 12.0% in December 2020. The ratios were below the industry gross NPLs to gross loans ratio of 14.1% in December 2021, and 14.5% in December 2020. This was attributed to the higher number of mortgage loans that were repaid as compared to the number of new mortgage loans granted in the year.
Development of the mortgage market in Kenya continues to face impediments such as i) high interest rates currently at 11.3%, ii) low income levels leading to low mortgage affordability, iii) high initial costs when taking mortgages, iv) inability of borrowers to meet the strict eligibility criteria, and, v) high property and development costs. We expect continued subdued performance of the mortgage market, however activities in the mortgage market will be boosted by the government’s efforts through operationalization of the Kenya Mortgage Refinance Company (KMRC), having been allocated Kshs 8.7 bn in the FY’2022/23 Budget Statement to finance the Affordable Housing Program aimed at increasing home ownership in Kenya.
- Mixed-Use Developments (MUDs)
-
- Heri Homes in Partnership with Finsco Africa to Construct 384 Apartments in Ruiru Town
During the week, Heri Homes, a property developer in Kenya, in partnership with Finsco Africa, a Real Estate consultancy firm, announced plans to construct 384 affordable apartments in Ruiru Town, as part of its 200- acre mixed-use development project dubbed Legacy Ridges. The affordable housing development consisting of 2 and 3 bedroom units, will sit on 10 acres of the land while the remaining land will incorporate bungalows and maisonettes, a hotel resort, and commercial office buildings. The table below shows a breakdown of units at the project;
|
Legacy Ridges Project |
|||
|
Typology |
Unit size (SQM) |
Unit Price (Kshs) |
Price per SQM(Kshs) |
|
2 |
75 |
3.5 mn |
46,667 |
|
3 |
95 |
4.3 mn |
45,263 |
|
Averages |
45,965 |
||
|
3br + DSQ (Semi-detached) |
135 |
8.5 mn |
62,963 |
|
4br +DSQ (Semi-detached) |
160 |
9.7 mn |
60,625 |
|
Averages |
61,794 |
||
Source: Online Research
The aforementioned plan comes after the company broke ground for the semi-detached units within the same property in February 2022, signifying effort in delivering housing units to different classes of potential clientele. Upon the completion of the Legacy Ridge project, it will;
- Cater to the growing middle class and the increasing Ruiru population of 371,111 as at 2019 according to KNBS,
- Provide a live, work play environment for its residents, and,
- Attract a working population with the growing commercial activities.
Moreover, Heri Home’s decision to develop the affordable homes for Kenyans further complements the government’s Affordable Housing Initiative, which aims at eradicating the 2.0 mn units housing deficit that grows annually by 200,000 units. The demand for housing is evident in the current number of registered applicants in the Boma Yangu Portal at 328,979. Some of the ongoing projects include; i) Park Road Project in Ngara, ii) Buxton Housing Project in Mombasa, and, iii) King’s Sapphire Bondeni project in Nakuru, among others.
In terms of performance, according to our Nairobi Metropolitan Area (NMA) Mixed-Use Developments Report 2021, Thika Road where Ruiru is categorized recorded a residential average price per SQM of Kshs 128,545, which is 9.5% lower than the market average of Kshs 142,055 per SQM with a relatively high rental yield of 7.0%. The developer is therefore leveraging on the affordability of housing units with its average price per SQM for the affordable housing units at Kshs 45,965. The table below shows the market performance by nodes of Mix-Use Developments in Nairobi Metropolitan Area;
(All Values in Kshs Unless Stated Otherwise)
|
Nairobi’s Mixed-Use Developments Market Performance by Nodes 2021 |
||||||||||||||
|
|
Retail Performance |
Commercial Office Performance |
Residential Performance |
|||||||||||
|
Location |
Price/SQFT |
Rent/SQFT |
Occup. (%) |
Rental Yield (%) |
Price/ SQFT |
Rent/SQFT |
Occup. %) |
Rental Yield (%) |
Price/ SQM |
Rent/ SQM |
Annual Uptake % |
Rental Yield % |
Average MUD yield |
|
|
Karen |
23,333 |
196 |
86.7% |
8.8% |
13,233 |
117 |
85.0% |
9.0% |
8.7% |
|||||
|
Westlands |
15,833 |
173 |
70.8% |
9.5% |
12,892 |
110 |
71.7% |
7.3% |
211,525 |
1,226 |
15.6% |
7.0% |
7.8% |
|
|
Kilimani |
18,500 |
162 |
79.0% |
8.3% |
13,713 |
106 |
79.0% |
6.7% |
7.4% |
|||||
|
Mombasa Rd |
20,000 |
185 |
70.0% |
8.4% |
13,000 |
100 |
60.0% |
5.5% |
156,079 |
853 |
13.3% |
6.6% |
7.4% |
|
|
Thika Rd |
23,750 |
215 |
82.5% |
9.2% |
13,250 |
105 |
72.5% |
6.9% |
128,545 |
612 |
17.9% |
6.1% |
7.0% |
|
|
Upper Hill |
15,485 |
130 |
62.5% |
6.4% |
12,000 |
102 |
70.0% |
7.0% |
6.8% |
|||||
|
Eastlands |
20,000 |
124 |
75.0% |
5.5% |
12,000 |
80 |
62.5% |
5.0% |
72,072 |
360 |
10.0% |
4.2% |
5.1% |
|
|
Average |
18,759 |
170 |
75.9% |
8.4% |
12,924 |
106 |
73.6% |
7.1% |
142,055 |
763 |
15.0% |
6.0% |
7.2% |
|
|
*The average MUDs performance is based on areas where sampled projects exist |
||||||||||||||
Source: Cytonn Research
- Purple Dot Limited Launches Construction of a Kshs 2.5 bn mixed-use commercial complex project along Mombasa Road
During the week, Purple Dot International Limited, launched the construction of a Kshs 2.5 bn mixed-use commercial project along Mombasa Road dubbed Purple Tower. The 14-floor project which will sit on a 1.15-acre piece of land along Mombasa Road, will comprise of office and retail spaces. The first three floors will be for retail spaces while the remaining floor spaces will comprise offices. This comes a week after the development firm announced plans to develop a warehousing hub worth Kshs 600.0 mn at the Harvest Industrial Park in Athi River, Machakos County, a sign of its increasing appetite for the Kenyan property market. The decision by the firm to make investments along Mombasa Road is driven by;
- Improved infrastructure enhancing accessibility, due to rehabilitation of Mombasa road and construction of Nairobi Expressway,
- Relatively good average rental yield for commercial and retail spaces at 5.5% and 8.4% respectively, and,
- The growing number of Small and Medium-sized Enterprises (SMEs) seeking commercial office and retail spaces.
In terms of performance, according to our Nairobi Metropolitan Area (NMA) Mixed-Use Developments Report 2021, Mombasa Road recorded high average rental yield of 7.4%, 0.2% points higher than the market average of 7.2%, hence the developer is leveraging on the remarkable performance as its basis of investments in the area. We expect the mixed-use development sector to continue recording gradual expansion activities and improved performance attributed to overall improved performance the different Real Estate themes when incorporated together. Furthermore, we expect an increase in Mixed-Use Development investments due to the integration benefits such as easier access to amenities and services, a live, work and play environment all in one location and risk diversification. The developments also offer better returns compared to single use themes.
- Industrial Sector
During the week, Botswana’s listed real estate firm Letlole La Rona Limited (LLR) signed a deal with Mauritius-based Grit Real Estate Income Group, to buy a 30.0% stake, in Orbit Products Africa’s manufacturing facilities in Mlolongo, at an initial cost of Kshs 842.0 mn. This comes after Grit had invested Kshs 6.2 bn to acquire Orbit’s warehousing complex in March 2022 and announced plans for its redevelopment and expansion by the end of 2023. Orbit will remain a tenant on the existing factory and warehouses for an initial 25-year lease, and be let on a 20-year lease on the additional space once redevelopment and expansion is complete. The move by Orbit of selling property then leasing it back is a strategy to raise capital and inject it back to its business. On the other hand, the decision by LLR and Grit to invest along Mombasa Road is driven by:
- Strategic location of the industrial park promoting accessibility to and from the place,
- Completion of the Mombasa Inland Container Depot in Syokimau thus enabling ease of access to warehousing facilities, and,
- Increased investment in warehouse facilities offering relatively good returns, because of the popularity of e-commerce in the country driving demand for storage facilities.
We expect the sector to continue recording a boom in activities and performance mainly as a result of the rapid infrastructural developments such as the Standard Gauge Railway and the Nairobi Mombasa Highway, that enhance transport of goods and cargo, coupled with increased demand for warehouse and storage facilities resulting from the rise in e-commerce.
- Listed Real Estate
In the Nairobi Stock Exchange, ILAM Fahari I-REIT closed the week trading at an average price of 5.3 per share. This represented a 3.6% and 17.2% Week-to-Date (WTD) and Year-to-Date (YTD) decline, from Kshs 5.5 per share and Kshs 6.4 per share, respectively. On Inception-to-Date (ITD) basis, the REIT has recorded a 73.5% decline from Kshs 20.0 in November 2015. The graph below shows Fahari I-REIT’s performance from November 2015 to May 2022:
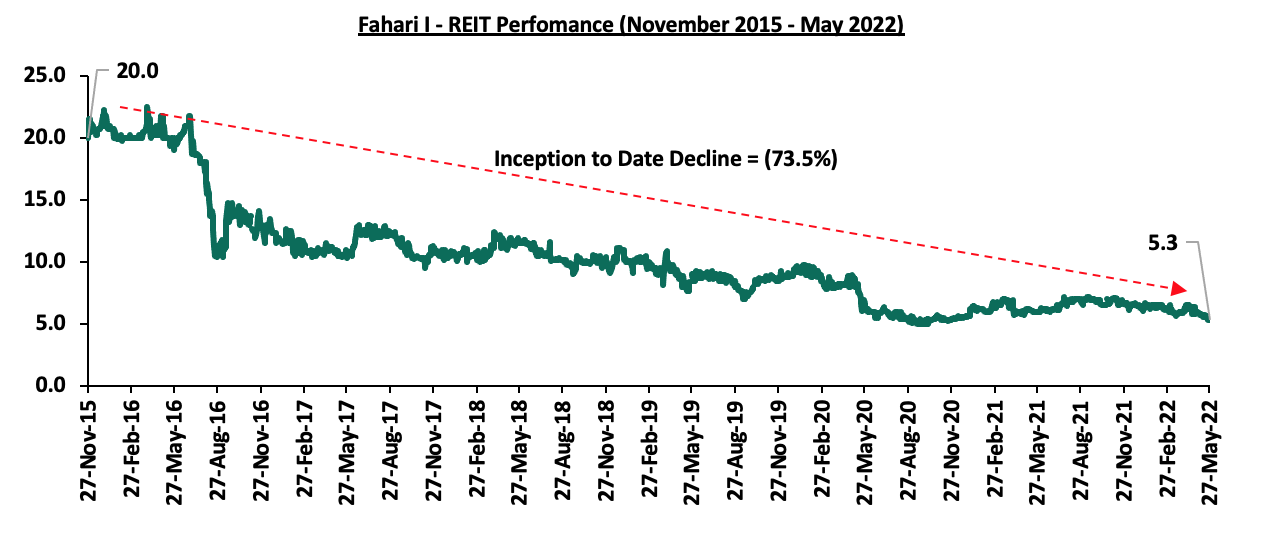
The performance of the Real Estate sector is expected to be supported by investor interest in mixed-use developments which continues to gain traction due to their relatively high returns, compared to the single-use counterparts.
As highlighted in our 2022 Annual Markets Outlook, elections generally pose the risk of destabilizing an economy should the resultant period be chaotic and unstable politically. This leads to a ripple effect whereby production decreases in the country due to decreased business activities. This also leads to low investor confidence in the country and leads to negative capital net flows. Investor sentiments are generally expected to be poorer with the more apprehensive and risk averse expected to sell off their investment holdings while moderate risk-appetite investors hold off on new investments.
We have previously covered topicals on the “Effects of Elections on the Investments Environment in Kenya” and “Effects of Elections on the Real Estate Environment in Kenya” in 2017 where our expectations were that the 2017 elections would largely have a neutral effect on the markets. This week we tackle the historical effects of general elections on different factors and indicators within the investments environment, as well as give our expectations ahead of the upcoming 9th August 2022 general elections. We shall do this by taking a look into the following;
- Effects of Elections on the Investment Environment where shall analyse the performance of the Fixed Income market, Equities market and the Real Estate market,
- Outlook given the Historical Performance and the Current Macro-economic Environment, and,
- Conclusion and our view going forward
Section 1: Effects of Elections on the Investment Environment
The investment performance is largely affected by the market sentiments on the macro-economic indicators of an economy as they drive demand and supply which in turn leads to price movements. In our 2022 market outlook, We expected 2022 to register lower investor sentiments mainly due to; i) A cautious stance by investors as they monitor the election proceedings, ii) expected increase in Eurobond yields as concerns over Kenya’s high debt-to-GDP ratio persists, and, iii) Expected depreciation of the Kenyan currency as a result of increased oil prices globally and high debt servicing costs. Below, we discuss the performance of the fixed income, equities and real estate markets in the previous electioneering periods as we review the key macro-economic indicators:
- Fixed Income Market
Historically, the fixed income market has acted as a safe haven for investors during periods of economic uncertainties as the market is usually highly volatile. The performance of the fixed income market is partly determined by the macro-economic environment, which in turn inform the market sentiment. The macro-economic indicators include:
- Gross Domestic Product (GDP)
The Kenyan economy continues to register robust recovery from the adverse effects of the pandemic having recorded a 7.5% growth in 2021. In 2022, the economy is expected to grow at an average rate of 5.1% with the National Treasury projecting a 6.0% growth rate supported by the global recovery and the easing of COVID-19 containment measures following an increase in vaccination rates and reduced infections. However, in the past, elections have had a negative effect on the economic growth given the disruptions that come along with the cycle. The chart below shows the GDP growth over the last four electioneering periods:
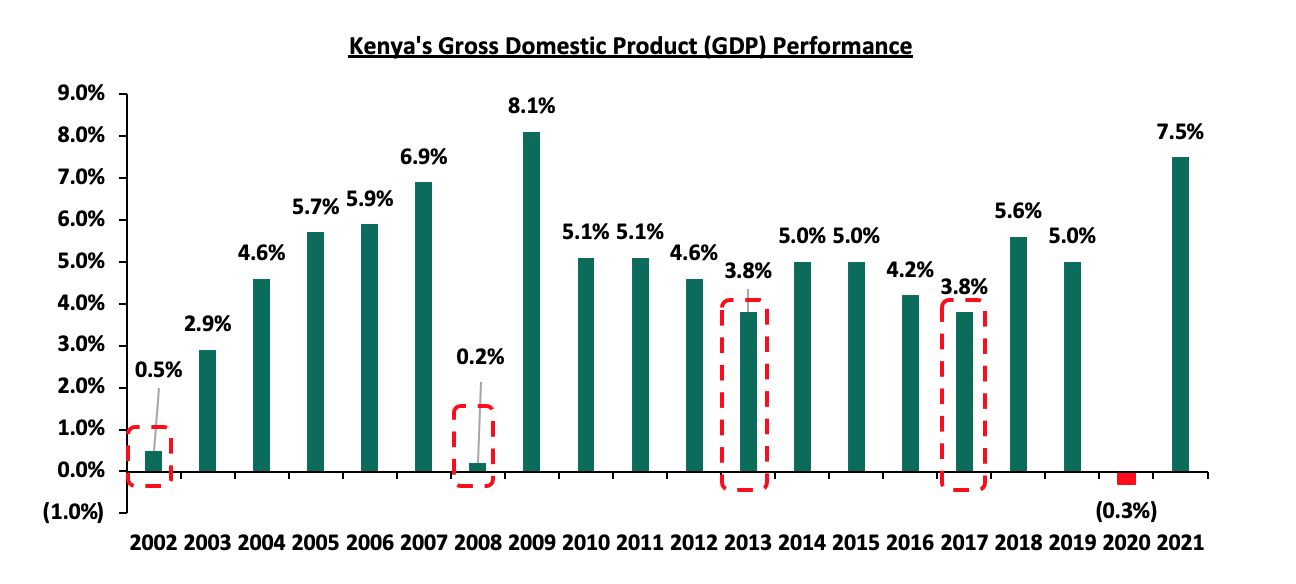
Source: Kenya National Bureau of Statistics (KNBS)
In the past twenty years, save for 2020, the lowest GDP growth was recorded in 2008 following the political instability that was occasioned by the post-election crisis. In the other three periods, the GDP declined in the election cycles and increased in the preceding years reflecting the economic disruptions that are brought about by the elections. As such, we expect the 2022 electioneering period to weigh down the projected average growth of 5.1%.
- Government Borrowing
The election period is typically characterized by increased infrastructure development expenditure, as elected leaders seek re-election by selling a track record to endear themselves to the electorate. Key to note, the current electioneering period coincides with the closure of the FY’2021/2022 which further aggravates the borrowing appetite as the government attempts to narrow the fiscal gap. As of March 2022, Kenya’s total public debt stood at Kshs 8.4 tn. The chart below shows the evolution of Kenya’s public debt;
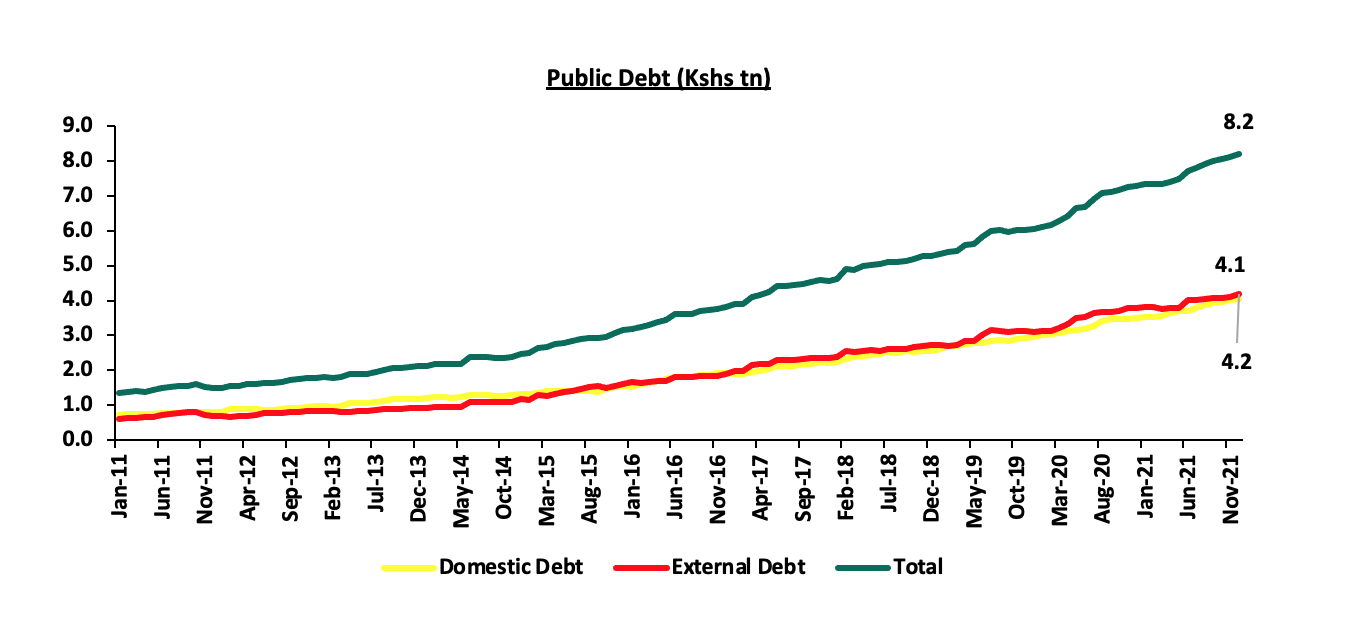
Source: Central Bank of Kenya (CBK)
At the beginning of the FY’2021/2022 the government had projected a target borrowing of Kshs 929.7 bn which increased by 11.7% to Kshs 1.0 tn in the FY’2021/2022 supplementary budget that was approved in April 2022. In addition, the government has a total of Kshs 173.3 bn worth of pending domestic maturities in the one month to the end of the fiscal year. Out of this, Kshs 105.3 bn are Treasury bill maturities while Kshs 68.0 bn are Treasury bond maturities. In a bid to meet its obligations, the government has continued to issue bonds more frequently in form of tap-sales as it seeks financial support from the local market. As of 27th May 2022, the government had offered a total of Kshs 431.5 bn worth of bonds in comparison to the Kshs 303.0 bn over the same period in 2021 reflecting the increased borrowing appetite. As such, we expect the government to maintain the elevated borrowing appetite as it seeks to finance the debt repayments as well as funding the budget deficit, which currently stands at 8.1% of GDP. Additionally, we believe that at its current borrowing levels, fiscal consolidation may take longer and the fiscal deficit is likely to exceed the projected figure.
- Interest Rates
Historically, yields on government papers increase during periods of uncertainty mainly due to reduced investor sentiments and the need for the government as the debt issuer to give investors additional premium for the extra risk borne. The last two election cycles have seen an increase in the 91-day T-bill rates just before the election, which can be attributed to the uncertainty of a new government's transition, as well as the likelihood of political unrest as was the case in 2007. In the past, the government has utilized the Central Bank Rate to stimulate economic activity and appeal to the public by decreasing the Central Bank Rate (CBR), having reduced the rate twice to a low of 9.5% in January 2013 from 11.0% in December 2012 and further to a low of 8.5% in March immediately before the elections. Since April 2020, the CBR has remained unchanged at 7.0% in a bid to support the economy recover from the effects of the pandemic. We do not expect the rate to be affected by this election cycle given that the economy has not fully recovered from the effects of the pandemic. Additionally, we expect the yields on the government papers to continue increasing in the short term in a bid to attract investors. The chart below shows the movement of the Central Bank Rate and the yields on the 91-day T-bills:
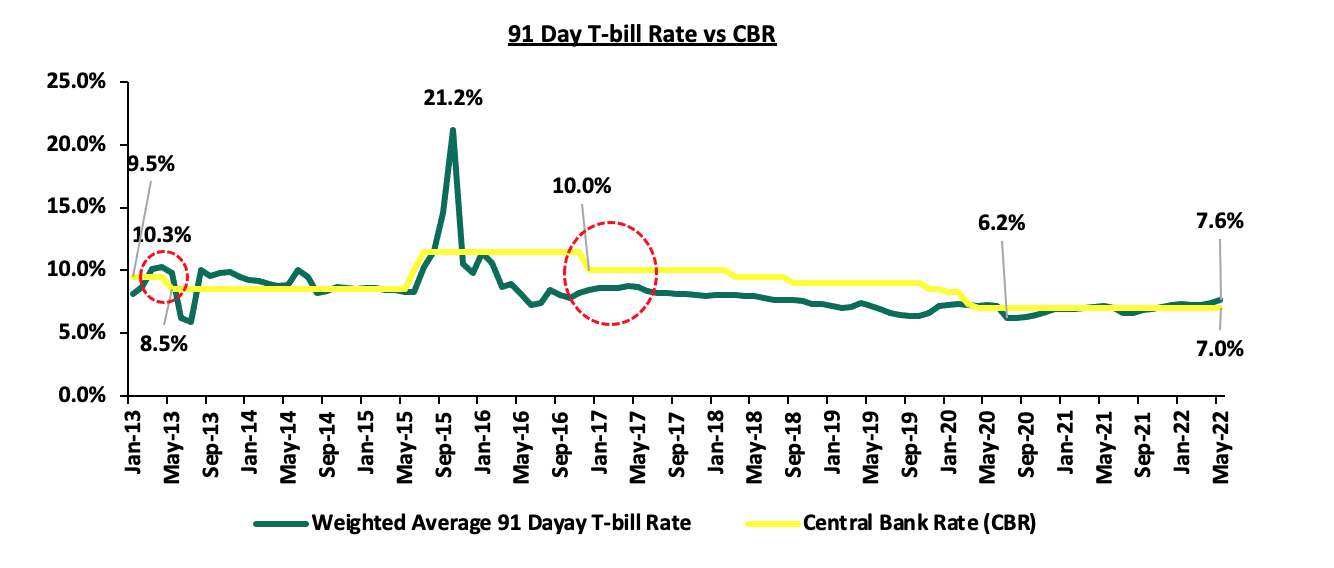
Source: Central Bank of Kenya (CBK)
- Equities Market
NASI performance has remained independent of the effects of the elections cycle as compared to other external factors such as the COVID-19 pandemic and government interventions such as the interest rate cap. Year to Date, NASI has declined by 22.3%, mostly attributable to foreign capital outflows in the emerging markets as investors seek safer havens due to the uncertainties occasioned by the emergence of new COVID-19 variants and geopolitical pressures. The chart below highlights the performance of NASI since 2011;
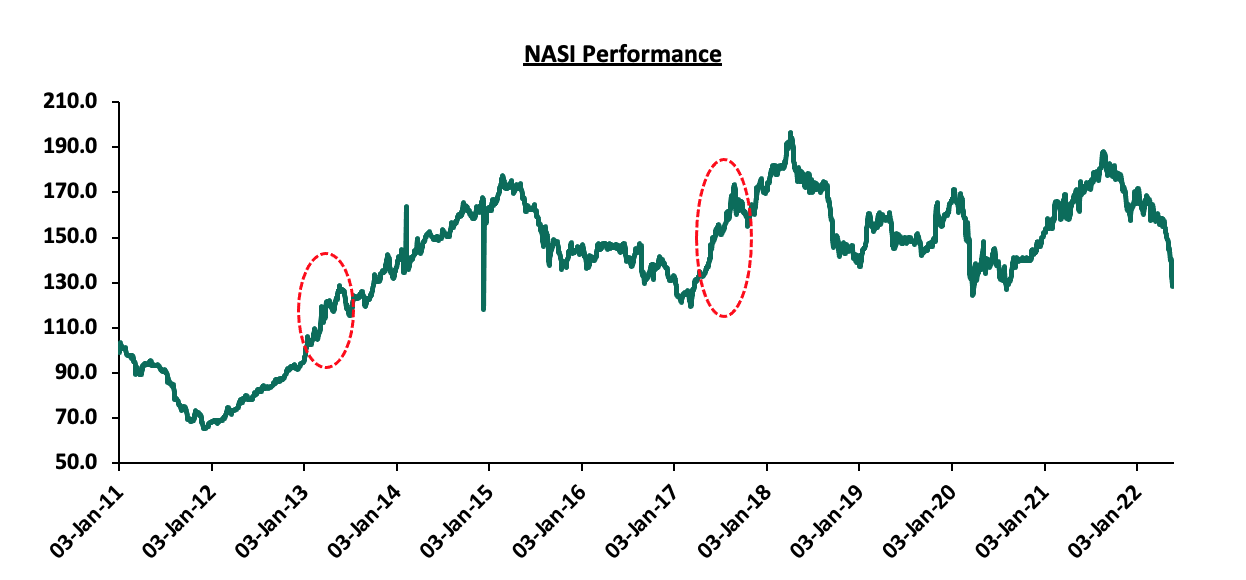
Source: Nairobi Securities Exchange (NSE)
For the listed companies, the market valuation has remained independent of the effects of elections in the past years. In the months surrounding the March 2013 election the NASI P/E ratio was on the rise, on the back of the rising share prices which led to a decline in the NASI dividend yield. The performance was attributable to a general rise in stock prices during the period in majority of the countries globally, which saw NASI gain by 72.4% in the period January 2012 and December 2013 an indication that the market’s confidence during the period was not affected by the electioneering period. Similarly, for the 2017 general elections, the NASI P/E was on an upward trajectory partly due to declining earnings for the banking sector stocks owing to the tough operating environment as a result of the interest rate capping and prolonged political uncertainty in the country after the first round elections were nullified. The environment also affected the market sentiments shortly after the first round elections, as the NASI P/E started declining.
In the current business environment, NASI has been on a downward trajectory and is trading at a price to earnings ratio (P/E) of 7.2x, 44.1% below the historical average of 12.8x, the lowest on record in the last thirteen years. The dividend yield is 6.3%, 2.3% points above the historical average of 4.0% mainly attributable to price declines recorded by most stocks due to increased foreign investor sell-offs as they exit perceived higher risk markets coupled with the rise in interest rates in the US which has seen investors switch to the fixed income market as opposed to the effects of the elections cycle. The charts below indicate the historical P/E and dividend yields of the market:
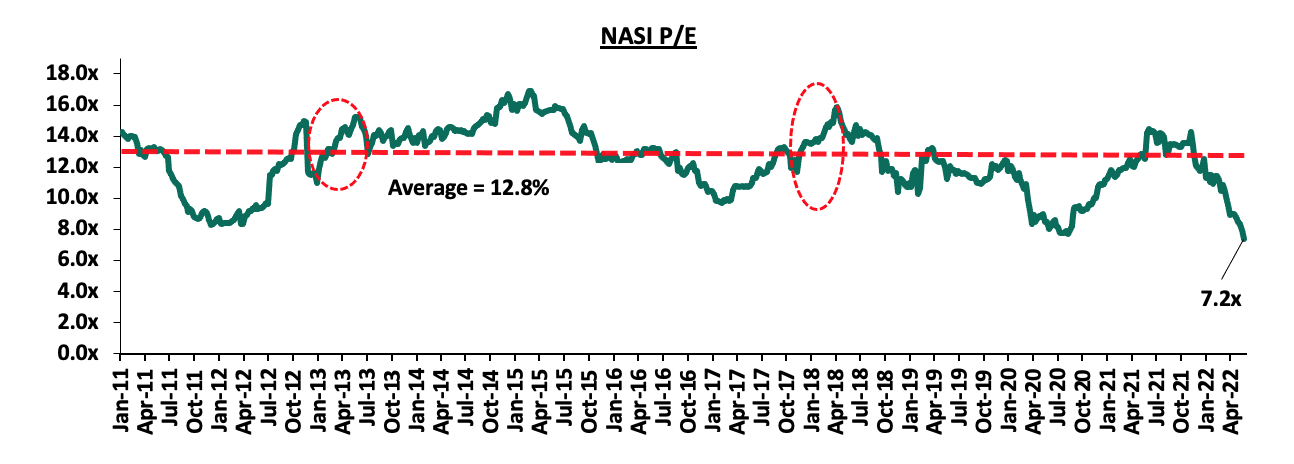
Source: Bloomberg
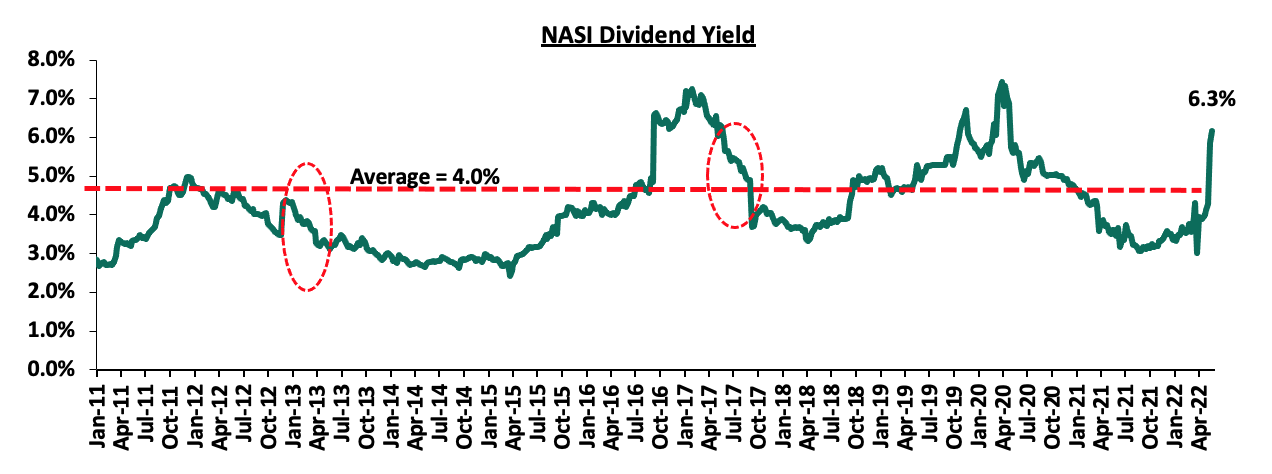
Source: Nairobi Securities Exchange (NSE)
- Real Estate Market
According to the Cytonn Annual Markets Review 2017, the average investor returns softened by 11.3% points to 14.5% in 2017, from 25.8% realized in 2016, due to the shaky general elections effects that resulted to a declined demand in properties. However, the Kenyan real estate sector has been witnessing tremendous growth and developments over the past years having recorded a 6.7% growth in 2021, a 2.6% points increase from 4.1% in 2020, according the Kenya National Bureau of Statistics Economic Survey 2022. The sector’s growth has been influenced by factors such as; i) improved infrastructure developments opening areas for investments, ii) tourism activities boosting the hospitality sector performance, iii) government’s continued focus on the affordable housing initiative, and, iv) aggressive expansion of local and international retailers, among others. Despite this, there are challenges that continue to hinder performance of the sector like financial constraints, and, oversupply in select Real Estate sectors such the commercial office and retail sectors. Also, being that this is an election year, there exist looming qualms that are expected to slightly weigh down the optimum performance and activities of the property sector. This is so because during the election years, the sector has always recorded a correction in performance. The graph below shows performance of Real Estate sector GDP growth rates in the last three election years;
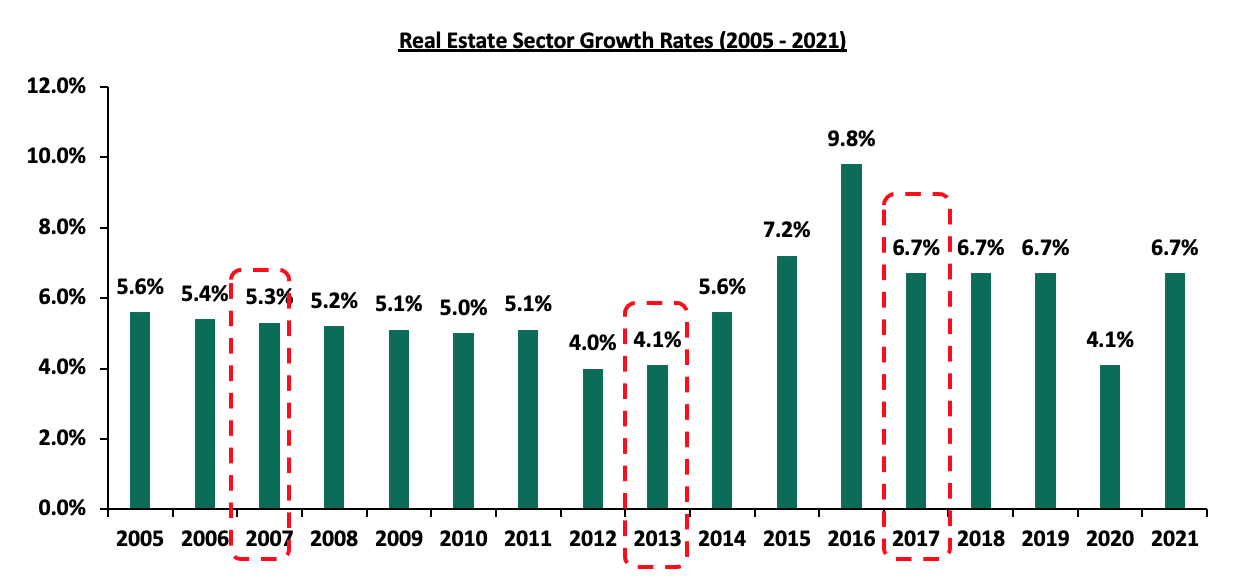
Source: Kenya National Bureau of Statistics
Below are some of the election impacts associated with key property stakeholders;
- Constrained Performance of the General Property Sector
Some property tenants, particularly ones that are based in areas most prone to election ferocities, are expected to streamline or halt their operations amidst the uncertainties. Moreover, property seekers are also expected to avoid hotspot areas or withhold their search plans as they await the outcome of the elections. In turn, both incidences are expected to affect the overall occupancy rates of various properties and lowered returns to property owners.
Additionally, with property tenants and seekers expected to avoid certain areas, coupled with the expected shaky economic environment, some if not most landlords are expected to provide property concessions. This entail provision of rent and price discounts by the landlords to tenants or buyers, in order to attract or retain the existing property occupiers. With this, we expect a correction in property rates with the incoming elections.
- Inadequate Credit Access
With the expected chanciness brought about by the elections and the unclear impacts on the property sector, developers are expected to slow down their construction plans all through the election period until the high politicking levels die down. Additionally, commercial banks will tighten their lending terms towards developers, due to the economic uncertainties that will result to high loan default rates. In support of this, Central Bank of Kenya’s Quarterly Economic Review Report October-December 2021 highlights that the Gross Non Performing Loans in the Real Estate sector increased by 7.9% to Kshs 74.7 bn in Q4’2021, from Kshs 69.2 bn recorded in Q3’2021. On a YoY basis, the performance represented a 21.6% increase from Kshs 61.4 bn realized in Q4’2020, as a result of high default rates. The graph below shows Real Estate non-performing loans compared to the total Real Estate loan book from 2016-2021;
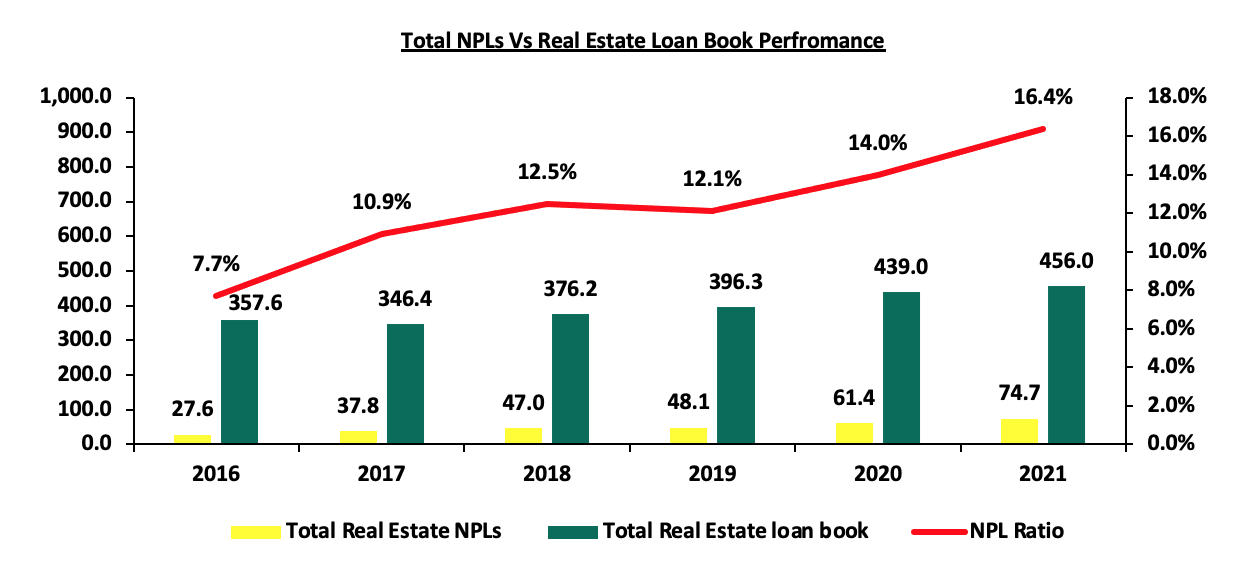
Source: Central Bank of Kenya
- Roll Out of Social Projects
Being that this is an election year, there are various social projects that have been rolled out such as roads, water, and, sewer network projects. This is so because various politicians are known to initiate and implement projects while seeking to get elected or re-elected, by selling their track records. By this, the Real Estate sector gets to benefit through increased investments promoting developments and accessibility in the long term. For example, the total amount of money that was expended towards the development of roads in FY’2016/17 increased by 40.2% to Kshs 173.7 bn, from Kshs 123.9 bn in FY’2015/16, according to the Kenya National Bureau of Statistics. The graph below shows the Kenyan government’s expenditure on roads in the last eight years;
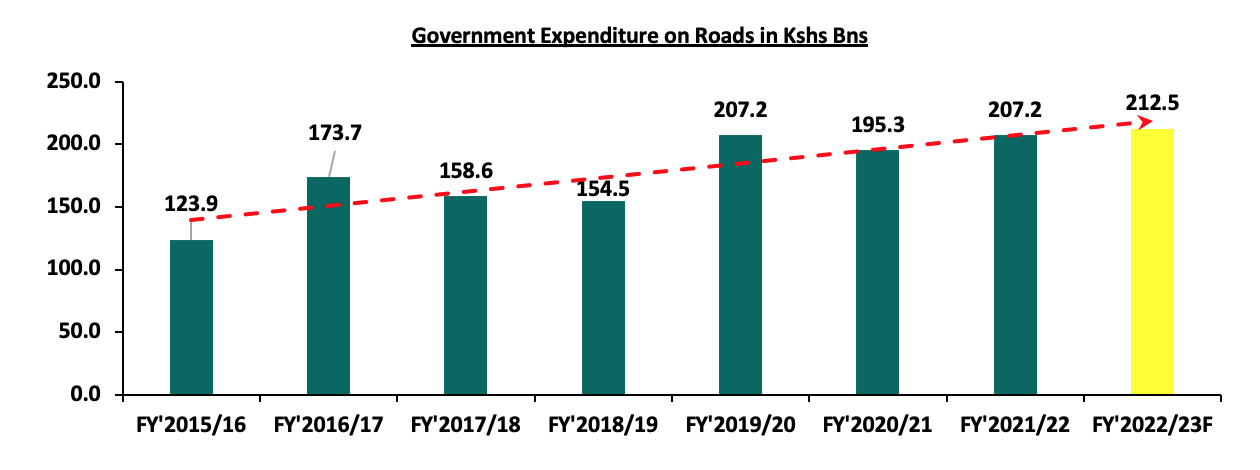
Source: Kenya National Bureau of Statistics
- Increased Employment Rate in the Construction Sector
During the election periods, politicians create employment opportunities, particularly informal employment in various economic sectors aimed at increasing their popularity and winning chances. In turn, employment rates have always increased during these periods, and as such benefiting the various economic sectors such as the Real Estate sector. According to the Kenya National Bureau of Statistics, employment index in the construction sector increased to 277.1 in 2017 from 269.7 recorded in 2016, signaling the increased employment rate in the sector.
Section 3: Outlook given the Historical Performance and the Current Macro-economic Environment
In this section, we shall give our expectations on the effects of elections on the investment environment with regards to the fixed income market, the equities market and the real estate market;
- Fixed Income Market
Rates in the fixed income market have been on an upward trajectory partly on the back of the heightened perceived risk occasioned by the emergence of new COVID-19 variants and the upcoming 2022 elections. In our view, the rise in yields on the government papers is expected to be sustained as the government continues to offer attractive yields on the papers and bonds to facilitate the payment of pending maturities and to meet its borrowing targets for FY’2021/2022. Below is a summary of the expected performance of the key macro-economic indicators;
|
Measure |
Sentiment |
Outlook |
|
GDP |
|
Neutral |
|
Government Borrowing |
|
Negative |
|
Interest Rates |
|
Neutral |
- Equities Market
The Kenyan equities market has been on a downward trajectory in 2022 having declined by 22.3% for NASI on a year to date basis. The decline is mainly attributable to losses recorded by large cap stocks such as Safaricom, of 30.7%, Equity and KCB which have both declined by 16.6% as well as DTB-K and ABSA which have declined by 16.0% and 14.5%, respectively. Below is a summary of the expected performance of the key indicators of the equities market;
|
Measure |
Sentiment |
Outlook |
|
NASI Performance |
|
Neutral |
|
Valuations |
|
Neutral* |
We expect market valuations for most companies to keep declining in the short term and offer great entry points for investors especially to companies with stable and good fundamentals. We have a Neutral outlook on the valuations here as the current and expected decline in prices is not primarily driven by the upcoming general elections, but by foreign capital outflows in the emerging markets as investors seek safer havens on the back of the uncertainties occasioned by the emergence of new COVID-19 variants and the persistent geopolitical pressures. (The average foreign investors’ market participation was 54.9% in Q1’2022).
- Real Estate Markets
The Real Estate sector has registered increased activities so far in 2022 and remains an attractive investment class. However, as 2022 is an election year, we expect a slow-down in market prices and sales volumes since investors and prospective buyers are expected to adopt a wait and see approach. The impact is expected to be temporary and the market is likely to stabilize on the back of relatively strong GDP growth which is expected to grow by 6.1% in 2022. The table below summarizes the expected performance of the key market determinants;
|
Measure |
Sentiment |
Outlook |
|
Performance |
|
Neutral |
|
Credit Access |
|
Negative |
|
Project Developments |
|
Neutral |
|
Employment Rate |
|
Positive |
Section 4: Conclusion and our view Going Forward
Economic development and investments performance is largely depended on continuity and a stable macro-economic environment which significantly determine the investors' sentiments. In our view, a peaceful transition will be key in maintaining the current trend of economic recovery given that the economy is still recovering from the adverse effects of COVID-19. As such, we maintain a general ‘NEUTRAL’ outlook on the effects of elections on the investment environment as we expect the government to fulfil its commitment to a politically stable business environment during and after elections. However, we are of the view that the investment markets are driven by other external factors such as existing geo-political pressures, emergence of new COVID-19 variants, rising inflation rates as well as increasing yields in developed countries as opposed to the effects of the general elections.
Disclaimer: The views expressed in this publication are those of the writers where particulars are not warranted. This publication, which is in compliance with Section 2 of the Capital Markets Authority Act Cap 485A, is meant for general information only and is not a warranty, representation, advice or solicitation of any nature. Readers are advised in all circumstances to seek the advice of a registered investment advisor.

- Talk to us
- Kenya
- P.O Box 20695 - 00200, Nairobi, Kenya
- Cell +254709101200
- Tel +254709101200
- WhatsApp +254741676635
- United States
- +254709101200
- DOWNLOAD OUR APP
-


- Kenya
- 8th Floor, Pinetree Plaza, Kaburu Drive, Ngong Road, Nairobi, Kenya
- USA
- Suite 1150, 1775 Eye Street NW, USA, Washington DC 20006, USA
- Investments
- High Yield
- Private Equity
- Real Estate
- Real Estate
- RiverRun Estates
- Cytonn Towers
- The Ridge
- Taraji Heights
- The Alma