Fintech Amid COVID-19 & Cytonn Weekly #34/2020
By Research Team, Aug 23, 2020
Executive Summary
Fixed Income
During the week, T-bills remained undersubscribed, with the subscription rate coming in at 40.4% down from 92.8% the previous week, mainly due to investors’ preference to participate in the primary bond market where there was a tap-sale for the 11-year amortized infrastructure bond namely, IFB1/2020/11, which recorded a performance rate of 145.0%. We are projecting the y/y inflation rate for August 2020 to increase slightly to the ranges of 4.8% - 5.1%, compared to the 4.4% recorded in July, mainly attributable to stable food price although we expect pressure to emanate from the increasing fuel prices;
Equities
During the week, the equities market recorded mixed performance, with NASI and NSE 25 recording gains of 1.8% and 2.5%, respectively, while NSE 20 recorded losses of 1.1%, taking their YTD performance to losses of 20.8%, 26.5%, and 35.1%, for NASI, NSE 25 and NSE 20, respectively. The NASI performance was driven by gains recorded by large-cap stocks, with the highest gains being recorded in Equity Group, KCB and ABSA, which gained by 14.6%, 10.1%, and 7.9%, respectively. During the week, the Nairobi Stock Exchange (NSE) reviewed the constituent counters of the NSE 20 and NSE 25, incorporating the inclusion of Stanbic Holdings and Jubilee Holdings PLC in the NSE 20 share index and NSE 25 share Index, respectively, and dropping Kenya Airways, effective 14th August 2020. During the week, Equity Group released its H1’2020 financial results, recording a 24.4% decline in its core earnings per share to Kshs 2.4 from Kshs 3.2 in H1’2019;
Real Estate
During the week, the Kenya Mortgage Refinance Company (KMRC) announced plans to issue a green bond by the end of 2021 with the aim of raising funds. Industrial and Development Corporation (ICDC), a Kenyan government-owned development finance institution, completed the purchase of Development Bank-owned Finance House building for Kshs 1.2 bn. In the retail sector, Tuskys closed down its Kisumu branch in United Mall due to rent arrears totaling to Kshs 26.0 mn while Massmart, a South Africa retail giant, opened its 4th outlet in Kenya;
Focus of the Week
In this week’s topical, we will focus on the Fintech industry in Kenya, where we will look into its growth so far, having considered the ongoing pandemic and how the general public can benefit from the industry, and factors to consider;
- Weekly Rates:
- Cytonn Money Market Fund closed the week at a yield of 10.72%. To invest, just dial *809#;
- Cytonn High Yield Fund closed the week at a yield of 12.83% p.a. To invest, email us at sales@cytonn.com and to withdraw the interest you just dial *809#
- For an exclusive tour of Cytonn’s real estate developments, visit: Sharp Investor's Tour and for more information, email us at sales@cytonn.com;
- We continue to offer Wealth Management Training daily, from 9:00 am to 11:00 am, through our Cytonn Foundation. The training aims to grow financial literacy among the general public. To register for any of our Wealth Management Training, click here;
- For Pension Scheme Trustees and members, we shall be having different industry players talk about matters affecting Pension Schemes and the pensions industry at large. Join us every Wednesday from 9:00 am to 11:00 am for in-depth discussions on matters pension;
- Cytonn continues to inform the market on the importance of retirement planning and issues affecting the pensions industry. In this week's article, we focus on Retirement Readiness here;
- If interested in our Private Wealth Management Training for your employees or investment group, please get in touch with us through wmt@cytonn.com;
- For recent news about the company, see our news section here;
- We have 10 investment-ready projects, offering attractive development and buyer targeted returns. See further details here: Summary of Investment-ready Projects.
Money Markets, T-Bills & T-Bonds Primary Auction:
During the week, T-bills remained undersubscribed, with the subscription rate coming in at 40.4% down from 92.8% the previous week, mainly due to investors’ preference to participate in the primary bond market where there was a tap-sale for the 11-year amortized infrastructure bond namely, IFB1/2020/11, which recorded a performance rate of 145.0%. The yield on the 91-day paper increased marginally to 6.3%, from 6.2% recorded the previous week, while that of the 182-day paper and 364-day papers remained unchanged at 6.6% and 7.5%, respectively. The acceptance rate increased to 100.0%, from 83.8% recorded the previous week, with the government accepting Kshs 9.6 bn worth of bids received.
On the primary bond auction, the period of sale for the recently opened Infrastructure bond, IFB1/2020/11 with an effective tenor of 11-years, closed on 19th August 2020. The issue was oversubscribed in line with our expectations, with the average subscription rate coming in at 145.0%, as the government received bids worth Kshs 101.5 bn, higher than the Kshs 70.0 bn offered, mainly attributable to the high liquidity in the money markets, and the attractive tax-free nature of the bond. The market weighted average rate for the bond came in at 11.4%, which was in-line with our expectations of 11.4%-11.6%. The government rejected high bids only accepting Kshs 78.6 bn out of the Kshs 101.5 bn worth of bids received, translating to an acceptance rate of 77.5%.
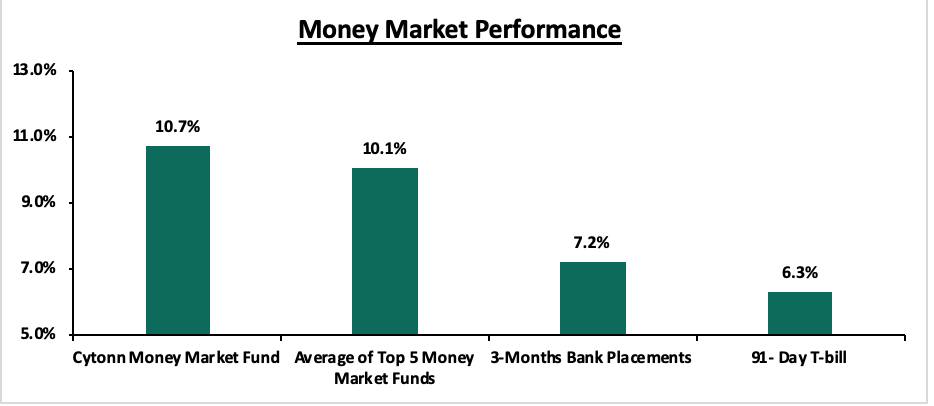 In the money markets, 3-month bank placements ended the week at 7.2% (based on what we have been offered by various banks), while the yield on the 91-day T-bill increased marginally to 6.3%, from 6.2% recorded the previous week. The average yield of Top 5 Money Market Funds increased marginally to 10.1% from 10.0% recorded the previous week. The yield on the Cytonn Money Market also increased marginally to close at 10.7%, from 10.6% recorded the previous week.
Liquidity:
The money markets remained liquid during the week, despite the average interbank rate increasing to 2.6%, from 1.9% recorded the previous week, mainly supported by government payments and maturing TADS of Kshs 811.0 bn. (TADs are used when the securities held by the CBK for Repo purposes are exhausted or when CBK considers it desirable to offer longer tenor options). The average interbank volumes increased by 12.2% to Kshs 13.8 bn, from Kshs 12.3 bn recorded the previous week. The commercial banks’ excess reserves came in at Kshs 23.2 bn.
Kenya Eurobonds:
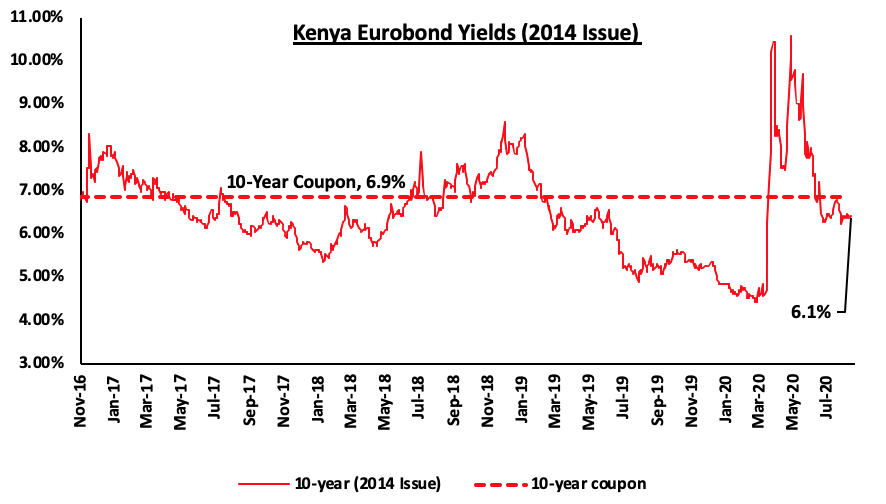
According to Reuters, the yield on the 10-year Eurobond issued in June 2014 remained unchanged at 6.1%.
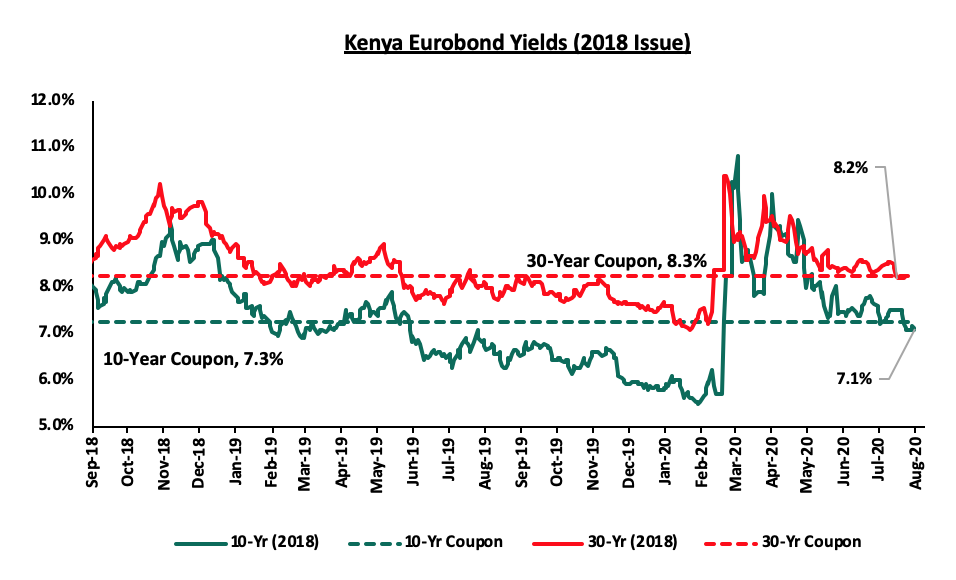
The yields on the 10-year and 30-year Eurobonds issued in 2018 both remained unchanged at 7.1% and 8.2%, respectively.
Kenya Shilling:
During the week, the Kenya Shilling appreciated by 0.3% against the US Dollar to close the week at Kshs 108.0, from Kshs 108.3, recorded the previous week, attributable to slower dollar demand from oil and merchandise importers. On an YTD basis, the shilling has depreciated by 6.6% against the dollar, in comparison to the 0.5% appreciation in 2019. We expect continued pressure on the shilling due to:
- Demand from merchandise and energy sector importers as they beef up their hard currency positions,
- A deteriorating current account position, with the current account deficit deteriorating by 10.2% during Q1’2020, to Kshs 110.9 bn, from Kshs 100.6 bn recorded in Q1’2019 attributable to;
- 3.0% decline in the secondary income balance (transfers recorded in the balance of payments whenever an economy provides or receives goods, services, income or financial items), to Kshs 124.1 bn, from Kshs 128.0 bn in Q1’2019, and,
- A 67.0% decline in the services trade balance (the difference between the imports and exports of services) to Kshs 20.4 bn, from Kshs 61.9 bn.
Weekly Highlight:
During the week, the National Treasury gazetted the statement of actual revenue collection and net exchequer issues in the month of July 2020. According to the release, ordinary revenue collection came in at Kshs 95.9 bn, 11.0% lower than the Kshs 107.8 bn recorded last year. The slump is largely attributable to the recent macroeconomic headwinds where a general slump in economic activity is expected. Other key highlights from the statement include;
- Revenue collection for the year July 2019 to June 2020 reached a new high of Kshs 1,607.0 bn, 1.7% higher than the Kshs 1,580.0 bn recorded previously,
- The Kenya Revenue Authority managed to collect Kshs 97.1 bn in form of agency fees, which includes road maintenance levy, airport revenue, aviation revenue and petroleum development fund among others, and,
- Exchequer revenue grew by 2.2% to Kshs 1,510.0 bn, from the Kshs 1,477.0 bn recorded in FY2018/19.
Inflation Projections
We are projecting the y/y inflation rate for August 2020 to increase marginally to between 4.8% - 5.1%, compared to the 4.4% recorded in July since the gains from the stable food prices are watered down by the increasing fuel prices. Specifically:
- Petrol and diesel prices having increased by 3.3% and 3.0%, respectively. The increase in pump prices is likely to have upward pressure on the transport index which holds a weighting of 8.7%. Additionally, we expect the increased fuel prices to not only affect the transport index, but also have a trickle-down effect on the prices of other commodity basket food prices due to higher transport costs,
- We also expect pressures to be experienced in the housing, water, electricity, gas and other fuels index given the 27.8% increase in the price of kerosene, and,
- Food prices have remained relatively stable during the month given the favorable weather and an improvement in agricultural output.
Rates in the fixed income market have remained relatively stable due to the high liquidity in the money markets, coupled with the discipline by the Central Bank as they reject expensive bids. The government is 141.1% ahead of its prorated borrowing target of Kshs 74.8 bn having borrowed Kshs 180.3 bn. In our view, the government will not be able to meet their revenue collection targets of Kshs 1.9 tn for FY’2020/2021 because of the current subdued economic performance in the country brought about by the spread of COVID-19, therefore leading to a larger budget deficit than the projected 7.5% of GDP, ultimately creating uncertainty in the interest rate environment as additional borrowing from the domestic market will be required to plug in the deficit. Owing to this uncertain environment, our view is that investors should be biased towards short-term to medium-term fixed income securities to reduce duration risk.
Market Performance
During the week, the equities market recorded mixed performance, with NASI and NSE 25 recording gains of 1.8% and 2.5%, respectively, while NSE 20 recorded a 1.1% loss, taking their YTD performance to losses of 20.8%, 26.5%, and 35.1%, for NASI, NSE 25 and NSE 20, respectively. The NASI performance was driven by gains recorded by large-cap stocks, with the highest gains being recorded in Equity Group, KCB and ABSA, which gained by 14.6%, 10.1%, and 7.9%, respectively. The gains were however weighed down by declines recorded by Bamburi and NCBA of 11.9% and 11.4%, respectively.
Equities turnover increased by 18.6% during the week to USD 18.1 mn, from USD 15.3 mn recorded the previous week, taking the YTD turnover to USD 994.6 mn. Foreign investors remained net sellers during the week, with a net selling position of USD 0.9 mn, from a net selling position of USD 1.1 mn recorded the previous week, taking the YTD net selling position to USD 268.9 mn.
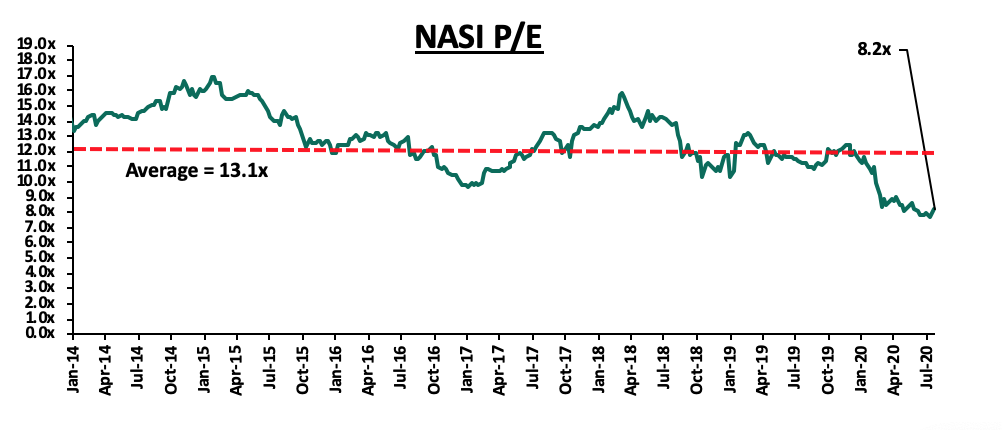
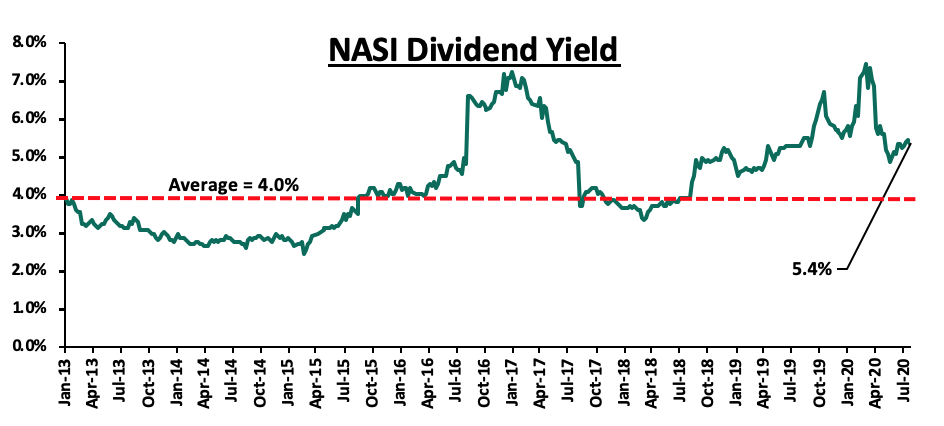
The market is currently trading at a price to earnings ratio (P/E) of 8.2x, 37.1% below the 11-year historical average of 13.0x. The average dividend yield is currently at 5.4%, 0.1% points below the 5.5% recorded the previous week and 1.4% points above the historical average of 4.0%. The decline in dividend yield is attributable to price gains recorded by most stocks. Key to note, the dividend yield has also been weighed down by the decision by most companies to withhold dividend payments. With the market trading at valuations below the historical average, we believe there are pockets of value in the market for investors with higher risk tolerance and are willing to wait out the pandemic. The current P/E valuation of 8.2x is 5.1% above the most recent valuation trough of 7.7x experienced in the first week of August 2020. The charts below indicate the historical P/E and dividend yields of the market.
Weekly Highlight
During the week, the Nairobi Stock Exchange (NSE) reviewed the constituent counters of the NSE 20 and NSE 25, incorporating the inclusion of Stanbic Holdings and Jubilee Holdings PLC in the NSE 20 share index and NSE 25 share Index respectively, and dropping Kenya Airways, effective 14th August 2020. NSE periodically reviews the indices to ensure they give an accurate representation of the performance of the market. NSE 20 represents the top 20 performing counters listed in the NSE while NSE 25 represents the top 25 companies listed on the NSE. NSE 20 Share Index is price weighted using the mean of the top 20 best performing counters while NSE 25 Share Index uses a market capitalization weighted index that represents the performance of companies listed on NSE and as such, providing investors with a comprehensive benchmark to measure the performance of the Kenyan securities market. The table below highlights the criteria used in the selection of companies in the NSE 20 and NSE 25;
|
Criteria Used for selection of companies in the NSE 20 and NSE 25 |
||
|
# |
NSE 20 |
NSE 25 |
|
1 |
The company must have a minimum Market Capitalization of Kshs 20.0 mn |
The company must have a minimum Market Capitalization of Kshs 1.0 bn |
|
2 |
The company should be blue chip with superior profitability and dividend record. (A blue chip is a company with a track record of superior earnings and a dividend record) |
The company should be blue chip with superior profitability and dividend record. (A blue chip is a company with a track record of superior earnings and a dividend record) |
|
3 |
The company must have at least 20.0% of its shares quoted on the NSE |
The company must have at least 20.0% of its shares quoted on the NSE |
|
4 |
The market capitalization, shares traded, deals/liquidity and turnover during the period under review are weighed in the ratio of 4:3:2:1 respectively |
The company’s shares must have a primary listing on the NSE |
|
5 |
Must have been continuously quoted for a least 1 year |
Must have been continuously quoted for a least 1 year |
Earnings Releases:
During the week, Equity Group released its H1’2020 financial results. Below is a summary of their performance:
|
Equity Group H1’2020 Key Highlights |
|||
|
Balance Sheet |
|||
|
Balance Sheet Items |
H1’2019 |
H1’2020 |
y/y change |
|
Government Securities |
145.9 |
181.2 |
24.2% |
|
Net Loans and Advances |
320.9 |
391.6 |
22.0% |
|
Total Assets |
638.7 |
746.5 |
16.9% |
|
Customer Deposits |
458.6 |
543.9 |
18.6% |
|
Deposits per Branch |
1.6 |
1.8 |
9.9% |
|
Total Liabilities |
535.9 |
623.1 |
16.3% |
|
Shareholders’ Funds |
101.8 |
122.2 |
20.1% |
|
Income Statement |
|||
|
Income Statement Items |
H1’2019 |
H1’2020 |
y/y change |
|
Net Interest Income |
21.1 |
24.6 |
16.9% |
|
Net non-Interest Income |
16.5 |
14.4 |
(13.0%) |
|
Total Operating income |
37.6 |
39.0 |
3.8% |
|
Loan Loss provision |
(0.9) |
(8.0) |
773.4% |
|
Total Operating expenses |
(20.6) |
(27.1) |
31.1% |
|
Profit before tax |
17.0 |
12.0 |
(29.5%) |
|
Profit after tax |
12.0 |
9.1 |
(24.4%) |
|
Core EPS |
3.2 |
2.4 |
(24.4%) |
|
Key Ratios |
|||
|
Ratios |
H1’2019 |
H1’2020 |
% point change |
|
Yield on Interest Earning Assets |
11.0% |
10.8% |
(0.2%) |
|
Cost of Funding |
2.6% |
2.9% |
0.3% |
|
Net Interest Margin |
8.5% |
8.1% |
(0.4%) |
|
Non-Performing Loans (NPL) Ratio |
8.8% |
11.0% |
2.2% |
|
NPL Coverage |
44.6% |
48.5% |
3.9% |
|
Cost to Income with LLP |
54.8% |
69.3% |
14.5% |
|
Loan to Deposit Ratio |
70.0% |
72.0% |
2.0% |
|
Cost to Income Without LLP |
52.4% |
48.8% |
(3.6%) |
|
Return on Average Assets |
3.5% |
2.8% |
(0.7%) |
|
Return on Average Equity |
22.1% |
17.5% |
(4.6%) |
Key take-outs from the earnings release include;
- Core earnings per share declined by 24.4% to Kshs 2.4, from Kshs 3.2 in H1’2019, worse than our projections of a 15.2% decline to Kshs 2.7. The performance was driven by a 31.1% increase in total operating expenses, outpacing the 3.8% growth recorded in total operating income. The variance in core earnings per share growth against our expectations was largely due to the 773.4% rise in Loan Loss Provisions (LLPs) to Kshs 8.0 bn, from Kshs 0.9 bn in H1’2019, which was higher than our expectation of a 389.3% increase to Kshs 4.5 bn,
- Interest income rose by 18.5% to Kshs 32.8 bn, from Kshs 27.7 bn in H1’2019. This was driven by a 20.8% increase in interest income on loans and advances to Kshs 22.5 bn, from Kshs 18.6 bn in H1’2019, coupled with a 14.8% increase in interest income on government securities to Kshs 9.8 bn, from Kshs 8.5 bn in H1’2019. The slightly stronger growth in interest income on loans as compared to interest from government securities is indicative of the benefits accruing to Equity Group Holding’s strategy to increase lending to the private sector, focusing on Small and Medium Enterprises,
- The yield on interest-earning assets declined marginally to 10.8%, from 11.0% in H1’2019, due to the faster 18.1% growth in average interest- earning assets, which outpaced the 16.7% growth in trailing interest income,
- Interest expenses rose by 23.6% to Kshs 8.2 bn from Kshs 6.6 bn in H1’2019, following the 17.7% increase in the interest expense on customer deposits to Kshs 6.1 bn, from Kshs 5.2 bn in H1’2019, coupled with a 71.4% increase in other interest expenses to Kshs 1.8 bn, from Kshs 1.0 bn in H1’2019. Cost of funds rose to 2.9%, from 2.6% in H1’2019, owing to the faster 23.6% increase in interest expense, which outpaced the 16.1% increase in average interest-bearing liabilities to Kshs 558.8 bn, from Kshs 480.4 bn in H1’2019,
- Net Interest Margin (NIM) on the other hand, declined to 8.1% from 8.5% in H1’2019, owing to the faster 18.1% growth in average interest earning assets which outpaced the 16.9% growth in Net Interest Income (NII),
- Total operating expenses rose by 31.1% to Kshs 27.1 bn, from Kshs 20.6 bn in H1’2019, largely driven by a 773.4% increase in Loan Loss Provisions (LLP) to Kshs 8.0 bn, from Kshs 0.9 bn in H1’2019, on the back of the subdued business environment, coupled with a 13.0% rise in staff costs to Kshs 6.7 bn, from Kshs 6.0 bn in H1’2019,
- The balance sheet recorded an expansion as total assets increased by 16.9% to Kshs 746.5 bn, from Kshs 638.7 bn in H1’2019. The growth was supported by a 24.2% increase in the government securities to Kshs 181.2 bn, from Kshs 145.9 bn, coupled with a 22.0% increase in loan book to Kshs 391.6 bn from Kshs 320.9 bn in H1’2019. The growth was subdued by a 1.5% decrease in placements to Kshs 44.5 bn, from Kshs 45.2 bn in H1’2019,
- Total liabilities rose by 16.3% to Kshs 623.1 bn from Kshs 535.9 bn in H1’2019, driven by an 18.6% increase in customer deposits to Kshs 543.9 bn, from Kshs 458.6 bn in H1’2019. Deposits per branch increased by 9.9% to Kshs 1.8 bn, from Kshs 1.6 bn in H1’2019, with the number of branches increasing by 9 to 300 branches in H1’2020, from 291 in H1’2019. Borrowings recorded a growth of 11.3% to Kshs 57.2 bn, from Kshs 51.4 bn in H1’2019, and,
- Gross Non-Performing Loans (NPLs) rose by 55.8% to Kshs 45.6 bn in H1’2020, from Kshs 29.2 bn in H1’2019. Consequently, the NPL ratio deteriorated to 11.0% in H1’2020, from 8.8% in H1’2019, attributable to a faster 55.8% growth in Non-Performing Loans, which outpaced the 23.9% growth in gross loans,
For a comprehensive analysis, please see our Equity Group H1’2020 Earnings Note
The table below highlights the performance of the banks that have released so far, showing the performance using several metrics, and the key take-outs of the performance.
|
Bank |
Core EPS Growth |
Interest Income Growth |
Interest Expense Growth |
Net Interest Income Growth |
Net Interest Margin |
Non-Funded Income Growth |
NFI to Total Operating Income |
Growth in Total Fees & Commissions |
Deposit Growth |
Growth in Government Securities |
Loan to Deposit Ratio |
Loan Growth |
Return on Average Equity |
|
KCB |
(40.4%) |
23.2% |
25.7% |
22.3% |
7.6% |
6.0% |
31.0% |
4.3% |
34.6% |
54.5% |
73.8% |
17.0% |
16.0% |
|
Stanbic |
(31.2%) |
(4.8%) |
(3.1%) |
(0.7%) |
4.5% |
(18.8%) |
44.0% |
(36.7%) |
20.6% |
(13.4%) |
81.9% |
32.8% |
10.9% |
|
Equity |
(24.4%) |
18.5% |
23.6% |
16.9% |
8.1% |
(13.0%) |
36.9% |
(10.8%) |
18.6% |
24.2% |
72.0% |
22.0% |
17.5% |
|
Co-op |
(3.6%) |
6.8% |
(4.4%) |
11.6% |
8.4% |
(5.1%) |
34.3% |
(42.5%) |
18.9% |
28.0% |
70.8% |
19.4% |
18.6% |
|
H1'20 Mkt Weighted Average* |
(26.4%) |
15.7% |
16.5% |
16.1% |
7.7% |
(5.7%) |
35.1% |
(14.1%) |
24.2% |
31.6% |
73.3% |
20.8% |
16.6% |
|
H1'19Mkt Weighted Average** |
9.0% |
3.7% |
5.3% |
3.8% |
7.70% |
16.5% |
37.2% |
12.7% |
8.6% |
12.1% |
73.8% |
9.8% |
19.3% |
|
*Market-cap-weighted as at 21/08/2020 |
|||||||||||||
|
**Market-cap-weighted as at 06/09/2019 |
|||||||||||||
Key takeaways from the table above include:
- Four banks have released their H1’2020 financial results, recording a (26.4%) average decline in core Earnings Per Share (EPS), compared to a growth of 9.0% in H1’2019 for the entire listed banking sector,
- The banks that have released results have recorded a deposit growth of 24.2%, faster than the 8.6% growth recorded in H1’2019. Interest expense, on the other hand, grew faster by 16.5%, compared to 5.3% in Q1’2019. Cost of funds, however, declined, coming in at a weighted average of 2.9% in H1’2020, owing to the faster growth in average interest-bearing liabilities, an indication that the listed banks were able to mobilize cheaper deposits,
- Average loan growth came in at 20.8%, which was faster than the 9.8% recorded in H1’2019, but slower than the 31.6% growth in government securities, an indication of the banks preference in investing in Government securities as opposed to lending during the COVID-19 pandemic. Government securities recorded a growth of 31.6% y/y, which was faster compared to the loans, and the 12.1% growth recorded in H1’2019,
- Interest income rose by 15.7%, compared to a growth of 3.7% recorded in H1’2019. The faster growth in interest income may be attributable to the 20.8% growth in loans and increased allocation to government securities. Despite the rise in interest income, the yield on interest earning assets declined to 10.1% due to the faster 21.1% growth in average interest earning assets which outpaced the 15.7% growth in interest income. Consequently, the Net Interest Margin (NIM) now stands at 7.66%, compared to the 7.70% recorded in H1’2019 for the whole listed banking sector, and,
- Non-Funded Income declined by 5.7% y/y, slower than 16.5% growth recorded in H1’2019. The performance in NFI was on the back of declined growth in fees and commission of 14.1%, which was slower than the 12.7% growth recorded in H1’2019. The poor performance of the growth in fees and commission can be attributed to the recent waiver on fees on mobile transactions below Kshs 1,000 and the free bank-mobile money transfer. Banks with a large customer base who rely heavily on mobile money transactions are likely to take the biggest hit.
Universe of Coverage:
|
Banks |
Price at 14/08/2020 |
Price at 21/08/2020 |
w/w change |
YTD Change |
Year Open |
Target Price* |
Dividend Yield |
Upside/ Downside** |
P/TBv Multiple |
Recommendation |
|
Diamond Trust Bank*** |
67.3 |
66.0 |
(1.9%) |
(39.4%) |
109.0 |
136.3 |
3.9% |
110.4% |
0.3x |
Buy |
|
NCBA*** |
22.8 |
20.2 |
(11.4%) |
(45.2%) |
36.9 |
32.1 |
1.0% |
59.7% |
0.6x |
Buy |
|
I&M Holdings*** |
44.7 |
43.0 |
(3.7%) |
(20.4%) |
54.0 |
66.4 |
5.1% |
59.5% |
0.7x |
Buy |
|
KCB Group*** |
30.6 |
33.7 |
10.1% |
(37.7%) |
54.0 |
46.3 |
9.9% |
47.5% |
0.8x |
Buy |
|
Co-op Bank*** |
10.9 |
10.5 |
(3.2%) |
(35.8%) |
16.4 |
14.3 |
8.4% |
44.5% |
0.8x |
Buy |
|
ABSA Bank*** |
9.1 |
9.8 |
7.9% |
(26.7%) |
13.4 |
11.7 |
12.0% |
31.6% |
1.2x |
Buy |
|
Standard Chartered*** |
151.0 |
150.0 |
(0.7%) |
(25.9%) |
202.5 |
177.5 |
7.8% |
26.1% |
1.2x |
Buy |
|
Equity Group*** |
28.8 |
33.0 |
14.6% |
(38.4%) |
53.5 |
41.1 |
0.0% |
24.7% |
0.9x |
Buy |
|
Stanbic Holdings |
73.5 |
74.5 |
1.4% |
(31.8%) |
109.3 |
84.9 |
9.0% |
23.0% |
0.7x |
Buy |
|
HF Group |
4.0 |
4.1 |
1.8% |
(37.0%) |
6.5 |
3.9 |
0.0% |
(3.1%) |
0.2x |
Sell |
|
*Target Price as per Cytonn Analyst estimates **Upside/ (Downside) is adjusted for Dividend Yield ***For Disclosure, these are banks in which Cytonn and/ or its affiliates are invested in |
||||||||||
We are “Neutral” on equities for investors because, despite the sustained price declines, which have seen the market P/E decline to below its historical average presenting investors with attractive valuations in the market, the economic outlook remains grim.
- Residential Sector
During the week, Kenya Mortgage Refinance Company (KMRC), a treasury backed lender, announced plans to issue a green bond(details are yet to disclosed) by the end of next year with the aim of raising funds for lending to retail lenders for onward lending to their customers. The funds raised from the bond will add to the existing pool of approximately Kshs 37.2 bn, including Kshs 2.2 bn in equity capital, Kshs 25.0 bn committed by the World Bank and Kshs 10.0 bn from African Development Bank. The KMRC bond will be placed privately with institutional investors, fund managers and pension funds, but is currently not contemplated to be offered to the public. A green bond is a type of fixed-income instrument that is specifically issued to raise money for positive climate and environmental projects. The green bond market was launched in Kenya in February 2019, through the Green Bonds Programme - Kenya, which is a joint initiative between the Central Bank of Kenya, Nairobi Securities Exchange, Climate Bonds Initiative and Kenya Bankers Association, with several other organizations endorsing the program. The KMRC green bond will be the second of its kind in Kenya, with real estate developer Acorn Holdings and private equity fund Helios having issued the first green bond in Kenya raising Kshs 4.3 bn of the targeted Kshs 5.0 bn in January 2020; the rate at issuance was 12.3%. The main advantage of green bonds is that they attract a wide range of investors seeking to positively impact the environment and allows traditional investors like pension funds to diversify their portfolio. The issuing of the green bond by KMRC will be a step in the right direction towards raising of funds from the capital markets to finance the facility, which is set to lend money to local financial institutions at an annual interest rate of 5.0%, enabling them to issue home loans at 7.0%, 6.0% points lower than the market rate of approximately 13.0%. However, in our view, to be able to lend at 5.0%, the green bond will have to be issued at a relatively low rate which is likely to make it unattractive to investors noting that Acorn’s green bond was issued at 12.3% and attracted 85.0% subscription, in addition to facing competition from other bonds such as the 91- day bill whose yield stands at 6.3%, 1.3% above the intended 5.0%. According to Central Bank of Kenya, the value of outstanding non-performing mortgages stood at Kshs 38.1 bn as at 2018, with the mortgage to GDP ratio at 3.2%, and thus we are of the view that KMRC will have to raise a significant amount of funds to sustain the 7.0% interest rate, otherwise, once the initial capital is exhausted, the facility will need to move back to the market rate of approximately 13.0%.
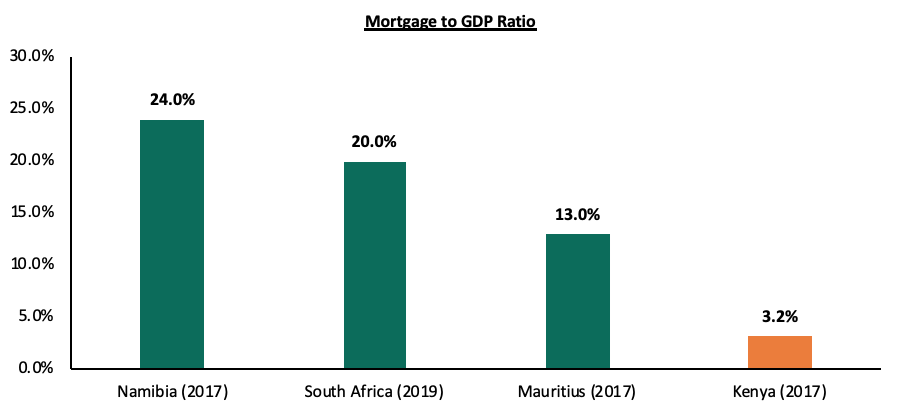
Source: Centre for Affordable Housing Finance in Africa
II. Commercial Office Sector
During the week, Industrial and Development Corporation (ICDC), a Kenyan government owned development finance institution, completed the purchase of Development Bank-owned Finance House building, located along Loita Street in Nairobi’s CBD, for Kshs 1.2 bn. The Corporation, which has been linked to real estate projects such as Two Rivers Mall owned by Centum Investments Limited, intends to sell the property and channel the proceeds to financing industrial, commercial and other entrepreneurial undertakings in the economy, citing that it is not in the business of owning property but contributing to the growth of the industries; it is not clear why ICDC would buy the property with a view to selling it, unless it bought it at a discount or it was a transaction to assist Development Bank improve its liquidity. The State-owned Development Bank of Kenya has been battling liquidity pressures thus forcing it to sell the property in 2019 in efforts to shore up its capital.
According to Cytonn H1’2020 Market Review, the commercial office sector recorded a decline in the average rental yield which came in at 7.3%, down from the 7.5% which was recorded in H1’2019. The performance is attributable to the ongoing COVID-19 pandemic which has led to reduced demand for office spaces as firms put on hold expansion plans as they adopt a wait and see approach. The Nairobi CBD recorded a relatively low rental yield of 6.8%, compared to the market average of 7.3%, due to the traffic snarl-ups and low-quality office space.
The table below shows performance by nodes of the Nairobi Commercial Office Sector in H1’2020.
|
Nairobi Commercial Office Sector Performance H1’2020 |
||||
|
Location |
Price Kshs/ SQFT H1'2020 |
Rent Kshs/SQFT H1'2020 |
Occupancy H1'2020(%) |
Rental Yield (%) H1'2020 |
|
Gigiri |
13,500 |
118 |
84.9% |
8.9% |
|
Karen |
13,688 |
111 |
85.9% |
8.3% |
|
Westlands |
12,328 |
105 |
79.7% |
8.2% |
|
Parklands |
11,808 |
94 |
82.7% |
7.9% |
|
UpperHill |
12,625 |
97 |
78.8% |
7.4% |
|
Kilimani |
12,521 |
91 |
79.6% |
7.0% |
|
Nairobi CBD |
12,273 |
83 |
84.2% |
6.8% |
|
Thika Road |
12,529 |
82 |
77.9% |
6.2% |
|
Msa Road |
11,375 |
74 |
65.9% |
4.7% |
|
Average |
12,516 |
95 |
80.0% |
7.3% |
Source: Cytonn Research 2020
We have a negative outlook for the commercial office sector, and expect to see a slight reduction in demand with some firms having downsized due to financial constraints resulting from the current pandemic as several others experience working from home and may make it a permanent measure. However, we expect the sector’s performance to gradually recover once the economy picks up.
III. Retail Sector
During the week, Tuskys, a local retail chain, closed down its Kisumu branch at the United Mall due to rent arrears totaling to Kshs 26.0 mn. The Victoria Blues Services Auctioneers (VBSA), stopped the retailer from operating and is set to auction the stock for debt recovery purposes. This follows the auctioning of the Nakuru Midtown branch on 8th August 2020 due to rent arrears. The retailer also recently closed 3 other branches, along Tom Mboya in Nairobi’s CBD, the Mega Branch in Kitale, and at Digo in Mombasa, citing consolidation of its services to other branches which are more spacious so as to implement social distancing and personal hygiene measures more effectively. The current financial strain is mainly attributed to strained revenues due to reduced demand, and the family wrangles among the retail chain’s shareholders thus affecting its operations. In 2019, the market witnessed a similar case with Nakumatt, which completely closed down their outlets. In our view, other retailers in Kenya can mitigate similar challenges through focusing on; i) proper corporate governance, ii) partnerships with private equity funds, iii) strategic expansion, and, iv) proper supply chain management. We expect retail centers to record a slump in occupancy rates due to the exit of troubled retailers such as Tuskys, while some retailers are shutting down their operations to cushion themselves against the effects emanating from the pandemic. However, we expect to see retailers invest in their e-commerce infrastructure and also decentralize to locations that are easily accessible from people’s homes.
|
Local and International Retailers that have exited or closed down outlets in Kenya |
||
|
Name of Retailer |
Initial no. of branches |
Current no. of branches |
|
Nakumatt Holdings |
65 |
0 |
|
Botswana’s Choppies |
15 |
2 |
|
South Africa’s Shoprite |
4 |
2 |
|
Uchumi |
37 |
4 |
|
Tuskys |
63 |
56 |
Source: Online Research
Massmart, a South Africa retail chain opened a Kshs 500.0 mn building material outlet dubbed Builders Warehouse in Kenya. The new outlet will be located in Karen at the Waterfront Mall. The latest move by the retailer is part of a strategy to increase its footprint in Kenya, targeting the growing construction sector in Kenya. The retailer currently has 3 subsidiary outlets of Game Stores in Garden City, Karen Waterfront and Kisumu’s Mega City Mall. The move to open a branch in Karen is supported by; i) the high consumer purchasing power as it is an affluent neighborhood hosting middle to high-end income earners, and, ii) less competition in the market given the relatively low number of similar retailers in the area. According to the Cytonn H1’2020 Markets Review, Karen was the second best performing retail node within Nairobi recording an average yield of 9.2% while the occupancy rates stood at 75.0%, compared to the market average of 7.4% and 74.0%, respectively.
The table below shows the H1’2020 Nairobi Retail market performance;
(All values in Kshs unless stated otherwise)
|
Nairobi Retail Market H1’2020 Performance |
|||
|
Location |
Rent per SQFT H1’2020 (Kshs) |
Occupancy H1’ 2020 |
Rental Yield H1' 2020 |
|
Westlands |
207 |
81.2% |
9.8% |
|
Karen |
219 |
75.0% |
9.2% |
|
Kilimani |
173 |
83.1% |
8.7% |
|
Ngong Road |
183 |
80.1% |
8.3% |
|
Kiambu Road |
175 |
67.1% |
6.9% |
|
Thika road |
164 |
69.3% |
6.5% |
|
Mombasa Road |
144 |
69.6% |
6.0% |
|
Eastlands |
143 |
69.6% |
5.9% |
|
Satellite Towns |
128 |
71.4% |
5.4% |
|
Average |
170 |
74.0% |
7.4% |
Source: Cytonn Research 2020
We expect continued entry of international retailers in Kenya to enhance the uptake of retail space thus heightening the returns for investors and cushioning the sector’s performance in the wake of economic slump due to the pandemic coupled by the existing oversupply of approximately 2.8 mn SQFT as at 2019.
We expect the real estate sector to continue on an upward trajectory with activity driven by expansion of international retailers, availability of relatively affordable mortgage loans through KMRC and ongoing transactions on the commercial front.
Over the past decade, Kenya has transformed into a technology epicenter largely propelled by financial technology (Fintech). This wave has been supported by various success stories such as M-PESA which disrupted the mobile money transfer space globally. This week, we will look at the fintech industry in general, how it has been affected by the spread of the coronavirus and finally, its importance to the general public.
Having done related topicals previously i.e. Technology & Investments and Fintech Impact on Kenya’s Financial Services Industry, we decided to look at the topic in the four sections:
- Introduction: Fintech Industry in Kenya
- Factors that have shaped the Fintech Industry in Kenya
- Fintech’s growth during the COVID-19 pandemic
- Challenges/ Risks brought about by fintech
- Conclusion
Section 1: Introduction: Fintech Industry in Kenya
The agility of Kenya’s mobile banking system has created opportunities for digital entrepreneurs. The penetration of mobile telephony and receptiveness of the nation to technological innovations has placed Kenya among the top financial innovators. Kenya is ranked 2nd in Africa after South Africa and closely followed by Nigeria (Santosdiaz, 2020).
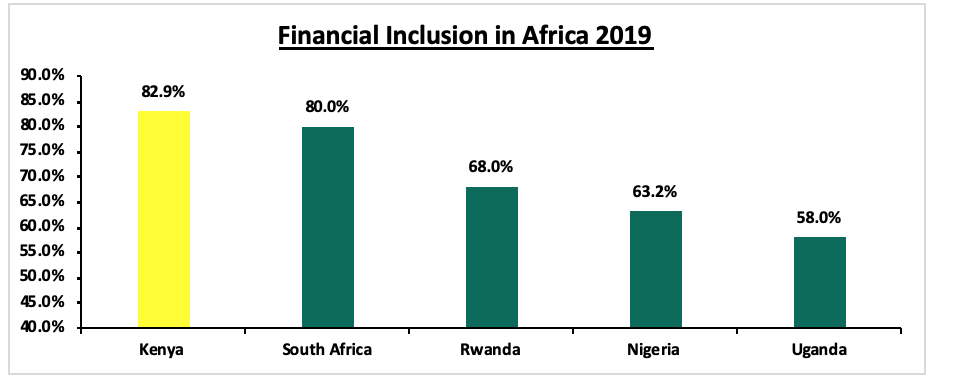
The reception of mobile money technology has increased financial inclusion, providing financial services to the ‘unbanked’. In a survey that was done by the Central Bank of Kenya (CBK), Kenya National Bureau of Statistics (KNBS) and FSD Kenya indicated that 82.9% of Kenyans over the age of 18 years have access to at least one financial product. Kenya leads in financial inclusion in Africa closely followed by South Africa, Rwanda, Nigeria and Uganda (2019 FinAccess Household Survey, 2019).
Several factors have contributed to this impressive outcome among them rapid uptake of mobile money, adoption of transformative financial technologies and innovations, and government initiatives and policies.
M-PESA, a mobile phone money transfer platform, has contributed to meaningful financial inclusion besides acting as an impetus for the creation of other fintechs. Through M-PESA, users are capable of depositing, withdrawing, transferring money and paying for goods and services using their phones. Several fintech businesses, which have thrived in Kenya as a result of M-PESA, include mobile lending, mobile banking, fundraising applications, mobile payment, insure-tech, peer-to-peer lending applications, business-to-business lending, digital payment, online trade, international money transfer, online foreign exchange, online procurement, online betting and other block chain applications.
Section 2: Factors that have shaped the Fintech Industry during the Pandemic
The financial services industry in the country is seeing its traditional model disrupted by technology and regulations; from March when the pandemic hit, many individuals and businesses have been forced to resort to technological avenues to curb the spread of the virus as they enforce social distancing. Also, the virus has created opportunities for digital financial services to accelerate, and enhance financial inclusion. Some of the factors shaping the financial services landscape include:
- Accelerating Economic Relief
Many payment companies are well-positioned to aid governments across the globe through rapid disbursement of government relief funds. Locally, companies such as M-PESA and some banks are already taking advantage of their technological expertise in fintech to support these government initiatives. For example, Safaricom PLC through Kazi Mtaani is able to disburse government relief to unemployed youths through their mobile money platform.
- COVID-19 has Accelerated going Contactless
COVID-19 has created an acute demand for contactless financial solutions. Clients are more aware of the risk of paper money as it changes hands many times over and pin pad systems are touched by hundreds of people. Furthermore, the World Health Organization has insisted on the use of contactless payments. Consequently, due to their innovative nature, fintech companies, according to the IMF, are likely to generate new and transformative solutions. Firms such as PayPal waived their charges on funds transfers from business accounts to bank accounts while some digital lenders considered hardship plans from their borrowers to allow them to make interest payments only.
Section 3: Fintech’s Growth during the Coronavirus Pandemic
Traditional financial institutions that lack vigorous digital and mobile solutions in place are struggling to service their clients in the current environment. Digital solutions have proven essential allowing clients to access their funds especially now that clients are practicing social distance and quarantine measures. We expect growing demand from traditional financial institutions seeking to partner with fintech firms to boost or build their systems. From the Banks that have recently released their H1’2020 financials, the contribution of fintech to the effective running of the institutions especially during the COVID-19 times is evident. For instance, some banking institutions such as KCB rely on digital transactions as a substitute of traditional banking. Evidently, the bank’s transactions performed over digital media rose to 98.0% from 95.0% during the second quarter of the year. For Equity Bank, during the second quarter of the year, digital transactions accounted for 94.0% of the group’s total transactions. The bank has been able to grow its digital platforms significantly with the volumes transacted over their payments application increasing by 79.3% to Kshs 5.2 bn in H1’2020, from Kshs 2.9 bn in H1’2019. For Cytonn Money Market Fund, the number of transactions performed digitally on a daily basis rose by 293.9% between 1st January 2020 and 30th June 2020.
The Government’s Role in Fintech’s Growth
The Kenyan government through its regulatory bodies and parastatals has been at the forefront to promote Fintech in the country before and during the COVID-19 pandemic. We have seen this through different efforts and initiatives that have been deployed to increase financial inclusion. The government of Kenya through the Ministry of Information, Communications, and Technology has established a task force to look into how the country can leverage on blockchain and IoT technology. The government also partnered with Mastercard to develop a digital payment platform for government services on top of the existing providers such as M-PESA, Airtel Money etc.
Following the COVID-19 pandemic, the government through the CBK also instituted several measures to encourage the use of digital payments. The withdrawal limit for mobile money transactions was pushed from Kshs 70,000 to Kshs 150,000. CBK also directed that transaction costs for a bank to mobile transfer and mobile money transfers of Kshs 1,000 and below be removed. These measures seek to promote social distancing and Peer-To-Peer (P2P) transactions during the health crisis.
From a regulatory standpoint, CBK has tabled a bill, seeking to curb the steep digital lending rates that have plunged many borrowers into a debt trap as well as predatory lending. The principal objective of this Bill is to amend the Central Bank of Kenya Act to regulate the conduct of providers of digital financial products and services.
The banking sector and the telecoms sector have been leading in Fintech adoption, as evidenced by various banking digital apps and Safaricom’s M-PESA; however the investment and insurance sectors are lagging behind fintech adoption. Closer home, through our subsidiary, Cytonn Fintech, we have managed to successfully launch the Cytonn Wallet which is powered by Cytonn Money Market Fund (CMMF). The digital wallet has enabled clients to invest, withdraw, and send money instantly to a bank or mobile money account, and still earn an attractive rate of return through our money market fund. The provision of this all-inclusive financial ecosystem increases the efficiency in processing both payments and investments.
Section 4: Challenges/ Risks brought about by fintech
Some of the key concerns that exist when it comes to fintech revolve around the risks of unsupervised complexity on the industry, data leaks and the infringement of consumer rights. This ultimately poses a challenge to the overall stability of the financial industry. The two main risks or concerns in the industry include:
- Its Interdisciplinary nature. This simply means that fintech is a combination of products with both traits of finance and technology. Many products appear simple but in essence they can be quite comprehensive since the model becomes a hybrid of both technology and finance. This becomes a challenge for even the consumers to understand thus making it easy for some to be taken advantage of,
- Lack of Regulation. Considering the fact that Fintech is a relatively new industry and its fast-paced nature, it is important to consider regulation in the space. The industry has grown at an extremely fast pace to the extent that some disputes related to the industry cannot be resolved due to the lack of existing policies and guidelines for operating in the space. So far, big fintech companies have been in difficult situations with the authorities because of data security and the risk it poses to the consumers of the various fintech products, and,
- Conservative Nature of Financial Services. By nature, the Financial Services is very conservative. It took a lot of engagement with CBK and a supportive government regime for M-PESA to grow to what it is today. The insurance and investment management industry remains largely manual and lag behind Fintech innovations.
Section 5: Conclusion
In conclusion, the COVID 19 pandemic shows that the trend towards greater digitalization of financial services is here to stay. To build inclusive societies and address rising inequalities during and after the ongoing crisis, global and national leaders must close the digital divide across and within countries to reap the benefits of digital financial services. This means finding the right balance between enabling financial innovation and addressing several risks: insufficient client protection, lack of financial and digital literacy, unequal access to digital infrastructure, and data biases that need action at the national level; as well as addressing money laundering and cyber risks through international agreements and information sharing, including on antitrust laws to ensure adequate competition. It’s time for financial institutions to make full use of our core capabilities to win the competition during digital transformation and accelerate inclusive finance development.
Disclaimer: The views expressed in this publication are those of the writers where particulars are not warranted. This publication is meant for general information only and is not a warranty, representation, advice or solicitation of any nature. Readers are advised in all circumstances to seek the advice of a registered investment advisor.

- Talk to us
- Kenya
- P.O Box 20695 - 00200, Nairobi, Kenya
- Cell +254709101200
- Tel +254709101200
- WhatsApp +254741676635
- United States
- +254709101200
- DOWNLOAD OUR APP
-


- Kenya
- 8th Floor, Pinetree Plaza, Kaburu Drive, Ngong Road, Nairobi, Kenya
- USA
- Suite 1150, 1775 Eye Street NW, USA, Washington DC 20006, USA
- Investments
- High Yield
- Private Equity
- Real Estate
- Real Estate
- RiverRun Estates
- Cytonn Towers
- The Ridge
- Taraji Heights
- The Alma