Insolvency in Real Estate in Kenya, & Cytonn Weekly #33/2025
By Cytonn Research, Aug 17, 2025
Executive Summary
Fixed Income
During the week, T-bills were undersubscribed for the third time in three weeks, with the overall subscription rate coming in at 96.6%, lower than the subscription rate of 97.6% recorded the previous week. Investors’ preference for the shorter 91-day paper increased, with the paper receiving bids worth Kshs 4.9 bn against the offered Kshs 4.0 bn, translating to a subscription rate of 123.2%, higher than the subscription rate of 99.7%, recorded the previous week. The subscription rates for the 364-day paper decreased to 108.0% (Kshs. 10.8 bn against the offered Kshs 10.0 bn) from the 120.2% (Kshs. 12.0 bn against the offered Kshs 10.0 bn) recorded the previous week, while that of the 182-day paper increased to 74.6% (Kshs 7.5 bn against the offered Kshs 10.0 bn) from 74.1 % (7.4 bn against the offered Kshs 10.0 bn) recorded the previous week. The government accepted a total of Kshs 23.16 bn worth of bids out of Kshs 23.18 bn bids received, translating to an acceptance rate of 99.9%. The yields on the government papers were on a downward trajectory with the yields on the 364-day paper decreasing the most by 13.1 bps to 9.6% from the 9.7% recorded the previous week. The yields on the 91-day paper and 182-day paper decreased by 6.9 bps and 5.4 bps to 8.0% and 8.1% respectively, from the 8.1% and 8.2% respectively recorded the previous week;
During the week, the Central Bank of Kenya released the auction results for the re-opened treasury bonds IFB1/2018/015 and IFB1/2022/019 with tenors to maturities of 7.6 years and 15.6 years respectively and fixed coupon rates of 12.5% and 13.0% respectively. The bonds were oversubscribed, with the overall subscription rate coming in at 359.4%, receiving bids worth Kshs 323.4 bn against the offered Kshs 90.0 bn. The government accepted bids worth Kshs 95.0 bn, translating to an acceptance rate of 29.4%. The weighted average yield for the accepted bids for the IFB1/2018/015 and IFB1/2022/019 came in at 13.0% and 14.0% respectively. Notably, the 13.0% on the IFB1/2018/015 was higher than the 12.5% recorded the last time the bond was reopened in January 2018 while the 14.0% on the IFB1/2022/019 was higher than the 13.0% recorded the last time the bond was reopened in February 2022. Given the bonds are tax free, compared to 10.0% withholding tax for other long-term bonds, the effective tax yield is 14.4% and 15.6% for the IFB1/2018/015 and IFB1/2022/019 respectively. With the Inflation rate at 4.1% as of July 2025, the real returns of the IFB1/2018/015 and IFB1/2022/019 are 8.9% and 9.9%.
The Monetary Policy Committee met on August 12th, 2025, to review the outcome of its previous policy decisions against a backdrop of elevated uncertainties to the global outlook for growth, lower sticky in advanced economies heightened trade tensions as well as persistent geopolitical tensions. The MPC decided to lower the CBR rate by 25.0 bps to 9.50%, from 9.75%.
Also during the week, The Energy and Petroleum Regulatory Authority (EPRA) released their monthly statement on the maximum retail fuel prices in Kenya, effective from 15th August 2025 to 14th September 2025. Notably, the maximum allowed price for Super Petrol and Kerosene decreased by Kshs 1.0 each respectively, while the price for Diesel remained unchanged. Consequently, Super Petrol and Kerosene will now retail at Kshs 185.3 and Kshs 155.6 per litre respectively, from Kshs 186.3 and Kshs 156.6 per litre respectively while Diesel will now retail at Kshs 171.6 per litre, representing decreases of 0.5% and 0.6% for Super Petrol and Kerosene respectively;
During the week, the National Treasury gazetted the revenue and net expenditures for the first month of FY’2025/2026, ending 31st July 2025, highlighting that the total revenue collected as at the end of July 2025 amounted to Kshs 178.4 bn, equivalent to 6.5% of the original estimates of Kshs 2,754.7 bn for FY’2025/2026 and is 77.7% of the prorated estimates of Kshs 229.6 bn;
Equities
During the week, the equities market was on an upward trajectory, with NSE 20 gaining the most by 3.9%, while NSE 10, NSE 25 and NASI gained by 3.2%, 2.9% and 2.8% respectively, taking the YTD performance to gains of 32.2%, 29.7%, 24.3% and 23.9% for NASI, NSE 20, NSE 25 and NSE 10 respectively. The equities market performance was driven by gains recorded by large-cap stocks such as KCB, BAT and SCBK of 11.7%, 5.5% and 4.4% respectively. The performance was, however, weighed down by losses recorded by large cap stocks such as NCBA and EABL of 2.3% and 0.5% respectively;
During the week, four of the listed banks released their H1’2025 results. KCB Group released its H1’2025 financial results, with its Core Earnings per Share (EPS) increasing by 8.0% to Kshs 19.6, from Kshs 18.2 in H1’2024;
Co-operative bank released its H1’2025 financial results, with its Core Earnings per Share (EPS) increasing by 8.4% to Kshs 2.4, from Kshs 2.2 in H1’2024;
Absa Bank released its H1’2025 financial results, with its Core Earnings per Share (EPS) increasing by 9.1% to Kshs 2.0, from Kshs 2.2 in H1’2024;
Lastly, Equity group released its H1’2025 financial results, with its Core Earnings per Share (EPS) decreasing by 16.8% to Kshs 8.8, from Kshs 7.6 in H1’2024;
Real Estate
During the week, the European Investment Bank (EIB) made an equity investment in local developer, International Housing Solutions (IHS) Kenya, to help it deliver more than 3,000 affordable housing units in prime neighborhoods such as Nairobi and Kiambu;
During the week, International hotel chain, Mariott International announced that it is set to debut its luxury The Ritz-Carlton brand in Africa with an exclusive luxury tented safari lodge in the Maasai Mara. It is set to officially open on August 15th in a ceremony to be presided by Narok County Governor, Patrick Ole Ntuntu;
During the week, the International Finance Corporation (IFC) announced that it is proposing to make an equity investment of Kshs 1.3 bn in Safari holdings, the parent firm of ARP Africa Travel, Pollman’s Tours and Safaris and Tanzanian tour company, Ranger Safaris;
During the week, Kenya invited international development lenders to finance a USD 2.0 bn expansion of the Jomo Kenyatta International Airport located in Nairobi. This marks nine months after it cancelled a deal with India’s Adani Group after its founder, Gautam Adani, was indicted in the United States of America;
On the Unquoted Securities Platform, Acorn D-REIT and I-REIT traded at Kshs 26.7 and Kshs 22.9 per unit, respectively, as per the last updated data on 15th August 2025. The performance represented a 33.4% and 14.5% gain for the D-REIT and I-REIT, respectively, from the Kshs 20.0 inception price. Additionally, ILAM Fahari I-REIT traded at Kshs 11.0 per share as of 15th August 2025, representing a 45.0% loss from the Kshs 20.0 inception price. The volume traded to date came in at 1.2 mn shares for the I-REIT, with a turnover of Kshs 1.5 mn since inception in November 2015;
Focus of the Week
Insolvency in Kenyan real estate arises when a developer, property company, or project vehicle can no longer meet its financial obligations as they fall due, triggering procedures such as administration, receivership, or liquidation under the Insolvency Act, 2015. The sector’s capital-intensive nature means that even minor disruptions in cash flow can escalate quickly. Common triggers include excessive debt reliance, cost overruns from inflation or mismanagement, and delayed or failed off-plan sales that deprive projects of critical liquidity. Market oversupply can slow absorption rates, while legal disputes over land or planning approvals can stall construction and revenue. Broader economic pressures such as high interest rates, currency volatility, and tightened mortgage lending further strain developers. These dynamics have made insolvency more visible in recent years, with several notable cases in 2025 reflecting a combination of financing challenges, operational weaknesses, and adverse market conditions.
Investment Updates:
- Weekly Rates: Cytonn Money Market Fund closed the week at a yield of 13.2% p.a. To invest, dial *809# or download the Cytonn App from Google Play store here or from the Appstore here;
- We continue to offer Wealth Management Training every Tuesday, from 7:00 pm to 8:00 pm. The training aims to grow financial literacy among the general public. To register for any of our Wealth Management Trainings, click here;
- If interested in our Private Wealth Management Training for your employees or investment group, please get in touch with us through wmt@cytonn.com;
- Cytonn Insurance Agency acts as an intermediary for those looking to secure their assets and loved ones’ future through insurance namely; Motor, Medical, Life, Property, WIBA, Credit and Fire and Burglary insurance covers. For assistance, get in touch with us through insuranceagency@cytonn.com;
- Cytonn Asset Managers Limited (CAML) continues to offer pension products to meet the needs of both individual clients who want to save for their retirement during their working years and Institutional clients that want to contribute on behalf of their employees to help them build their retirement pot. To more about our pension schemes, kindly get in touch with us through pensions@cytonn.com;
Hospitality Updates:
- We currently have promotions for Staycations. Visit cysuites.com/offers for details or email us at sales@cysuites.com;
Money Markets, T-Bills Primary Auction:
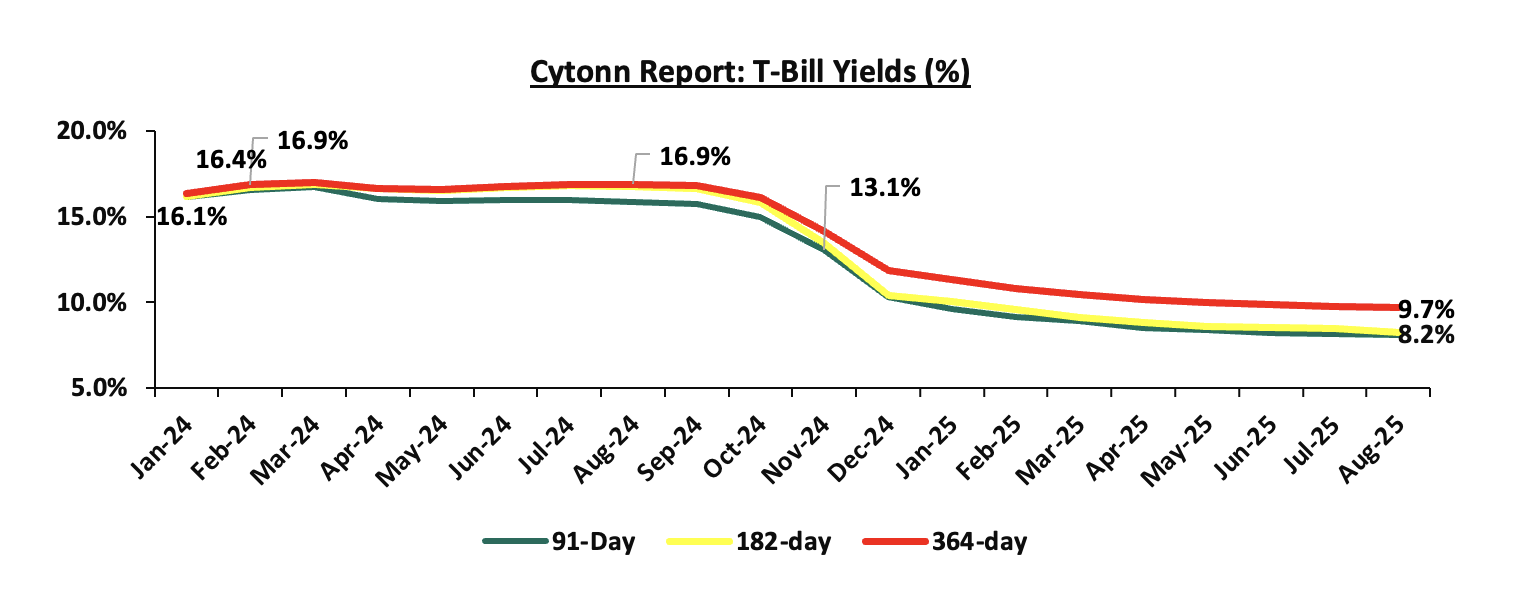
During the week, T-bills were undersubscribed for the third time in three weeks, with the overall subscription rate coming in at 96.6%, lower than the subscription rate of 97.6% recorded the previous week. Investors’ preference for the shorter 91-day paper increased, with the paper receiving bids worth Kshs 4.9 bn against the offered Kshs 4.0 bn, translating to a subscription rate of 123.2%, higher than the subscription rate of 99.7%, recorded the previous week. The subscription rates for the 364-day paper decreased to 108.0% (Kshs. 10.8 bn against the offered Kshs 10.0 bn) from 120.2% (Kshs. 12.0 bn against the offered Kshs 10.0 bn) recorded the previous week, while that of the 182-day paper increased to 74.6% (Kshs 7.5 bn against the offered Kshs 10.0 bn) from the 74.1 % (7.4 bn against the offered Kshs 10.0 bn) recorded the previous week. The government accepted a total of Kshs 23.16 bn worth of bids out of Kshs 23.18 bn bids received, translating to an acceptance rate of 99.9%. The yields on the government papers were on a downward trajectory with the yields on the 364-day paper decreasing the most by 13.1 bps to 9.6% from the 9.7% recorded the previous week. The yields on the 91-day paper and 182-day paper decreased by 6.9 bps and 5.4 bps to 8.0% and 8.1% respectively, from the 8.1% and 8.2% respectively recorded the previous week.
The chart below shows the yield performance of the 91-day, 182-day and 364-day papers over the period:
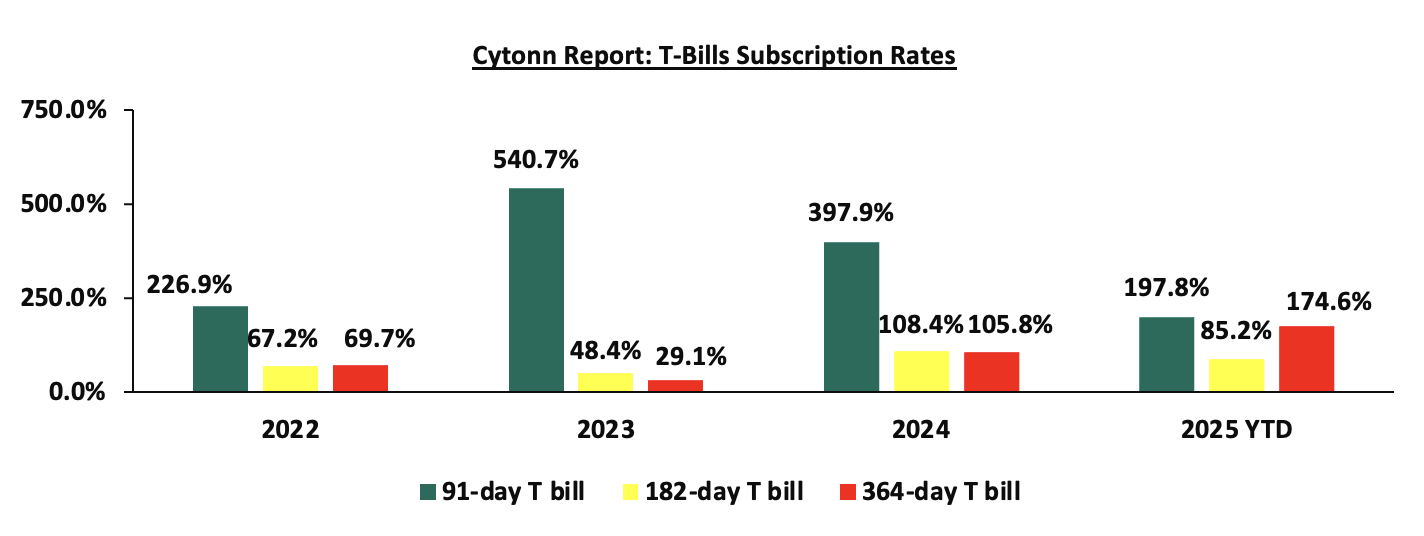
The chart below compares the overall average T-bill subscription rates obtained in 2022, 2023, 2024 and 2025 Year-to-date (YTD):
Money Market Performance:
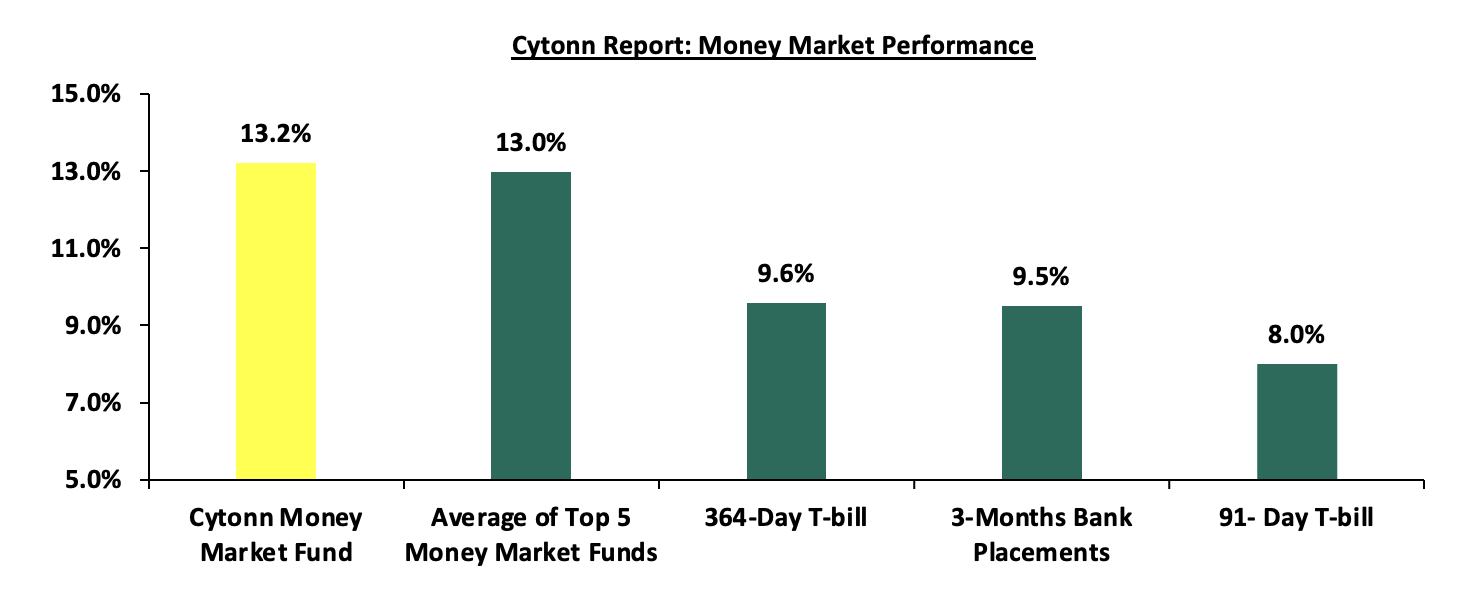
In the money markets, 3-month bank placements ended the week at 9.5% (based on what we have been offered by various banks). The yields on the government papers were on a downward trajectory with the yields on the 364-day paper decreasing the most by 13.1 bps to 9.6% from the 9.7% recorded the previous week while the yields on the 91-day paper decreased by 6.9 bps to 8.0% from the 8.1% recorded the previous week. The yield on the Cytonn Money Market Fund decreased by 12.0 bps to 13.2% from the 13.3% recorded the previous week, while the average yields on the Top 5 Money Market Funds decreased marginally by 1.4 bps to remain relatively unchanged from the 13.0% recorded the previous week.
The table below shows the Money Market Fund Yields for Kenyan Fund Managers as published on 15th August 2025:
|
Money Market Fund Yield for Fund Managers as published on 15th August 2025 |
||
|
Rank |
Fund Manager |
Effective Annual Rate |
|
1 |
Cytonn Money Market Fund ( Dial *809# or download Cytonn App) |
13.2% |
|
2 |
Gulfcap Money Market Fund |
13.1% |
|
3 |
Ndovu Money Market Fund |
13.1% |
|
4 |
Nabo Africa Money Market Fund |
12.9% |
|
5 |
Lofty-Corban Money Market Fund |
12.6% |
|
6 |
Orient Kasha Money Market Fund |
12.3% |
|
7 |
Etica Money Market Fund |
12.1% |
|
8 |
Kuza Money Market fund |
11.9% |
|
9 |
Arvocap Money Market Fund |
11.7% |
|
10 |
GenAfrica Money Market Fund |
11.3% |
|
11 |
Enwealth Money Market Fund |
11.1% |
|
12 |
Old Mutual Money Market Fund |
11.0% |
|
13 |
British-American Money Market Fund |
10.9% |
|
14 |
Madison Money Market Fund |
10.8% |
|
15 |
Jubilee Money Market Fund |
10.8% |
|
16 |
Faulu Money Market Fund |
10.3% |
|
17 |
Dry Associates Money Market Fund |
10.2% |
|
18 |
Apollo Money Market Fund |
10.2% |
|
19 |
Sanlam Money Market Fund |
10.1% |
|
20 |
KCB Money Market Fund |
9.6% |
|
21 |
Mali Money Market Fund |
9.3% |
|
22 |
Co-op Money Market Fund |
9.2% |
|
23 |
ICEA Lion Money Market Fund |
9.2% |
|
24 |
Genghis Money Market Fund |
9.0% |
|
25 |
Absa Shilling Money Market Fund |
8.6% |
|
26 |
CIC Money Market Fund |
8.5% |
|
27 |
Mayfair Money Market Fund |
8.5% |
|
28 |
AA Kenya Shillings Fund |
7.8% |
|
29 |
Ziidi Money Market Fund |
6.9% |
|
30 |
Stanbic Money Market Fund |
6.6% |
|
31 |
CPF Money Market Fund |
6.6% |
|
32 |
Equity Money Market Fund |
5.1% |
Source: Business Daily
Liquidity:
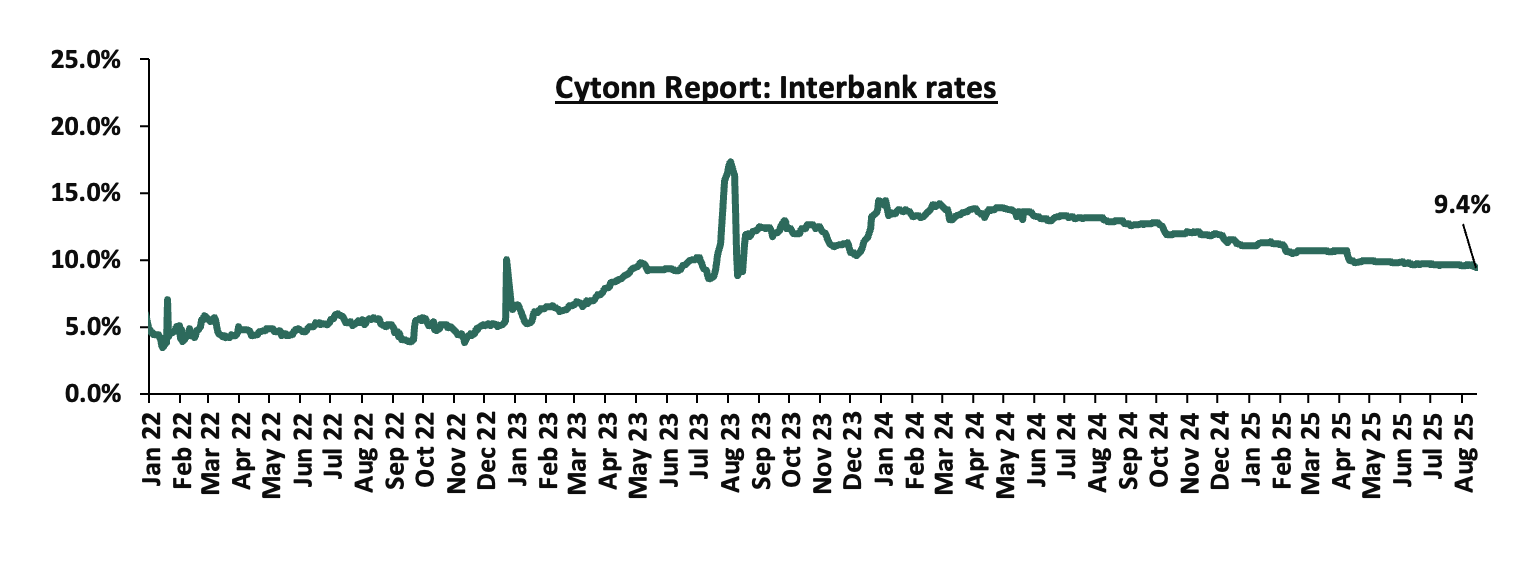
During the week, liquidity in the money markets marginally eased, with the average interbank rate decreasing by 7.2 bps, to 9.5% from the 9.6% recorded the previous week, partly attributable to government payments that were offset by tax remittances. The average interbank volumes traded increased by 27.5% to Kshs 9.8 bn from Kshs 7.7 bn recorded the previous week. The chart below shows the interbank rates in the market over the years:
Kenya Eurobonds:
During the week, the yields on Kenya’s Eurobonds were on a downward trajectory with the yield on the 13-year Eurobond issued in 2021 decreasing the most by 35.2 bps to 9.4% from the 9.8% recorded the previous week while the 30-year Eurobond issued in 2018 decreased the least by 11.3 bps to 10.0% from the 10.1% recorded the previous week. The table below shows the summary performance of the Kenyan Eurobonds as of 14th August 2025;
|
Cytonn Report: Kenya Eurobond Performance |
|||||||
|
|
2018 |
2019 |
2021 |
2024 |
2025 |
||
|
Tenor |
10-year issue |
30-year issue |
7-year issue |
12-year issue |
13-year issue |
7-year issue |
11-year issue |
|
Amount Issued (USD) |
1.0 bn |
1.0 bn |
0.9 bn |
1.2 bn |
1.0 bn |
1.5 bn |
1.5 bn |
|
Years to Maturity |
2.7 |
22.7 |
1.9 |
6.9 |
9.0 |
5.7 |
10.7 |
|
Yields at Issue |
7.3% |
8.3% |
7.0% |
7.9% |
6.2% |
10.4% |
9.9% |
|
2-Jan-25 |
9.1% |
10.3% |
8.5% |
10.1% |
10.1% |
10.1% |
|
|
1-Aug-25 |
7.8% |
10.3% |
- |
9.3% |
9.8% |
9.2% |
|
|
7-Aug-25 |
7.6% |
10.1% |
- |
9.0% |
9.8% |
8.9% |
|
|
8-Aug-25 |
7.6% |
10.1% |
- |
9.0% |
9.5% |
8.9% |
|
|
11-Aug-25 |
7.6% |
10.2% |
- |
9.1% |
9.6% |
8.9% |
|
|
12-Aug-25 |
7.6% |
10.2% |
- |
9.1% |
9.6% |
8.9% |
|
|
13-Aug-25 |
7.5% |
10.1% |
- |
9.0% |
9.4% |
8.8% |
|
|
14-Aug-25 |
7.4% |
10.0% |
- |
8.9% |
9.4% |
8.7% |
|
|
Weekly Change |
(0.2%) |
(0.1%) |
- |
(0.1%) |
(0.4%) |
(0.2%) |
- |
|
MTD Change |
(0.4%) |
(0.3%) |
- |
(0.4%) |
(0.4%) |
(0.5%) |
- |
|
YTD Change |
(1.6%) |
(0.2%) |
- |
(1.1%) |
(0.7%) |
(1.4%) |
- |
Source: Central Bank of Kenya (CBK) and National Treasury
Kenya Shilling:
During the week, the Kenyan Shilling depreciated marginally against the US Dollar by 0.1 bps, to remain relatively unchanged at Kshs 129.2 recorded the previous week. On a year-to-date basis, the shilling has appreciated by 5.1 bps against the dollar, compared to the 17.6% appreciation recorded in 2024.
We expect the shilling to be supported by:
- Diaspora remittances standing at a cumulative USD 5,084.0 mn in the twelve months to June 2025, 12.1% higher than the USD 4,535.0 mn recorded over the same period in 2024. These has continued to cushion the shilling against further depreciation. In the June 2025 diaspora remittances figures, North America remained the largest source of remittances to Kenya accounting for 57.9% in the period,
- The tourism inflow receipts which came in at Kshs 452.2 bn in 2024, a 19.8% increase from Kshs 377.5 bn inflow receipts recorded in 2023, and owing to tourist arrivals that improved by 8.0% to 2,303,028 in the 12 months to February 2025 from 2,133,612 in the 12 months to February 2024 and,
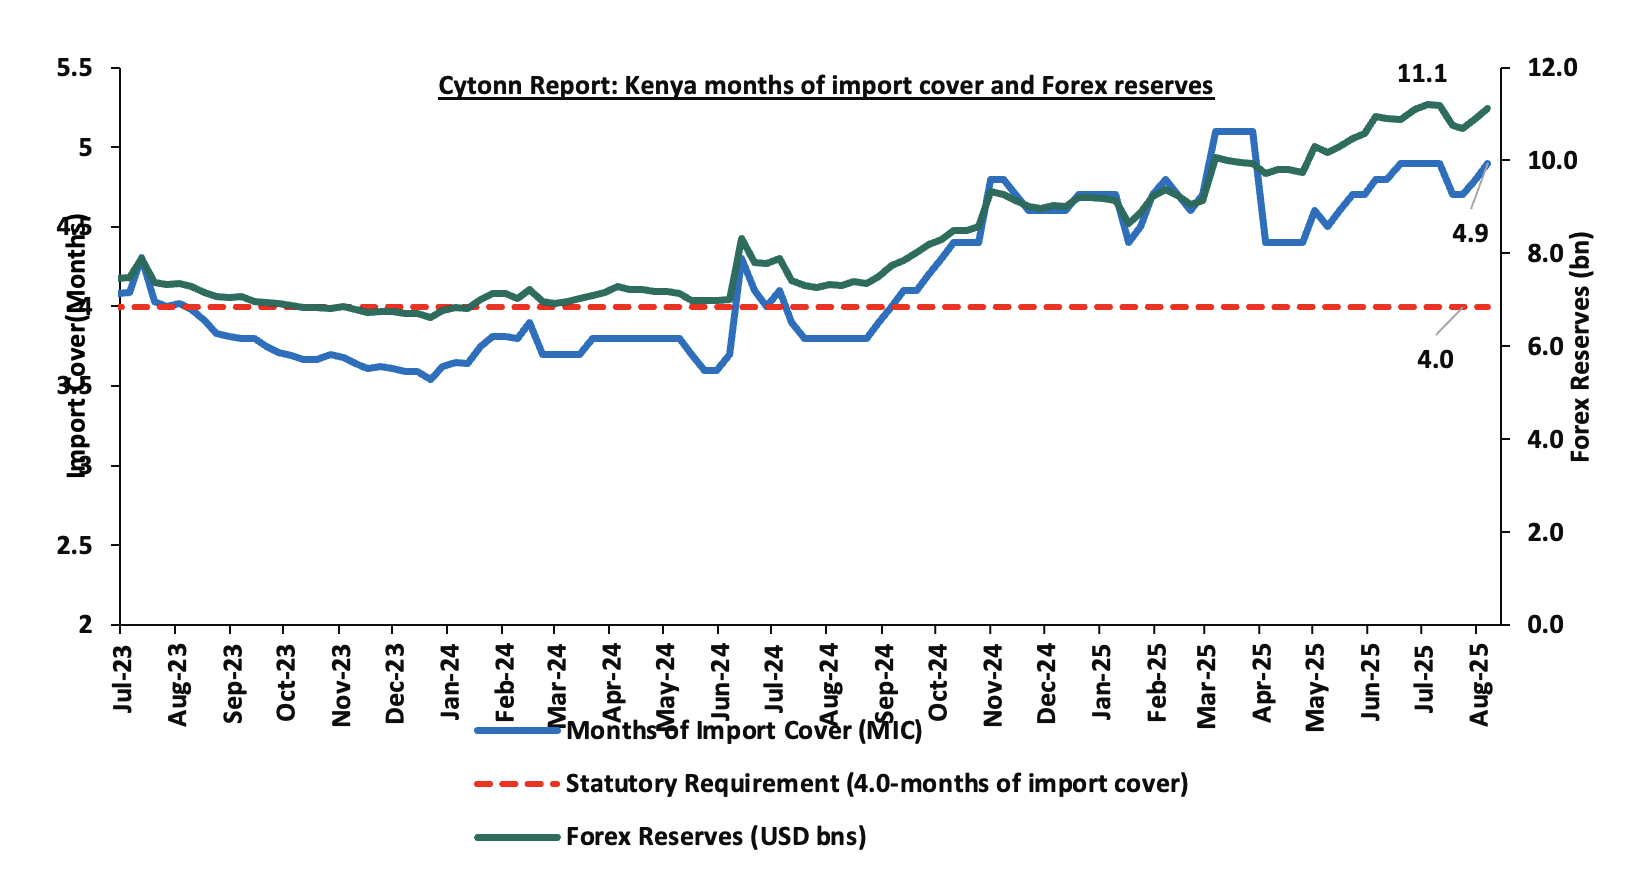
- Improved forex reserves currently at USD 11.1 bn (equivalent to 4.9-months of import cover), which is above the statutory requirement of maintaining at least 4.0-months of import cover and above the EAC region’s convergence criteria of 4.5-months of import cover.
The shilling is however expected to remain under pressure in 2025 as a result of:
- An ever-present current account deficit which came in at 1.6% of GDP in the twelve months to June 2025, and,
- The need for government debt servicing, continues to put pressure on forex reserves given that 62.0% of Kenya’s external debt is US Dollar-denominated as of December 2024.
Key to note, Kenya’s forex reserves increased marginally by 2.0% during the week, to USD 11.1 bn from the USD 10.9 bn recorded in the previous week, (equivalent to 4.9 months of import cover), and above the statutory requirement of maintaining at least 4.0-months of import cover and above the EAC region’s convergence criteria of 4.5-months of import cover.
The chart below summarizes the evolution of Kenya's months of import cover over the years:
Weekly highlights
- Monetary Policy Committee (MPC) August Meeting
The monetary policy committee met on August 12th, 2025, to review the outcome of its previous policy decisions against a backdrop of elevated uncertainties in the global economic outlook due to the lower inflation in advanced economies , heightened trade tensions as well as persistent geopolitical tensions. The MPC decided to lower the CBR rate by 25.0 bps to 9.50%, from 9.75% set in June 2025. Notably, inflation rates remain anchored and remained within the CBK preferred range of 2.5%-7.5% for the twenty fifth consecutive month, with an increase of 0.3% points to 4.1% in July 2025, from 3.8% in June 2025. Key to note, the MPC had cut the CBR rate to 9.75% in the previous meeting in June from 10.00% in April 2025. Below are some of the key highlights from the August meeting:
- The overall inflation increased by 0.3% points to 4.1% in July 2025, from 3.8% in June 2025, remaining below the mid-point of the CBK preferred range of 2.5%-7.5%. Core inflation increased to 3.1% in July 2025, from 3.0% in June, reflecting increasing demand pressures in the economy. This increase was largely attributed to higher prices of processed foods, particularly sugar and maize flour. Additionally, non-core inflation rose to 7.2% in July 2025, from 6.2 % in June, driven by higher energy prices. Lower energy and utilities costs, including reduced electricity and fuel prices, continued to help moderate non-core inflation. Overall inflation is expected to stay below the mid-point of the target range in the near term, supported by low food prices, stable energy prices, and a stable exchange rate.
- The recently released Quarterly Gross Domestic Product Report, for Q1’2025 showed a resilience in the performance of the Kenyan economy, with real GDP growing by 4.9%, same as the growth recorded in Q1’2024. This was attributable to expansion in growth in agriculture and industrial sectors of the economy. The economy is expected to continue to strengthen in 2025 with real GDP growth projected at 5.2%, from the 4.7% growth recorded in 2024 supported by resilient services sector and agriculture, expected recovery in the industrial sector. However, this positive outlook is tempered by geopolitical tensions and trade policy uncertainties.
- The Kenya National Bureau of Statistics (KNBS) updated the balance of payments data to better capture cross-border transactions, especially those involving petroleum imports and re-exports under government-to-government deals. The revisions also include the use of alternative data sources to enhance accuracy in reporting international trade in services, notably travel and financial services. These adjustments refine the recording of regional oil product re-exports and international travel earnings.
- Based on the revised balance of payments data goods exports increased by 7.7% in the 12 months to June 2025, compared to 2024, reflecting a rise in exports of agricultural commodities, especially horticulture, coffee, vegetable oil and clothing accessories. Goods imports rose by 9.9% reflecting increases in intermediate and capital goods imports. Additionally, services receipts increased by 12.5%, driven by increased receipts from transport and travel services, while diaspora remittances increased by 12.1%. The current account deficit in 12 months to June 2025 is at 1.6% of GDP, down from 1.8% in similar period in 2024 For 2025, the current account deficit is projected at 1.5% of GDP, up from 1.3% in 2024 and is expected to be fully financed by capital and financial inflows, yielding a balance of payments surplus of USD 673.0 mn.
- The CBK foreign exchange reserves, currently stand at USD 11,112.0 representing 4.9 months of import cover, which is above the statutory requirement of maintaining at least 4.0-months of import cover, continue to provide adequate cover and a buffer against any short-term shocks in the foreign exchange market,
- The banking sector remains stable and resilient, with strong liquidity and capital adequacy ratios. The ratio of gross non-performing loans (NPLs) to gross loans remained unchanged in June 2025 from the 17.6% recorded in April 2025. Decreases in NPLs were noted in the building and construction, personal and household, and manufacturing sectors while increases were recorded in trade and tourism, restaurant and hotel sectors. Banks have continued to make adequate provisions for the NPLs,
- The CEOs Survey and Market Perceptions Survey conducted ahead of the MPC meeting in July 2025 revealed sustained optimism about business activity and economic growth prospects for the next 12 months. The optimism was attributed to the stable macroeconomic environment reflected in the low inflation rate and stability in the exchange rate, decline in interest rates, expansion in the digital economy and favorable weather conditions supporting agriculture. Nevertheless, respondents expressed concerns about high cost of doing business, subdued consumer demand and increased global uncertainties due to increased tariffs and geopolitical tensions,
- The Survey of the Agriculture Sector for July 2025 revealed an expectation for decline in food prices, on account of favourable weather conditions and the beginning of the harvest season for key crops, especially maize,
- Global economic growth showed steady recovery in 2024 coming in at 3.3%. However, the outlook for 2025 is projected to decline to 3.0%, an upward revision from 2.8% particularly from revisions in the growth in United States and China, due to lower tariffs on trade and global financial conditions. However, uncertainties from trade policies and tariffs as well as escalating geopolitical risks, particularly ongoing conflicts in the Middle East and the Russia-Ukraine war, continue to threaten global growth prospects,
- Global headline inflation is expected to decline, due to decreased energy prices and reduced global demand. Central banks in advanced economies have continued to cut interest rates, albeit cautiously. International oil prices have declined amid higher production and weak demand, yet volatility risks remain elevated due to trade tensions and ongoing geopolitical conflicts. Food inflation has tightened, largely due to high prices of edible oil prices, although inflation in cereals and sugar remain low.
- The Committee was informed on the proposed revised banking sector Risk-Based Credit Pricing (RBCP) model, which aims to facilitate monetary policy decisions such as setting interest rates, which will effectively influence the lending rates by commercial banks.
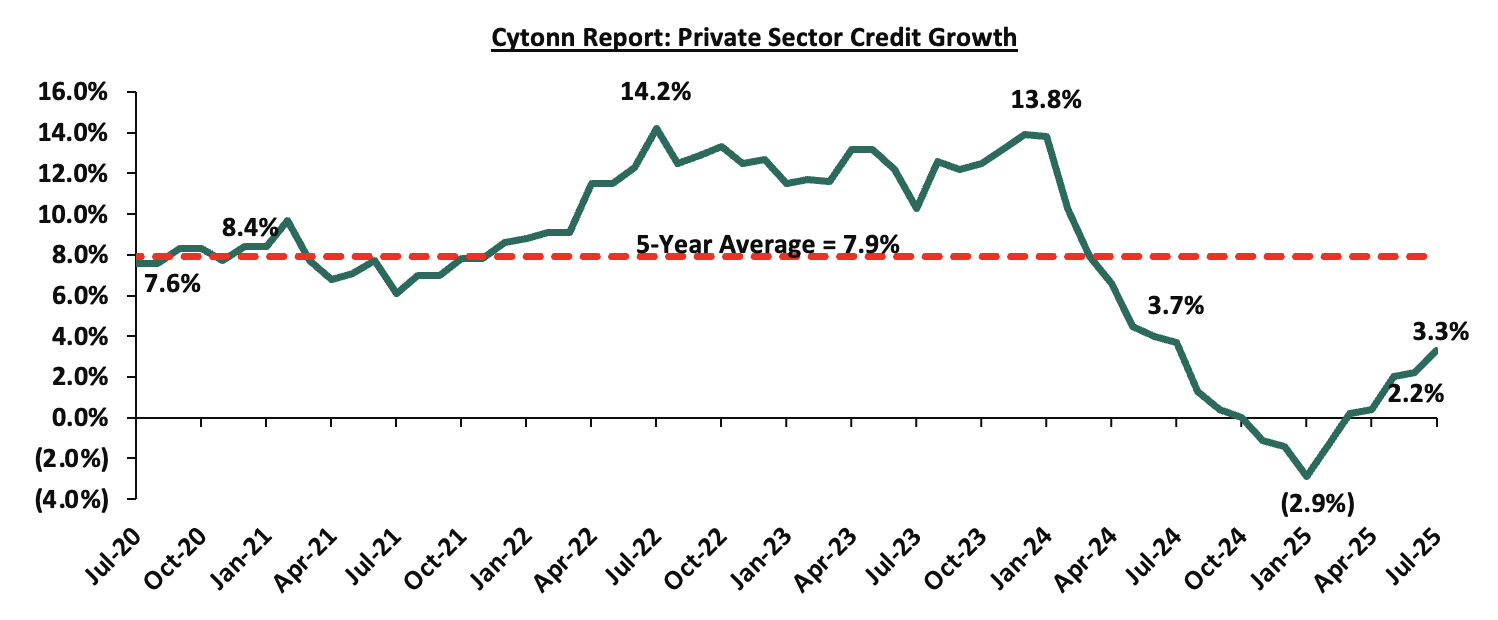
- Growth in private sector credit grew by 3.3% in July 2025 from 2.2% in June and a contraction of 2.9% in January 2025, mainly attributed increased demand attributable to declining lending interest rates. Notably, the growth in credit was recorded in key sectors such as manufacturing, trade, building and construction, and consumer durables since the last MPC meeting in June. Average commercial banks’ lending rates declined to 15.2% in July from 15.3% in June 2025 and 17.2% in November 2024. The chart below shows growth in private sector growth over the last five years:
- The Committee acknowledged the outcome of the implementation of the FY’2024/25 Budget and the Budget for FY’2025/26. These measures are anticipated to further support fiscal consolidation, which should reduce debt vulnerabilities in the medium-term.
The MPC noted that overall inflation is expected to remain below the midpoint of the 2.5%-5.0% target range in the near term, supported by low food prices, stable energy prices, and exchange rate stability. Additionally, central banks in major economies have continued to lower interest rates at a cautious pace. The Committee also noted that the recent economic developments, created room for further easing of monetary policy to support economic activity while maintaining exchange rate stability. The MPC noted that it will continue to monitor the effects of these policy measures, as well as global and domestic economic developments, and will remain ready to take additional action if necessary. Going forward, we expect the MPC to adopt a more cautious approach to rate adjustments in the coming meetings in a bid to continue supporting the private sector, while also keeping an eye on the effect on the inflation and exchange rate. The next MPC meeting is scheduled for October 2025.
- Fuel Prices effective 15th August 2025 to 14th September 2025
During the week, The Energy and Petroleum Regulatory Authority (EPRA) released their monthly statement on the maximum retail fuel prices in Kenya, effective from 15th August 2025 to 14th September 2025. Notably, the maximum allowed price for Super Petrol and Kerosene decreased by Kshs 1.0 respectively, while the price for diesel remained unchanged. Consequently, Super Petrol and Kerosene will now retail at Kshs 185.3 and Kshs 155.6 per litre respectively, from Kshs 186.3 and Kshs 156.6 per litre respectively, while diesel will remain unchanged at Kshs 171.6 per litre, representing decreases of 0.5% and 0.6% for Super Petrol and Kerosene respectively.
Other key take-outs from the performance include;
- The average landing costs per cubic meter for Kerosene and Diesel increased 3.2%, and 3.1% to USD 628.0 and USD 638.6 respectively from the USD 608.5 and USD 616.6 respectively recorded in June, while Super Petrol decreased by 0.7% to USD 623.7 from USD 628.3 recorded in June.
- The Kenyan Shilling remained stable against the US Dollar, appreciating slightly by 3.1 bps to remain relatively unchanged from the Kshs 129.6 recorded in June 2025.
We note that fuel prices in the country have stabilized in recent months largely due to the government's efforts to stabilize pump prices through the petroleum pump price stabilization mechanism which expended Kshs 9.9 bn in the FY’2023/24 to cushion the increases applied to the petroleum pump prices, coupled with the stabilization of the Kenyan Shilling against the dollar and other major currencies, as well as a decrease in international fuel prices. Additionally, the government has reduced spending through the price stabilization mechanism, subsidizing Kshs 2.0 and Kshs 2.9 per litre for Diesel and Kerosene respectively, resulting in stabilization in fuel prices for the period under review. Going forward, we expect that fuel prices will stabilize in the coming months as a result of the government's efforts to mitigate the cost of petroleum through the pump price stabilization mechanism and a stable exchange rate. As such, we expect the business environment in the country to improve as fuel is a major input cost, as well as continued stability in inflationary pressures, with the inflation rate expected to remain within the CBK’s preferred target range of 2.5%-7.5% in the short to medium term.
- July Exchequer Highlight
During the week, the National Treasury gazetted the revenue and net expenditures for the first month of FY’2025/2026, ending 31st July 2025, highlighting that the total revenue collected as at the end of July 2025 amounted to Kshs 178.4 bn, equivalent to 6.5% of the original estimates of Kshs 2,754.7 bn for FY’2025/2026 and is 77.7% of the prorated estimates of Kshs 229.6 bn.
The National Treasury gazetted the revenue and net expenditures for the first month of FY’2025/2026, ending 31st July 2025. Below is a summary of the performance:
|
Item |
12-months Original Estimates |
Actual Receipts/Release |
Percentage Achieved of the Original Estimates |
Prorated |
% achieved of the Prorated |
|
Opening Balance |
6.4 |
||||
|
Tax Revenue |
2,627.1 |
171.5 |
6.5% |
218.9 |
78.4% |
|
Non-Tax Revenue |
127.6 |
0.4 |
0.3% |
10.6 |
3.9% |
|
Total Revenue |
2,754.7 |
178.4 |
6.5% |
229.6 |
77.7% |
|
External Loans & Grants |
569.8 |
0.0 |
0.0% |
47.5 |
0.0% |
|
Domestic Borrowings |
1,098.3 |
67.3 |
6.1% |
91.5 |
73.5% |
|
Other Domestic Financing |
10.8 |
0.0 |
0.0% |
0.9 |
0.0% |
|
Total Financing |
1,678.9 |
67.3 |
4.0% |
139.9 |
48.1% |
|
Recurrent Exchequer issues |
1,470.4 |
91.7 |
6.2% |
122.5 |
74.9% |
|
CFS Exchequer Issues |
2,141.0 |
133.6 |
6.2% |
178.4 |
74.9% |
|
Development Expenditure & Net Lending |
407.1 |
3.8 |
0.9% |
33.9 |
11.2% |
|
County Governments + Contingencies |
415.0 |
0.0 |
0.0% |
34.6 |
0.0% |
|
Total Expenditure |
4,433.6 |
229.2 |
5.2% |
369.5 |
62.0% |
|
Fiscal Deficit excluding Grants |
1,678.9 |
50.8 |
3.0% |
139.9 |
36.3% |
|
Total Borrowing |
1,668.1 |
67.3 |
4.0% |
139.0 |
48.4% |
|
Public Debt |
407.1 |
3.8 |
0.9% |
33.9 |
11.2% |
The Key take-outs from the release include;
- Total revenue collected as at the end of July 2025 amounted to Kshs 178.4 bn, equivalent to 6.5% of the original estimates of Kshs 2,754.7 bn for FY’2025/2026 and is 77.7% of the prorated estimates of Kshs 229.6 bn. Cumulatively, tax revenues amounted to Kshs 171.5 bn, equivalent to 6.5% of the original estimates of Kshs 2,627.1 bn and 78.4% of the prorated estimates of Kshs 218.9 bn,
- Total financing amounted to Kshs 67.3 bn, equivalent to 4.0% of the original estimates of Kshs 1,678.9 bn and is equivalent to 48.1% of the prorated estimates of Kshs 139.9 bn. Additionally, domestic borrowing amounted to Kshs 67.3 bn, equivalent to 6.1% of the original estimates of Kshs 1,098.3 bn and is 73.5% of the prorated estimates of Kshs 91.5 bn,
- The total expenditure amounted to Kshs 229.2 bn, equivalent to 5.2% of the original estimates of Kshs 4,433.6 bn, and is 62.0% of the prorated target expenditure estimates of Kshs 369.5 bn. Additionally, the net disbursements to recurrent expenditures came in at Kshs 91.7 bn, equivalent to 6.2% of the original estimates of Kshs 1,470.4 and are equivalent to 74.9% of the prorated estimates of Kshs 122.5 bn,
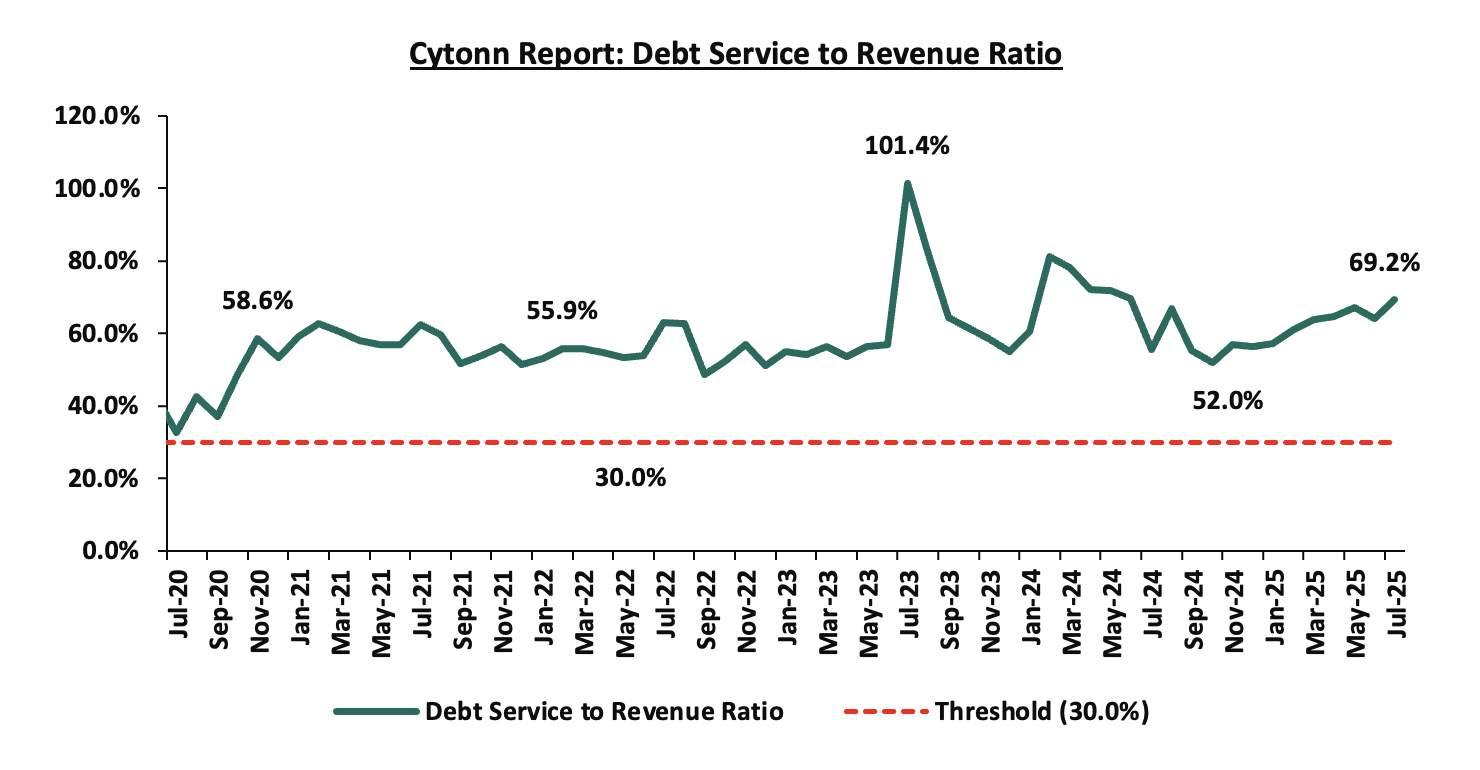
- Consolidated Fund Services (CFS) Exchequer issues came in at Kshs 133.6 bn, equivalent to 6.2% of the original estimates of Kshs 2,141.0 bn, and are 74.9% of the prorated amount of Kshs 178.4 bn. The cumulative public debt servicing cost amounted to Kshs 123.5 bn which is 6.5% of the original estimates of Kshs 1,901.4 bn, and is 77.9% of the prorated estimates of Kshs 158.4 bn. Additionally, the Kshs 123.5 bn debt servicing cost is equivalent to 69.2% of the actual cumulative revenues collected as at the end of July 2025. The chart below shows the debt servicing cost to revenue ratio over the period;
- Total Borrowings as at the end of July 2025 amounted to Kshs 67.3 bn, equivalent to 4.0% of the original estimates of Kshs 1,668.1 bn for FY’2025/2026 and are 48.4% of the prorated estimates of Kshs 139.0 bn. The cumulative domestic borrowing of Kshs 1098.3 bn comprises of Net Domestic Borrowing Kshs 634.8 bn and Internal Debt Redemptions (Rollovers) Kshs 463.5 bn.
The government missed its prorated revenue targets for the first month of the FY’2025/2026, achieving 77.7% of the prorated revenue targets in July 2025. The shortfall is largely due to the challenging business environment experienced in previous months with the Purchasing Managers’ Index (PMI), averaging 46.8 in July 2025, down from 48.6 in June 2025, marking the third consecutive month the index fell below the 50.0 neutral mark,. The low levels signaling worsening business conditions, mainly attributable to decreased output. However, the cost of credit has declined, providing some relief to businesses and households. While efforts to enhance revenue collection, such as broadening the tax base, curbing tax evasion, and suspending tax relief payments, are yet to yield full benefits, future revenue performance will depend on how quickly private sector activity gains momentum. This is expected to be supported by a stable Shilling, lower borrowing costs, and continued efforts to enhance economic growth. The reduction in the Central Bank Rate (CBR) by 25 basis points to 9.50% from 9.75%, following the Monetary Policy Committee’s (MPC) meeting on August 12th, 2025, is expected to further ease credit conditions and support private sector expansion.
Rates in the Fixed Income market have been on a downward trend due to high liquidity which has lowered the cost of borrowing. However, the government is 82.0% ahead of its prorated net domestic borrowing target of Kshs 83.8, having a net borrowing position of Kshs 152.5 bn (inclusive of T-bills). However, we expect a stabilization of the yield curve in the short and medium term, with the government looking to increase its external borrowing to maintain the fiscal surplus, hence alleviating pressure in the domestic market. As such, we expect the yield curve to stabilize in the short to medium-term and hence investors are expected to shift towards the long-term papers to lock in the high returns.
Market Performance
During the week, the equities market was on an upward trajectory, with NSE 20 gaining the most by 3.9%, while NSE 10, NSE 25 and NASI gained by 3.2%, 2.9% and 2.8% respectively, taking the YTD performance to gains of 32.2%, 29.7%, 24.3% and 23.9% for NASI, NSE 20, NSE 25 and NSE 10 respectively. The equities market performance was driven by gains recorded by large-cap stocks such as KCB, BAT and SCBK of 11.7%, 5.5% and 4.4% respectively. The performance was, however, weighed down by losses recorded by large cap stocks such as NCBA and EABL of 2.3% and 0.5% respectively.
During the week, equities turnover increased by 17.4% to USD 18.3 mn, from USD 15.6 mn recorded the previous week, taking the YTD total turnover to USD 556.9 mn. Foreign investors remained net buyers for the third consecutive week, with a net buying position of USD 2.5 mn, from a net buying position of USD 2.0 mn recorded the previous week, taking the YTD foreign net selling position to USD 24.4 mn, compared to a net selling position of USD 16.9 mn in 2024.
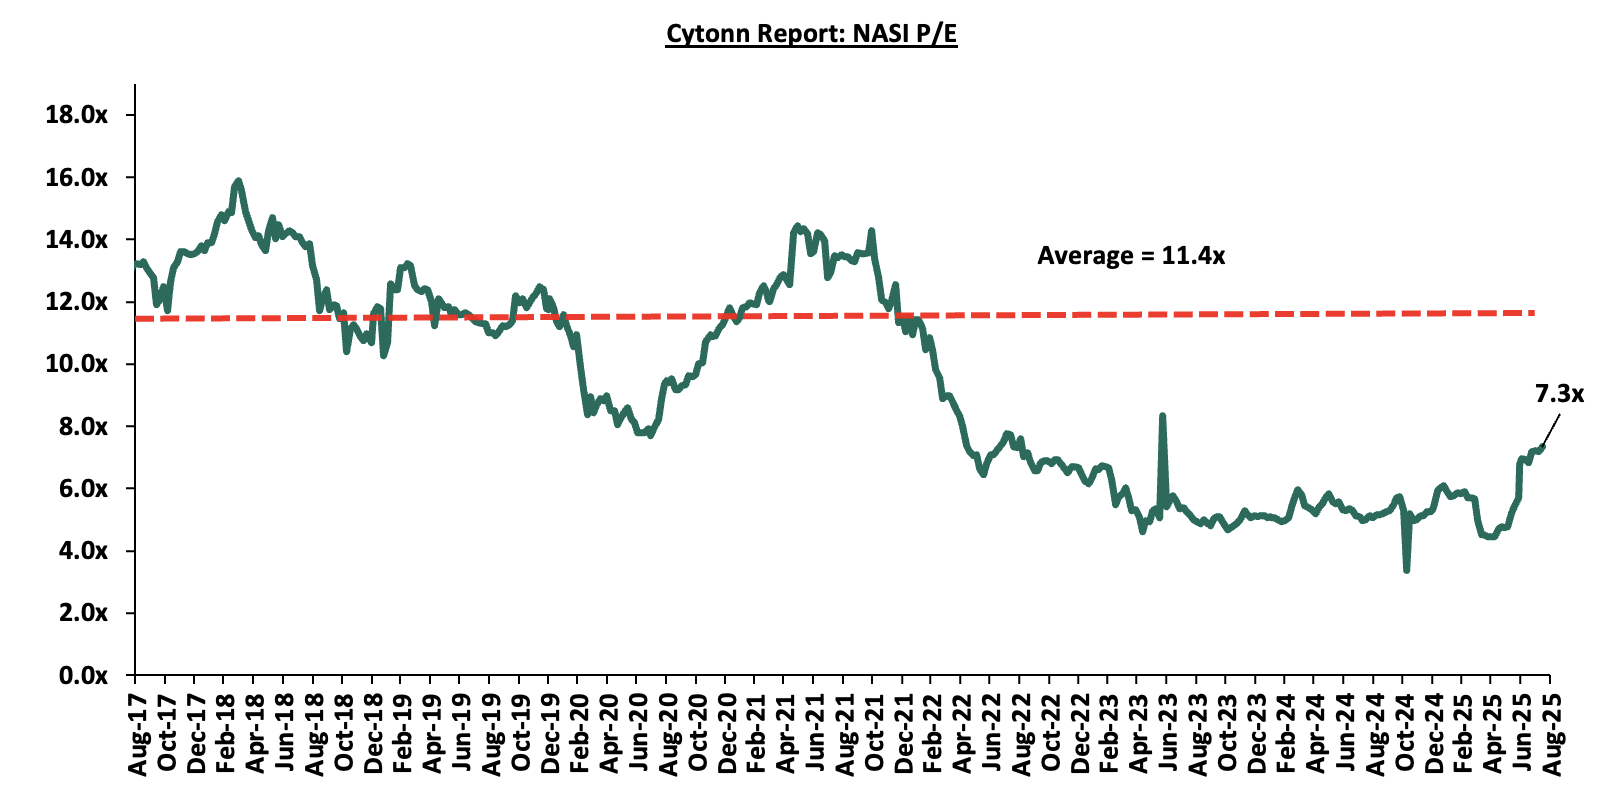
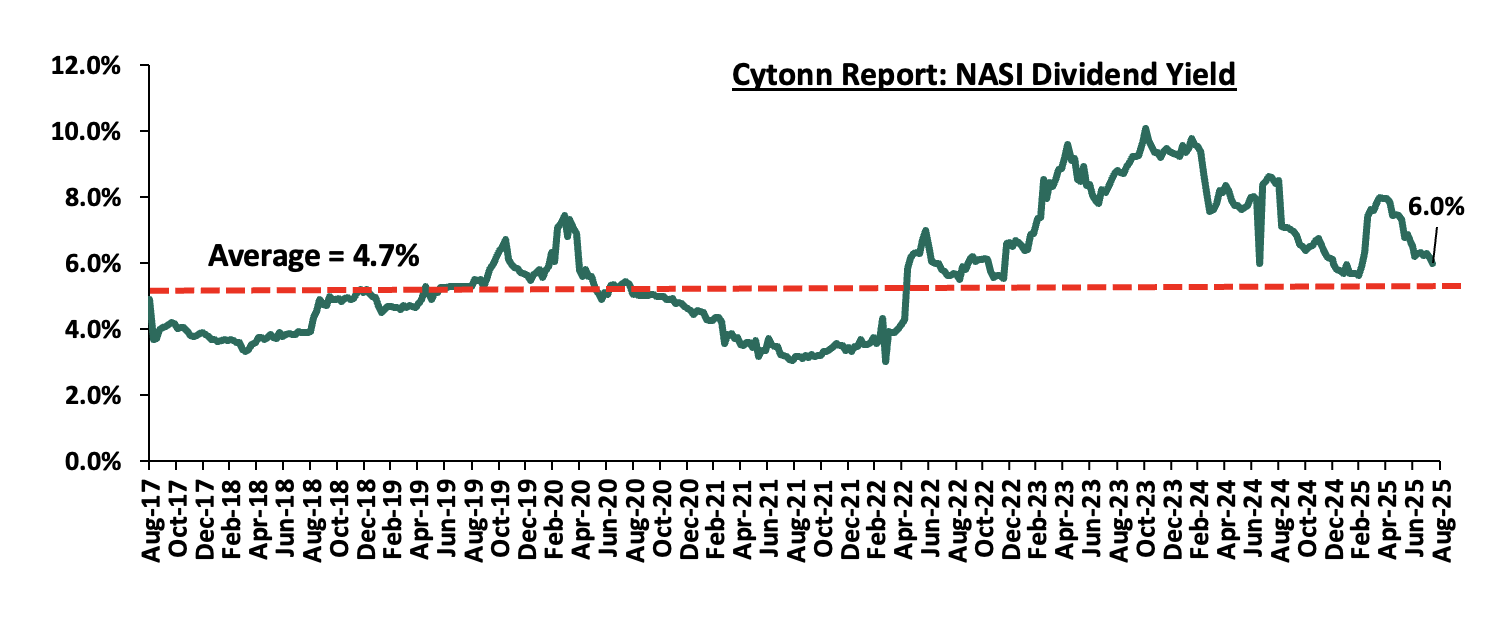
The market is currently trading at a price-to-earnings ratio (P/E) of 7.3x, 35.8% below the historical average of 11.4x. The year-to-date change in the price-to-earnings ratio (P/E) is 35.9% while the year-on-year change in the P/E ratio is 46.5%. The dividend yield stands at 6.0%, 1.3% points above the historical average of 4.7%. Key to note, NASI’s PEG ratio currently stands at 0.9x, an indication that the market is undervalued relative to its future growth. A PEG ratio greater than 1.0x indicates the market is overvalued while a PEG ratio less than 1.0x indicates that the market is undervalued. The charts below indicate the historical P/E and dividend yields of the market;
Universe of Coverage:
|
Cytonn Report: Equities Universe of Coverage |
|||||||||||
|
Company |
Price as at 08/08/2025 |
Price as at 15/08/2025 |
w/w change |
YTD Change |
Year Open 2025 |
Target Price* |
Dividend Yield |
Upside/ Downside** |
P/TBv Multiple |
Recommendation |
|
|
Diamond Trust Bank |
79.5 |
81.5 |
2.5% |
22.1% |
66.8 |
90.4 |
8.6% |
19.5% |
0.3x |
Accumulate |
|
|
Co-op Bank |
17.0 |
17.4 |
2.4% |
(0.6%) |
17.5 |
18.9 |
8.6% |
17.8% |
0.6x |
Accumulate |
|
|
Britam |
8.0 |
8.3 |
3.8% |
42.6% |
5.8 |
9.5 |
0.0% |
14.7% |
0.8x |
Accumulate |
|
|
Equity Group |
52.5 |
54.5 |
3.8% |
13.5% |
48.0 |
58.0 |
7.8% |
14.2% |
0.9x |
Accumulate |
|
|
ABSA Bank |
19.9 |
20.0 |
0.5% |
5.8% |
18.9 |
21.0 |
8.8% |
14.0% |
1.3x |
Accumulate |
|
|
Stanbic Holdings |
180.8 |
184.3 |
1.9% |
31.8% |
139.8 |
185.8 |
11.3% |
12.1% |
1.1x |
Accumulate |
|
|
I&M Group |
37.3 |
37.6 |
0.7% |
4.3% |
36.0 |
39.0 |
8.0% |
11.9% |
0.7x |
Accumulate |
|
|
Standard Chartered Bank |
321.0 |
335.3 |
4.4% |
17.5% |
285.3 |
328.8 |
13.4% |
11.5% |
1.9x |
Accumulate |
|
|
KCB Group |
48.4 |
54.0 |
11.7% |
27.4% |
42.4 |
53.7 |
5.6% |
5.0% |
0.7x |
Hold |
|
|
CIC Group |
3.4 |
4.0 |
16.1% |
85.5% |
2.1 |
4.0 |
3.3% |
4.8% |
1.1x |
Lighten |
|
|
NCBA |
66.3 |
64.8 |
(2.3%) |
27.0% |
51.0 |
60.2 |
8.5% |
1.4% |
1.0x |
Lighten |
|
|
Jubilee Holdings |
260.0 |
286.3 |
10.1% |
63.8% |
174.8 |
260.4 |
4.7% |
(4.3%) |
0.4x |
Sell |
|
|
*Target Price as per Cytonn Analyst estimates **Upside/ (Downside) is adjusted for Dividend Yield ***Dividend Yield is calculated using FY’2024 Dividends |
|||||||||||
Weekly Highlights
- KCB Group H1’2025 Financial Results
During the week, KCB Group released their H1’2025 financial results. Below is a summary of the performance
|
Balance Sheet Items |
H1'2024 |
H1'2025 |
y/y change |
|
Government Securities |
313.4 |
305.1 |
(2.7%) |
|
Net Loans and Advances |
1,032.2 |
1,095.4 |
6.1% |
|
Total Assets |
1,976.9 |
1,969.0 |
(0.4%) |
|
Customer Deposits |
1,490.6 |
1,486.1 |
(0.3%) |
|
Deposits per branch |
2.6 |
3.3 |
10.5% |
|
Total Liabilities |
1,728.6 |
1,653.5 |
(4.3%) |
|
Shareholders’ Funds |
241.0 |
306.8 |
27.3% |
|
Balance Sheet Ratios |
H1'2024 |
H1'2025 |
% y/y change |
|
Loan to Deposit Ratio |
69.2% |
73.7% |
4.5% |
|
Government Securities to Deposit Ratio |
21.0% |
20.5% |
(0.5%) |
|
Return on average equity |
22.7% |
23.4% |
0.7% |
|
Return on average assets |
2.7% |
3.3% |
0.6% |
|
Income Statement (Kshs Bn) |
H1'2024 |
H1'2025 |
y/y change |
|
Net Interest Income |
61.3 |
69.1 |
12.7% |
|
Net non-Interest Income |
33.3 |
29.5 |
(11.3%) |
|
Total Operating income |
94.6 |
98.7 |
4.3% |
|
Loan Loss provision |
(12.2) |
(12.5) |
2.2% |
|
Total Operating expenses |
(56.5) |
(57.8) |
2.4% |
|
Profit before tax |
38.1 |
40.8 |
7.1% |
|
Profit after tax |
29.92 |
32.33 |
8.0% |
|
Core EPS |
18.2 |
19.6 |
8.0% |
|
Income Statement Ratios |
H1'2024 |
H1'2025 |
y/y change (% points) |
|
Yield from interest-earning assets |
11.4% |
12.5% |
1.1% |
|
Cost of funding |
4.6% |
4.5% |
(0.1%) |
|
Net Interest Spread |
6.8% |
8.0% |
1.1% |
|
Net Interest Margin |
7.1% |
8.4% |
1.3% |
|
Cost of Risk |
12.9% |
12.6% |
(0.3%) |
|
Net Interest Income as % of operating income |
64.8% |
70.1% |
5.3% |
|
Non-Funded Income as a % of operating income |
35.2% |
29.9% |
(5.3%) |
|
Cost to Income Ratio |
59.7% |
58.6% |
(1.1%) |
|
Cost to Income Ratio (without LLP) |
46.8% |
46.0% |
(0.8%) |
|
Capital Adequacy Ratios |
H1'2024 |
H1'2025 |
% points change |
|
Core Capital/Total Liabilities |
15.8% |
18.7% |
2.9% |
|
Minimum Statutory ratio |
8.0% |
8.0% |
0.0% |
|
Excess |
7.8% |
10.7% |
2.9% |
|
Core Capital/Total Risk Weighted Assets |
17.8% |
17.0% |
(0.8%) |
|
Minimum Statutory ratio |
10.5% |
10.5% |
0.0% |
|
Excess |
7.3% |
6.5% |
(0.8%) |
|
Total Capital/Total Risk Weighted Assets |
20.3% |
19.7% |
(0.6%) |
|
Minimum Statutory ratio |
14.5% |
14.5% |
0.0% |
|
Excess |
5.8% |
5.2% |
(0.6%) |
|
Liquidity Ratio |
47.0% |
47.6% |
0.6% |
|
Minimum Statutory ratio |
20.0% |
20.0% |
0.0% |
|
Excess |
27.0% |
27.6% |
0.6% |
For a more detailed analysis, please see KCB Group’s H1’2025 Earnings Note
- Cooperative Bank H1’2025 Financial Results
During the week, Co-operative Bank released their H1’2025 financial results. Below is a summary of the performance
|
Balance Sheet Items |
H1'2024 |
H1'2025 |
y/y change |
|
Government Securities |
202.2 |
253.7 |
25.5% |
|
Net Loans and Advances |
375.6 |
391.3 |
4.2% |
|
Total Assets |
716.9 |
811.9 |
13.2% |
|
Customer Deposits |
507.4 |
547.7 |
7.9% |
|
Deposits per branch |
2.7 |
2.7 |
(0.5%) |
|
Total Liabilities |
589.8 |
655.6 |
11.2% |
|
Shareholders Funds |
126.7 |
156.3 |
23.4% |
|
Balance Sheet Ratios |
H1'2024 |
H1'2025 |
y/y change |
|
Loan to Deposit Ratio |
74.0% |
71.4% |
(2.6%) |
|
Government Securities to Deposits Ratio |
39.9% |
46.3% |
6.5% |
|
Return on average equity |
20.5% |
18.8% |
(1.7%) |
|
Return on average assets |
3.5% |
3.5% |
(0.0%) |
|
Income Statement |
H1'2024 |
H1'2025 |
y/y change |
|
Net Interest Income |
23.9 |
29.4 |
23.1% |
|
Non-Interest Income |
15.4 |
14.1 |
(8.2%) |
|
Total Operating income |
39.2 |
43.5 |
10.8% |
|
Loan Loss provision |
(3.0) |
(4.5) |
50.5% |
|
Total Operating expenses |
(21.3) |
(24.0) |
13.0% |
|
Profit before tax |
18.2 |
19.7 |
8.3% |
|
Profit after tax |
13.0 |
14.1 |
8.4% |
|
Core EPS |
2.2 |
2.4 |
8.4% |
|
Income Statement Ratios |
H1'2024 |
H1'2025 |
Y/Y Change (% points) |
|
Yield from interest-earning assets |
12.7% |
13.7% |
1.1% |
|
Cost of funding |
5.4% |
5.7% |
0.4% |
|
Net Interest Spread |
7.3% |
8.0% |
0.7% |
|
Net Interest Income as % of operating income |
60.8% |
67.5% |
6.7% |
|
Non-Funded Income as a % of operating income |
39.2% |
32.5% |
(6.7%) |
|
Cost to Income |
54.2% |
55.3% |
1.1% |
|
CIR without provisions |
46.6% |
44.9% |
(1.7%) |
|
Cost to Assets |
2.5% |
2.4% |
(0.1%) |
|
Net Interest Margin |
7.8% |
8.6% |
0.8% |
|
Capital Adequacy Ratios |
H1'2024 |
H1'2025 |
% points change |
|
Core Capital/Total deposit Liabilities |
23.1% |
23.1% |
0.0% |
|
Minimum Statutory ratio |
8.0% |
8.0% |
|
|
Excess |
15.1% |
15.1% |
0.0% |
|
Core Capital/Total Risk Weighted Assets |
18.1% |
18.8% |
0.7% |
|
Minimum Statutory ratio |
10.5% |
10.5% |
|
|
Excess |
7.6% |
8.3% |
0.7% |
|
Total Capital/Total Risk Weighted Assets |
21.3% |
21.3% |
0.0% |
|
Minimum Statutory ratio |
14.5% |
14.5% |
|
|
Excess |
6.8% |
6.8% |
0.0% |
|
Liquidity Ratio |
54.0% |
66.7% |
12.7% |
|
Minimum Statutory ratio |
20.0% |
20.0% |
|
|
Excess |
34.0% |
46.7% |
12.7% |
For a more detailed analysis, please see the Co-operative Bank’s H1’2025 Earnings Note
- Absa Bank Kenya H1’2025 Financial Results
During the week, Absa Bank Kenya released their H1’2025 financial results. Below is a summary of the performance
|
Balance Sheet Items |
H1’2024 (Kshs bn) |
H1’2025 (Kshs bn) |
y/y change |
|
Government Securities |
95.3 |
162.4 |
70.3% |
|
Net Loans and Advances |
316.4 |
304.9 |
(3.6%) |
|
Total Assets |
481.4 |
531.6 |
10.4% |
|
Customer Deposits |
353.3 |
361.3 |
2.3% |
|
Deposit per Branch |
4.6 |
4.2 |
(10.7%) |
|
Total Liabilities |
408.4 |
442.6 |
8.4% |
|
Shareholder's Funds |
73.0 |
89.0 |
21.9% |
|
Balance Sheet Ratios |
H1’2024 |
H1’2025 |
% points change |
|
Loan to Deposit Ratio |
89.5% |
84.4% |
(5.1%) |
|
Govt Securities to Deposit ratio |
27.0% |
44.9% |
18.0% |
|
Return on average equity |
27.5% |
27.0% |
(0.5%) |
|
Return on average assets |
3.8% |
4.3% |
0.5% |
|
Income Statement |
H1’2024 (Kshs bn) |
H1’2025 (Kshs bn) |
y/y change |
|
Net Interest Income |
23.0 |
22.3 |
(2.9%) |
|
Net non-Interest Income |
8.8 |
9.1 |
3.3% |
|
Total Operating income |
31.8 |
31.5 |
(1.2%) |
|
Loan Loss provision |
(5.2) |
(3.2) |
(37.9%) |
|
Total Operating expenses |
(16.6) |
(14.7) |
(11.5%) |
|
Profit before tax |
15.3 |
16.8 |
10.0% |
|
Profit after tax |
10.7 |
11.7 |
9.1% |
|
Core EPS (Kshs) |
2.0 |
2.2 |
9.1% |
|
Dividend Per Share (Kshs) |
0.20 |
0.20 |
0.0% |
|
Dividend Yield (Annualized) |
12.5% |
9.8% |
(22.1%) |
|
Dividend Payout Ratio |
10.1% |
9.3% |
(8.3%) |
|
Income Statement Ratios |
H1’2024 |
H1’2025 |
% points change |
|
Yield from interest-earning assets |
14.1% |
13.4% |
(0.7%) |
|
Cost of funding |
4.8% |
4.1% |
(0.8%) |
|
Net Interest Spread |
2.5% |
1.8% |
(0.6%) |
|
Net Interest Margin |
10.0% |
9.8% |
(0.2%) |
|
Cost of Risk |
16.2% |
10.2% |
(6.0%) |
|
Net Interest Income as % of operating income |
72.3% |
71.0% |
(1.3%) |
|
Non-Funded Income as a % of operating income |
27.7% |
29.0% |
1.3% |
|
Cost to Income |
52.0% |
46.6% |
(5.4%) |
|
Cost to Income (Without LLPs) |
35.8% |
36.4% |
0.6% |
|
Capital Adequacy Ratios |
H1’2024 |
H1’2025 |
% points change |
|
Core Capital/Total Liabilities |
18.3% |
21.4% |
3.1% |
|
Minimum Statutory ratio |
8.0% |
8.0% |
0.0% |
|
Excess |
10.3% |
13.4% |
3.1% |
|
Core Capital/Total Risk Weighted Assets |
14.8% |
17.6% |
2.8% |
|
Minimum Statutory ratio |
10.5% |
10.5% |
0.0% |
|
Excess |
4.3% |
7.1% |
2.8% |
|
Total Capital/Total Risk Weighted Assets |
18.6% |
20.5% |
1.9% |
|
Minimum Statutory ratio |
14.5% |
14.5% |
0.0% |
|
Excess |
4.1% |
6.0% |
1.9% |
|
Liquidity Ratio |
35.2% |
45.5% |
10.3% |
|
Minimum Statutory ratio |
20.0% |
20.0% |
0.0% |
|
Excess |
15.2% |
25.5% |
10.3% |
For a more detailed analysis, please see the Absa Bank Kenya H1’2025 Earnings Note
- Equity Group H1’2025 Financial Results
During the week, Equity Group released their H1’2025 financial results. Below is a summary of the performance
|
Balance Sheet Items |
H1'2024 |
H1'2025 |
y/y change |
|
Government Securities |
264.3 |
321.2 |
21.6% |
|
Net Loans and Advances |
791.1 |
825.1 |
4.3% |
|
Total Assets |
1,746.0 |
1,798.9 |
3.0% |
|
Customer Deposits |
1299.5 |
1319.9 |
1.6% |
|
Deposits/Branch |
3.7 |
3.3 |
(11.4%) |
|
Total Liabilities |
1525.5 |
1522.9 |
(0.2%) |
|
Shareholders’ Funds |
211.1 |
261.9 |
24.1% |
|
Balance Sheet Ratios |
H1'2024 |
H1'2025 |
% y/y change |
|
Loan to Deposit Ratio |
60.9% |
62.5% |
1.6% |
|
Government Securities to Deposit Ratio |
33.4% |
38.9% |
5.5% |
|
Return on average equity |
23.7% |
22.8% |
(0.9%) |
|
Return on average assets |
2.8% |
3.0% |
0.3% |
|
Income Statement (Kshs Bn) |
H1'2024 |
H1'2025 |
y/y change |
|
Net Interest Income |
54.4 |
59.3 |
9.1% |
|
Net non-Interest Income |
42.8 |
40.9 |
(4.4%) |
|
Total Operating income |
97.1 |
100.2 |
3.2% |
|
Loan Loss provision |
(10.5) |
(6.9) |
(34.5%) |
|
Total Operating expenses |
(60.0) |
(58.7) |
(2.2%) |
|
Profit before tax |
37.2 |
41.5 |
11.8% |
|
Profit after tax |
29.6 |
34.6 |
16.9% |
|
Core EPS |
7.6 |
8.8 |
16.8% |
|
Income Statement Ratios |
H1'2024 |
H1'2025 |
y/y change |
|
Yield from interest-earning assets |
11.8% |
11.1% |
(0.6%) |
|
Cost of funding |
4.2% |
3.9% |
(0.3%) |
|
Cost of risk |
10.8% |
6.9% |
(4.0%) |
|
Net Interest Margin |
7.8% |
7.5% |
(0.3%) |
|
Net Interest Income as % of operating income |
56.0% |
59.2% |
3.2% |
|
Non-Funded Income as a % of operating income |
44.0% |
40.8% |
(3.2%) |
|
Cost to Income Ratio |
61.7% |
58.5% |
(3.2%) |
|
CIR without LLP |
50.9% |
51.7% |
0.8% |
|
Cost to Assets |
2.9% |
2.9% |
0.0% |
|
Capital Adequacy Ratios |
H1'2024 |
H1'2025 |
% points change |
|
Core Capital/Total Liabilities |
17.4% |
18.9% |
1.5% |
|
Minimum Statutory ratio |
8.0% |
8.0% |
0.0% |
|
Excess |
9.4% |
10.9% |
1.5% |
|
Core Capital/Total Risk Weighted Assets |
15.8% |
16.5% |
0.7% |
|
Minimum Statutory ratio |
10.5% |
10.5% |
0.0% |
|
Excess |
5.3% |
6.0% |
0.7% |
|
Total Capital/Total Risk Weighted Assets |
18.4% |
18.1% |
(0.3%) |
|
Minimum Statutory ratio |
14.5% |
14.5% |
0.0% |
|
Excess |
3.9% |
3.6% |
(0.3%) |
|
Liquidity Ratio |
56.7% |
58.6% |
1.9% |
|
Minimum Statutory ratio |
20.0% |
20.0% |
0.0% |
|
Excess |
36.7% |
38.6% |
1.9% |
For a more detailed analysis, please see the Equity Group Kenya H1’2025 Earnings Note
Asset Quality:
The table below shows the asset quality of listed banks that have released their H1’2025 results using several metrics:
|
Cytonn Report: Listed Banks Asset Quality in H1’2025 |
||||||
|
|
H1'2025 NPL Ratio* |
H1'2024 NPL Ratio** |
% point change in NPL Ratio |
H1'2025 NPL Coverage* |
H1'2024 NPL Coverage** |
% point change in NPL Coverage |
|
Stanbic Holdings |
9.5% |
8.9% |
0.6% |
82.7% |
75.0% |
7.7% |
|
Cooperative Bank |
17.3% |
16.7% |
0.6% |
65.8% |
67.7% |
(1.9%) |
|
KCB Group |
17.9% |
18.1% |
(0.2%) |
64.3% |
59.5% |
4.8% |
|
Absa Bank Kenya |
13.2% |
11.5% |
1.7% |
66.6% |
62.3% |
4.3% |
|
Equity Group |
15.3% |
13.9% |
1.4% |
62.4% |
58.8% |
3.6% |
|
H1’2025 Mkt Weighted Average* |
15.3% |
13.4% |
1.9% |
66.3% |
62.7% |
3.6% |
|
H1’2024 Mkt Weighted Average** |
12.7% |
13.4% |
0.6% |
60.1% |
57.5% |
(2.6%) |
|
*Market cap weighted as at 15/08/2025 |
||||||
|
**Market cap weighted as at 24/08/2024 |
||||||
Key take-outs from the table include;
- Asset quality for the 5 listed banks that have released results deteriorated during H1’2025, with market-weighted average NPL ratio increasing by 1.9% points to 15.3% from 13.4% in H1’2024 largely due to Absa Banks’s numbers, and,
- Market-weighted average NPL Coverage for the five listed banks increased by 3.6% points to 66.3% in H1’2025 from 62.7% recorded in H1’2024. The increase was attributable to Stanbic Bank’s coverage ratio increasing by 7.7% points to 82.7% from 75.0% in H1’2024, coupled with KCB Group’s NPL coverage ratio increasing by 4.8% points to 64.3% from 59.5% in H1’2024.
Summary Performance
The table below shows the performance of listed banks that have released their H1’2025 results using several metrics:
|
Cytonn Report: Listed Banks Performance in H1’2025 |
||||||||||||||
|
Bank |
Core EPS Growth |
Interest Income Growth |
Interest Expense Growth |
Net Interest Income Growth |
Net Interest Margin |
Non-Funded Income Growth |
NFI to Total Operating Income |
Growth in Total Fees & Commissions |
Deposit Growth |
Growth in Government Securities |
Loan to Deposit Ratio |
Loan Growth |
Return on Average Equity |
|
|
Equity Group |
16.8% |
(0.6%) |
(18.0%) |
9.1% |
7.5% |
(4.4%) |
40.8% |
3.1% |
1.6% |
21.6% |
62.5% |
4.3% |
22.8% |
|
|
Absa Bank Kenya |
9.1% |
(8.3%) |
(21.3%) |
(2.9%) |
9.8% |
3.3% |
29.0% |
13.8% |
2.3% |
70.3% |
84.4% |
(3.6%) |
27.0% |
|
|
Co-operative Bank |
8.4% |
12.6% |
(3.3%) |
23.1% |
8.6% |
(8.2%) |
32.5% |
(3.4%) |
7.9% |
25.5% |
71.4% |
4.2% |
18.8% |
|
|
KCB Group |
8.0% |
3.2% |
(13.1%) |
12.7% |
8.4% |
(11.3%) |
29.9% |
1.8% |
(0.3%) |
(2.7%) |
73.7% |
6.1% |
23.4% |
|
|
Stanbic Group |
(9.3%) |
(10.5%) |
(35.3%) |
(5.8%) |
5.4% |
0.8% |
39.2% |
12.7% |
(2.5%) |
47.1% |
67.2% |
(2.2%) |
18.2% |
|
|
H1'2025 Mkt Weighted Average* |
9.1% |
0.1% |
(16.9%) |
8.6% |
8.0% |
(5.0%) |
34.6% |
4.6% |
1.7% |
26.6% |
70.9% |
2.7% |
22.5% |
|
|
H1’2024 Mkt Weighted Average** |
28.9% |
29.7% |
58.6% |
17.6% |
7.2% |
13.6% |
38.0% |
10.8% |
16.1% |
(9.3%) |
66.5% |
0.4% |
22.7% |
|
|
*Market cap weighted as at 15/08/2025 |
||||||||||||||
|
**Market cap weighted as at 24/08/2024 |
||||||||||||||
Key take-outs from the table include:
- The listed banks that have released their H1’2025 results recorded a 9.1% market weighted average increase in core Earnings per Share (EPS) in H1’2025, compared to the weighted average growth of 28.9% in H1’2024, an indication of declined performance attributable to the declined operating environment experienced during H1’2025,
- Interest income recorded a weighted average growth of 0.1% in H1’2025, compared to 29.7% in H1’2024. However, interest expenses recorded a market-weighted average decline of 16.9% in H1’2025 compared to a growth of 58.6% in H1’2024,
- The Banks’ net interest income recorded a weighted average growth of 8.6% in H1’2025, a decline from the 17.6% growth recorded over a similar period in 2024, while the non-funded income declined by 5.0% in H1’2025 compared to the 13.6% growth recorded in H1’2024 despite the revenue diversification strategies implemented by most banks, and,
- The Banks recorded a weighted average deposit growth of 1.7%, compared to the market-weighted average deposit growth of 16.1% in H1’2024.
We are “Bullish” on the Equities markets in the short term due to current cheap valuations, lower yields on short-term government papers and expected global and local economic recovery, and, “Neutral” in the long term due to persistent foreign investor outflows. With the market currently trading at a discount to its future growth (PEG Ratio at 0.9x), we believe that investors should reposition towards value stocks with strong earnings growth and that are trading at discounts to their intrinsic value. We expect the current high foreign investors sell-offs to continue weighing down the economic outlook in the short term.
- Residential Sector
- EIB investment in International Housing Solutions Kenya
During the week, the European Investment Bank (EIB) has made an equity investment in local developer, International Housing Solutions (IHS) Kenya, to help it deliver more than 3,000 affordable housing units in prime neighborhoods such as Nairobi and Kiambu. The bank’s development arm, EIB Global, has committed Kshs 3.2 bn in IHS Kenya Green Housing Fund for the construction and acquisition of energy-efficient and affordable housing in Kenya. The IHS Kenya Green Housing Fund invests in the development and acquisition of green-certified, affordable properties in Kenya, with a focus on low- and moderate-income segments of the population.
The European Investment Bank is the long-term lending institution of the European Union, owned by its member states. It finances investments that contribute to European Union policy objectives. The EIB supports affordable housing by offering flexible financing, including direct loans to social and affordable housing providers, as well as more commonly by working with special purpose financial intermediaries such as equity funds. The goal is to improve social cohesion and the quality of life of vulnerable groups whose housing needs are not met by the market.
This partnership between the European Investment Bank and International Housing Solutions Kenya, will have immense benefits on the residential sector in Kenya among them , (i) Accelerated construction of affordable housing units. With the financial backing from EIB, IHS Kenya is currently supporting development of energy-efficient housing across projects in Nairobi. This will enable them to deliver more than 3,000 affordable housing units in prime areas such as Nairobi and Kiambu, (ii) Enhanced access to capital and financing. EIB’s backing makes capital available for these affordable housing projects, bridging a key funding gap and drawing co-investors, (iii) Stimulating broader economic growth. By boosting affordable housing construction, EIB initiatives catalyze job creation across construction, materials, and related industries, hence multiplying economic and social benefits across communities.
The EIB-backed affordable housing initiatives mark a significant boost for Kenya’s residential sector. By delivering thousands of quality, energy-efficient homes, lowering living costs for residents, and stimulating local job creation, the projects promise not only to expand access to decent housing but also to set new benchmarks in green construction.
- Hospitality Sector
- Ritz – Carlton Safari lodge to open in Maasai Mara
During the week, International hotel chain, Mariott International is set to debut its luxury The Ritz-Carlton brand in Africa with an exclusive luxury tented safari lodge in the Maasai Mara. It is set to officially open on August 15th in a ceremony to be presided by Narok County Governor, Patrick Ole Ntuntu. The camp will host 20 tented suites, 2 bridges, a restaurant and other facilities on a 49.4-acre piece of land sitting on the banks of the Sand River. Each suite will also include a personalised butler service, and the camp has been designed as an eco-friendly ecosystem utilising solar power, rainwater harvesting, and waste reduction.
The Maasai Mara is one of Kenya’s most prominent tourist attractions. Its attractions are often defined by the annual Great Migration, one of the Seven Natural Wonders of the World, a clockwise migration of more than a million wildebeest from the Serengeti, into the Maasai Mara and back. With a presence in 30 countries, The Ritz-Carlton has become synonymous with luxury and exclusivity, appealing to high-net worth travelers seeking a bespoke experience in its hotels and resorts.
The Ritz-Carlton lodge will have immense positive impact on the hospitality sector in Kenya, (i) Elevating Kenya’s luxury positioning. As the first Ritz-Carlton property in Africa, this high-end safari camp gives Kenya a powerful signal of its serving capability in the luxury travel segment, with 20 exclusive tented suites offering ultra-luxury experiences starting from USD 3,500 per person per night, (ii) Promoting sustainable tourism. The camp employs eco-friendly design and has obtained full regulatory approval, including Environmental Impact Assessment and zoning compliance, underscoring a commitment to conservation-sensitive development, (iii) Job creation and community engagement. The project is delivering local employment opportunities, promoting cultural tourism, and implementing social responsibility programs, all reinforcing community empowerment.
The debut of The Ritz-Carlton Maasai Mara is set to elevate Kenya’s hospitality sector by cementing its status as a premier luxury safari destination, attracting high-spend visitors, and boosting tourism revenue for both local communities and the national economy. With its focus on premium experiences, eco-friendly design, and community engagement, the project promises to raise service standards and enhance Kenya’s global tourism appeal.
- World Bank investment in Safari Holdings
During the week, the International Finance Corporation (IFC) is proposing to make an equity investment of Kshs 1.3 bn in Safari holdings, the parent firm of ARP Africa Travel, Pollman’s Tours and Safaris and Tanzanian tour company, Ranger Safaris. The IFC has disclosed a proposed equity co-investment of up to Kshs 1.3 bn in Safari Holdings. The co-investment will be made through a Mauritius investment vehicle alongside the Alterra Africa Accelerator Fund.
ARP Africa Travel, Pollman’s and Ranger Safaris, while integrated at group level, operate as independent subsidiaries of Safari Holdings. UK-headquartered ARP Africa Travel handles business to business tour package sales to Kenya for Pollman’s and to Tanzania for Ranger Safaris, which then deliver on the packages sold by ARP through services such as guided tours and safaris, ticketing, hotel reservations and related transport services.
This will immensely benefit the hospitality sector in Kenya as it will: (i) Boost Capital for tour operators and safari providers. This injection of growth capital can be used to improve infrastructure, expand operations and adopt more advanced technologies to streamline logistics and bookings. Such investments contribute directly to raising the quality and reliability of Kenya’s tourism services, (ii) support for sustainable tourism. With development funds like this, Safari Holdings may invest in sustainable and responsible tourism practices such as wildlife conservation, eco-friendly transport, and community-based tourism programs, which in turn enhance Kenya’s reputation as a sustainable travel destination, (iii) regional growth with local benefits. Though the investment covers both Kenya and Tanzania, Kenya stands to gain significantly thanks to Safari Holdings’ established presence. It can also catalyze growth in surrounding hospitality ecosystems such as lodges, cultural tours, and local markets.
By strengthening the capacity of a leading safari and tour operator, the funding is poised to enhance service quality, promote sustainable tourism, and generate broad economic benefits through job creation and increased visitor spending. This move not only accelerates the sector’s post-pandemic recovery but also reinforces Kenya’s standing as a premier African travel destination, capable of attracting both high-value tourists and further investment.
- Infrastructure Sector
- Kenya seeks development banks’ support for JKIA expansion
During the week, Kenya has invited international development lenders to finance a Kshs 259.0 bn expansion of the Jomo Kenyatta International Airport located in Nairobi. This comes nine months after it cancelled a deal with India’s Adani Group after its founder, Gautam Adani, was indicted in the United States of America. Due to its soaring debt levels, Kenya is seeking new ways to finance infrastructure projects. For instance, Kenya will issue a securitized bond for Kshs 175.0 bn locally and abroad next month for road construction.
According to the Cabinet Secretary of Transport, Davis Chirchir, the government has notified development agencies to inform them of the opportunity to build the airport. Some of the agencies include, the European Investment Bank, African Development Bank, the Japan International Cooperation Agency, Exim Bank and KFW Development Bank. The airport expansion will include a second runway at the airport and a new terminal building.
This expansion will bring immense benefits to the infrastructure sector in Kenya and: (i) ensure the government maintains control over key national assets. The government’s decision to directly build the second runway and new terminal before potentially leasing the facility later keeps strategic infrastructure under national stewardship. This helps safeguard public interest and fosters accountable management, (ii) catalyze broader infrastructure development. Expanding JKIA not only upgrades aviation infrastructure but also stimulates investment in complementary sectors such as roads, logistics, and related construction, which amplifies the benefits across the infrastructure ecosystem, (iii) Alignment with National Development Goals. Airport modernization is an initiative under Kenya Vision 2030, already contributing significantly to the national economy. This revamped, locally managed model accelerates progress toward broader infrastructure targets.
Kenya’s decision to finance the JKIA expansion through development banks and domestic bonds marks a strategic win for the country’s infrastructure sector. This approach not only safeguards national control over a critical asset but also ensures transparent, sustainable funding while stimulating related developments in transport, logistics, and construction.
- Real Estate Investments Trusts
- Real Estate Investments Trusts (REITs) performance
On the Unquoted Securities Platform, Acorn D-REIT and I-REIT traded at Kshs 26.7 and Kshs 22.9 per unit, respectively, as per the last updated data on 15th August 2025. The performance represented a 33.4% and 14.5% gain for the D-REIT and I-REIT, respectively, from the Kshs 20.0 inception price. The volumes traded for the D-REIT and I-REIT came in at Kshs 12.8 mn and Kshs 39.2 mn shares, respectively, with a turnover of Kshs 323.5 mn and Kshs 791.5 mn, respectively, since inception in February 2021. Additionally, ILAM Fahari I-REIT traded at Kshs 11.0 per share as of 15th August 2025, representing a 45.0% loss from the Kshs 20.0 inception price. The volume traded to date came in at 1.2 mn shares for the I-REIT, with a turnover of Kshs 1.5 mn since inception in November 2015.
REITs offer various benefits, such as tax exemptions, diversified portfolios, and stable long-term profits. However, the ongoing decline in the performance of Kenyan REITs and the restructuring of their business portfolios are hindering significant previous investments. Additional general challenges include:
- Insufficient understanding of the investment instrument among investors leading to a slower uptake of REIT products,
- Lengthy approval processes for REIT creation,
- High minimum capital requirements of Kshs 100.0 mn for REIT trustees compared to Kshs 10.0 mn for pension funds Trustees, essentially limiting the licensed REIT Trustee to banks only
- The rigidity of choice between either a D-REIT or and I-REIT forces managers to form two REITs, rather than having one Hybrid REIT that can allocate between development and income earning properties
- Limiting the type of legal entity that can form a REIT to only a trust company, as opposed to allowing other entities such as partnerships, and companies,
- We need to give time before REITS are required to list – they would be allowed to stay private for a few years before the requirement to list given that not all companies maybe comfortable with listing on day one, and,
- Minimum subscription amounts or offer parcels set at Kshs 0.1 mn for D-REITs and Kshs 5.0 mn for restricted I-REITs. The significant capital requirements still make REITs relatively inaccessible to smaller retail investors compared to other investment vehicles like unit trusts or government bonds, all of which continue to limit the performance of Kenyan REITs.
We expect Kenya’s Real Estate sector to remain resilient, supported by: i) increased residential funding from European Investment Bank through their equity investment of Kshs 3.2 bn in International Housing Solutions Kenya which will aid in construction and acquisition of energy-efficient and affordable housing in Kenya, ii) Improved hospitality sector, with Mariott International set to debut its luxury Ritz Carlton brand in Africa with an exclusive luxury tented safari lodge in the Maasai Mara. This will help in elevating Kenya’s position as top tourist destination, (iii) Improved infrastructure sector, as Kenya is seeking for international development lenders such as Japan International Cooperation Agency to facilitate the Kshs 259.0 bn expansion of the Jomo Kenyatta International Airport in Nairobi. However, challenges including high financing and execution risks in residential projects and dependence on external borrowing for infrastructure.
Disclaimer: The views expressed in this publication are those of the writers where particulars are not warranted. This publication, which is in compliance with Section 2 of the Capital Markets Authority Act Cap 485A, is meant for general information only and is not a warranty, representation, advice, or solicitation of any nature. Readers are advised in all circumstances to seek the advice of a registered investment advisor.
Insolvency refers to a financial situation where an individual, business or entity, such as a fund, is unable to meet their financial obligations or settle their debts as they become due. In most cases, the state of insolvency occurs due to an increase in business expenses, poor cash management, law suits, poor budgeting, fraud, business expansion, or a reduction in sales. In Kenya, insolvency proceedings are primarily governed by the Insolvency Act of 2015. The act provides for how insolvent companies can be assisted to service creditors’ obligations and protect the interests of all stakeholders. The options available for such an insolvent company include Administration, Receivership, voluntary arrangements, and liquidation.
Earlier this year, we released a report focused on the Insolvency Act of 2015, financial health of a company and warning signs, business restructuring options under the insolvency act, various case studies including Mastermind Tobacco, Mobius Kenya and Kaluworks, Challenges affecting insolvency practice. We also offered various recommendations and conclusions. For more information, please visit our Restructuring and Insolvency in Kenya and Cytonn weekly #3/2025
Previously, we covered the following topics on insolvency:
- Administration as a Business restructuring option in Cytonn Weekly #37/2022 – We analyzed some of the recent companies that have been in administration and noted down the key take outs,
- Debt restructuring in Cytonn Weekly #25/2022 – We analyzed the available debt restructuring options that can be used by companies facing financial distress so as stay afloat and grow in the long run, and
- Business restructuring options in our Topical – We reviewed the business restructuring options under the Insolvency Act of 2015
Following an increase in the number of insolvency cases being witnessed in the Real Estate sector in Kenya, this week we focus on Real Estate Insolvency in Kenya report to provide a comprehensive overview of insolvency as it relates to the industry and its major causes
The note will include:
- Introduction
- Types of insolvency in Real Estate
- Causes of Insolvency in Real Estate
- Case Studies (Kenyan and international), and,
- Conclusion and recommendations
- Introduction
Insolvency in the Kenyan real estate arises when a developer, property company, or project vehicle can no longer meet its financial obligations as they fall due, triggering procedures such as administration, receivership, or liquidation under the Insolvency Act, 2015. The sector’s capital-intensive nature means that even minor disruptions in cash flow can escalate quickly. Common triggers include excessive debt reliance, cost overruns from inflation or mismanagement, and delayed or failed off-plan sales that deprive projects of critical liquidity. Market oversupply can slow absorption rates, while legal disputes over land or planning approvals can stall construction and revenue. Broader economic pressures such as high interest rates, currency volatility, and tightened mortgage lending further strain developers. These dynamics have made insolvency more visible in recent years, with several notable cases in 2025 reflecting a combination of financing challenges, operational weaknesses, and adverse market conditions.
The real estate sector is a key pillar of Kenya’s economy. It accounted for 15.5% of GDP (including construction) in Q1’2025 and is expected to continue growing supported by the high urbanization and population growth rates of 3.7% p.a and 2.0% p.a, respectively, against the global averages of 1.7% p.a and 1.0% p.a, respectively, as at 2024. Nairobi’s population is projected to reach over 7.0 mn by 2030, sustaining high housing demand. Yet Kenya faces a severe housing deficit (estimated at 2.0 mn units, growing by 250,000 annually).
- Types of Insolvency in Real Estate
- Individual Insolvency
Individual insolvency (bankruptcy) in Kenya applies when a natural person (or sole proprietor) cannot pay personal debts. Under the Insolvency Act Part III, either the individual or a creditor may petition for bankruptcy. In a real estate context, individual insolvency might involve selling a bankrupt person’s home or land. However, Kenya’s law provides that if a bankrupt individual remains in possession of land (e.g. family home) for three years without trustee action, that land vests in the individual upon discharge. In practice, an individual risk losing investment property or development land to satisfy creditors. After three years, an individual is normally discharged from bankruptcy and freed from most debts.
- Corporate Insolvency
Corporate insolvency deals with companies and legal entities owning property (developers, real estate firms, hotels, etc.). The Insolvency Act provides several procedures:
- Liquidation: Often initiated by a creditor petition (commercial insolvency case) or by the company (voluntary liquidation). The court may order winding up where a company “cannot pay its debts” or “its liabilities exceed assets”. A liquidator is appointed to collect assets (including real estate), sell them, and distribute proceeds to creditors in priority order.
- Administration: A court or creditors can place a company under administration (Part VIII) to attempt rescue or orderly restructuring. An administrator runs the business as a going concern and proposes a plan to repay creditors or sell the business in whole (a “pre-pack” sale).
- Company Voluntary Arrangement (CVA): A negotiated agreement between a company and its creditors on debt repayment terms. For real estate developers, a CVA might allow completion of a project by extending payment to creditors or transferring equity.
- Receivership: If a specific secured creditor (e.g. a bank) enforces a fixed charge, it may appoint a receiver (a type of insolvency practitioner) to sell the charged property.
- Special Administration: For financial institutions or specified sectors, there are separate regimes (outside this note’s scope).
- Causes of Insolvency in Real Estate
Real estate insolvency typically results from a combination of economic, managerial, and market factors:
- Economic factors
Kenya’s macroeconomy heavily influences real estate viability. High interest rates raise mortgage and construction loan costs and inflation drives up building material prices. Additionally, external shocks like the COVID-19 downturn, elections slowdown, or a banking crisis, can dry up demand for Real Estate properties, leading to rent defaults and unsold stock. Lenders continue to tighten their lending requirements and demand more collateral from developers as a result of elevated credit risk in the Real Estate sector as evidenced by the 16.6% increase in gross Non-Performing Loans (NPLs) to Kshs 118.6 bn in Q4’2024, from Kshs 101.7 bn recorded during Q4’2023. Although inflation has slightly eased to 4.1% as of July 2025, construction costs remain high, averaging Kshs 73,400 per SQM in 2025, up from Kshs 71,200 in 2024 representing a 3.1% increase. Prices of key inputs such as cement, steel, glass, and fittings, remain elevated due to import costs and VAT policies, which continue to impede development activity and temper land absorption rates. Failure to pay-back the lender’s money, their financing is rendered defaulted and the banks goes to the bank to exercise their secured rights. Mitini Scapes Development limited, went under administration after defaulting Kshs 79.0Mn debt to I&M bank and other obligations to Cooperative bank and NCBA
High mortgage interest rates currently at 14.3% and high transaction costs, have made it difficult for low- and middle-income earners to afford mortgages. Nonetheless, we foresee that heightened cooperation among industry stakeholders and the Kenya Mortgage Refinance Company (KMRC) will help alleviate this challenge. Particularly noteworthy are the government's initiatives aimed at enhancing accessibility to affordable home loans for Kenyans, offering reduced interest rates starting from 9.5%. These measures are poised to enhance the effectiveness of mortgage lending by enhancing accessibility to home loans, thereby stimulating higher adoption rates across the nation.
- Poor management practices:
Mismanagement is a frequent cause. Developers or landlords may overextend themselves by initiating projects without adequate capital or pre-sales, relying excessively on debt. Without escrow safeguards, some projects absorb buyers’ deposits into general funds, leaving nothing to complete construction. Governance failures such as lack of experience, corruption, or fraud, also contribute. Many Kenyan corporate insolvency cases have cited “mismanagement” and reckless expansion as root causes. In real estate specifically, delays in project timelines, cost overruns from poor budgeting, and even “white elephant” projects lacking market demand can bankrupt developers. In sum, weak governance and inadequate financial controls often precipitate insolvency when cash flows falter. For instance, Kings Pride properties limited faced liquidation after the buyers filled a petition after paying deposits for their properties and they never received any Sales agreements or the apartments they had paid for. Same case happened to Banda homes where investors paid for their apartments and the developer did not deliver them as promised
- Market trends and shifts:
Shifting demand patterns can render real estate assets unprofitable. For example, the rise of remote work globally has weakened demand for traditional office space. Nairobi saw prime office rents fall by 0.3% to Kshs 119 in 2024 from Kshs 119.4 in 2023 per square foot and vacancies rise by 0.4% points to 19.3% in 2024 from 19.7% in 2023. Similarly, e-commerce growth favors warehouses over retail malls. Kenya has also seen a surge in speculative developments; an oversupply of commercial office spaces in Nairobi Metropolitan Area of about 15,000 SQM in H1’2025, means many sits empty or rent at a loss. Other trends include population movement such as urban migration increasing housing demand, rural decline hitting local developments and regulatory changes such as new tax laws or building regulations, that can suddenly affect project viability.
Also, Certain segments, especially high-end apartments, experienced oversupply. Developers racing to build in affluent neighborhoods ended up with slow absorption, weak yields, and difficulty offloading units. This deepening supply-demand mismatch has made it increasingly hard for project revenues to keep up with financing obligations leading to insolvency petitions
- Case Studies
- Notable Insolvency Cases in Kenyan Real Estate
Few public cases focus solely on real estate companies, but relevant examples illustrate typical dynamics:
- Kings Pride Properties Limited: Kings Pride Properties Limited has been the subject of a long-running liquidation petition which resurfaced in 2025 when the High Court delivered a substantive judgment on the company’s insolvency petition. The petition, originally filed in 2019, alleges that Kings Pride failed to repay client deposits and is unable to meet its debts; the Court’s 2025 judgment outlines the factual matrix (developer contracts, purchaser deposits and the company’s responses) and the legal test under section 425 of the Insolvency Act.
- Runda Royal Limited: Runda Royal Limited appears in 2025 insolvency notices as a real-estate company placed under receivership, with an appointed Receiver and Manager taking control in mid-2025. Official gazette and insolvency-tracking summaries note the appointment of KVSK Sastry as Receiver effective 4 June 2025; public notices called for directors to submit statements of affairs and for creditors to communicate claims to the Receiver. The receivership classification (rather than immediate liquidation) implies a secured creditor, typically a bank, exercised rights under security documents over charged property, prompting the appointment to preserve and realize charged assets for secured creditors.
- Banda Homes Limited: Banda Homes, a developer that had been the subject of investor/buyer complaints for some years, was placed under official liquidation in 2025 after creditors and aggrieved purchasers pressed the High Court for a winding up order. Court judgments and Environment & Land Court filings from 2025 detail specific disputes (purchaser claims to properties, estate possession disputes and competing creditor applications) which the liquidator will have to investigate. The practical effect of the liquidation order is that an official liquidator replaces company directors for asset realization and creditor distribution under the Insolvency Act.
- Mitini Scapes Development Limited (Home Afrika subsidiary): Mitini Scapes Development Limited — an entity linked to Home Afrika’s development portfolio — was the subject of insolvency proceedings in 2025. The High Court recorded a commercial insolvency cause (I&M Bank v Mitini Scapes Development Ltd, Insolvency Cause E107 of 2024) with a ruling delivered 30 April 2025. The matter and subsequent press reporting indicate receivership/administration actions and appointment of receivers in relation to bank security. Media coverage and the Kenya Law judgment show the bank creditor pursued remedies under security documents and the Court considered the insolvency thresholds and procedural frameworks under the Insolvency Act.
- The Lynx at Ngong Road Limited: The Lynx at Ngong Road Limited — a residential project marketed as “The Lynx” on Ngong Road — was placed under administration in 2025 after a bank (National Bank of Kenya / KCB in various notices) exercised enforcement remedies; an administrator, Kamal Anantroy Bhatt, was publicly appointed with effect from 7 May 2025. The Kenya Gazette and insolvency trackers list the administration appointment and set deadlines for creditors to submit claims, signaling formal control by an insolvency officer.
Below are all the real estate related insolvencies in Kenya
|
Cytonn Report: insolvent Real Estate Firms |
||||||
|
No. |
Company |
Year declared Insolvent |
Debt Owed (in Bn) |
Amount Paid |
Industry |
Insolvency practitioner |
|
1 |
English Point Marina |
2022 |
5.2 |
-** |
Real Estate |
Kamal Anatroy Bhatt |
|
2 |
Cytonn High Yield Solutions/Cytonn Real Estate Project Notes |
2023 |
14.2 |
-** |
Real Estate |
The Official Receiver |
|
3 |
The Lynx at Ngong Road Limited |
2025 |
-** |
-** |
Real Estate |
Kamal Anatroy Bhatt |
|
4 |
Mitini Scapes Development Limited |
2025 |
0.325 |
-** |
Real Estate |
Swaroop Rao Ponangipalli and P.V Rao |
|
5 |
Banda Homes Limited |
2025 |
0.024 |
-** |
Real Estate |
Official Receiver |
|
6 |
Runda Royal Limited |
2025 |
-** |
-** |
Real Estate |
KVSK Sastry |
|
7 |
Kings pride properties Limited (subsidiary of telegan) |
2025 |
0.021 |
-** |
Real Estate |
Official Receiver |
|
8 |
Telegan Investments Limited |
2025 |
0.415 |
-** |
Real Estate |
|
|
9 |
Chiedo Developers Limited |
2024 |
-** |
-** |
Real Estate |
Christopher Kirathe of Ernst and Young LLP |
Source:Cytonn research
- Comparative International Examples
- Evergrande (China, 2021–2023): The Evergrande Group, once the world’s largest property developer, went into dramatic default with over USD 335.0 bn in liabilities (about 1.8% of China’s GDP). Heavy leverage and a regulatory “three red lines” crackdown on borrowing triggered widespread debt failure. Evergrande’s offshore liquidation and onshore restructuring illustrated the systemic risk of property bubbles: it caused global market jitters and affected related industries. The lesson is that even giants can collapse under debt, with ripple effects for creditors and markets. For Kenya, Evergrande is a cautionary tale: overexpansion and debt buildup without sustainable cash flow can doom a developer.
- U.S. Real Estate Crisis (2008): The global subprime mortgage meltdown led to bankruptcy for many U.S. and international real estate firms e.g. Lehman Brothers, Bear Stearns, which held significant property investments and homebuilders e.g. Hovnanian, LGI Homes. Developers and lenders collapsed under falling prices. The key lesson was the importance of liquidity and the dangers of securitizing mortgages without regard to borrowers’ ability to pay. Although different in context, Kenya’s market faces similar vulnerabilities if credit quality deteriorates.
- South African Real Estate: South Africa has seen its share of property company insolvencies e.g. Resilient REIT’s debt issues in 2021. It has recently introduced a dedicated Insolvency Court to streamline corporate bankruptcies. This innovation aims to resolve cases faster (improving recovery rates) and could be a model: Kenya’s backlog and delays are often cited as challenges, so specialized tribunals or alternative dispute resolution could help.
- Challenges and Solutions
- Barriers to Successful Insolvency Resolution
- Stigma and awareness: Insolvency in Kenya still carries stigma, especially bankruptcy. Many individuals and small businesses avoid formal rescue, preferring informal arrangements. This hinders orderly resolution.
- Judicial and administrative delays: Despite the new Act, courts remain congested. Liquidation and bankruptcy can take years, during which asset values fall. High legal fees and the cost of IPs make insolvency expensive for all parties, often eating up creditors’ returns.
- Priority and secured credit issues: The Act’s priority scheme (favoring trustee costs, wages, taxes) can leave unsecured creditors (often small suppliers) with nothing. Banks with fixed charges (land mortgages) still must navigate Land Act requirements unless insolvency steps are used, complicating enforcement. Secured lenders have sometimes been frustrated by administrators selling assets they thought secure.
- Regulatory gaps for developers: There is no mandatory regulatory oversight of property developers beyond general business laws. As a result, hundreds of off-plan projects in Kenya have stalled with no recourse for buyers.
- Limited insolvency culture: Kenya’s financing environment does not actively promote workouts or pre-insolvency restructuring. Many lenders (and directors) jump straight to enforcement or liquidation, reducing chances of rescue. Cross-border insolvency (for foreign-owned real estate ventures) can be especially complex, with no robust recognition of foreign proceedings.
- Proposed Policy Recommendations and conclusion
- Strengthen rescue culture: Amendments to the Insolvency Act (recently tabled) aim to streamline processes (e.g. pre-insolvency moratoriums, more powers for liquidators). Encouraging corporate voluntary arrangements and administration over liquidation can save viable projects. Training judges and expanding specialized insolvency courts or commercial divisions can speed cases.
- Developer regulations: The draft Real Estate Regulation Bill, 2023 proposes binding rules on developers, including escrow accounts and buyer protection. Enacting this (with strong enforcement) would protect consumers and improve project completion rates, reducing insolvency-driven disputes. Other suggestions include mandatory project bonds or insurance, and licensing requirements for large projects.
- Credit and data improvements: Better credit reporting would help lenders assess risk in real estate lending. Establishing a national property valuation database could curb price manipulations. For insolvencies, a centralized insolvency register (for petitions and outcomes) would increase transparency. Kenya already has collateral registries (Movable Property Security Rights (MPSR)), which could be enhanced.
- Education and early warning: Financial literacy for entrepreneurs and mandated early-warning audits for large companies could detect distress earlier. Stronger enforcement of related-party transaction rules would curb asset stripping before bankruptcy.
- Social safety nets: For individuals, expanding debt counseling and consolidation programs might help avoid bankruptcy. Pilot programs, like debt rehabilitation support, could keep good faith debtors afloat.
Insolvency in Kenya’s real estate sector is governed by a modern legal regime (Insolvency Act 2015) that emphasizes rehabilitation but still faces practical hurdles. Looking ahead, Kenya’s insolvency landscape is likely to see more restructuring and rescue attempts. As economic pressures (e.g. high NPLs, rising costs) continue, more real estate companies may seek administration or CVAs instead of liquidation. In the long term, a robust insolvency framework can lend confidence to Kenya’s real estate market by ensuring that failures are managed transparently and losses are limited.
Disclaimer: The views expressed in this publication are those of the writers where particulars are not warranted. This publication, which is in compliance with Section 2 of the Capital Markets Authority Act Cap 485A, is meant for general information only and is not a warranty, representation, advice or solicitation of any nature. Readers are advised in all circumstances to seek the advice of a registered investment advisor

- Talk to us
- Kenya
- P.O Box 20695 - 00200, Nairobi, Kenya
- Cell +254709101200
- Tel +254709101200
- WhatsApp +254741676635
- United States
- +254709101200
- DOWNLOAD OUR APP
-


- Kenya
- 8th Floor, Pinetree Plaza, Kaburu Drive, Ngong Road, Nairobi, Kenya
- USA
- Suite 1150, 1775 Eye Street NW, USA, Washington DC 20006, USA
- Investments
- High Yield
- Private Equity
- Real Estate
- Real Estate
- RiverRun Estates
- Cytonn Towers
- The Ridge
- Taraji Heights
- The Alma