Kenya Economic Update: 2023, & Cytonn Weekly #10/2023
By Cytonn Research, Mar 12, 2023
Executive Summary
Fixed Income
During the week, T-bills remained oversubscribed, with the overall subscription rate coming in at 148.5%, up from the 136.2% recorded the previous week. Investor’s preference for the shorter 91-day paper persisted as they sought to avoid duration risk, with the paper receiving bids worth Kshs 20.0 bn against the offered Kshs 4.0 bn, translating to an oversubscription rate of 501.0%, albeit lower than the 555.7% recorded the previous week. The subscription rates for the 364-day and 182-day papers increased to 76.8% and 79.1%, from 44.5% and 60.2%, respectively, recorded the previous week. Key to note, the government continued to reject expensive bids, accepting bids worth Kshs 32.2 bn out of the Kshs 35.6 bn total bids received, translating to an acceptance rate of 90.3%. The yields on the government papers were on an upward trajectory, with the yields on the 364-day paper, 182-day and 91-day papers increasing by 5.7 bps, 5.1 bps and 4.4 bps to 10.7%, 10.2% and 9.7%, respectively;
In the primary market, the Central Bank of Kenya released the auction results for the infrastructure bond IFB1/2023/017. In line with our expectations, the bond was oversubscribed, receiving bid worth Kshs 59.8 bn, against the offered Kshs 50.0 bn, translating to an oversubscription of 119.5%. The accepted weighted average yield for the bond came in at 14.4%, similar to the coupon rate;
Equities
During the week, the equities market was on a downward trajectory, with NASI, NSE 20 and NSE 25 declining by 6.6%, 1.6% and 4.3%, respectively, taking the YTD performance to losses of 7.4%, 4.0%, and 4.5% for NASI, NSE 20, and NSE 25, respectively. The downward trajectory of the Kenyan equities market was mainly attributable to capital flight as foreign investors moved to developed markets with the Fed expected to further hike their interest. Additionally, the equities market performance during the week was mainly driven by losses recorded by large cap stocks such as Safaricom, Equity Group, EABL and KCB Group of 12.2%, 4.8%, 3.1% and 2.3%, respectively. The losses were however mitigated by gains recorded by other large cap stocks such as Standard Chartered Bank of Kenya (SCBK), Bamburi and ABSA Bank of 2.6% and 1.8% and 1.2%, respectively;
Also during week, Stanbic holdings released its FY’2022 financial results recording a 25.7% increase in Core earnings per share to Kshs 22.9, from Kshs 18.2 in FY’2021;
Real Estate
During the week, President William Ruto presided over the ground breaking of 6,704 Affordable Housing units situated on 22.4 acre parcels of land in Ziwani, Starehe. In the retail sector, Tuskys Supermarket announced the closure of Tuskys Karasha branch located along Kenyatta Avenue in the Central Business District (CBD), Nairobi. In the Real Estate Investment Trusts (REITs) segment, Fahari I-REIT closed the week trading at an average price of Kshs 6.1 per share on the Nairobi Securities Exchange, an 8.5% loss from Kshs 6.6 per share recorded the previous week. On the Unquoted Securities Platform as at 10th March 2023, Acorn D-REIT and I-REIT closed the week trading at Kshs 23.9 and Kshs 20.9 per unit, respectively, a 19.4% and 4.4% gain for the D-REIT and I-REIT, respectively, from the Kshs 20.0 inception price;
Focus of the Week
On 24th February 2023, S&P Global downgraded Kenya’s credit outlook to negative from stable and followed a downgrade of the Long Term Foreign Currency issuer default ratings by Fitch Ratings on 14th December 2022. This comes at a time when the country is struggling with its liquidity position as a result of high debt service obligations and consequently being at high risk of debt distress. Kenya is also facing elevated inflationary pressures with inflation having increased to 9.2% in February 2023 from 9.0% in January 2023 mainly driven by high food and fuel prices. Kenya’s inflation has remained above the Central Bank of Kenya’s target range of 2.5%-7.5% with the 2022 average coming in at 7.6% reflecting the increased cost of living, which has also greatly impacted the business environment. Kenyan business environment deteriorated in the month of February 2023 with the Purchasing Managers Index (PMI) significantly declining to 46.6 from an 11-month high of 52.0 in January 2023. The deterioration was mainly attributable to low consumer demand consequently leading to low purchasing power because of tough economic situation. The Kenyan shilling is also rapidly depreciating against the United States Dollar, having depreciated by 4.4% in 2023, adding to further depreciations of 9.0% and 3.6% in 2022 and 2021, respectively. Consequently, this week, we shift our focus to analysing the country’s current economic status as well as providing recommended steps the government can take to improve the economic situation;
Investment Updates:
- Weekly Rates:
- Cytonn Money Market Fund closed the week at a yield of 11.03%. To invest, dial *809# or download the Cytonn App from Google Playstore here or from the Appstore here;
- Cytonn High Yield Fund closed the week at a yield of 13.93% p.a. To invest, email us at sales@cytonn.com and to withdraw the interest, dial *809# or download the Cytonn App from Google Playstore here or from the Appstore here;
- We continue to offer Wealth Management Training every Wednesday and every third Saturday of the month, from 9:00 am to 11:00 am, through our Cytonn Foundation. The training aims to grow financial literacy among the general public. To register for any of our Wealth Management Trainings, click here;
- If interested in our Private Wealth Management Training for your employees or investment group, please get in touch with us through wmt@cytonn.com;
- Cytonn Insurance Agency acts as an intermediary for those looking to secure their assets and loved ones’ future through insurance namely; Motor, Medical, Life, Property, WIBA, Credit and Fire and Burglary insurance covers. For assistance, get in touch with us through insuranceagency@cytonn.com;
- Cytonn Asset Managers Limited (CAML) continues to offer pension products to meet the needs of both individual clients who want to save for their retirement during their working years and Institutional clients that want to contribute on behalf of their employees to help them build their retirement pot. To more about our pension schemes, kindly get in touch with us through pensions@cytonn.com;
Real Estate Updates:
- For an exclusive tour of Cytonn’s real estate developments, visit: Sharp Investor's Tour, and for more information, email us at sales@cytonn.com;
- Phase 3 of The Alma is now ready for occupation and the show house is open daily. To join the waiting list to rent, please email properties@cytonn.com;
- We have 8 investment-ready projects, offering attractive development and buyer targeted returns; See further details here: Summary of Investment-ready Projects;
- For Third Party Real Estate Consultancy Services, email us at rdo@cytonn.com;
- For recent news about the group, see our news section here;
Hospitality Updates:
- We currently have promotions for Staycations. Visit cysuites.com/offers for details or email us at sales@cysuites.com;
Money Markets, T-Bills Primary Auction:
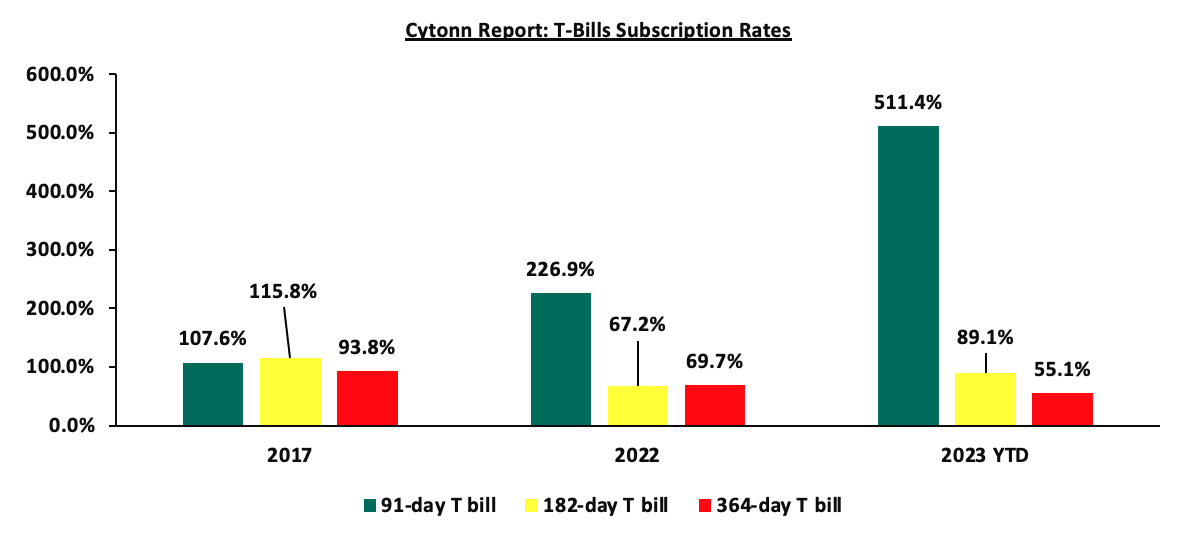
During the week, T-bills remained oversubscribed, with the overall subscription rate coming in at 148.5%, up from the 136.2% recorded the previous week. Investor’s preference for the shorter 91-day paper persisted as they sought to avoid duration risk, with the paper receiving bids worth Kshs 20.0 bn against the offered Kshs 4.0 bn, translating to an oversubscription rate of 501.0%, lower than the 555.7% recorded the previous week. The subscription rates for the 364-day and 182-day papers increased to 76.8% and 79.1%, from 44.5% and 60.2%, respectively, recorded the previous week. Key to note, the government continued to reject expensive bids, accepting bids worth Kshs 32.2 bn out of the Kshs 35.6 bn total bids received, translating to an acceptance rate of 90.3%. The yields on the government papers were on an upward trajectory, with the yields on the 364-day paper, 182-day and 91-day papers increasing by 5.7 bps, 5.1 bps and 4.4 bps to 10.7%, 10.2% and 9.7%, respectively. The chart below compares the overall average T- bills subscription rates obtained in 2017, 2022 and 2023 Year to Date (YTD):
In the primary market the Central Bank of Kenya released the auction results for the infrastructure bond IFB1/2023/017 with effective tenor to maturity of 17.0 years. In line with our expectations, the bond was oversubscribed, receiving bid worth Kshs 59.8 bn, against the offered Kshs 50.0 bn, translating to an oversubscription of 119.5%. However, the government continued to reject expensive bids, accepting bids worth Kshs 50.9 bn out of the Kshs 59.8 bn of total bids received, translating to an acceptance rate of 85.1%. The accepted weighted average yield for the bond came in at 14.4%, similar to the coupon rate.
Our view: Given the weighted average yield for the 17-year infrastructure bond is at 14.4%, a corporate bond will have to offer a higher yield of 17.0% to compete with the bond. Further, Corporate bonds are subject to 15.0% tax rate and assuming a 3.0% risk premium, this brings the total rate to 20.0%. As such, the Kenya’s private sector credit growth is going to be further undermined by the government’s need for borrowing to plug in the fiscal deficit, effectively crowding out the private sector.
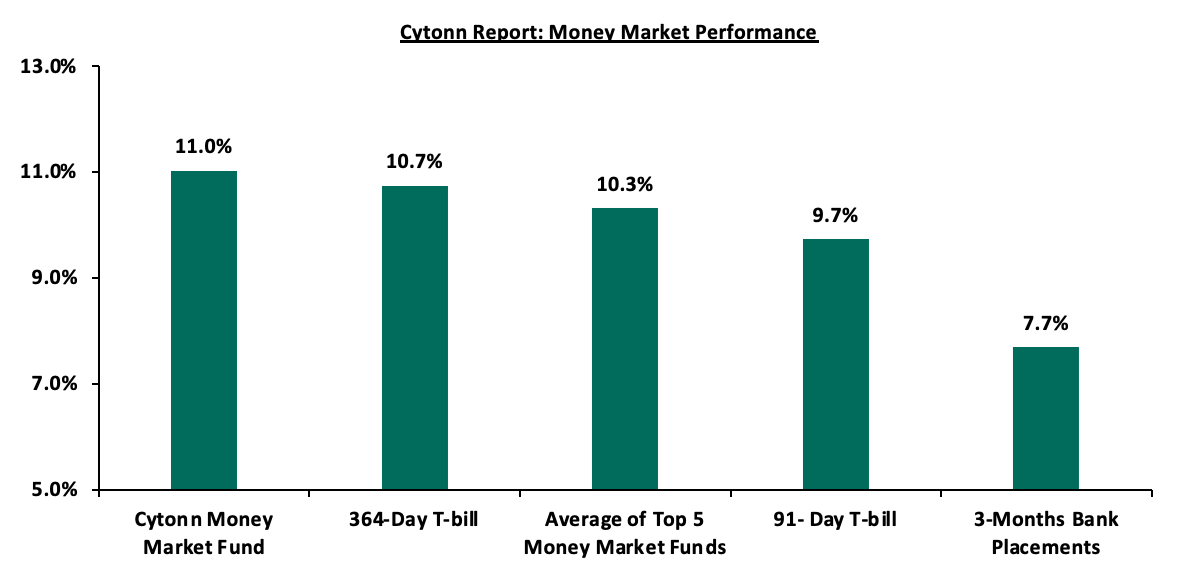
In the money markets, 3-month bank placements ended the week at 7.7% (based on what we have been offered by various banks), while the yield on the 364-day and 91-day T-bill increased by 5.7 bps and 4.4 bps to 10.7% and 9.7%, respectively. Similarly, the yield on Cytonn Money Market Fund increased by 20.0 bps to 11.0%, from 10.8% recorded the previous week. However, the average yields of the Top 5 Money Market Funds declined by 8.2 bps to close the week at 10.3%, from 10.4% recorded the previous week.
The table below shows the Money Market Fund Yields for Kenyan Fund Managers as published on 10th March 2023:
|
Cytonn Report: Money Market Fund Yield for Fund Managers as published on 10th March 2023 |
||
|
Rank |
Fund Manager |
Effective Annual Rate |
|
1 |
Cytonn Money Market Fund (dial *809# or download Cytonn App) |
11.0% |
|
2 |
Dry Associates Money Market Fund |
10.5% |
|
3 |
Apollo Money Market Fund |
10.2% |
|
4 |
NCBA Money Market Fund |
10.0% |
|
5 |
Kuza Money Market fund |
10.0% |
|
6 |
Sanlam Money Market Fund |
9.9% |
|
7 |
Zimele Money Market Fund |
9.9% |
|
8 |
Nabo Africa Money Market Fund |
9.9% |
|
9 |
Madison Money Market Fund |
9.9% |
|
10 |
Old Mutual Money Market Fund |
9.8% |
|
11 |
GenCap Hela Imara Money Market Fund |
9.8% |
|
12 |
KCB Money Market Fund |
9.8% |
|
13 |
AA Kenya Shillings Fund |
9.6% |
|
14 |
Co-op Money Market Fund |
9.6% |
|
15 |
Jubilee Money Market Fund |
9.5% |
|
16 |
GenAfrica Money Market Fund |
9.3% |
|
17 |
CIC Money Market Fund |
9.2% |
|
18 |
British-American Money Market Fund |
9.2% |
|
19 |
ICEA Lion Money Market Fund |
8.8% |
|
20 |
Orient Kasha Money Market Fund |
8.3% |
|
21 |
Absa Shilling Money Market Fund |
8.2% |
|
22 |
Mali Money Market Fund |
7.7% |
|
23 |
Equity Money Market Fund |
6.6% |
Source: Business Daily
Liquidity:
During the week, liquidity in the money markets remained tight, with the average interbank rate remaining relatively unchanged at 6.7%, as was recorded the previous week, partly attributable to government payments that offset tax remittances. The average interbank volumes traded increased by 1.1% to Kshs 21.3 bn from Kshs 21.0 bn recorded the previous week.
Kenya Eurobonds:
During the week, the yields on Eurobonds recorded a mixed performance with the yield on the 12-year Eurobond issued in 2019 recording the largest gain, having increased by 0.3% points to 11.3% from 11.0% recorded the previous week. The 10-year Eurobond issued in 2014 recorded the largest decline, having declined by 0.6% points to 11.8% from 12.4%, recorded the previous week. The table below shows the summary of the performance of the Kenyan Eurobonds as of 9th March 2023;
|
Cytonn Report: Kenya Eurobonds Performance |
||||||
|
|
2014 |
2018 |
2019 |
2021 |
||
|
Date |
10-year issue |
10-year issue |
30-year issue |
7-year issue |
12-year issue |
12-year issue |
|
Amount Issued (USD bn) |
2.0 |
1.0 |
1.0 |
0.9 |
1.2 |
1.0 |
|
Years to Maturity |
1.3 |
5.0 |
25.0 |
4.2 |
9.2 |
11.3 |
|
Yields at Issue |
6.6% |
7.3% |
8.3% |
7.0% |
7.9% |
6.2% |
|
2-Jan-23 |
12.9% |
10.5% |
10.9% |
10.9% |
10.8% |
9.9% |
|
1-Mar-23 |
12.1% |
10.7% |
11.0% |
10.9% |
10.8% |
10.2% |
|
2-Mar-23 |
12.4% |
11.0% |
11.1% |
11.3% |
11.0% |
10.4% |
|
3-Mar-23 |
11.8% |
10.9% |
10.9% |
11.2% |
10.8% |
10.2% |
|
6-Mar-23 |
11.4% |
10.6% |
10.7% |
10.7% |
10.6% |
10.0% |
|
7-Mar-23 |
11.5% |
10.7% |
10.8% |
10.8% |
10.7% |
10.1% |
|
8-Mar-23 |
11.7% |
11.0% |
11.0% |
11.1% |
10.9% |
10.3% |
|
9-Mar-23 |
11.8% |
11.2% |
11.3% |
11.1% |
11.3% |
10.5% |
|
Weekly Change |
(0.6%) |
0.2% |
0.2% |
(0.2%) |
0.3% |
0.1% |
|
MTD Change |
(0.2%) |
0.5% |
0.3% |
0.1% |
0.5% |
0.3% |
|
YTD Change |
(1.1%) |
0.7% |
0.4% |
0.1% |
0.5% |
0.7% |
Source: Central Bank of Kenya (CBK) and National Treasury
Kenya Shilling:
During the week, the Kenya Shilling depreciated by 1.1% against the US dollar to close the week at Kshs 128.9, from Kshs 127.5 recorded the previous week, partly attributable to increased dollar demand from importers, especially oil and energy sectors against a slower supply of hard currency. On a year to date basis, the shilling has depreciated by 4.4% against the dollar, adding to the 9.0% depreciation recorded in 2022. We expect the shilling to remain under pressure in 2023 as a result of:
- High global crude oil prices on the back of persistent supply chain bottlenecks coupled with high demand,
- An ever-present current account deficit estimated at 4.9% of GDP in 2022, despite improving by 0.3% points from 5.2% recorded in 2021,
- The need for Government debt servicing which continues to put pressure on forex reserves given that 69.3% of Kenya’s External debt was US Dollar denominated as of October 2022, and,
The shilling is however expected to be supported by:
- Improving diaspora remittances standing at USD 349.4 mn as at January 2023, representing a 3.2% y/y increase from USD 338.7 mn recorded in a similar period in 2022.
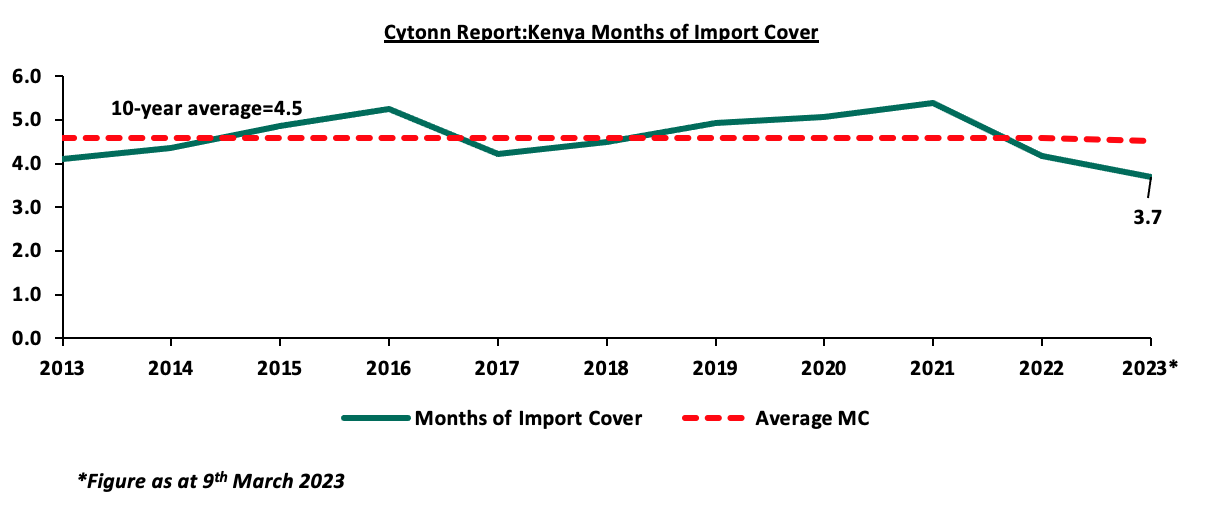
Key to note, Kenya’s forex reserves declined by 0.6% remaining relatively unchanged at USD 6.6 bn as at 9th March 2023, similar to what was recorded the previous week. As such, the country’s months of import cover also remained unchanged at 3.7 months, similar to what was recorded the previous week, and are below the statutory requirement of maintaining at least 4.0-months of import. The chart below summarizes the evolution of Kenya months of import cover over the last 10 years:
Rates in the Fixed Income market have remained relatively stable due to the relatively ample liquidity in the money market. The government is 7.0% behind its prorated borrowing target of Kshs 407.5 bn having borrowed Kshs 379.1 bn of the Kshs 581.7 bn borrowing target for the FY’2022/2023. We believe that the projected budget deficit of 5.7% is relatively ambitious given the downside risks and deteriorating business environment occasioned by high inflationary pressures. Further, revenue collections are lagging behind, with total revenue as at January 2023 coming in at Kshs 1.1 tn in the FY’2022/2023, equivalent to 53.3% of its target of Kshs 2.1 tn and 91.4% of the prorated target of Kshs 1.2 tn. Therefore, we expect a continued upward readjustment of the yield curve in the short and medium term, with the government looking to bridge the fiscal deficit through the domestic market. Owing to this, our view is that investors should be biased towards short-term fixed-income securities to reduce duration risk.
Market Performance:
During the week, the equities market was on a downward trajectory, with NASI, NSE 20 and NSE 25 declining by 6.6%, 1.6% and 4.3%, respectively, taking the YTD performance to losses of 7.4%, 4.0%, and 4.5% for NASI, NSE 20, and NSE 25, respectively. The downward trajectory of the Kenyan equities market was mainly attributable to capital flight as foreign investors moved to developed markets with the Fed expected to further hike their interest. Additionally, the equities market performance during the week was mainly driven by losses recorded by large cap stocks such as Safaricom, Equity Group, EABL and KCB Group of 12.2%, 4.8%, 3.1% and 2.3%, respectively. The losses were however mitigated by gains recorded by other large cap stocks such as Standard Chartered Bank of Kenya (SCBK), Bamburi and ABSA Bank of 2.6% and 1.8% and 1.2%, respectively.
During the week, equities turnover increased by 49.8% to USD 11.8 mn from USD 7.9 mn recorded the previous week taking the YTD turnover to USD 115.6 mn. Foreign investors turned net sellers, with a net selling position of USD 2.9 mn, from a net buying position of USD 0.8 mn recorded the previous week, taking the YTD net selling position to USD 28.0 mn.
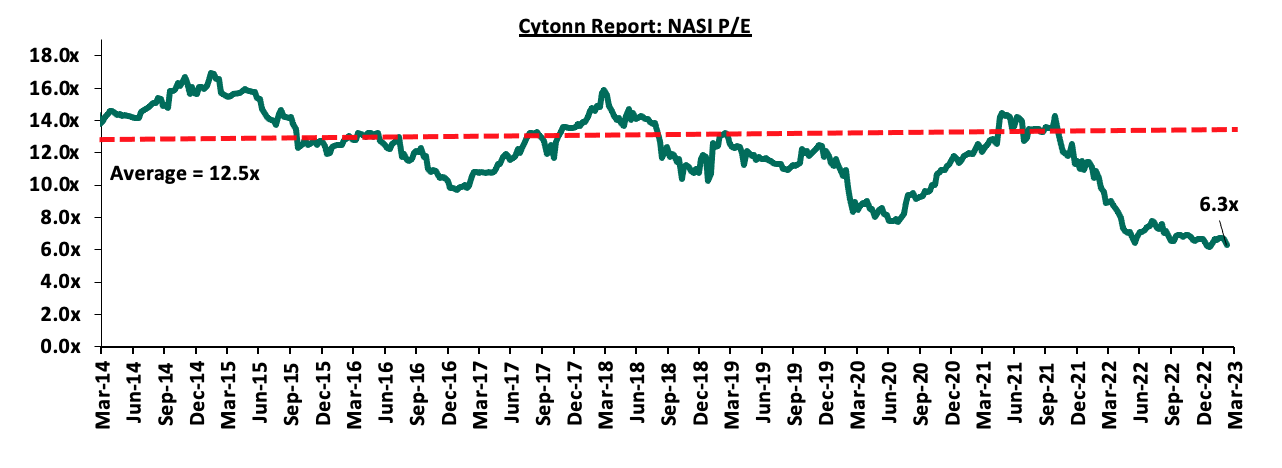
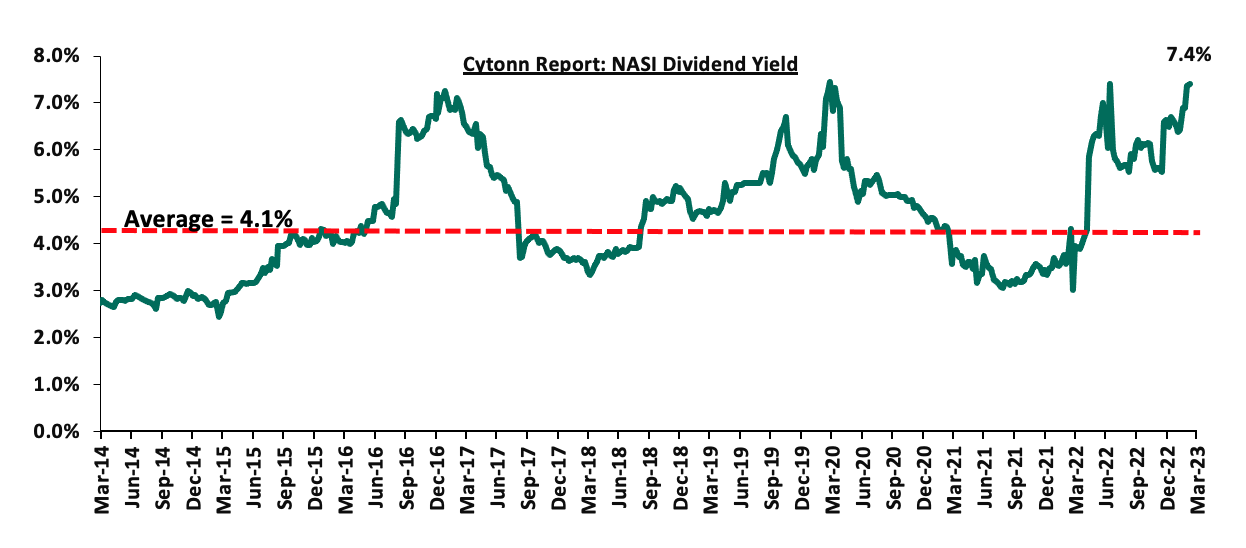
The market is currently trading at a price to earnings ratio (P/E) of 6.3x, 49.7% below the historical average of 12.5x, and a dividend yield of 7.4%, 3.3% points above the historical average of 4.1%. Key to note, NASI’s PEG ratio currently stands at 0.8x, an indication that the market is undervalued relative to its future growth. A PEG ratio greater than 1.0x indicates the market may be overvalued while a PEG ratio less than 1.0x indicates that the market is undervalued. The charts below indicate the historical P/E and dividend yields of the market;
Weekly highlight
- Earnings Release
During the week, Stanbic Holdings released their FY’2022 financial results. Below is a summary of the performance;
|
Balance Sheet |
FY'2021 |
FY'2022 |
y/y change |
|
Net Loans and Advances |
229.3 |
266.8 |
16.4% |
|
Government Securities |
40.6 |
58.0 |
42.9% |
|
Total Assets |
328.9 |
399.8 |
21.6% |
|
Customer Deposits |
254.6 |
304.3 |
19.5% |
|
Deposits Per Branch |
9.8 |
10.1 |
3.6% |
|
Total Liabilities |
272.4 |
337.6 |
23.9% |
|
Shareholders' Funds |
56.5 |
62.2 |
10.2% |
|
Key Ratios |
FY'2021 |
FY'2022 |
% point change |
|
Loan to Deposit ratio |
90.1% |
87.7% |
(2.4%) |
|
Return on average equity |
13.3% |
15.3% |
2.0% |
|
Return on average assets |
2.2% |
2.5% |
0.3% |
|
Income Statement |
FY'2021 |
FY'2022 |
y/y change |
|
Net interest Income |
14.4 |
18.9 |
31.8% |
|
Net non-interest income |
10.6 |
13.1 |
23.7% |
|
Total Operating income |
25.0 |
32.1 |
28.4% |
|
Loan loss provision |
(2.5) |
(4.9) |
95.9% |
|
Total Operating expenses |
(15.2) |
(19.9) |
30.7% |
|
Profit before tax |
9.8 |
12.2 |
24.8% |
|
Profit after tax |
7.2 |
9.1 |
25.7% |
|
Core EPS |
18.2 |
22.9 |
25.7% |
|
Income Statement Ratios |
FY'2021 |
FY'2022 |
y/y change |
|
Yield from interest-earning assets |
7.0% |
8.0% |
1.0% |
|
Cost of funding |
2.4% |
2.5% |
0.1% |
|
Net Interest Margin |
5.0% |
5.9% |
0.9% |
|
Net Interest Income as % of operating income |
57.5% |
59.1% |
1.6% |
|
Non-Funded Income as a % of operating income |
42.5% |
40.9% |
(1.6%) |
|
Cost to Income Ratio |
61.0% |
62.1% |
1.1% |
|
CIR without LLP |
50.9% |
46.7% |
(4.2%) |
|
Cost to Assets |
3.9% |
3.7% |
(0.2%) |
|
Capital Adequacy Ratios |
FY'2021 |
FY'2022 |
% points change |
|
Core Capital/Total Liabilities |
18.2% |
16.5% |
(1.7%) |
|
Minimum Statutory ratio |
8.0% |
8.0% |
|
|
Excess |
10.2% |
8.5% |
(1.7%) |
|
Core Capital/Total Risk Weighted Assets |
15.3% |
13.8% |
(1.5%) |
|
Minimum Statutory ratio |
10.5% |
10.5% |
|
|
Excess |
4.8% |
3.3% |
(1.5%) |
|
Total Capital/Total Risk Weighted Assets |
17.3% |
16.8% |
(0.5%) |
|
Minimum Statutory ratio |
14.5% |
14.5% |
|
|
Excess |
2.8% |
2.3% |
(0.5%) |
|
Liquidity Ratio |
47.9% |
45.2% |
(2.7%) |
|
Minimum Statutory ratio |
20.0% |
20.0% |
|
|
Excess |
27.9% |
25.2% |
(2.7%) |
|
Adjusted Core Capital/Total Deposit Liabilities |
18.3% |
16.5% |
(1.8%) |
|
Adjusted Core Capital/Total Risk Weighted Assets |
15.4% |
13.8% |
(1.6%) |
|
Adjusted Total Capital/Total Risk Weighted Assets |
17.3% |
16.8% |
(0.5%) |
Key take-outs from the earnings release include:
Earnings growth: Core earnings per share rose by 25.7% to Kshs 22.9, from Kshs 18.2 in FY’2021, lower than our projected growth to Kshs 25.8 in FY’2022, with the variance brought on by the lenders’ increased loan loss provision to Kshs 4.9 bn from Kshs 2.5 bn in FY’2021 which is in contrast to our projection of a 16.1% increase to Kshs 2.9 bn. The lender disclosed that its decision to significantly increase its loan loss provision is mainly due to elevated credit risk as a result of challenging economic environment which might impair loan repayments by its customers. The lender’s overall performance was driven by the 28.4% growth in total operating income to Kshs 32.1 bn, from Kshs 25.0 bn in FY’2021. However, it was weighed down by a 30.7% growth in total operating expenses to Kshs 19.9 bn, from Kshs 15.2 bn in FY’2021
Increased Provisioning: The Bank’s provisions increased by 38.9% to Kshs 12.2 bn from Kshs 8.8 bn recorded in FY’2021, mainly on the back of high credit risk brought on by deteriorated business environment, which necessitated increased provisioning to cover for the anticipated losses in the future. The high credit risk is further evidenced by the 26.4% increase in bank’s gross non-performing loans to Kshs 28.4 bn in FY’2022, from Kshs 22.5 bn recorded in FY’2021. Consequently, the NPL coverage increased to 63.1%, from 58.1% recorded in FY’2021, and,
For a comprehensive analysis, please see our Stanbic Holdings FY’2022 Earnings Note
Asset Quality
The table below is a summary of the listed banks that have released their FY’2022 results:
|
|
FY'2022 NPL Ratio* |
FY'2021 NPL Ratio** |
% point change in NPL Ratio |
FY'2022 NPL Coverage* |
FY'2021 NPL Coverage** |
% point change in NPL Coverage |
|
Stanbic Holdings |
10.0% |
9.3% |
0.7% |
63.1% |
58.1% |
5.0% |
|
Mkt Weighted Average |
10.0% |
12.3% |
(2.3%) |
63.1% |
65.5% |
(2.4%) |
|
*Market cap weighted as at 10/03/2023 |
||||||
|
**Market cap weighted as at 14/04/2022 |
||||||
Key take-outs from the table include;
- Asset quality for the listed banks improved as evidenced by a 2.3% points decline in market weighted average NPL ratio to 10.0%, from a 12.3% in FY’2021. The listed banks’ asset quality was however skewed by deterioration in Stanbic holdings’ asset quality with its NPL ratio increasing by 0.7% points to 10.0% from 9.3% in FY’2021, and,
- Market weighted average NPL Coverage for the listed banks declined by 2.4% points to 63.1% in FY’2022, from 65.5% recorded in FY’2021. However, Stanbic Holdings’ NPL coverage increased by 5.0% points to 63.1% in FY’2022 from 58.1% in FY’2021 as the lender increased its provisioning due to credit impairment on some of its issued loans.
Summary performance
The table below highlights the performance listed banks, showing the performance using several metrics:
|
Bank |
Core EPS Growth |
Interest Income Growth |
Interest Expense Growth |
Net Interest Income Growth |
Net Interest Margin |
Non-Funded Income Growth |
NFI to Total Operating Income |
Growth in Total Fees & Commissions |
Deposit Growth |
Growth in Government Securities |
Loan to Deposit Ratio |
Loan Growth |
Return on Average Equity |
|
Stanbic |
25.7% |
31.8% |
15.2% |
31.8% |
5.9% |
23.7% |
40.9% |
(0.5%) |
19.5% |
42.9% |
87.8% |
16.4% |
15.3% |
|
FY'22 Mkt Weighted Average* |
25.7% |
31.8% |
15.2% |
31.8% |
5.9% |
23.7% |
40.9% |
(0.5%) |
19.5% |
42.9% |
87.8% |
16.4% |
15.3% |
|
FY'21 Mkt Weighted Average** |
82.9% |
13.8% |
11.5% |
15.2% |
7.1% |
10.9% |
34.7% |
16.6% |
13.5% |
18.1% |
69.7% |
13.5% |
20.2% |
|
*Market cap weighted as at 10/03/2023 |
|||||||||||||
|
**Market cap weighted as at 14/04/2022 |
|||||||||||||
Key take-outs from the table include;
- Stanbic Holdings recorded a 25.7% growth in core Earnings per Share (EPS) in FY’2022, compared to the listed banking sector’s market weighted average growth of 82.9% in FY’2021,
- The Banks’ Interest income grew by 31.8% compared to the market weighted average growth of 13.8% in FY’2021, while Non-Funded Income grew by 23.7% compared to market weighted average growth of 10.9% in FY’2021,
- The Bank recorded a deposit growth of 19.5%, higher than the market weighted average deposit growth of 13.5% in FY’2021, highlighting increased investment risk in the business environment, and,
- Stanbic Holdings loan book grew by 16.4% in FY’2022 compared to market weighted average growth of 13.5% in FY’2021, taking its loan to deposit ratio to 87.8% compared to a 69.7% market weighted average loan to deposit ratio in FY’2021.
Universe of coverage:
|
Company |
Price as at 03/03/2023 |
Price as at 10/03/2024 |
w/w change |
YTD Change |
Year Open 2023 |
Target Price* |
Dividend Yield**** |
Upside/ Downside** |
P/TBv Multiple |
Recommendation |
|
Jubilee Holdings |
184.0 |
175.8 |
(4.5%) |
(11.6%) |
198.8 |
305.9 |
8.0% |
82.0% |
0.3x |
Buy |
|
Kenya Reinsurance |
1.7 |
1.7 |
0.0% |
(9.1%) |
1.9 |
2.5 |
5.9% |
53.5% |
0.1x |
Buy |
|
KCB Group*** |
38.4 |
37.5 |
(2.3%) |
(2.3%) |
38.4 |
52.5 |
8.0% |
48.2% |
0.6x |
Buy |
|
Britam |
5.0 |
4.9 |
(1.6%) |
(5.4%) |
5.2 |
7.1 |
0.0% |
44.7% |
0.8x |
Buy |
|
Sanlam |
8.7 |
8.7 |
0.7% |
(9.0%) |
9.6 |
11.9 |
0.0% |
36.6% |
0.9x |
Buy |
|
Equity Group*** |
45.2 |
43.0 |
(4.8%) |
(4.6%) |
45.1 |
58.4 |
7.0% |
42.7% |
1.0x |
Buy |
|
Liberty Holdings |
5.0 |
4.5 |
(9.8%) |
(10.5%) |
5.0 |
6.8 |
0.0% |
49.7% |
0.3x |
Buy |
|
ABSA Bank*** |
12.4 |
12.6 |
1.2% |
2.9% |
12.2 |
15.5 |
8.8% |
31.9% |
1.1x |
Buy |
|
Co-op Bank*** |
12.8 |
12.5 |
(2.0%) |
3.3% |
12.1 |
15.5 |
8.0% |
31.8% |
0.7x |
Buy |
|
NCBA*** |
37.1 |
36.8 |
(0.7%) |
(5.5%) |
39.0 |
43.4 |
8.2% |
26.1% |
0.8x |
Buy |
|
I&M Group*** |
18.0 |
18.0 |
0.0% |
5.6% |
17.1 |
20.8 |
8.3% |
24.0% |
0.5x |
Buy |
|
Diamond Trust Bank*** |
50.0 |
49.7 |
(0.5%) |
(0.3%) |
49.9 |
57.1 |
6.0% |
21.0% |
0.2x |
Buy |
|
Stanbic Holdings |
100.0 |
108.8 |
8.7% |
6.6% |
102.0 |
112.0 |
11.6% |
14.6% |
1.0x |
Accumulate |
|
CIC Group |
2.0 |
2.0 |
(0.5%) |
3.1% |
1.9 |
2.3 |
0.0% |
17.8% |
0.7x |
Accumulate |
|
Standard Chartered*** |
162.8 |
167.0 |
2.6% |
15.2% |
145.0 |
166.3 |
11.4% |
10.9% |
1.1x |
Accumulate |
|
HF Group |
3.3 |
3.5 |
6.4% |
11.1% |
3.2 |
3.4 |
0.0% |
(2.0%) |
0.2x |
Sell |
|
*Target Price as per Cytonn Analyst estimates **Upside/ (Downside) is adjusted for Dividend Yield ***For Disclosure, these are stocks in which Cytonn and/or its affiliates are invested in ****FY’2021 Total dividends excluding (Stanbic Holdings updated with FY 2022 Dividend) |
||||||||||
We are “Neutral” on the Equities markets in the short term due to the current adverse operating environment and huge foreign investor outflows, and, “Bullish” in the long term due to current cheap valuations and expected global and local economic recovery.
With the market currently trading at a discount to its future growth (PEG Ratio at 0.8x), we believe that investors should reposition towards value stocks with strong earnings growth and that are trading at discounts to their intrinsic value. We expect the current high foreign investors sell-offs to continue weighing down the equities outlook in the short term.
- Residential Sector
During the week, President William Ruto presided over the ground breaking of 6,704 Affordable Housing units situated on 22.4 acre parcels of land in Ziwani, Starehe. The Kshs 13.0 bn project is set to be funded by GulfCap Africa Limited through a Public-Private Partnership (PPP) agreement that will see the Government provide the land. According to the initial design plan, the project was planned to consist of 370 housing units. However, following a Presidential directive, the number of units to be delivered was increased to 6,704 units with prices starting at Kshs 1.2 mn. Out of the 6,704 units, 2,000 units will be allocated to the social housing program which aims at improving informal settlements by reserving the units exclusively to low-income residents. The project will comprise of residential housing units, and social amenities including children’s playground, sports facilities, gym, swimming pool, green spaces, outdoor recreational facilities, food courts, community centers and an Early Childhood Development (ECD) centre. Construction of the project will be spearheaded by GulfCap Africa Limited, and is planned to be delivered in five phases over a five-year duration, scheduled for completion in February 2026. Other notable projects by the developer include Phase one of the Buxton Affordable Housing project in Mombasa which delivered 584 units. Following the design changes, the exact details for the housing units are yet to be disclosed.
The Ziwani Starehe project launch is a step towards the government’s commitment towards achieving the affordable housing agenda by supporting the construction of 200,000 units annually. Other affordable housing projects launched by President Ruto’s administration include Kings Boma Estate in Ruiru, Shauri Moyo, Mukuru kwa Njenga, Kibera Soweto B, and Homa Bay projects. The government also commissioned Kings Serenity Project in Ongata Rongai in October 2022. The table below shows other affordable housing projects in the pipeline;
|
Cytonn Report: Notable Ongoing Affordable Housing Projects by the Government |
|||
|
Name |
Developer |
Location |
Number of Units |
|
Ziwani Starehe Affordable Housing Project |
National Government and GulfCap Africa Limited |
Ziwani |
6,704 |
|
Pangani Affordable Housing Program |
National Government and Tecnofin Kenya Limited |
Pangani |
1,562 |
|
River Estate Affordable Housing Program |
National Government and Erdemann Property Limited |
Ngara |
2,720 |
|
Park Road Affordable Housing Program |
National Housing Corporation |
Ngara |
1,370 |
|
Mukuru Affordable Housing Program |
National Housing Corporation |
Mukuru kwa Njenga, Enterprise Road |
15,000 |
|
Mavoko Affordable Housing Project |
National Government and Epco Builders |
Syokimau, Machakos County |
5,360 |
|
NHC Stoni Athi View (Economy Block-Rental) |
National Housing Corporation |
Athi River, Machakos County |
50 |
|
NHC Stoni Athi View |
National Housing Corporation |
Athi River, Machakos County |
120 |
|
Mariguini Informal Settlement |
National Government |
Starehe, Nairobi County |
2,600 |
|
Kibera Soweto East Zone B |
National Government |
Kibera, Nairobi County |
3,000 |
|
Starehe Affordable Housing Project |
National Government and Tecnofin Kenya Limited |
Starehe, Nairobi County |
3,000 |
|
Shauri Moyo A Affordable Housing Units |
National Government and Epco Builders |
Shauri Moyo, Nairobi County |
2,731 |
|
Clay City Project |
Housing Finance Development and Investment and Clay Works Limited |
Kasarani, Thika Road |
1,800 |
|
Bachelors Jevanjee Estate |
County Government of Nairobi and Jabavu Village |
Ngara |
720 |
|
Kings Boma Estate |
National Government and Kings Developers Limited |
Ruiru, Kiambu County |
1,050 |
|
Total |
|
|
47,787 |
Source: Boma Yangu
The project is expected to; i) elevate the living standards of residents through providing affordable, quality, descent housing and social amenities, ii) improve the livelihood of surrounding residents through the creation of an estimated 10,000 jobs and employment opportunities both directly and indirectly, iii) promote economic growth by supporting the local manufacturing sector through extending tenders worth Kshs 0.5 bn to local Micro Small Medium Enterprises (MSMEs) in a plan to source building materials such as doors and windows locally, iv) promote inclusion of women in the business sector as approximately 50.0% of tenders will be extended to women, v) assist curb the existing housing deficit currently standing at 80.0%, and, vi) boost home ownership rates which have remained low especially in urban areas at 22.0%. The developer is also expected to upgrade Ziwani dispensary and a local school. The graph below highlights home ownership rates in different African countries;
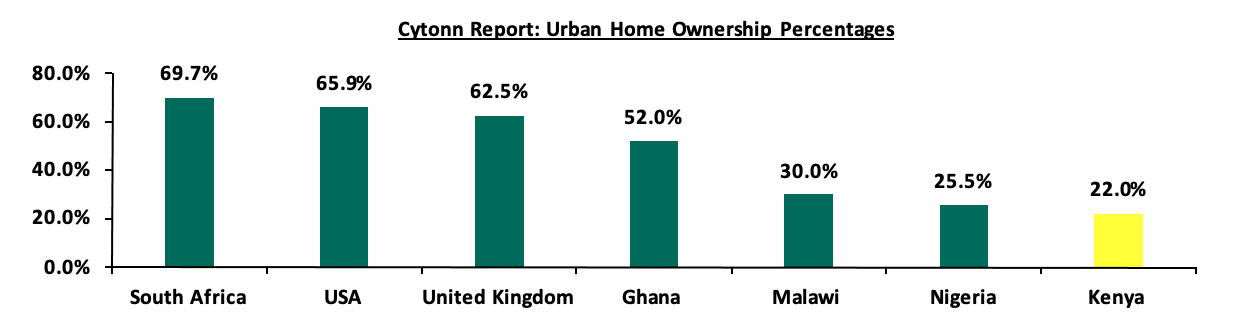
Source: Centre for Affordable Housing Finance Africa (CAHF), US Census Bureau, UK Office for National Statistics
We expect to see the launch and completion of more affordable housing projects as the year progresses owing to the traction gained by the AHP, and more developers enter into Public-Private Partnership (PPPs) agreements with both the national and county governments in efforts to realize the affordable housing agenda.
- Retail Sector
During the week, Tuskys Supermarket announced the closure of Tuskys Karasha branch located along Kenyatta Avenue in the Central Business District (CBD), Nairobi. This has brought down the number of the retailers operating outlets countrywide to five; Tuskys Imara, Tuskys Athi River where its headquarters are located, Tuskys Buruburu, Tuskys Ongata Rongai, and Tuskys Oltalet Narok located in Oltalet Mall. Notably, Tuskys Imara branch along Tom Mboya is the last remaining of the retailer’s outlets in the CBD. Tuskys cited poor performance occasioned by reduced footfall and operations owing to the tough micro-economic environment as main factors that influenced its decision to shut down the branch. In light of the retailers exit, we expect the existing oversupply of retail spaces in the Nairobi Metropolitan Area (NMA) standing at approximately 3.0 mn SQFT to widen further. The table below shows the number of stores operated by key local and international retail supermarket chains in Kenya;
|
Cytonn Report: Main Local and International Retail Supermarket Chains |
|||||||||||
|
Name of retailer |
Category |
Branches as at FY’2018 |
Branches as at FY’2019 |
Branches as at FY’2020 |
Branches as at FY’2021 |
Branches as at FY’2022 |
Branches opened in 2023 |
Closed branches |
Current branches |
Branches expected to be opened |
Projected branches FY’2023 |
|
Naivas |
Local |
46 |
61 |
69 |
79 |
91 |
0 |
0 |
91 |
0 |
91 |
|
Quick Mart |
Local |
10 |
29 |
37 |
48 |
55 |
1 |
0 |
56 |
0 |
56 |
|
Chandarana |
Local |
14 |
19 |
20 |
23 |
26 |
0 |
0 |
26 |
0 |
26 |
|
Carrefour |
International |
6 |
7 |
9 |
16 |
19 |
0 |
0 |
19 |
0 |
19 |
|
Cleanshelf |
Local |
9 |
10 |
11 |
12 |
12 |
1 |
0 |
13 |
0 |
13 |
|
Tuskys |
Local |
53 |
64 |
64 |
6 |
6 |
0 |
59 |
5 |
0 |
5 |
|
Game Stores |
International |
2 |
2 |
3 |
3 |
0 |
0 |
3 |
0 |
0 |
0 |
|
Uchumi |
Local |
37 |
37 |
37 |
2 |
2 |
0 |
35 |
2 |
0 |
2 |
|
Choppies |
International |
13 |
15 |
15 |
0 |
0 |
0 |
15 |
0 |
0 |
0 |
|
Shoprite |
International |
2 |
4 |
4 |
0 |
0 |
0 |
4 |
0 |
0 |
0 |
|
Nakumatt |
Local |
65 |
65 |
65 |
0 |
0 |
0 |
65 |
0 |
0 |
0 |
|
Total |
|
257 |
313 |
334 |
189 |
211 |
2 |
183 |
212 |
0 |
212 |
Source: Cytonn Research
Tuskys has been struggling to revive its supermarket chain since February 2020 when the its liquidation issues first surfaced, forcing the retailer to close a majority of its branches and joined the list of local retailers who have exited the market such as Nakumatt, Uchumi, Game Stores, Shoprite, and Choppies. We expect that; i) the surging inflation driving up costs of businesses and curtailing consumer purchasing power, ii) the fast paced growth of e-commerce, and, iii) the existing oversupply of retail space standing at approximately 3.0 mn SQFT in the NMA retail sector and 1.7 mn SQFT in the non-NMA regions, will weigh down performance of the Kenyan retail sector. However, we anticipate that the ongoing aggressive expansion drive by both local and international retailers such as Naivas, Quickmart, and Carrefour will help cushion the sector’s performance.
- Real Estate Investments Trusts (REITs)
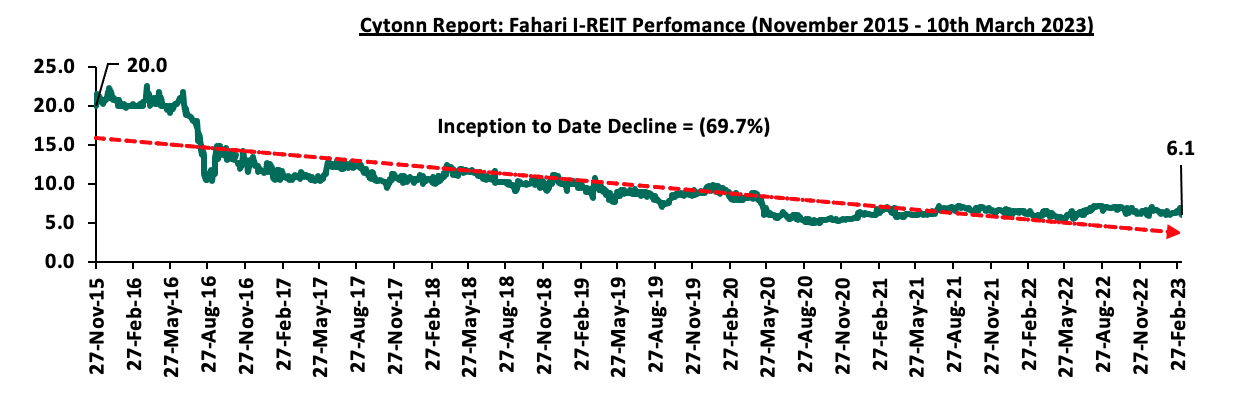
In the Nairobi Securities Exchange, ILAM Fahari I-REIT closed the week trading at an average price of Kshs 6.1 per share. The performance represented an 8.5% loss from Kshs 6.6 per share recorded the previous week, taking it to a 10.6% Year-to-Date (YTD) decline from Kshs 6.8 per share recorded on 3rd January 2023. In addition, the performance represented a 69.7% Inception-to-Date (ITD) loss from the Kshs 20.0 price. The dividend yield currently stands at 8.3%. The graph below shows Fahari I-REIT’s performance from November 2015 to 10th March 2023;
In the Unquoted Securities Platform, Acorn D-REIT and I-REIT traded at Kshs 23.9 and Kshs 20.9 per unit, respectively, as at 10th March 2023. The performance represented a 19.4% and 4.4% gain for the D-REIT and IREIT, respectively, from the Kshs 20.0 inception price. The volumes traded for the D-REIT and I-REIT came in at 12.3 mn and 29.4 mn shares, respectively, with a turnover of Kshs 257.5 mn and Kshs 600.4 mn, respectively, since inception in February 2021.
We expect the performance of Kenya’s Real Estate sector to remain on an upward trajectory, supported by factors such as; i) the launch and completion of various affordable housing projects across the country, ii) aggressive expansion drive of both local and international retailers, and, iii) increasing demand for Real Estate facilitated by positive demographics such as high urbanization and population growth rates. However, the existing oversupply of physical space in selected sectors, rising inflation driving up costs of businesses hindering consumer purchasing power, and low investor appetite for REITs are expected to continue subduing the optimum performance of the sector.
On 24th February 2023, S&P Global downgraded Kenya’s credit outlook to negative from stable and followed a downgrade of the Long Term Foreign Currency issuer default ratings by Fitch Ratings on 14th December 2022. This comes at a time when the country is struggling with its liquidity position as a result of high debt service obligations and as a result, being at high risk of debt distress. Kenya is also facing elevated inflationary pressures with inflation having increased to 9.2% in February 2023 from 9.0% in January 2023 mainly driven by high food and fuel prices. Kenya’s inflation has remained above the Central Bank of Kenya’s target range of 2.5%-7.5% with the 2022 average coming in at 7.6% reflecting the increased cost of living, which has also greatly impacted the business environment. Kenyan business environment deteriorated in the month of February 2023 with the Purchasing Managers Index (PMI) significantly declining to 46.6 from an 11-month high of 52.0 in January 2023. The deterioration was mainly attributable to low consumer demand consequently leading to low purchasing power because of tough economic situation. The Kenyan shilling is also rapidly depreciating against the United States Dollar, having depreciated by 4.4% in 2023, adding to further depreciations of 9.0% and 3.6% in 2022 and 2021, respectively. The currency depreciation challenge is mainly driven by an ever present and now inflated energy bill, high demand for dollar by importers and external debt servicing costs and this has led to deterioration of forex reserves. The above trends have led to anxiety about the direction of the economy, hence this week, we shift our focus to analyzing the country’s current economic status as well as providing recommended steps the government can take to improve the economic situation. To achieve this, we shall cover the following topics;
- Introduction
- Economic Performance
- Analysis of Key Macroeconomic Indicators
- Recommendations
Section 1: Introduction
Recently, S&P Global downgraded Kenya’s credit outlook to negative outlook from stable due to tight liquidity position as the country has a high debt service obligation, with debt service to revenue being at 55.0% as of January 2023. This followed a downgrade of Kenya’s Long-Term Foreign Currency issuer default ratings to “B” from “B+” by Fitch Ratings in December 2022. Below is a table showing Kenya’s previous credit ratings;
|
Cytonn Report:Kenya’s Credit Rating |
|||||
|
Rating Agency |
Current Rating |
Current Outlook |
Previous Rating |
Previous Outlook |
Date Released |
|
Fitch Ratings |
B |
Stable |
B+ |
Negative |
14th December 2022 |
|
S&P Global |
B+ |
Negative |
B |
Stable |
24th February 2023 |
Source: S&P Global, Fitch Ratings
The downgrade in the ratings was mainly as a result of Kenya’s weakening liquidity position on the back of high debt servicing cost. Kenya is under high risk of debt distress with the Public debt to GDP ratio at 62.3%, adding to a debt service to revenue ratio at 55.0% as of January 2023 and an impending maturity of the USD 2.0 bn, 10-year Eurobond maturing in June 2024. Notably, out of the country’s total debt, 49.8% is external debt stock largely denominated in foreign currency hence exposing the country to forex exchange risks. Additionally, the investor sentiments concerning government domestic bonds have deteriorated as a result of investors attaching higher risks in government’s debt. This has led to demand for higher yields by investors further increasing the cost of debt servicing. The downgrade was also attributable to gradual depletion of forex reserves which are currently at 3.7 months of import cover, which is below the 4-month statutory requirement. The reserves are under pressure due to high demand for dollars by importers especially the energy sector. As such, Kenya’s liquidity position is weak on the back of constrained access to international and domestic market because of the high interest demand by investors to cushion against possible risks.
Section 2: Economic Performance
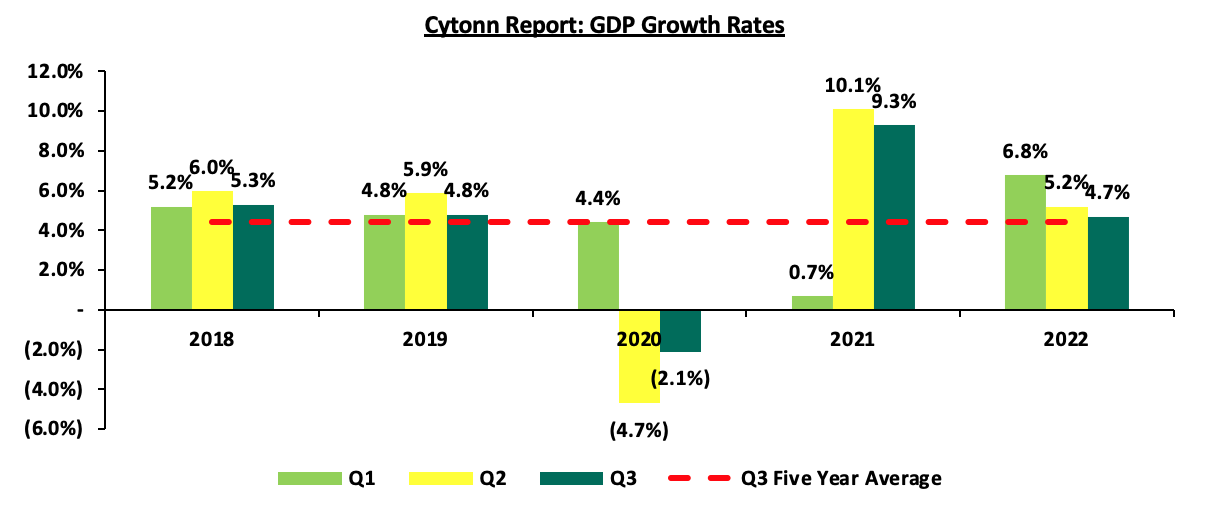
According to Kenya National Bureau of Statistics (KNBS) Q3’2022 Gross Domestic Product Report, the Kenyan economy grew by 4.7% in Q3’2022, significantly lower than the 9.3% growth recorded in a similar period in 2021. The lower growth is attributable to a lower base effect, given that in Q3’2020, majority of the economy was in standstill at the height of the COVID-19 pandemic. Agriculture and Forestry sector remained the largest contributors of GDP, at a rate of 14.8% followed by real estate at 10.5%. However, the agricultural sector contributions to GDP declined to 14.8% from 16.3% in Q3’2021. The GDP average for Q1’2022, Q2’2022 and Q3’2022 came in at 5.6% compared to an average of 6.9% in 2021 during the same period. The chart below shows the quarterly growth rates within the last 5 years;
Source: KNBS
According to the various accredited bodies, GDP growth in 2022 and 2023 is projected as follows;
|
Cytonn Report: GDP Growth Rates |
|||
|
No. |
Organization |
2022 Projections |
2023 Projections |
|
1 |
International Monetary Fund |
5.3% |
5.1% |
|
2 |
National Treasury |
5.8% |
6.1% |
|
4 |
Cytonn Investment Management PLC |
4.5% |
5.0% |
|
5 |
World Bank |
5.5% |
5.0% |
|
|
Average |
5.1% |
5.3% |
Source: National Treasury, IMF, World Bank, Cytonn
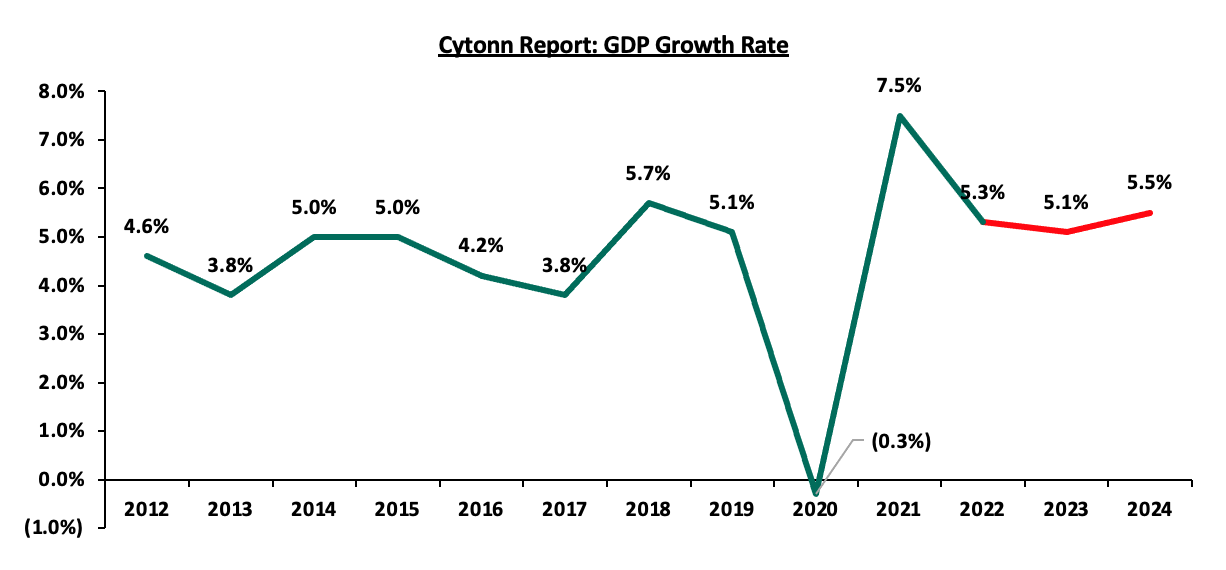
Source: IMF
GDP rose sharply in 2021 to 7.5% from a contraction of 0.3% in 2020 as a result of base effect. Besides this, key sectors of the economy such as agriculture have also declined. Over the years, agriculture has been one of the largest contributors to GDP as evidenced by figures in Q3’2022 GDP report. However, it is important to note that contribution has been declining with the contribution in Q3’2022 coming in at 14.8%, a fall from 16.2% in Q2’2022. In terms of growth, the sector recorded a decline of 0.6% in Q3’2022 when compared to a growth of 0.6% in the same period in 2021. The subdued growth is mainly attributable unfavorable weather conditions during the period and expensive farm inputs such as fertilizer increasing the cost of production. The GDP has also been affected by the widening of trade balance deficit to Kshs 434.0 bn from a deficit of Kshs 366.1 bn in the same quarter in 2021. This was mainly driven by the huge amount of imports at Kshs 661.8 bn compared to exports of Kshs 227.8 bn. The increasing imports is mainly from petroleum products which more than doubled to Kshs 182.6 bn in Q3’2022 from Kshs 82.3 bn in the same period in 2021. Besides agriculture and widening trade balance deficit, the performance of the GDP is also being weighed down by high debt service cost, inflation, among others as explained further in this report.
Section 3: Analysis of Key Macroeconomic Indicators
- Inflation
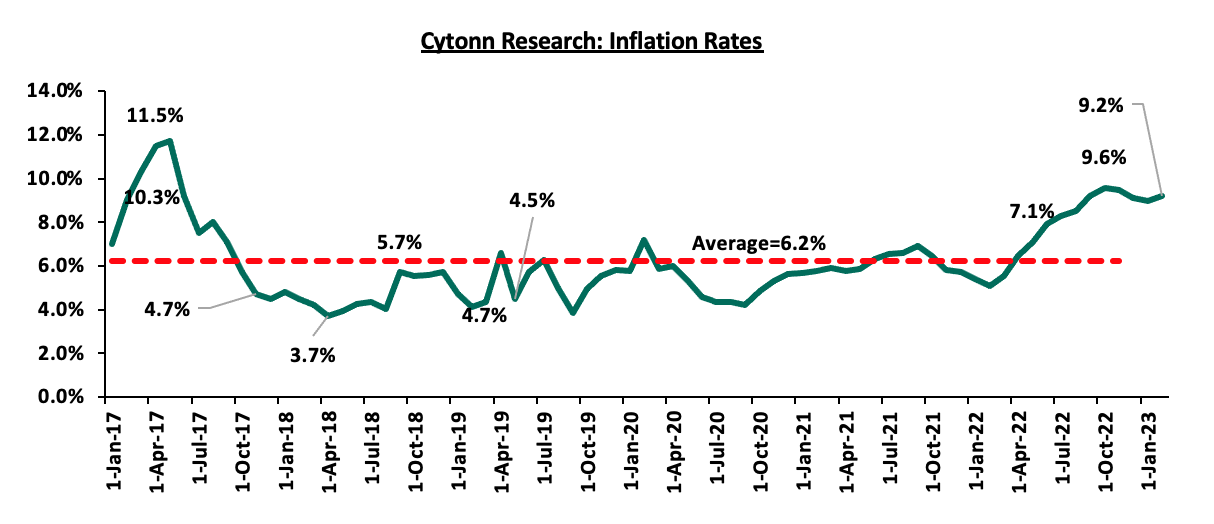
As of February 2023, the y/y inflation came in at 9.2%, up from the 9.0% recorded in January 2023, remaining above the Central Bank’s target range of 2.5%-7.5%. The headline inflation has been driven by high food and fuel prices. The high food prices are mainly as a result of erratic weather conditions that has resulted in the long drought experienced in the country and the high cost of farm inputs hiking the cost of production. On the other hand, the elevated fuel prices have been exacerbated by the global supply chain constraints and the partial removal of fuel subsidies. Despite fuel prices remaining unchanged since December 2022, at Kshs 177.3, Kshs 162.0 and Kshs 145.9 per litres of Super Petrol, Diesel and Kerosene, respectively, they remained elevated. This is in comparison to December 2021 fuel prices which were at Kshs 129.7, Kshs 110.6 and Kshs 103.5 per litre for Super Petrol, Diesel and Kerosene, respectively. The chart below shows the monthly inflation since 2017;
Source: KNBS
The annual average inflation for 2022 came in at 7.6%, which was above the government’s target range mainly attributable to supply chain constraints, drought leading to food shortage and currency depreciation. According to International Monetary Fund (IMF), inflation is expected to ease to 6.6% and 5.1%, in 2023 and 2024, respectively, falling back within the CBK’s range. The decline is to be driven by an expected cooling in inflation, both globally and locally as the tightened monetary policy continues to take effect. However, the current high global crude oil prices as well as high food prices, will continue putting pressure on the inflation rate in the short term. Additionally, the current administration is keen to phase out consumption subsidies which will see increases in prices of fuel and electricity.
The chart below shows the inflation trend for the last 10 years and projections;
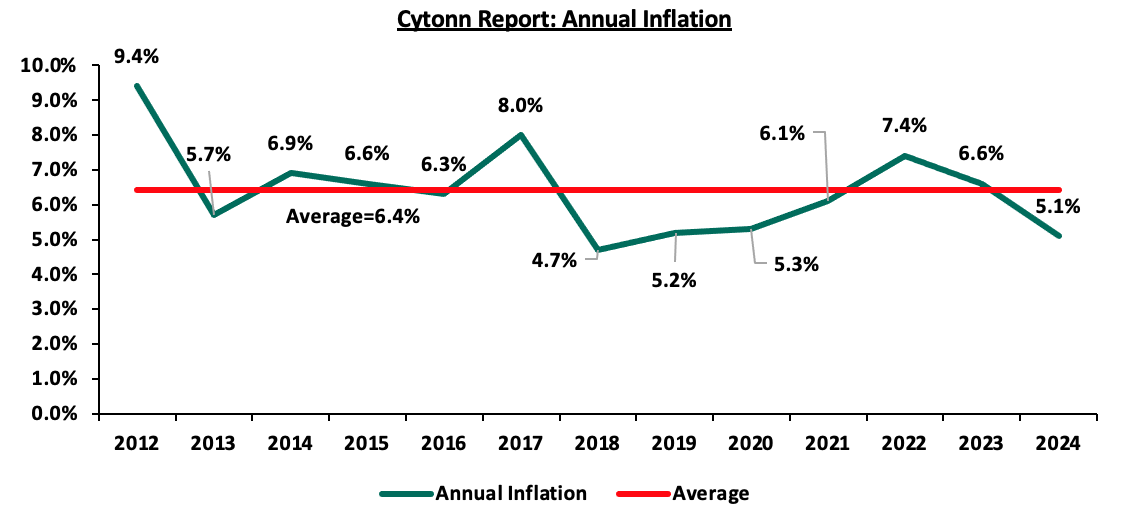
Source: IMF
Our outlook – We have a Negative outlook on inflation as it is expected to remain elevated in the coming months. This is despite the effects of the tightened monetary policy yet to be fully felt with the Fed Rate expected to further hike. The performance of the inflation will also be based on the government’s actions to provide subsidized agricultural inputs to reduce food pressure in the long term and the duty free importation of maize and rice to cushion high prices in the short term.
- Currency Performance
The shilling has continued to depreciate in against the dollar having depreciated by 4.4% YTD in 2023 to Kshs 128.9 as at 10th March from Kshs 123.4 at the beginning of the year. Additionally, the shilling depreciated by 9.0% in 2022 closing the year at Kshs 123.4 from Kshs 113.1 in January 2022. The depreciation is mainly attributable to the ever present current account deficit which was at 4.9% of GDP in 2022, being that Kenya is a net importer. This has increased dollar demand in the market leading to further depreciation. Additionally, the currently high global crude oil prices have increased the dollar demand from oil and energy importers who will have to increase the amounts they pay for oil imports and hence depleting dollar supply in the market. Consequently, this has deteriorated the forex reserves taking the country’s months of import cover to 3.7 months from 4.2 months recorded at the beginning of 2023. The cover is below the statutory requirement of maintaining at least 4.0-months of import cover. However, the government is trying to mitigate the ongoing currency depreciation and depletion of forex reserves by importing oil through government-government deal on credit with payments being made at a later period within six months to one year with an expectation of easing forex pressure. The chart below shows the performance of shillings against USD;
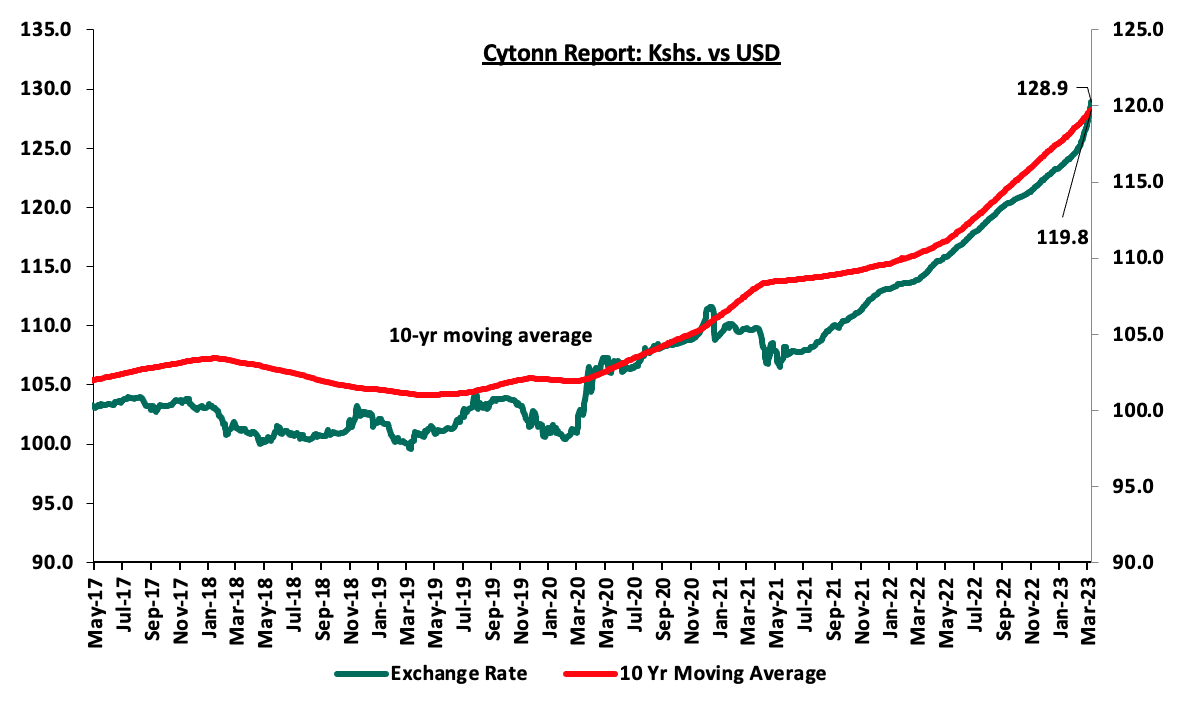
Source: CBK
Our Outlook – Our outlook is Negative since we expect the currency depreciation to persist driven by the ever present current account deficit with Kenya being a net importer and the high global crude oil prices weighing in on the dollar demand from oil and energy importers.
- Purchasing Managers Index (PMI)
The February 2023 Purchasing Managers Index (PMI) declined for the first time in six months to 46.6% from an 11-month high of 52.0 in January 2023. This signals a significant deterioration in the business environment mainly on the back of persistent elevated inflation which weighs down on the consumer spending, currency depreciation and supply chain constraints. In 2022, the index averaged 49.2 indicating that the business environment was subdued due to tough economic situations and the pre-election jitters. However, the index improved during the period between September and December 2022 averaging 51.1. The chart below shows the PMI trend for the last eight years;
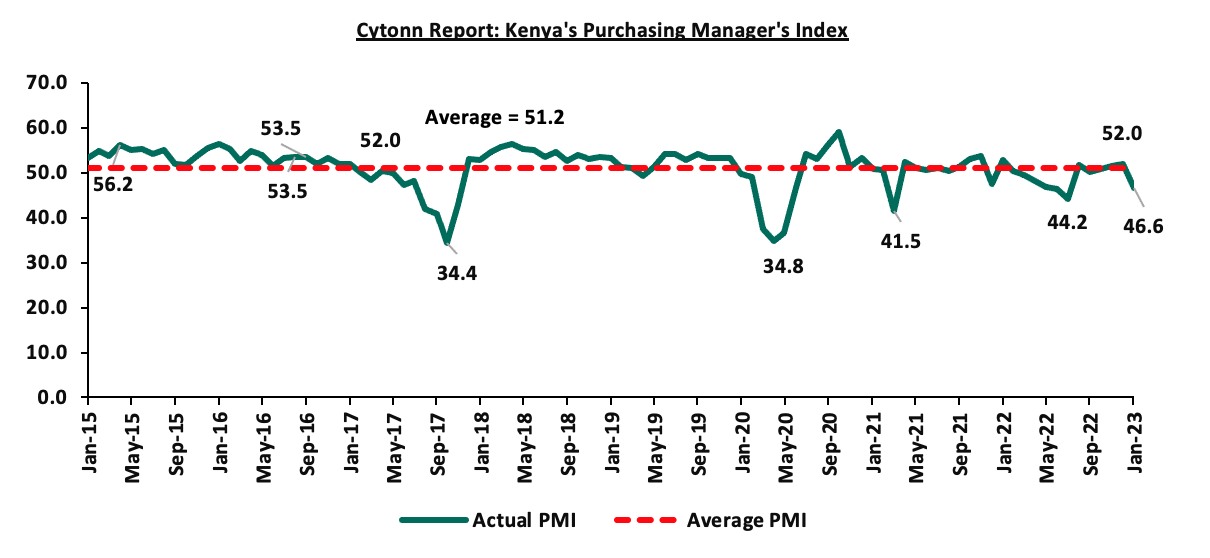
Our Outlook- We have a Neutral Outlook in the short term with expectation that the business environment to remain subdued in the short term since the elevated inflation and the tightened liquidity in the money market still persist. However, we expect the inflation to ease gradually in the coming months hence an improvement in the business environment.
- Public Debt
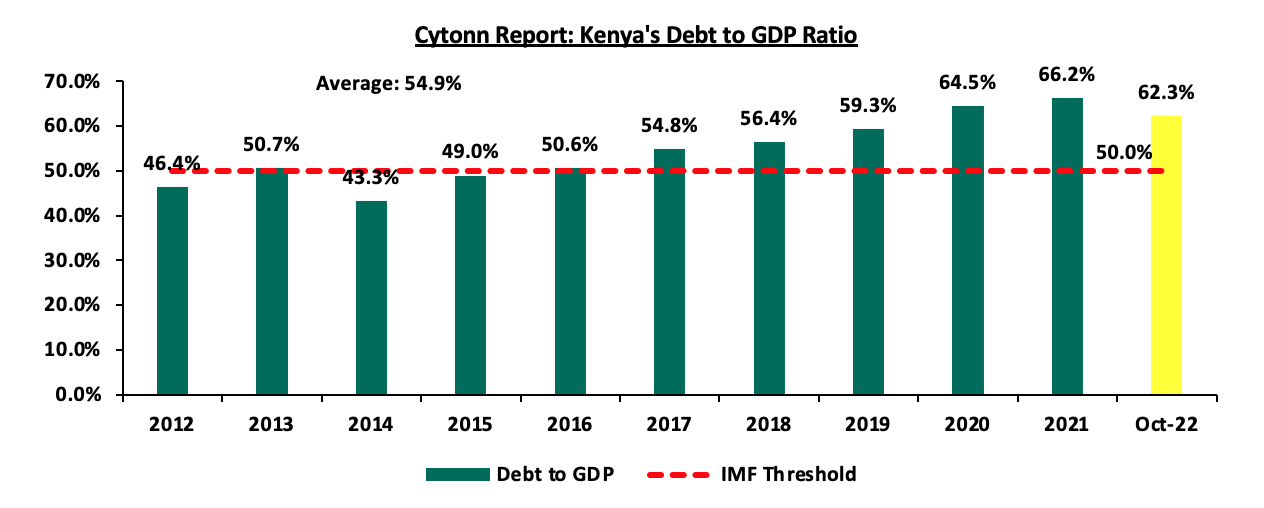
Kenya’s public debt stood at Kshs 8.7 tn as of October, 2022, an increase of 8.7% from Kshs 8.0 tn in the same period in 2021. The debt represents 62.3% of the GDP which is 12.3% above the IMF threshold for the developing countries. The domestic debt stock stood at 31.2% of the GDP while the external debt stock was within a similar range at 31.1% of GDP. According to the FY’2022/23 Supplementary Budget, the fiscal deficit is expected to decline to 5.7% of GDP from the original estimates of 6.2% of GDP. Despite the drop, we expect the government to borrow aggressively from both the domestic and foreign markets as it aims to plug in the fiscal deficit and also to ensure servicing of debt maturities with debt servicing to revenue coming in at 55.0% as of January 2023. Additionally, the USD 2.0 bn Eurobond maturing in 2024 is also expected to increase the need for borrowing for debt refinancing. In terms of the domestic debt, the banking institutions continue to hold the highest percentage at 46.7% as of 24th February 2023. Below is a chart showing the trend in Kenya’s debt to GDP;
Source: National Treasury
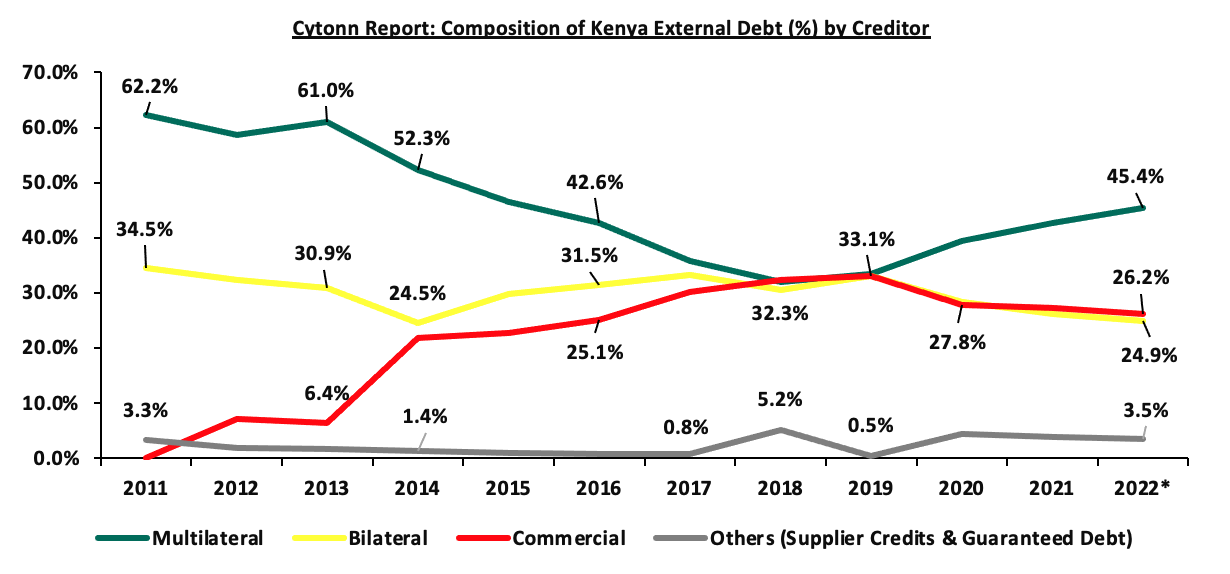
Kenya’s foreign debt comprises of multilateral loans, bilateral loans and commercial loans. Multilateral loans are debts issued by international institutions such as the World Bank and the IMF to member nations to promote social and economic development while bilateral loans are loan agreements between individual nations. Multilateral and bilateral loans are categorized as concessional loans due to the favorable terms offered in terms of either below-market interest rates or long grace periods. Commercial loans, on the other hand, are loans agreed between a country and an external commercial bank or an external financial debt instrument. Currently, Kenya is pursuing more multilateral and bilateral loans in a bid to reduce exposure to the expensive commercial loans. In December 2022, IMF completed the review of the Extended Credit Facility and Extended Fund Facility arrangements with Kenya and approved the disbursement of USD 447.4 mn which was the 5th tranche of the USD 2.3 bn loan amount to be disbursed. Important to note, Kenya is currently under high risk of debt distress as a result of the decline of multilateral debts between 2013-2018 as we took up more commercial debts. The government is thus trying to correct the situation by considering more multilateral debt evidenced by an increase of 3.4% points to 45.4% in October 2022, from 42.0% in the same period in 2021 while the commercial debts declined. The chart below shows the trend in Kenya’s external debt exposure between 2011-2022;
Source: National Treasury
Important to note, on 28th February 2023, the Cabinet approved and sent to parliament a proposal for changing Kenya’s debt cap from Kshs 10.0 tn to a new debt anchor at 55.0% of GDP in present value terms for discussion and approval in line with the promise made to the IMF. According to the government, the move is to ensure debt sustainability. The country had already breached the Kshs 9.0 tn ceiling in 2021 necessitating the increment to a limit of Kshs 10.0 tn to accommodate the FY’2022/2023 fiscal deficit. The public debt stock, which was at Kshs 9.4 tn as of December 2022 is expected to surpass the current Kshs 10.0 tn debt ceiling in the FY’2023/2024 and in the medium term and this will necessitate a budget cut if the status quo remains the same.
Our Outlook- Our outlook is Negative since we expect the government to continue borrowing aggressively from both the domestic and foreign markets as it aims to plug in the fiscal deficit projected at 5.7% of GDP in the FY’2022/2023 Supplementary budget.
- Interest Rates
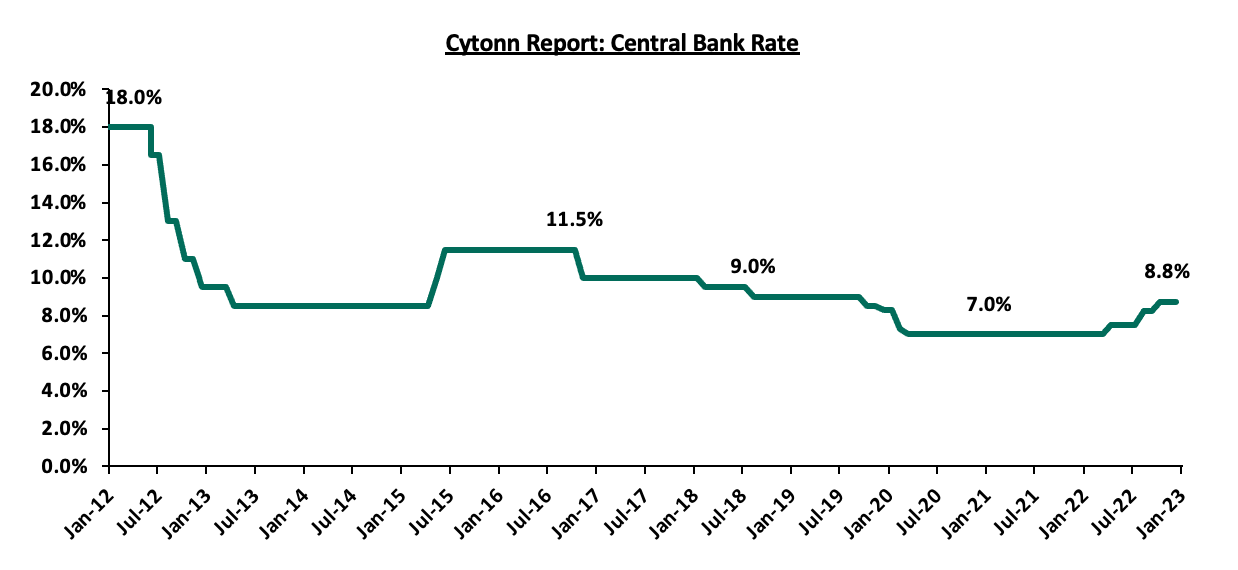
In the latest January 2023 meeting, the Monetary Policy (MPC) met and maintained the CBR rate at 8.75% following a hike of 0.5% points in November 2022, from 8.25% in September 2022 in a bid to anchor the elevated inflation back to the target range of 2.5%-7.5%. CBK maintained the rate since the effects of November 2022 were yet to be fully felt in the economy. The committee also noted that the recent measures by the government to allow for importation of duty free imports on certain food items, such as maize and rice are expected to moderate prices and hence ease the inflationary pressures. In 2022, the committee hiked the interest rate by 175.0 bps to 8.75% in November, from 7.0% in January. The chart below shows MPC rates for last 10 years;
Source: CBK
In 2022, the CBK tightened the MPC rate by 175.0 bps with a view to control inflation which averaged 7.6%, above the CBK’s target range of 2.5% - 7.5%. In 2021, the rate remained unchanged at 7.0% with average annual inflation was at 6.2%, well within the CBKs target range. In 2023, we expect the Central Bank to continue tightening the monetary policy stance in the medium term with the intention of anchoring inflation which is already at 9.2% as of February 2023. We also expect to see slight upward pressure on the interest rates in 2023 compared to 2022 as the government compensates investors for the increased risks posed by currency depreciation and elevated inflation. Risks still abound in 2023 as was the previous year hence the continued increase in interest rates. The government is also expected to continue borrowing both locally and externally to fill the ever present fiscal deficit and service rising debt maturities with USD 2.0 bn 10-year Eurobond issued in 2014 set to mature in 2024.
Our Outlook – We have a Negative outlook. This is because the CBK is expected to maintain tightened monetary policy stance in the medium term with the intention of anchoring inflation back to the target range of 2.5%-7.5%. We may also see a marginal upward pressure on the interest rates as the investors cushion themselves against risks such as inflation and currency depreciation.
- Private Sector Credit Growth
As at December 2022, the private sector credit growth rate improved by 3.9% points to 12.5%, from 8.6% recorded in the same period last year. This was when the business environment was better and improved as evidenced by an average PMI index of 51.1 as of September 2022 to December 2022. The private sector credit in the country is mainly dependent on Banks, as such, we expect that a deterioration in business environment will consequently limit credit advancements by banks. However, the growth in the short term will be supported by existing policy measures, including the Hustler Fund and MSMEs Credit Guarantee Scheme, and continued economic recovery. The CBK has also approved certain risk based pricing models for some banks while others are in the pipeline and this will see banks offer different rates to clients depending on their risk category to mitigate default risk exposure. The lending model will likely increase the borrowing costs on some individuals with poor credit rating. However, the pricing model will ensure that all borrowers have access to credit which will be a positive for private sector credit. The chart below shows 5-year private sector credit growth;
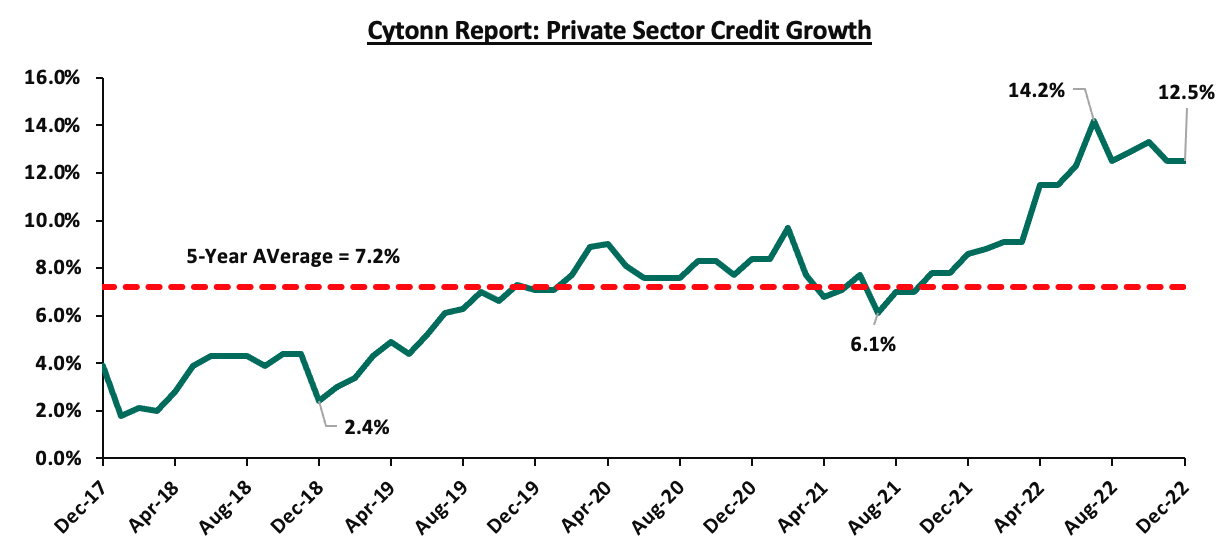
Source: CBK
According to World Bank, Kenya’s domestic credit extended to private sector as a percentage of GDP was at 32.1%, as of 2020. This was low compared to the 38.4% average for the Sub-Saharan African region, 111.2% for South Africa and 164.2% for advanced economies. As such, there is still a gap of 67.9% in credit availability to achieve 100.0% Private Sector Credit to GDP. Kenya needs total credit to private sector of Kshs 12.1 tn and the credit to private sector as of December 2022 was Kshs 3.4 tn, hence a deficit of Kshs 8.7 tn. For this to be realized, Kenya needs to revive its capital market to offer more credit to the private sector since it is offering only 1.0% while banks are offering 99.0% of credit. The chart below shows domestic credit extended to the private sector over the years;
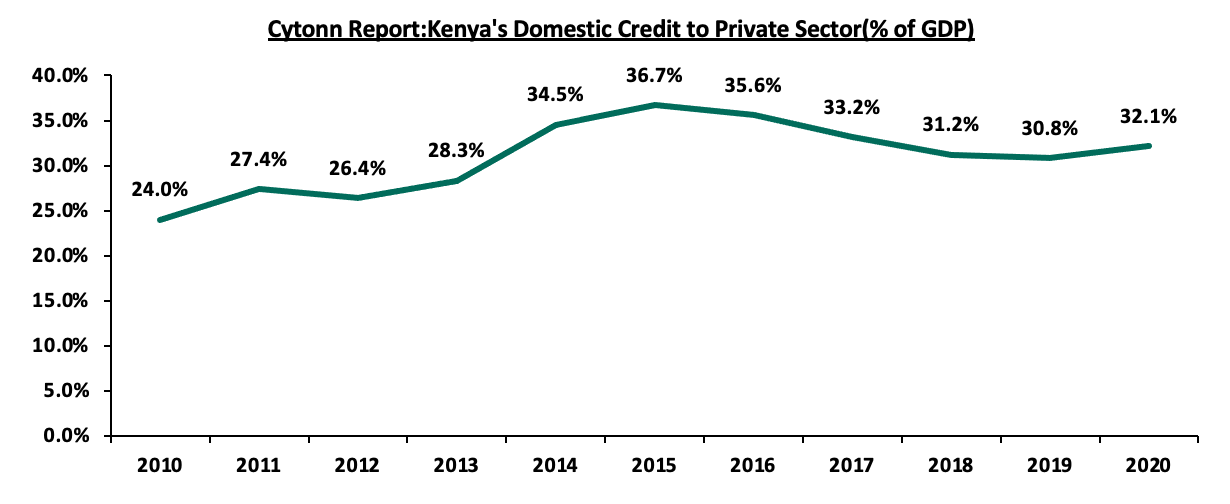
Source: World Bank
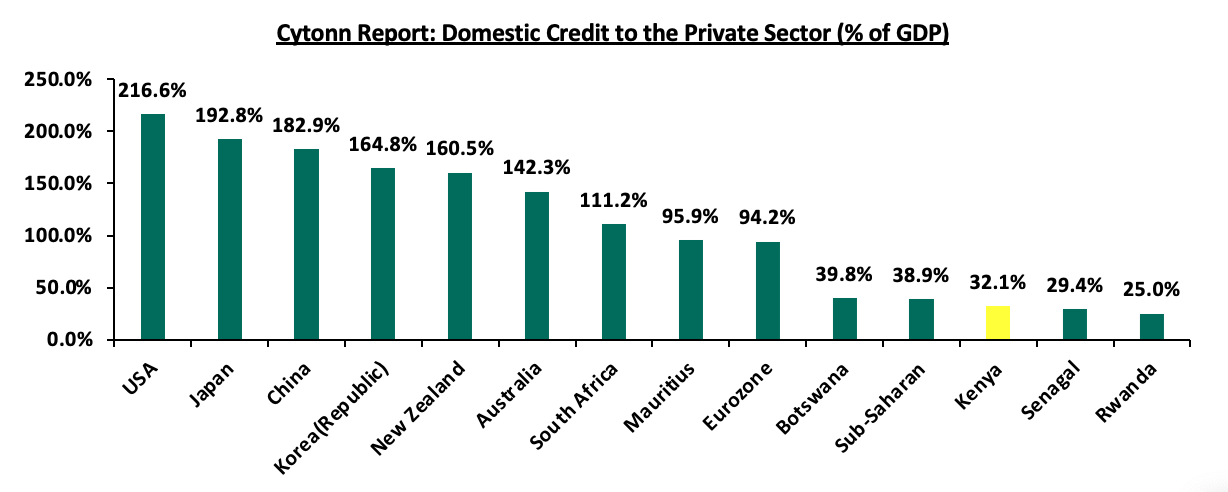
Despite the credit to private sector increasing over the years, Kenya is still far from achieving its full potential and access to credit is still low compared to its other countries such as South Africa, Botswana and Mauritius as shown in the chart below;
Source: World Bank
Our Outlook- Our outlook for the sector is Neutral since the performance will depend on the improvement of the business environment as this will affect credit availability. Notably, we have continued to witness positive growth over the years despite deteriorated business sector as the banks have measures to manage default risks such as risk based pricing model.
- Balance of Payments
The Kenya National Bureau of Statistics recently released the Q3’2022 Quarterly Balance of Payment report indicating that the BOP recorded a deterioration of 283.9% to a deficit of Kshs 112.7 bn from a deficit of Kshs 29.3 bn as recorded in Q3’2021. This was also a major drop from Kshs 10.9 bn surplus recorded in Q2’2022. The deterioration in the Balance of Payment performance was mainly on the back of widening of the current account deficit by 5.5% to Kshs 193.4 bn in Q3’2022 from Kshs 183.4 bn in the same period in 2021. This is an indication that the country relies more on imports compared to exports. The chart below shows the BOP over the last 9 years;
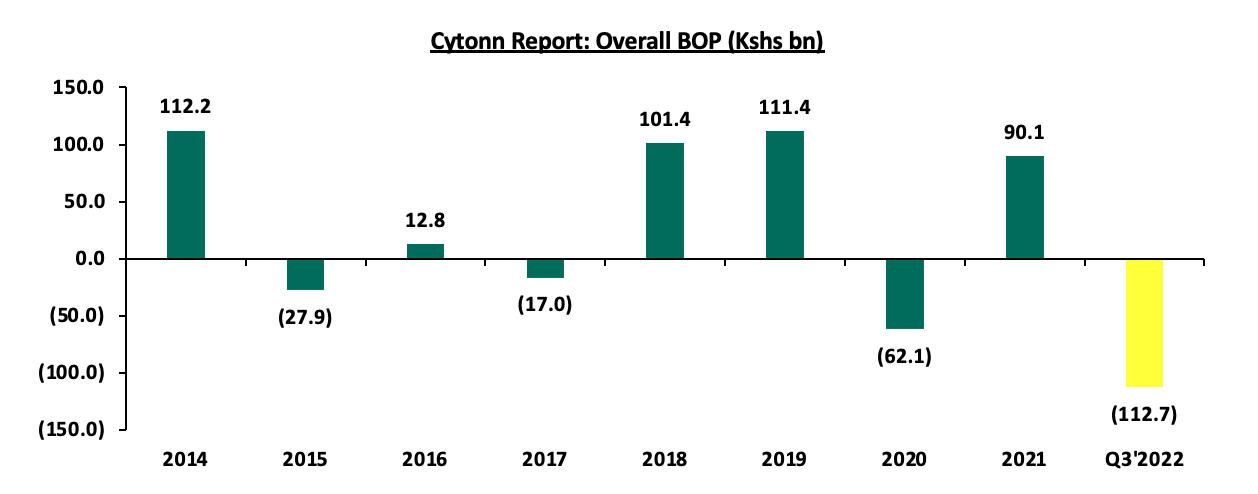
Source: KNBS
The widening of the current account deficit was mainly driven by the elevated global fuel prices arising from the global supply chain constraints consequently elevating fuel import cost being that Kenya is a net importer of oil. The widening is also attributable to currency depreciation with the shilling having depreciated by 4.4% year-to-date as of 10rd March, 2023. As such, this has also resulted to a significant drop in the forex reserves which are currently below the 4.0 months of import cover, which is a statutory requirement. Additionally, Kenya’s exports have also deteriorated over the years mainly attributable to low agricultural production due to erratic weather patterns and the prolonged drought, with agriculture being the leading contributor to Kenya’s export products. The chart below shows the trends of the Current Account Balance over the last 10 years;
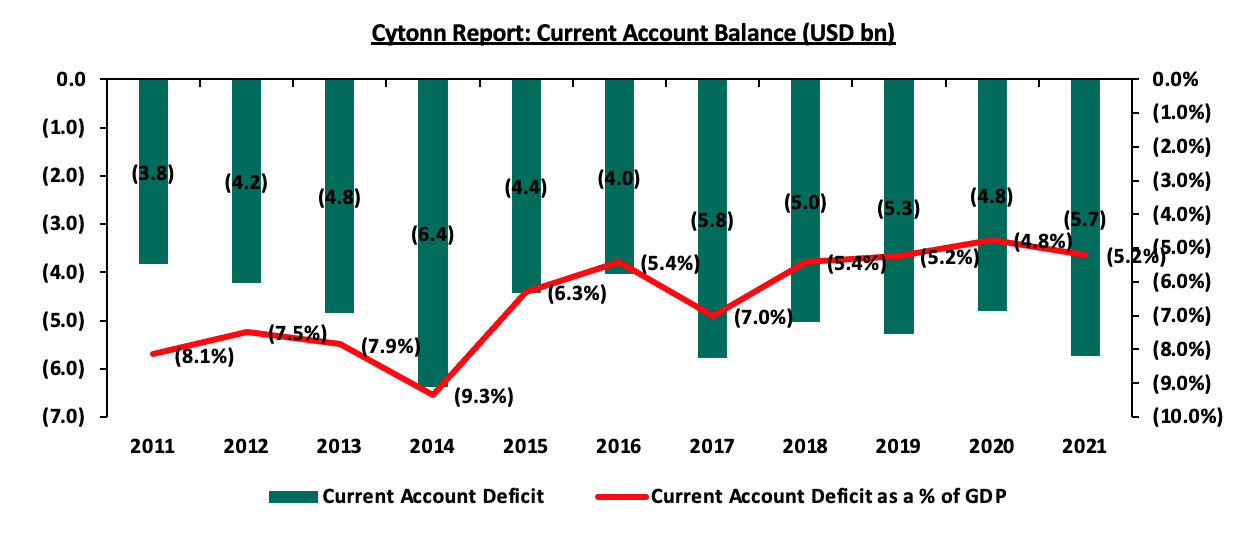
Source: World Bank
We expect the high cost of fuel importation exacerbated by the currency depreciation, high debt servicing and low agricultural production for exports to continue weighing down on the current account consequently deteriorating the BOP position. However, we expect that the current administration’s focus on fiscal consolidation and subsidy of farm inputs to improve the Balance of payment performance by minimizing the costs of servicing external debts and improving agricultural export and also anchor inflation. We also expect that the multilateral trade partnership deals such as the US-Kenya Strategic Trade and Investment Partnerships and the Africa Continental Free Trade Area (AfCFTA) and other trading deals such as COMESA will continue offering Kenya an expanded market.
Our Outlook – Our outlook is Negative since we expect the current account deficit to widen further attributable to high oil import costs and the continued currency depreciation leading to depletion of forex reserves.
Section 4: Recommendations
Kenya’s economy is in a recovery path but is still facing a number of challenges such as high inflation, currency depreciation, and high debt servicing cost, among others which are affecting the key economic drivers. As such, it is important to look into actionable steps that the government should consider to improve the explained key economic indicators. Below are our recommendations to optimizing the various economic drivers;
- Anchoring Inflation – Anchoring the runaway inflation back to the CBK’s target range will involve boosting local food production and reducing the cost of fuel since these are the key factors driving inflation. The government should improve local food production by reforming agricultural sector through offering of farm inputs at subsidized prices and encouraging irrigation to mitigate against erratic weather conditions in the country. The government has also come up with short term strategy to improve food security by allowing for importation of duty free maize, rice and sugar expected to stabilize food prices. The government should also address the rising cost of fuel by ensuring competitiveness in the sector and reducing a lot of tariffs involved in fuel importation to reduce the overall cost of products. Reduced fuel prices will have a ripple effect of lowering the cost of production in all sectors of the economy hence price moderation,
- Enhancing Currency Performance - The government should continue implementing fiscal and monetary policies to improve macroeconomic conditions such as inflation and balance of payments as this will allow for the exchange rate to adjust itself. It is also essential for the government to reduce imports and its exposure on external debt denominated in foreign currencies. For the short term, the government is trying to preserve forex reserves by importing oil on credit through government-government deal. We expect this to manage the situation since oil imports takes up a huge portion of forex reserves. The government has also turned to its multilateral lenders such as IMF and World Bank to get loans to boost the forex reserves and reduce the risk of dollar shortage, and,
- Improving Business Environment (PMI index) – The government can improve the business environment by anchoring the runaway inflation to improve consumers demand as a result of accommodative prices. Further, the government should come up with business friendly policies that will lower the cost of production thus lowering the prices for the final products consequently increasing demand. It is also essential for CBK to manage liquidity in the industry through monetary policies such as reverse repos with an objective of ensuring price stability,
- Reducing Public Debt and Debt Servicing Cost – One way to reduce the government debt burden is to ensure fiscal consolidation to reduce the estimated fiscal deficits of 5.7% in the revised FY’2022/2023 budget and 4.3% in FY’2023/2024 budget. This will consequently reduce the need for borrowing to bridge the fiscal gap and reduce the high debt service to revenue. For consolidation to be realized, it is imperative for the government to seal corruption and tax loopholes, reduce recurrent expenditure and prioritize projects of key economic and social benefits. The government should also continue shunning expensive bilateral debts and concentrate more on multilateral debts offered at lower rates. The government should also prioritize internal borrowing to reduce its exposure to forex exchange risks since more than half of our debt is currently foreign currency denominated,
- Interest Rates – To manage the increasing interest rates in the markets, the government should reduce its borrowing appetite as this will increase its bargaining power with investors in the market. Further, it is prudent to improve the business environment and key macroeconomic indicators such as inflation and currency depreciation to boost investor confidence and investor sentiments concerning risks. Notably, reduced risks in the economy will lead to investors demanding moderate rates while borrowing as they are confident of full redemption at the time of maturity,
- Enhancing Private Sector Credit Growth – Promoting capital markets remains one of the significant ways towards the objective of achieving at least 100.0% domestic credit to private sector as a percentage of GDP, this means there is a credit deficit of at least Kshs. 8 trillion from the current 33% to GDP ratio. Capital markets still remains under-developed contributing about 1.0% of total funding to businesses compared to 99.0% by banks. This scenario can be changed by educating the masses about the markets and revising its regulations to reduce the red-tape measures and ease the process of accessing it. Improving the sector will promote new businesses and diversify the economy thus supporting economic growth. Besides, government should also significantly increase the amount of credit extended through its programs such as Financial Inclusion Fund and Women Enterprise Fund to have a significant impact in bridging the 67.9% private sector credit to GDP gap,
- Improving Balance of Payment (BOP) – The government can improve the current account deficit and BOP position by ensuring self-sufficiency through reducing imports of commodities that can be produced locally. The government should also adopt policies that will ensure diversification of exports through promotion of value addition on agricultural produce and encouraging manufacturing. This can be achieved by concentrating on formulating tax policies and reforms that are aligned with economic goals and do not impede productivity. The government can also attract Foreign Direct Investments (FDIs) by coming up with actions such as offering incentives, reduced bureaucracies, and improved infrastructure,
Disclaimer: The views expressed in this publication are those of the writers where particulars are not warranted. This publication, which is in compliance with Section 2 of the Capital Markets Authority Act Cap 485A, is meant for general information only and is not a warranty, representation, advice or solicitation of any nature. Readers are advised in all circumstances to seek the advice of a registered investment advisor.

- Talk to us
- Kenya
- P.O Box 20695 - 00200, Nairobi, Kenya
- Cell +254709101200
- Tel +254709101200
- WhatsApp +254741676635
- United States
- +254709101200
- DOWNLOAD OUR APP
-


- Kenya
- 8th Floor, Pinetree Plaza, Kaburu Drive, Ngong Road, Nairobi, Kenya
- USA
- Suite 1150, 1775 Eye Street NW, USA, Washington DC 20006, USA
- Investments
- High Yield
- Private Equity
- Real Estate
- Real Estate
- RiverRun Estates
- Cytonn Towers
- The Ridge
- Taraji Heights
- The Alma