Kenya Listed Banks FY’2018 Report & Cytonn Weekly #16/2019
By Cytonn Research Team, Apr 21, 2019
Executive Summary
Fixed Income
T-bills were undersubscribed during the week, with the overall subscription rate declining to 88.7% from 148.1%, recorded the previous week. The decline in subscription rate was attributable to low liquidity levels in the money markets following the cyclical liquidity tightness due to the start of the new cash reserves requirement (CRR) cycle. The yield on the 91-day and 182-day papers declined to 7.3% and 8.0% from 7.4% and 8.1%, respectively, while the 364-day paper remained unchanged at 9.4%. According to the Energy Regulatory Commission (ERC), petrol prices have increased by 5.2% to Kshs 106.6 from Kshs 101.4 per litre previously, while diesel and kerosene prices have increased by 5.7% and 2.8% to Kshs 102.1 and Kshs 102.2 per litre, respectively, from Kshs 96.6 and 99.5 per litre. Consequently, we expect a rise in the transport index, which carries a weighting of 8.7% in the total consumer price index (CPI), due to the increased petrol and diesel prices. We also expect inflationary pressure in the food and non-alcoholic beverages index, mainly driven by a rise in food prices following the delay of the March-May long rains. Based on the factors mentioned above, we are projecting the y/y inflation rate for the month of April to come in within the range of 4.6% - 5.0%, a rise compared to 4.4% recorded in March;
Equities
During the week, the equities market recorded mixed performance with NSE 20 and NSE 25 declining by 1.5% and 0.2%, respectively, while NASI gained by 0.2%, taking their YTD performance to gains of 1.3%, 12.6% and 11.4%, for NSE 20, NASI and NSE 25, respectively. KCB Group has announced its intention to acquire a 100% stake in the National Bank of Kenya (NBK). The offer will be by way of a share swap at a ratio of 10:1, 10 ordinary shares of NBK for 1 ordinary share of KCB, whose shares are currently trading at Kshs 4.7 and Kshs 45.0, respectively, as at 18th April 2019. Shareholders of NIC Group and CBA Group have approved the merger of the two banks in their respective Annual General Meetings, which were held during the week;
Private Equity
During the week, AVCA released their Country Snapshot for Kenya, which highlights the various developments in the private equity sector in Kenya between 2013 and 2018. According to AVCA, there were 110 reported deals in Kenya during this period, of the total 190 deals reported in the 7 Eastern African countries, with a total deal value of USD 1.3 bn (Kshs 131.7 bn);
Real Estate
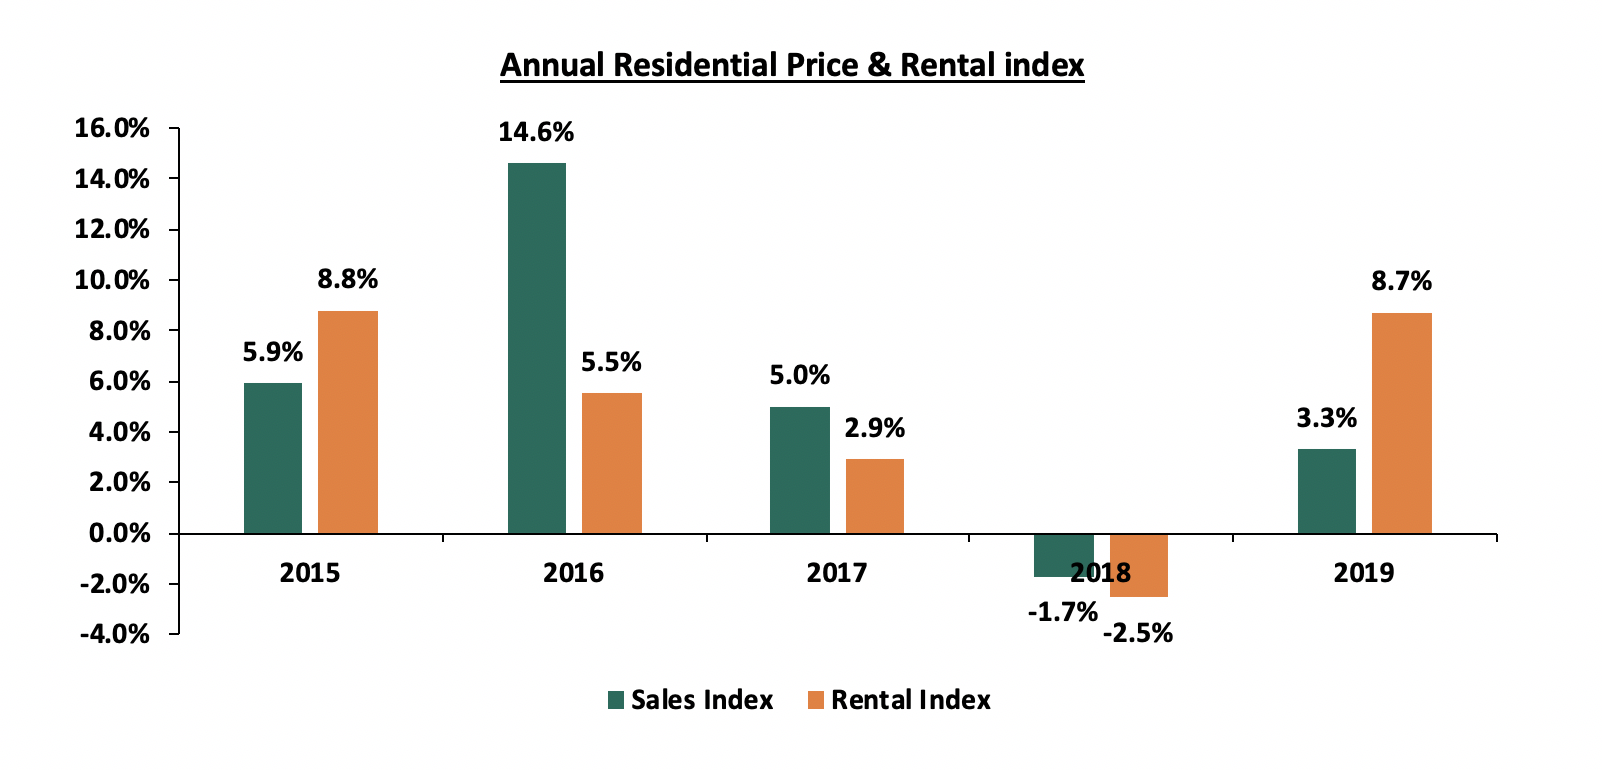
During the week, Hass Consult released the Hass Property Sales and Rental Index Q1’2019. According to the report, the Nairobi Metropolitan Area residential market registered an average annual price appreciation of 3.3%, with the performance mainly affected by the high-end market, which posted subdued performance owing to a decline in foreign investor activities. However, it is an improvement from the 1.7% depreciation recorded as at Q1’2018. Mid-end market townhouses, however, registered a solid positive performance with an annual price and rental appreciation of 7.9% and 11.1%, respectively, boosted by growth of middle class population. Broll also released the Broll Kenya Logistics Market Report 2018, which indicated that the logistics sector posted positive performance in 2018 owing to improved business environment and infrastructure;
Focus of the Week
Following the release of FY’2018 results by Kenyan banks, we analyze the financial performance of the listed banks, identify the key factors that influenced the performance, and give our outlook for the sector going forward. The theme for the report is “Growth and Recovery in a tough operating environment”.
- Johnson Denge – Senior Manager, Regional Markets, was on The Property Show to discuss the various Real Estate Projects being under taken by Cytonn Real Estate. Watch Johnson here
- Faith Maina – Investments Analyst, was on KBC Channel 1 to discuss Investments on their Women at The Front Show. Watch Faith here
- Johnson Denge – Senior Manager, Regional Markets, was on NTV to discuss the impact of the housing levy on the economy. Watch Johnson here
- For an exclusive tour of the developments, visit: Sharp Investor’s Tour and for more information, email us at sales@cytonn.com;
- Following the recent approval by Retirement Benefits Authority (RBA), for Cytonn Asset Managers to manage pension funds, we are looking for business development consultants and agents with networks in the pensions industry to build our pensions business at very attractive commissions. If interested in being an agent or know someone who can be an agent, kindly contact us at pensions@cytonn.com;
- Following the completion and handover of Amara Ridge in Karen, we have now launched our next Karen project, dubbed Applewood, a Kshs 2.5 bn residential development located in Miotoni, Karen. This signature development shall comprise luxury homes, each sitting on 1/2 acre. We invite you to the exhibition of Applewood which is ongoing at the Amara Ridge Clubhouse (Location pin: https://goo.gl/maps/B3GVnu8pHyn) or at the Applewood Sales Centre on Miotoni Road (Location pin: https://goo.gl/maps/ZfABuGjFo1z) from 9:00 am to 5:00 pm daily. Call 0709 101 000 or email resales@cytonn.com to reserve a villa! See Video here;
- We continue to hold weekly workshops and site visits on how to build wealth through real estate investments. The weekly workshops and site visits target both investors looking to invest in real estate directly and those interested in high yield investment products to familiarize themselves with how we support our high yields. Watch progress videos and pictures of The Alma, Amara Ridge, and The Ridge;
- We continue to see very strong interest in our weekly Private Wealth Management Training (largely covering financial planning and structured products). The training is at no cost and is open only to pre-screened participants. We also continue to see institutions and investment groups interested in the training for their teams. Cytonn Foundation, under its financial literacy pillar, runs the Wealth Management Training. If interested in our Private Wealth Management Training for your employees or investment group, please get in touch with us through wmt@cytonn.com. To view the Wealth Management Training topics, click here;
- For recent news about the company, see our news section here;
- We have 10 investment-ready projects, offering attractive development and buyer targeted returns. See further details here: Summary of Investment-Ready Projects;
T-Bills & T-Bonds Primary Auction:
T-bills were undersubscribed during the week, with the overall subscription rate declining to 88.7% from 148.1%, recorded the previous week. The decline in subscription rate was attributable to low liquidity levels in the money markets following cyclical liquidity tightness due to the start of the new cash reserves requirement (CRR) cycle. The yield on the 91-day and 182-day papers declined to 7.3% and 8.0% from 7.4% and 8.1%, respectively, while the 364-day paper remained unchanged at 9.4%. The acceptance rate improved to 87.1% from 79.2% recorded the previous week, with the government accepting a total of Kshs 18.5 bn of the Kshs 21.3 bn worth of bids received. The subscription rate for the 91-day, 182-day and 364-day papers declined to 104.0%, 46.8% and 124.4% from 122.7%, 76.4% and 230.0%, recorded the previous week, respectively. Investors’ participation however remained skewed towards the 364-day paper, with the continued demand being attributable to the scarcity of newer short-term bonds in the primary market.
For the month of May, the Treasury is issuing a 5-year (FXD2/2019/5) and a 15-year (FXD2/2019/15) bond for a total of KES 50.0 bn for budgetary support. The Government has stuck to last month’s approach of a blended issue with a short-tenor and a long-tenor bond, in a bid to plug in the budget deficit while at the same time trying to reduce the short-term maturity risk. The market is expected to maintain a bias towards the shorter tenor 5-year paper as per the recent trends mainly driven by the perception that risks may not be adequately priced on the longer end of the yield curve, which is relatively flat due to saturation of long-term bonds. We shall give our bidding range for the primary auction in next week’s report.
Liquidity:
During the week, cyclical liquidity tightness due to the start of the new cash reserves requirement (CRR) cycle was recorded as evidenced by a rise in the average interbank rate to 3.4% from 1.7%, recorded the previous week. The average volumes traded in the interbank market increased by 197.3% to Kshs 18.8 bn, from Kshs 6.3 bn the previous week.
Kenya Eurobonds:
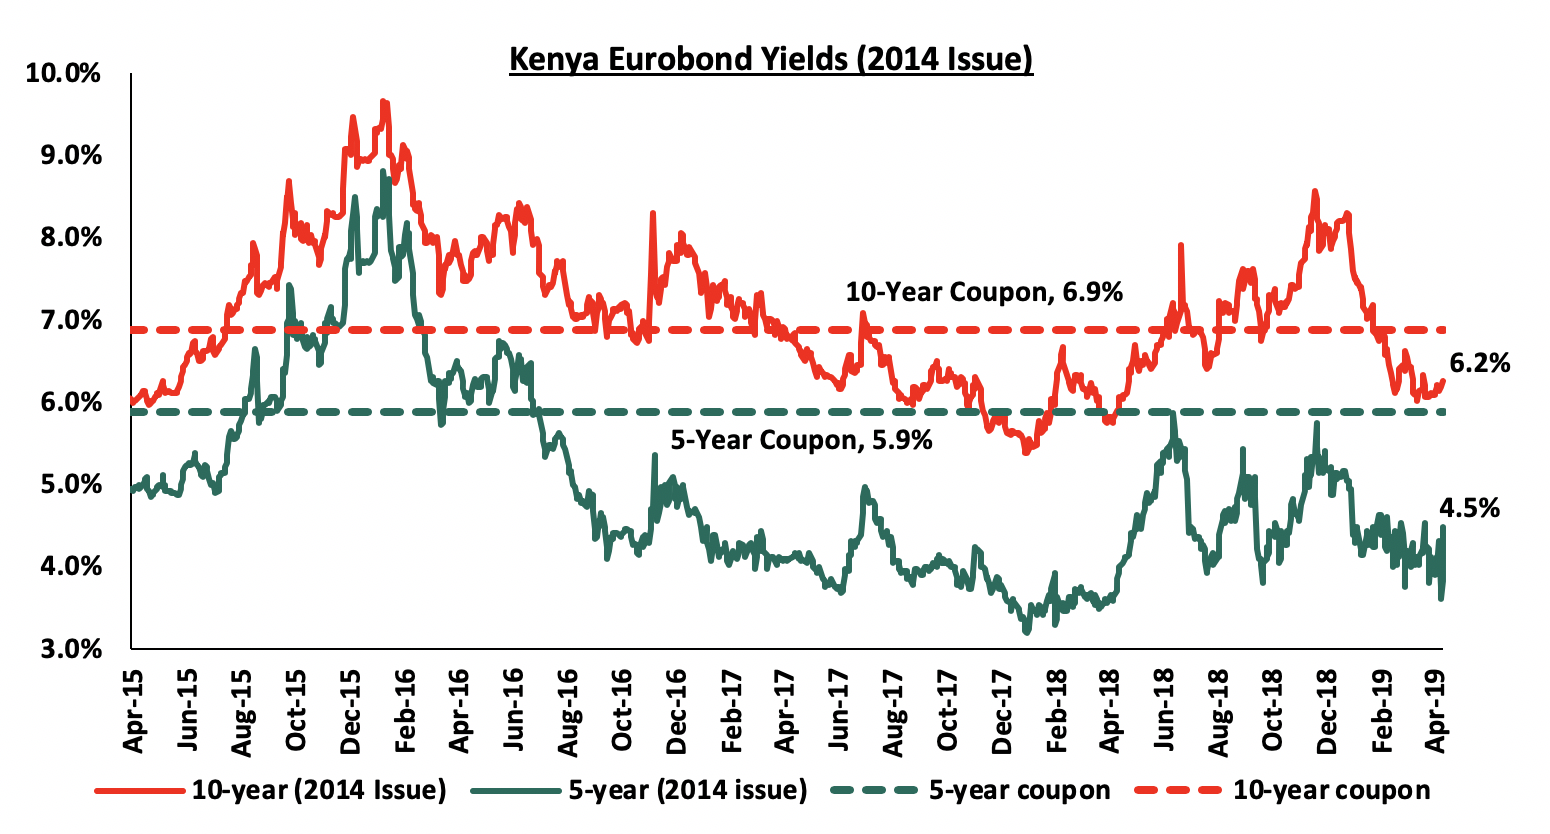
According to Bloomberg, the yield on the 10-year Eurobond issued in 2014 remained unchanged at 6.2%, while that of the 5-year rose by 0.2% points to 4.5% from 4.3% the previous week. The rise is attributable to increased risk perception due to the downgrading of Kenya’s growth prospects both by the World Bank and the International Monetary Fund (IMF). Key to note is that these bonds have 0.2-years and 5.2-years to maturity for the 5-year and 10-year, respectively.
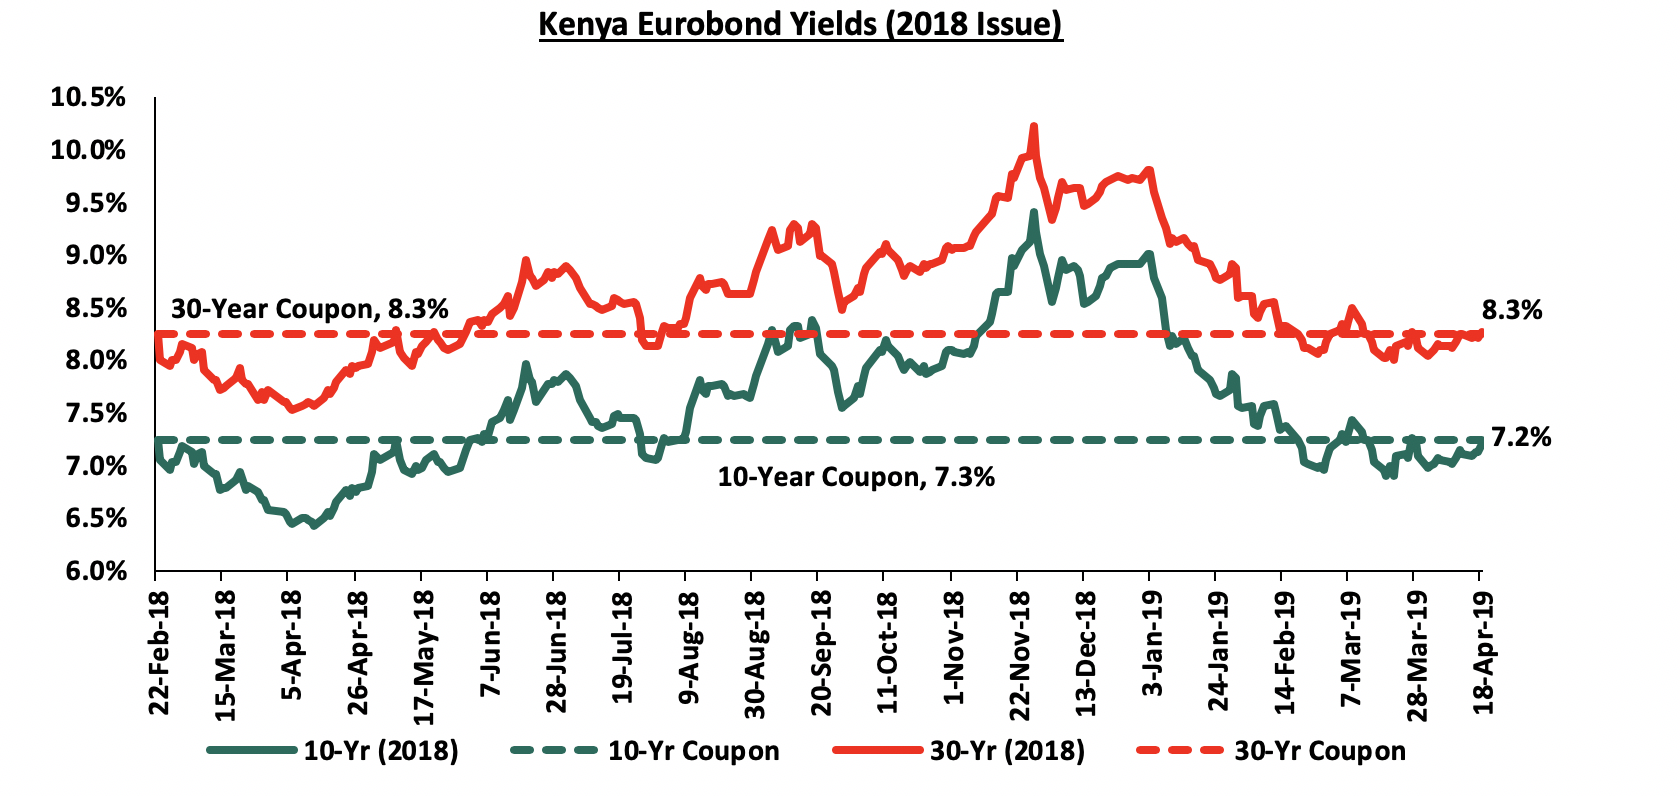
For the February 2018 Eurobond issue, yields on the 10-year Eurobond rose by 0.1% points to 7.2% from 7.1%, recorded the previous week while the yield on the 30-year Eurobond remained unchanged at 8.3%. Since the issue date, the yields on the 10-year Eurobond has declined by 0.1% points while that of the 30-year Eurobond has remained unchanged at 8.3%.
The Kenya Shilling:
During the week, the Kenya Shilling lost by 0.3% against the US Dollar to close at Kshs 101.3, from Kshs 101.0 the previous week attributable to increased dollar demand from merchandise importers. The Kenya Shilling has appreciated by 0.9% year-to-date in addition to 1.3% in 2018, and in our view the shilling should remain relatively stable to the dollar in the short term, supported by:
- The narrowing of the current account deficit with preliminary data on balance of payments indicating continued narrowing to 4.7% of GDP in the 12-months to February 2019, from 5.5% recorded in February 2018. The decline has been attributed to improved agriculture exports, increased diaspora remittances, strong receipts from tourism, and lower food and SGR-related equipment relative to 2017,
- Improving diaspora remittances, which increased by 17.2% m/m in January 2019 to USD 244.8 mn from USD 208.9 mn recorded in a similar period of review in 2018. The rise is due to:
- Increased uptake of financial products by the diaspora due to financial services firms, particularly banks, targeting the diaspora, and,
- New partnerships between international money remittance providers and local commercial banks making the process more convenient,
- CBK’s supportive activities in the money market, such as repurchase agreements and selling of dollars, and,
- High levels of forex reserves, currently at USD 8.1 bn, equivalent to 5.3-months of import cover, above the statutory requirement of maintaining at least 4-months of import cover, and the EAC region’s convergence criteria of 4.5-months of import cover.
Highlight of the Week:
The Energy Regulatory Commission (ERC) released their monthly statement on the maximum retail fuel prices in Kenya effective from 15th April 2019 to 14th May 2019. Below are the key take-outs from the statement:
- Petrol prices have increased by 5.2% to Kshs 106.6 from Kshs 101.4 per litre previously, while
- Diesel and kerosene prices have increased by 5.7% and 2.8% to Kshs 102.1 and Kshs 102.2 per litre, respectively, from Kshs 96.6 and 99.5 per litre, previously.
The changes in prices are attributable to:
- An increase in the average landing cost of imported super petrol by 9.1% from USD 568.6 per ton in February 2019 to USD 620.5 per ton in March 2019, diesel by 11.2% from USD 561.6 per ton to USD 624.5 per ton and kerosene by 1.9% from USD 650.3 per ton to USD 662.6 per ton,
- The Free on Board (FOB) price of Murban crude oil lifted in March 2019 also increased by 3.4% to USD 68.6 per barrel from USD 66.4 per barrel in February 2019, and,
- The mean monthly US dollar to Kenya Shilling exchange rate also depreciated by 0.3% to Kshs 100.5 in March from Kshs 100.2 in February.
Consequently, we expect a rise in the transport index, which carries a weighting of 8.7% in the total consumer price index (CPI), due to the increased petrol and diesel prices. We also expect inflationary pressure in the food and non-alcoholic beverages index, which has a weight of 36.0% in the consumer price index (CPI), mainly driven by a rise in food prices following the delay of the March-May long rains, which has seen the prices of basic food items such as a 1 kg packet of maize flour recording a 25.0% rise in April to retail at Kshs 55 from Kshs 44 recorded in March, while milk prices also rose by 10.0% for a 500 ml packet to Kshs 55 from Kshs 50 previously. Based on the factors mentioned, we are projecting the y/y inflation rate for the month of April to come in within the range of 4.6% - 5.0%, a rise compared to 4.4% recorded in March.
Rates in the fixed income market have remained relatively stable as the government rejects expensive bids, as they are currently 21.7% ahead of its domestic borrowing target for the current financial year, having borrowed Kshs 312.1 bn against a pro-rated target of Kshs 256.4 bn. A budget deficit is likely to result from depressed revenue collection, creating uncertainty in the interest rate environment as additional borrowing from the domestic market goes to plug the deficit. Despite this, we do not expect upward pressure on interest rates due to increased demand for government securities, driven by improved liquidity in the market owing to the relatively high debt maturities. Our view is that investors should be biased towards medium-term fixed income instruments to reduce duration risk associated with long-term debt, coupled with the relatively flat yield curve on the long-end due to saturation of long-term bonds.
Market Performance:
During the week, the equities market recorded mixed performance with NSE 20 and NSE 25 declining by 1.5% and 0.2%, respectively, while NASI gained by 0.2%, taking their YTD performance to gains of 1.3%, 12.6% and 11.4%, for NSE 20, NASI and NSE 25, respectively. The performance of NASI was driven by gains in large cap stocks such as EABL, Safaricom and NIC Bank, which gained by 2.1%, 1.3% and 1.0%, respectively.
Equities turnover declined by 48.3% during the week to USD 12.0 mn, from USD 23.2 mn the previous week, taking the YTD turnover to USD 509.0 mn. Foreign investors were net sellers for the week, with the net selling position coming in at USD 0.9 mn, a 63.6% decline from last week’s net selling position of USD 2.5 mn.
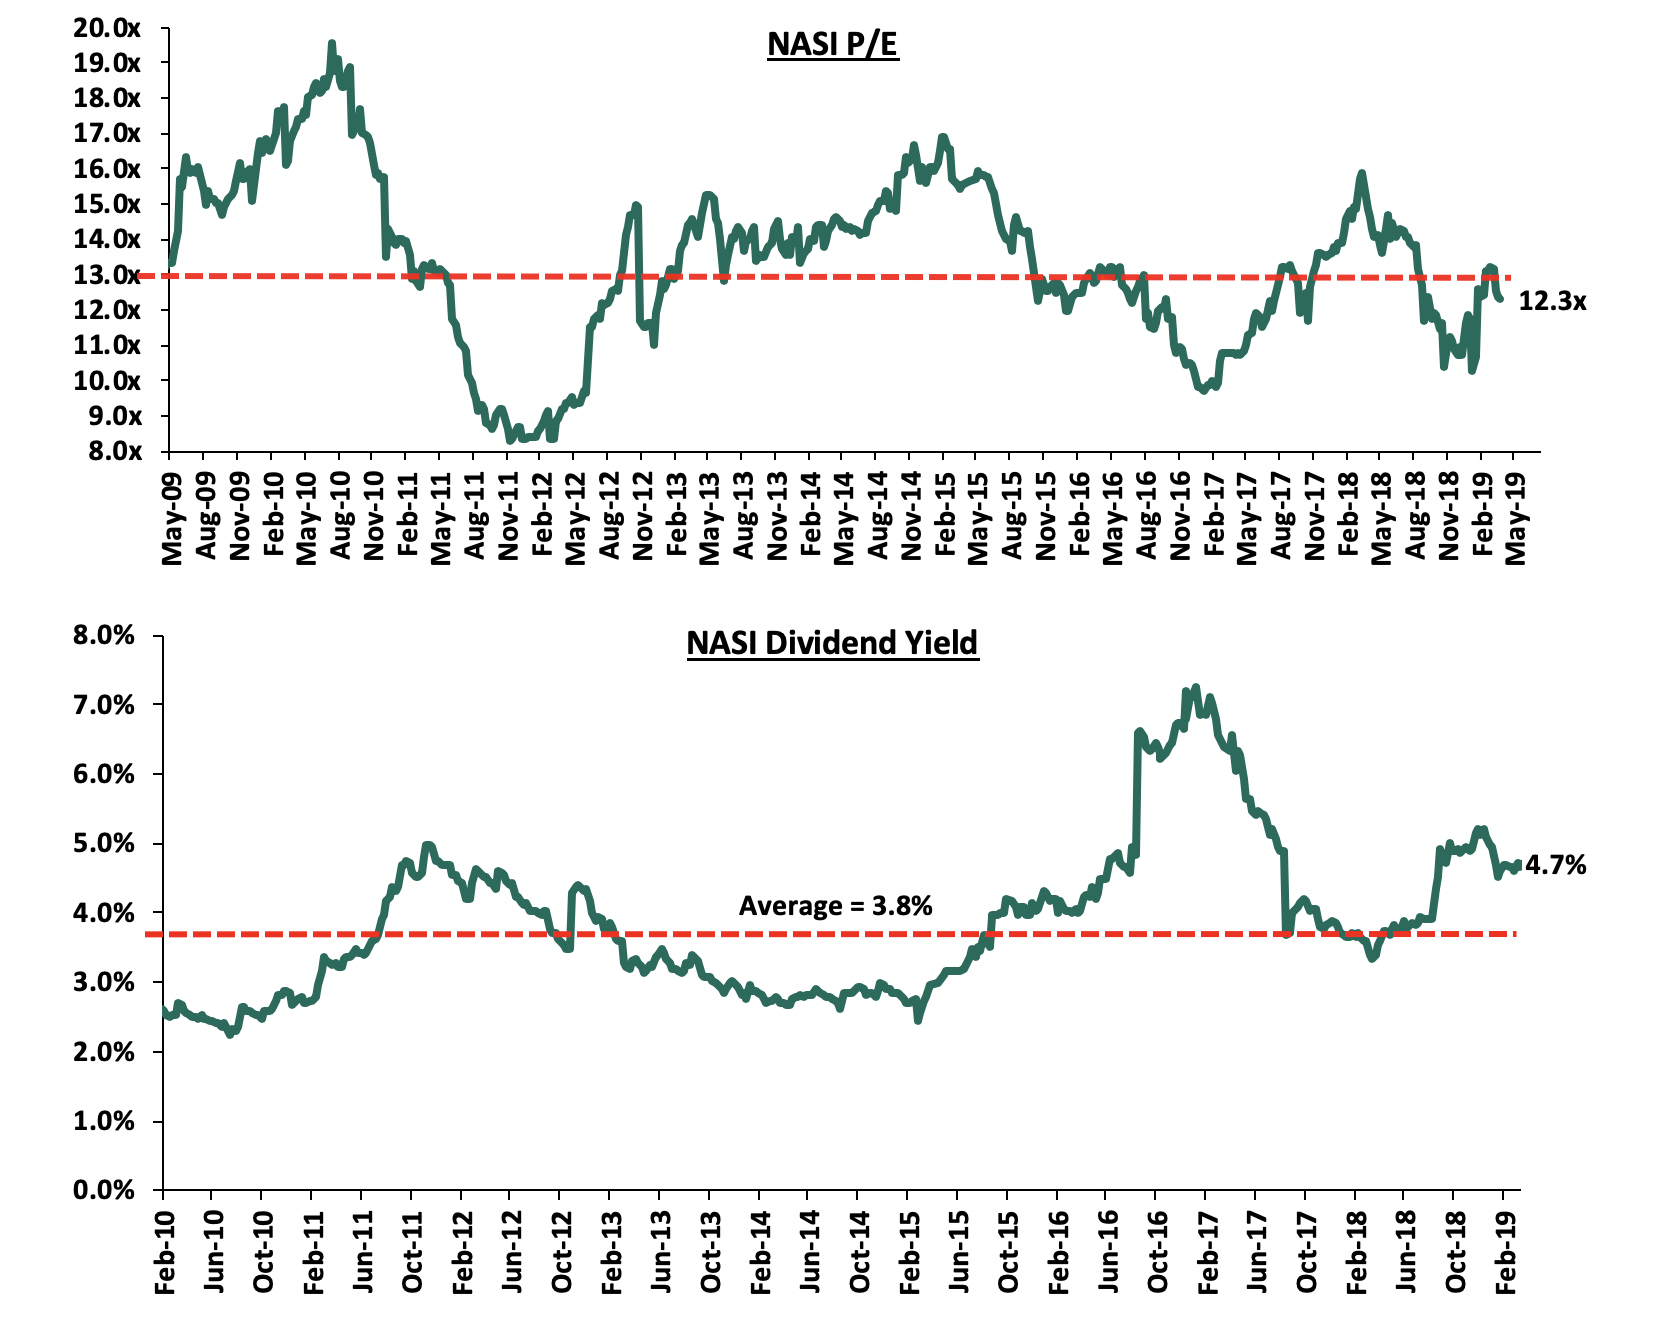
The market is currently trading at a price to earnings ratio (P/E) of 12.3x, 7.8% below the historical average of 13.4x, and a dividend yield of 4.7%, above the historical average of 3.8%. With the market trading at valuations below the historical average, we believe that there is still value in the market. The current P/E valuation of 12.3x is 27.1% above the most recent trough valuation of 9.7x experienced in the first week of February 2017, and 48.6% above the previous trough valuation of 8.3x experienced in December 2011. The charts below indicate the historical P/E and dividend yields of the market.
Weekly Highlights
During the week, KCB Group announced its intention to acquire a 100% stake in the National Bank of Kenya (NBK). The transaction is in line with our expectation of increased consolidation in the Kenya banking sector, as players with depleted capital positions become acquired by their larger counterparts or merge together to form well capitalized entities capable of navigating the relatively tough operating environment induced by price controls on lending rates, and exacerbated by the stiff competition. The summary of the transaction is as below:
- The offer will be by way of a share swap at a ratio of 10:1, 10 ordinary shares of NBK for 1 ordinary share of KCB, whose shares are currently trading at Kshs 4.7 and Kshs 45.0, respectively as at 18th April 2019,
- NBK, which has both ordinary and preference shareholders, will have the preference shareholders convert their preference shares into new ordinary shares. The conversion ratio will be 1:1, i.e. 1 preference share for 1 ordinary share. With the number of preference shares at 1.13 bn, and the number of ordinary shares at 338.7 mn, this will imply a total of 1.47 bn ordinary shares post conversion, and a dilution of 77.0% to the ordinary shareholders of NBK,
- Thus using the share swap ratio of 10:1, NBK’s 1.47 bn ordinary shares will be swapped for 147.3 mn KCB shares,
- KCB will thus have to issue an additional 147.3 mn ordinary shares to complete the share swap. This will increase KCB’s total shares outstanding to 3.21 bn shares from the current 3.06 bn shares, and current shareholders will be diluted by 4.6%,
- The implied transaction value will therefore be Kshs 6.6 bn, being the offer of 147.3 mn KCB shares at a price of Kshs 45.0, which was the market share price for KCB Group as at 18th April, 2019, and,
- As at FY’2018, NBK had a book value of Kshs 7.0 bn. As such the transaction is being carried out at a price-to-book value (P/Bv) of 0.9x, which is a 35.7% discount to the current listed banks trading book value of 1.4x, and 38.6% below the historical average P/Bv of 1.5x for the Kenyan Bank Transactions in the last 5 years;
The table below indicates previous banking acquisition deals and their transaction multiples in the Kenyan banking industry;
|
Acquirer |
Bank Acquired |
Book Value at Acquisition (Kshs bns) |
Transaction Stake |
Transaction Value (Kshs bns) |
P/Bv Multiple |
Date |
|
KCB Group |
National Bank of Kenya |
7.0 |
100.0% |
6.6 |
0.9x |
19-Apr* |
|
CBA Group |
Jamii Bora Bank |
3.4 |
100.0% |
1.4 |
0.4x |
19-Jan* |
|
AfricInvest Azure |
Prime Bank |
21.2 |
24.2% |
5.1 |
1.0x |
19-Jan |
|
NIC Group |
CBA Group |
30.5** |
47:53*** |
18.0 |
0.6x |
19-Jan* |
|
KCB Group |
Imperial Bank |
Unknown |
Undisclosed |
Undisclosed |
N/A |
18-Dec |
|
SBM Bank Kenya |
Chase Bank ltd |
Unknown |
75.0% |
Undisclosed |
N/A |
18-Aug |
|
DTBK |
Habib Bank Kenya |
2.4 |
100.0% |
1.8 |
0.8x |
17-Mar |
|
SBM Holdings |
Fidelity Commercial Bank |
1.8 |
100.0% |
2.8 |
1.6x |
16-Nov |
|
M Bank |
Oriental Commercial Bank |
1.8 |
51.0% |
1.3 |
1.4x |
16-Jun |
|
I&M Holdings |
Giro Commercial Bank |
3 |
100.0% |
5 |
1.7x |
16-Jun |
|
Mwalimu SACCO |
Equatorial Commercial Bank |
1.2 |
75.0% |
2.6 |
2.3x |
15-Mar |
|
Centum |
K-Rep Bank |
2.1 |
66.0% |
2.5 |
1.8x |
14-Jul |
|
GT Bank |
Fina Bank Group |
3.9 |
70.0% |
8.6 |
3.2x |
13-Nov |
|
Average |
|
|
78.3% |
|
1.4x |
|
|
* Announcement date |
||||||
|
** Book Value as of the announcement date |
||||||
|
*** Shareholder swap ratio between NIC and CBA, respectively |
||||||
From the table, we can see that Kenyan bank acquisition P/Bv average is at 1.4x, down from the previous 1.5x, as a result of the KCB-NBK Acquisition that was carried out at a lower P/Bv multipe. The average stake acquired is at 78.3%, up from 76.1%. Previously, transactions have taken place at a premium, (i) SBM and Fidelity at 57.0% above market, (ii) I&M Holdings and Giro at 30.8% above market, and (iii) M Bank and Oriental at 9.0% above market. Thus going forward, we expect acquisition transactions to take place at cheaper valuations. For NBK, the discount to the book value may be due to the bank’s high Non-Performing Loans ratio of 47.6% as at FY’2018, and NBK’s deteriorating top line revenue, with the bank’s core lending activities constrained by its significantly low capitalization, with the banks total capital to risk weighted assets coming in at 3.7% as at FY’2018.
In our view, Kenya’s banking sector consolidation will continue to happen and it will lead to a more stable, safer banking sector. Smaller banks constrained in capital, and struggling in their operations are likely to continue receiving take-over offers, which would present the best case scenario to navigate the current competitive banking sector landscape. Transactions are happening at significantly cheaper valuations, perhaps due to the smaller banks’ relatively poor performance, leading to liquidity constraints, which may warrant even further capital injections, hence the cheaper acquisition costs. For more information on the Banking Sector Performance see our Cytonn FY’2018 Banking Sector Review.
Shareholders of NIC Group and CBA Group have approved the merger of the two banks in their respective Annual General Meetings, which were held during the week. The approval paves the way for completion of the merger. The merger still needs approval from local and regional regulators including Bank of Tanzania, the Central Bank of Kenya, Capital Markets Authority and Competition Authority of Kenya. The banks expect that all the requisite approvals will be obtained by June, allowing shares of the merged entity to commence trading on the Nairobi Securities Exchange (NSE) on 17th July 2019. For more information on the merger please see our NIC Group and Commercial Bank of Africa (CBA) Merger Note.
Universe of Coverage
Below is a summary of our SSA universe of coverage:
|
Banks |
Price as at 12/04/2019 |
Price as at 18/04/2019 |
w/w change |
YTD Change |
Year Open |
Target Price* |
Dividend Yield |
Upside/ Downside** |
P/TBv Multiple |
Recommendation |
|
GCB Bank |
4.0 |
4.0 |
(0.3%) |
(13.9%) |
4.6 |
7.7 |
9.6% |
104.5% |
0.9x |
Buy |
|
Diamond Trust Bank |
130.0 |
130.0 |
0.0% |
(16.9%) |
156.5 |
241.5 |
2.0% |
87.8% |
0.7x |
Buy |
|
UBA Bank |
6.5 |
6.7 |
2.3% |
(13.6%) |
7.7 |
10.7 |
12.8% |
73.7% |
0.4x |
Buy |
|
Zenith Bank |
20.5 |
20.9 |
2.2% |
(9.3%) |
23.1 |
33.3 |
12.9% |
72.3% |
0.9x |
Buy |
|
CRDB |
125.0 |
125.0 |
0.0% |
(16.7%) |
150.0 |
207.7 |
0.0% |
66.2% |
0.4x |
Buy |
|
I&M Holdings |
113.0 |
112.8 |
(0.2%) |
32.6% |
85.0 |
167.7 |
3.1% |
51.8% |
1.1x |
Buy |
|
Access Bank |
6.0 |
6.9 |
15.1% |
0.7% |
6.8 |
9.5 |
5.8% |
44.5% |
0.4x |
Buy |
|
Equity Group |
42.5 |
41.9 |
(1.3%) |
20.2% |
34.9 |
58.1 |
4.8% |
43.4% |
2.0x |
Buy |
|
KCB Group*** |
44.8 |
45.0 |
0.4% |
20.2% |
37.5 |
60.0 |
7.8% |
41.1% |
1.4x |
Buy |
|
Co-operative Bank |
14.7 |
14.2 |
(3.7%) |
(1.0%) |
14.3 |
18.5 |
7.1% |
37.8% |
1.3x |
Buy |
|
Ecobank |
8.0 |
7.8 |
(2.5%) |
4.0% |
7.5 |
10.7 |
0.0% |
37.6% |
1.8x |
Buy |
|
CAL Bank |
1.0 |
1.0 |
6.2% |
5.1% |
1.0 |
1.4 |
0.0% |
35.9% |
0.8x |
Buy |
|
NIC Group |
36.5 |
36.8 |
1.0% |
32.4% |
27.8 |
48.8 |
2.7% |
35.3% |
1.0x |
Buy |
|
Stanbic Bank Uganda |
30.0 |
29.0 |
(3.3%) |
(6.5%) |
31.0 |
36.3 |
4.0% |
29.1% |
2.1x |
Buy |
|
Stanbic Holdings |
97.5 |
99.0 |
1.5% |
9.1% |
90.8 |
115.6 |
5.9% |
22.7% |
0.9x |
Buy |
|
Union Bank Plc |
6.5 |
6.8 |
4.6% |
21.4% |
5.6 |
8.2 |
0.0% |
19.9% |
0.7x |
Accumulate |
|
Bank of Kigali |
265.0 |
265.0 |
0.0% |
(11.7%) |
300.0 |
299.9 |
5.2% |
18.4% |
1.5x |
Accumulate |
|
Barclays Bank |
12.1 |
12.0 |
(0.8%) |
9.1% |
11.0 |
13.1 |
8.4% |
18.0% |
1.6x |
Accumulate |
|
SBM Holdings |
5.9 |
5.8 |
(1.4%) |
(2.3%) |
6.0 |
6.6 |
5.2% |
17.9% |
0.8x |
Accumulate |
|
Guaranty Trust Bank |
35.1 |
34.8 |
(0.7%) |
1.0% |
34.5 |
37.1 |
6.9% |
13.5% |
2.2x |
Accumulate |
|
National Bank |
4.7 |
4.7 |
(0.2%) |
(11.5%) |
5.3 |
5.2 |
0.0% |
10.4% |
0.3x |
Accumulate |
|
Standard Chartered(K) |
207.0 |
206.0 |
(0.5%) |
5.9% |
194.5 |
203.8 |
6.1% |
5.0% |
1.7x |
Hold |
|
Standard Chartered(G) |
19.5 |
19.0 |
(2.6%) |
(9.5%) |
21.0 |
19.5 |
0.0% |
2.4% |
2.4x |
Lighten |
|
Bank of Baroda |
129.2 |
130.0 |
0.6% |
(7.1%) |
140.0 |
130.6 |
1.9% |
2.4% |
1.1x |
Lighten |
|
FBN Holdings |
7.5 |
7.7 |
2.0% |
(3.8%) |
8.0 |
6.6 |
3.3% |
(10.1%) |
0.4x |
Sell |
|
Ecobank Transnational |
10.7 |
10.8 |
0.5% |
(36.8%) |
17.0 |
9.3 |
0.0% |
(13.7%) |
0.4x |
Sell |
|
Stanbic IBTC Holdings |
46.0 |
46.2 |
0.4% |
(3.6%) |
48.0 |
37.0 |
1.3% |
(18.6%) |
2.4x |
Sell |
|
HF Group |
4.6 |
4.4 |
(6.0%) |
(21.5%) |
5.5 |
2.9 |
8.0% |
(25.3%) |
0.2x |
Sell |
|
*Target Price as per Cytonn Analyst estimates |
||||||||||
|
**Upside / (Downside) is adjusted for Dividend Yield |
||||||||||
|
***Banks in which Cytonn and/or its affiliates holds a stake. |
||||||||||
|
****Stock prices indicated in respective country currencies |
||||||||||
We are “Positive” on equities since the sustained share price declines have seen the market P/E decline to below its historical average. We expect increased market activity, and possibly increased inflows from foreign investors, as they take advantage of the attractive valuations, to support the positive performance.
AVCA released their Country Snapshot for Kenya, which highlights the various developments in the private equity sector in Kenya between 2013 and 2018. According to AVCA, there were 110 reported deals during this period, translating to 57.8% of the total 190 deals reported in the 7 Eastern African countries. This was way ahead of Uganda, which was the country with the second largest share of PE deals by volume, at 18.9%, and the third, Tanzania, at 8.9% of total deals. In terms of value, Kenya ranked first, with a total deal value of USD 1.3 bn (Kshs 131.7 bn), followed by Ethiopia and Uganda, which both had an estimated share of 11% of total deals by value, translating to roughly USD 242.3 mn (Kshs 24.5 bn) of value of PE deals within the 6-year period.
According to the report, some of the factors driving this dominance by Kenya in the private equity space include:
- Economic Growth – Kenya is among the fastest growing economies in the East African region, having grown by an average of 5.6% in the last 5-years to 2017, only behind Tanzania and Rwanda with 5-year average economic growth rates of 6.9% and 6.6%, respectively, according to the International Monetary Fund (IMF),
- Business Confidence - According to World Bank’s Doing Business 2019 Report, Kenya’s ranking improved by 19 positions to #61 from #80 in the 2018 Report. In Africa, Kenya maintained its 4th position from the 2018 report after Mauritius, Rwanda and Morocco. The score improved by 5.1 points to 70.3 from 65.2 in the 2018 Report. Over the last 5-years, Kenya has improved by a total of 15.3 points and 75 positions. The key drivers for the improvement are easing the process of registering a business, easier access to electricity, access to credit, protecting of minority shareholders and enforcement of contracts among others, and,
- Calmer Political Climate – the period after the 2012 elections was characterized by a peaceful political climate, a stark contrast to what had happened in the previous elections. This reinforced investor confidence in the country, as well as making it easier for businesses in the country to operate. Even with the slowdown in 2017 due to the general elections, the country still witnessed substantial PE activity.
In terms of exits, 45% of the PE exits recorded in Kenya between 2013 and 2018 were exits to trade buyers, followed by exits to PE and other financial buyers, which stood at 30%. However, PE exits in Kenya, and in the East African region in its entirety, remain constrained by the complexities involved in exit by IPO, something that is clearly indicated by the IPO drought at the Kenyan bourse. There remains a huge gap in the exits, particularly via IPO, that can be improved by putting in place measures that: (i) make the process of companies going public by IPO easier, (ii) encourage disclosures for non-listed companies in order to improve transparency and accessibility of information, boosting investor confidence and making it easier for firms to raise capital during IPOs, and (iii) encourage foreign participation through improved regulation, good economic fundamentals and empowering private initiatives.
The median size for the PE deals witnessed over the period was USD 6.0 mn (Kshs 608.3 mn), with 89% of the total PE deal volume being below USD 50.0 mn (Kshs 5.1 bn). Compared to the rest of Africa, which had a median size of between USD 6.0 mn (Kshs 607.8 mn) and USD 8.0 mn (Kshs 810.5 mn), it shows similarity in the size of deals in Kenya and the rest of the continent, highlighting investor confidence in the Kenyan PE space, with investors willing to take just as much ticket size in deals within the country as they do in larger markets such as South Africa and Nigeria.
We maintain a positive outlook on private equity investments in Africa as evidenced by the increasing investor interest, which is attributed to; (i) economic growth, which is projected to improve in Africa’s most developed PE markets, (ii) attractive valuations in Sub Saharan Africa’s private markets compared to its public markets, and (iii) attractive valuations in Sub Saharan Africa’s markets compared to global markets. Going forward, the increasing investor interest, and stable macro-economic and political environment will continue to boost deal flow into African markets.
- Industry Reports
During the week, Hass Consult released the Hass Q1 2019 Property Sales and Rental Index, which indicated that the Nairobi Metropolitan Area residential market registered an annual price appreciation of 3.3% as at Q1’2019, compared to a 1.7% decline recorded in Q1’2018; while q/q prices depreciated by 2.6%, compared to an appreciation of 2.4% in Q1’2018. Other key take-outs from the report were as follows:
- Detached units and apartments recorded an average y/y price appreciation of 5.1% and 1.7%, on average, and a q/q depreciation of 1.6% and 0.6%, respectively. We attribute the subdued apartments annual performance to increase in apartments supply resulting in competitive pressure on price growth,
- On quarterly performance, semi-detached units registered a price appreciation of 1.6%, compared to apartments and detached units which posted a depreciation of 0.6% and 4.4%, respectively,
- In the high-end market, Muthaiga, Nyari, and Karen posted the best q/q performance with average price appreciation of 4.4%, 1.8% and 1.6%, respectively, whereas Nyari Estate and Karen recorded the highest annual price appreciation at 12.5% and 8.3%, respectively, which we attribute to sustained demand from local wealthy investors. The report attributes the subdued high-end market performance to changing economic trends marked by foreign governments cutting down on international and aid-funded activities leading to vacation of properties by expatriates,
- In the upper mid-end market, Loresho, and Lavington recorded the best annual price appreciation at 9.9% and 7.8%, with the q/q appreciation coming in at 3.4% and 2.3%, respectively,
- Among Satellite Towns, Ngong, Athi River, and Kiambu were the best performers with annual price appreciation of 13.7%, 9.3% and 8.0%, respectively. Athi River and Limuru posted the highest q/q price appreciation at 3.1% and 2.4%, respectively,
- On the rental index, apartments posted the highest annual rental price increase at 19.8%, in comparison to semi-detached and detached with 11.1% and 2.7%, respectively. During the quarter, detached units posted a decline in rental prices by 1.0% in comparison to apartments and semi-detached which grew by 4.8% and 1.7%, respectively,
Source: Hass Consult
The report is in tandem with our Cytonn Q1’2019 Markets Review, findings that showed subdued performance in the high-end market with the upper mid-end market recording the best performance. According to the Cytonn Q1’2019 Market Review, the upper mid-end market recorded an average price appreciation of 4.2%, the highest in the overall residential market. We expect the mid-end and lower mid-end sectors to continue exhibiting better returns owing to growing middle class and demand for affordable housing.
In the Hass Land Index, the key take-outs were as follows:
- Land price growth in Nairobi’s suburbs improved marginally, recording an annual growth of 1.4% and a q/q growth of 0.5%, whereas Satellite Towns recorded 1.5% annual growth and 0.2% q/q growth in Q1’2019, 0.3% points lower than land in Nairobi suburbs. The improved performance in Nairobi is attributed to increased demand for development land owing to presence of good infrastructure in comparison to most satellite towns and proximity to key amenities,
- Well-developed suburbs recorded price declines owing to correcting prices as they reach their highest potential price levels with areas like Kilimani and Spring Valley posting land annual price declines of 1.1% and 0.6%, respectively, due to a large inflow of new supply,
- Desirable areas with ample land supply recorded a slow price growth due to competitive pressure on land pricing. These include areas like Karen, Runda and Lavington, which posted average annual price growth of 3.2%, 2.2%, and 0.5%, respectively, and quarterly appreciation of 0.5%, 0.3% and negative 0.4%, in comparison to areas like Loresho and Ridgeways, which posted the highest annual price appreciation with 9.9% and 8.6%, and a q/q price appreciation of 3.7% and 2.2%, respectively, driven by demand from developers amidst reducing availability of land for development in the suburbs, and,
- In Satellite Towns, Mlolongo recorded the highest annual land price appreciation at 9.7%, while Syokimau registered the best quarterly appreciation at 3.2%. The two areas are boosted by a surge in demand by homebuyers owing to their close proximity to the JKIA and ease of transit due to the Nairobi Railway and Standard Gauge Railway (SGR).
The report is in tandem with our Q1’2019 Markets Review, according to which the sector recorded average price appreciation of 0.5% with Satellite Towns posting an average of 2.1% while commercial areas like Kilimani and Upperhill generally posted a decline of 3.5% on average owing to a price correction. However, we expect the land sector in satellite towns to continue recording improved performance going forward, fuelled by; (i) the continued demand for development land especially in satellite towns where it is more affordable and available in bulk, (ii) improving infrastructure such as the road network and sewer connections, and (iii) the digitalization of the Ministry of Lands which will enhance land administration.
Broll, a commercial real estate consultancy firm, released their Kenya Logistics Market Report, which tracks performance of the industrial sector in Nairobi. The key takes outs from the report were as follows:
- Price per acre for industrial serviced plots located in Nairobi’s periphery, increased by an 11.1%, 3-year CAGR to Kshs 37.7 mn as at 2018 from Kshs 27.5 mn in 2015. The price was supported by demand for logistics space away from the relative congestion of Nairobi’s industrial areas to satellite towns such as Kiambu and Machakos which also offer good infrastructure,
- As at December 2018, the total industrial space supply was at 1.2 mn SQM, a 9.1% increase from 1.1 mn SQM as at December 2017. The rise in industrial space was driven by increased activity in the logistics sector supported by continued foreign investment, as Kenya remains a regional hub and a key gateway to Eastern and Central Africa markets. New developments include the African Logistics Property at Tatu City and Viken Thirty Industrial Parks, while projects under development include Infinity Industrial Park, Nairobi Gate Industrial Park along the Eastern Bypass, and Tilisi Industrial Park in Rironi -Limuru,
- Embakasi, Athi River, and Syokimau accounted for 72.0% of the total industrial space supply, attributable to proximity to the Inland Container Depot, the JKIA, as well as the Standard Gauge Railway station which are key ports into East Africa,
- Occupancy rates in the industrial sector increased by 4.0% between 2017 and 2018 attributable to improving business environment and infrastructure, with Grade A warehouses registering the highest increase to 77% on average from 67% in 2017 owing to continued demand for high grade logistics space that continues to be in low supply. As per the report, Grade A warehouses account for the lowest supply at 5.0%, in comparison to Grade B and C at 75.3% and 19.7%, respectively. Generally, Grade A logistic space offer better services and structures such as wide roads, corporate offices, and other amenities such as better-quality loading facilities as well as high security, and,
- However, average rental rates remained flat with the average monthly rent per SQFT for Grade A, B and C spaces at Kshs 65, Kshs 37 and Kshs 21, respectively in line with the general real estate sector performance.
We expect the industrial and logistics sector to continue expanding owing to (i) improved business environment, which is bound to attract foreign investors, (ii) government’s focus on growing the manufacturing sector under its Big 4 Agenda, and, (iii) continued improvement of infrastructure, for instance, with the expected dualling of Mombasa Road, the Western Bypass, and SGR Phase II.
- Residential
During the week, the Housing Ministry kick started the Housing Fund Levy with a directive for employees and employers to remit by 9th May. The fund is structured similar to a pension scheme such that, employees will contribute a percentage of their income- 1.5% of their gross earnings each month, to a maximum of Kshs 5,000, and employers will match the amounts contributed. According to the Principal Secretary in the Ministry of Housing, Mr. Charles Mwaura, the fund will be structured and operated as follows:
- The funds contributed by both the employer and the employee will go to a common pool at the National Housing Development Fund, which will be under the control of the National Housing Corporation,
- There will be two categories of access and use for the funds, a) individuals in the affordable housing bracket will use the funds to purchase houses through tenant purchase schemes, while b) individuals with a stronger financial muscle, will use the funds as deposits for mortgages,
- The contributors, who are registered through the Boma Yangu Portal, will then be pre-qualified and given an automated score as to whether they fall under the low cost housing category (Individuals earning up to Kshs 14,999), social housing category (Individuals earning between Kshs 15,000 and Kshs 49,999), or mortgage category (Individuals earning above Kshs 50,000),
- The private sector will then start building houses in line with the PPP agreements signed, and it is expected that 2,000 houses will be delivered in each county every year,
- The registered contributors, will then book the houses, and as the 3.0% contributed is not sufficient to cater for the cost of the houses, they will start paying for the houses off plan,
- Each year, the state will then run a lottery to allocate the houses available among the contributors paying for the houses. This is to allow for equal distribution and prevent the contributors with a stronger financial muscle from acquiring all the houses available and subsequently renting them out.
However, following the directive, the announcement has faced huge opposition attracting a court injunction to halt taking effect until final decisions by the labour court are made. Currently, approximately 211,000 Kenyans are registered on the affordable housing portal and in our view; the fund will help potential homebuyers in the lower mid-end class to save towards home ownership, boosting offtake for the 500,000 units to be delivered by the government. However, the key challenge is acceptance by Kenyans largely due to information gaps about the Housing Fund structure and lack of transparency by the government coupled by current high cost of living with an ongoing drought. The government should harmonize the process by sensitizing Kenyans and provide a clear and reliable framework of how the fund will benefit contributors.
We expect the real estate sector to continue recording a modest performance in sectors such as residential especially with the ongoing drought season and declined levels of expats residing in the country. However, niche markets and concepts should be able to do well, and we expect the logistics sector to continue on a positive performance owing to focus on industrializing the country, improved business environment especially with regards to tax rebates in special economic zones, and improved infrastructure.
Following the release of FY’2018 results by Kenyan banks, the Cytonn Financial Services Research Team undertook an analysis on the financial performance of the listed banks and identified the key factors that shaped the performance of the sector, and our expectations for the banking sector in 2019.
The report is themed “Growth and Recovery in a tough operating environment”, as we assess the key factors that influenced the improved performance of the banking sector in 2018, the key challenges, and also areas that will be crucial for growth of banking sector going forward. As a result, we seek to answer the questions, (i) “what influenced the banking sector’s performance?”, and (ii) “what should be the focus areas for the banking sector going forward?” as the sector navigates the relatively tough operating environment. As such, we shall address the following:
- Key Themes that Shaped the Banking Sector in FY’2018;
- Performance of the Banking Sector in FY’2018; and,
- Outlook and Focus Areas of the Banking Sector Players Going Forward.
Section I: Key Themes that Shaped the Banking Sector in FY’2018:
Below, we highlight the key themes that shaped the banking sector in FY’2018, which include consolidation, regulation, asset quality and improved earnings:
- Consolidation – The banking sector has continued to witness consolidation activity, as players in the sector are either acquired or merged leading to formation of relatively larger and possibly more stable entities. Consolidations that took place in 2018 include:
- In August 2018, State Bank of Mauritius (SBM) Bank Kenya completed the acquisition of select assets and liabilities of Chase Bank Limited, which was under receivership. Following the agreement between the Central Bank of Kenya (CBK), Kenya Deposit Insurance Corporation (KDIC), and SBM Bank Kenya, 75.0% of the value of all moratorium deposits at Chase Bank were be transferred to SBM Bank Kenya. The remaining 25.0% remained with Chase Bank. This was a major milestone in Kenya’s banking sector as it the first successful instance, in the history of Kenya, of a bank being successfully brought out of receivership. We note that the deal highlighted the continued attractiveness of the Kenyan banking sector, as banks, both local and foreign, drive their growth inorganically through mergers and acquisitions. This is especially evident with Morocco-based bank, Attijariwafa Bank highlighting its plans for several acquisitions in Africa in the coming year, with Kenya being one of its key focus areas. The bank, which has an asset base of USD 51.0 bn, indicated it was looking to make an acquisition in Kenya, targeting one of the 5 largest banks in Kenya, meaning that one of KCB Group, Equity Group, Co-operative Bank, Standard Chartered Bank Kenya and Diamond Trust Bank Kenya, would be the bank’s targets,
- The Central Bank of Kenya (CBK) and Kenya Deposit Insurance Corporation (KDIC) announced the acceptance of a binding offer from KCB Group, to acquire certain assets and liabilities of Imperial Bank Limited under Receivership (IBLR). The transaction will see an additional 19.7% of deposits availed to depositors, an addition to the 35.0% availed, on the acceptance of the binding offer by KDIC and CBK in December 2018. The remaining deposit balances will be availed to depositors in three tranches, (i) 12.5% after the official signing of the agreement, a further 12.5% one-year after the signing of the agreement, and (ii) 25.0% balance on the second, third and fourth anniversaries of the signing of the agreement. The split of the 25.0% deposits in the second, third and fourth anniversaries is however yet to be disclosed. The deposits will continue to earn interest in line with KCB’s prevailing deposit rates on its products. However, the recovery does not include the realization of approximately Kshs 36.0 bn of loans, translating to 50.0% of the current loan balances, linked to ongoing litigation. KCB confirmed that it would take over five branches of IBLR, out of the 26 that IBLR had prior to going under receivership. The completion of the transaction, in our view, will continue to instill confidence in the banking sector’s stability, as it provides a remediation route for banks that have encountered turbulence in their operations, as well as safeguarding of depositors’ interests. We also are of the view that there should be no recourse for failures induced by lax corporate governance, and that the enforcement of strict regulations, operating procedures and corporate governance principles is key to avoid similar occurrences in the future. KCB Group also issued its proposal to acquire 100.0% of all the ordinary shares of National Bank of Kenya on 18th April 2019, through a share swap of 1 ordinary share of KCB for every 10 NBK shares. The swap will be after the conversion of 1.135 bn preference shares in NBK, to ordinary shares. The transaction, is subject to ratification by the shareholders and the regulatory authorities,
- In January 2019, the directors of NIC Group and Commercial Bank of Africa (CBA) announced their agreement to a proposed merger between the two banks that was first announced on 6th December 2018, with the shareholders of NIC Group accepting the merger proposition during the Annual General Meeting (AGM) on 17th April 2019. The proposed merger is expected to be completed upon fulfilment of a certain set of conditions, with the merged entity expected to commence its operations at the onset of Q3’2019. The proposed transaction will be executed through a share swap in the ratio of 53:47 between CBA and NIC, implying that shareholders of CBA Group will be entitled to own 53.0% of the merged entity’s issued shares while shareholders of NIC Group will be allotted 47.0% of the combined entity. Given that NIC Group has 703.9 mn issued shares, it will have to issue 793.8 mn new shares to CBA shareholders, in order to adhere to the 53:47 share swap ratio. The merged company, NIC Group, is set to remain listed on the Nairobi Securities Exchange (NSE).
The increased consolidation activity continued into 2019, as CBA Group issued Jamii Bora owners with a buyout offer of Kshs 1.4 bn, to acquire a 100.0% stake in the bank. With Jamii Bora’s equity position of Kshs 3.4 bn as at Q1’2018, without further injection, it would imply the transaction would happen at a P/Bv ratio of 0.4x. We note that the huge discount to equity was largely due to Jamii Bora’s deteriorating financial performance, whose genesis can be traced to the enactment of the Banking (Amendment) Act 2015 that capped interest chargeable on loans, as shown by the steep 21.0% decline in the loan book in the first full year of implementation of the Banking (Amendment) Act 2015. This consequently led to the decline in interest income, which declined by 36.2% to Kshs 1.4 bn in FY’2017, from Kshs 2.2 as at FY’2016. Consequently, operating income declined 57.8% to Kshs 0.5 bn from Kshs 1.3 bn in FY’2016. Since decline in income was faster than the 28.0% decline in total operating expenses to Kshs 1.3 bn from Kshs 1.8 bn, the bank consequently begun its loss making trend. The declining performance impacted its liquidity, with its liquidity position declining to (11.1%) as at Q1’2017, indicating its inability to meet any short-term obligations. The performance consequently enables CBA to offer a buyout at the huge discount to the book.
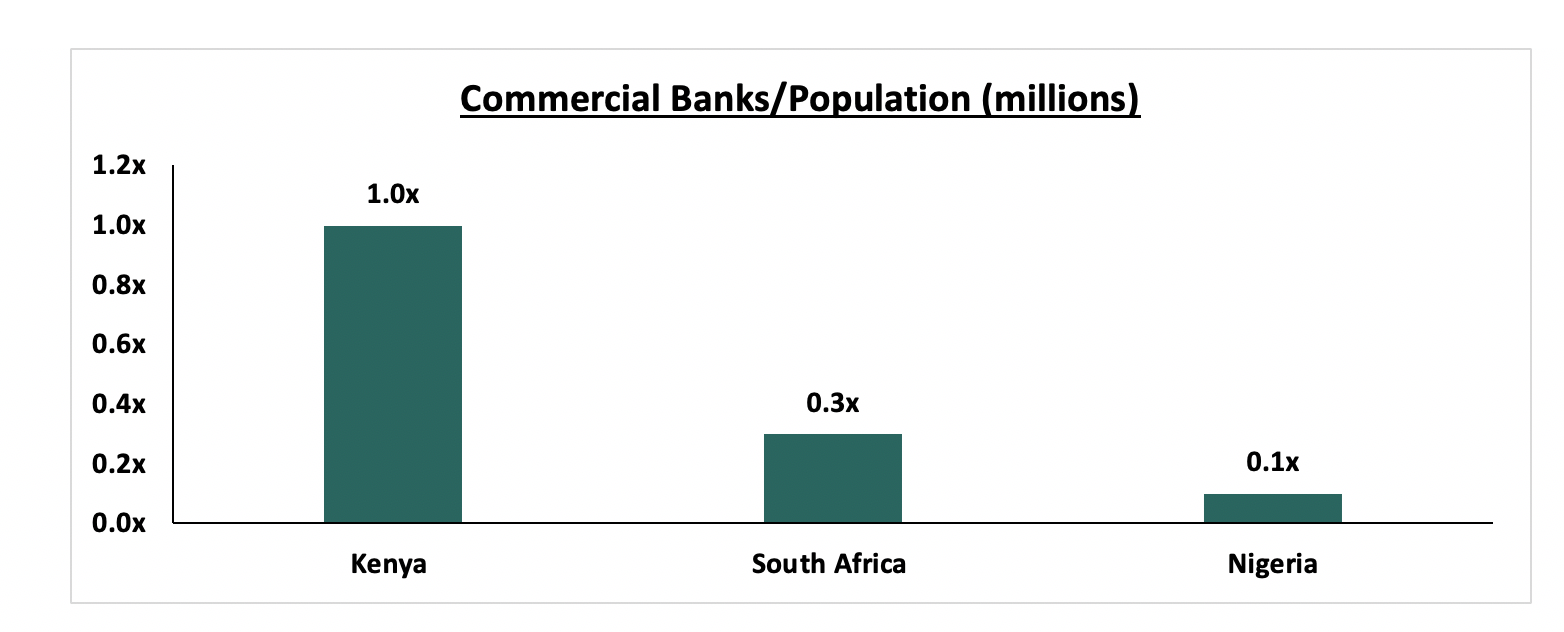
As noted in our focus note titled Consolidation in Kenya’s Banking Sector to Continue, we expect more consolidation in the banking sector, as the relatively weaker banks that probably do not serve a niche become acquired by the larger counterparts who have expertise in deposit gathering, or serve a niche in the market. Consolidation will also likely happen, as entities form strategic partnerships, as they navigate the relatively tougher operating environment that is exacerbated by the stiff competition among the various players in the banking sector. We maintain our view that Kenya continues to be overbanked when compared to other countries as shown in the chart below, necessitating a reduction in the number of players in the sector.
The table below summarizes the deals that have either happened or announced and expected to be concluded;
Acquirer
Bank Acquired
Book Value at Acquisition (Kshs bns)
Transaction Stake
Transaction Value (Kshs bns)
P/Bv Multiple
Date
KCB Group
National Bank of Kenya
7.0
100.0%
6.6
0.9x
19-Apr*
CBA Group
Jamii Bora Bank
3.4
100.0%
1.4
0.4x
19-Jan*
AfricInvest Azure
Prime Bank
21.2
24.2%
5.1
1.0x
19-Jan
NIC Group
CBA Group
30.5**
47:53***
18.0
0.6x
19-Jan*
KCB Group
Imperial Bank
Unknown
Undisclosed
Undisclosed
N/A
18-Dec
SBM Bank Kenya
Chase Bank ltd
Unknown
75.0%
Undisclosed
N/A
18-Aug
DTBK
Habib Bank Kenya
2.4
100.0%
1.8
0.8x
17-Mar
SBM Holdings
Fidelity Commercial Bank
1.8
100.0%
2.8
1.6x
16-Nov
M Bank
Oriental Commercial Bank
1.8
51.0%
1.3
1.4x
16-Jun
I&M Holdings
Giro Commercial Bank
3
100.0%
5
1.7x
16-Jun
Mwalimu SACCO
Equatorial Commercial Bank
1.2
75.0%
2.6
2.3x
15-Mar
Centum
K-Rep Bank
2.1
66.0%
2.5
1.8x
14-Jul
GT Bank
Fina Bank Group
3.9
70.0%
8.6
3.2x
13-Nov
Average
78.3%
1.4x
* Announcement date
** Book Value as of the announcement date
*** Shareholder swap ratio between NIC and CBA, respectively
- Regulation - Regulation remained a key aspect that affected the banking sector, with the regulatory environment evolving and becoming increasingly stringent. Key changes in the regulatory environment in 2018 include:
- IFRS 9 Implementation: The implementation of the standard took effect from 1st January 2018, and banks were expected to provision for both the incurred and expected credit losses, a deviation from the previous IAS 39, which required provisioning for only the incurred credit losses. As allowed for in the initial year of implementation, most banks charged the one-off impairments on their equity, hence the decline in the impairment charges, despite a deterioration in asset quality. To avoid the high provisioning levels that would be required, whilst earning higher risk-adjusted returns, banks became unwilling to lend to the private sector largely comprised of SMEs. Due to the adoption of more stringent lending policies, lending was largely skewed towards collateral based lending as opposed to unsecured lending. The IFRS 9 standard also requires the implementation of the Effective Interest Rate (EIR) Model, which required the amortization of the fees and commission received from loans, over the tenor of the loan. Thus on implementation of the standard, some banks recorded declines in the fees and commissions segment of Non-Funded Income (NFI),
- Draft Financial Markets Conduct Bill 2018: The National Treasury completed the Draft Financial Markets Conduct Bill, which seeks to create an effective financial consumer protection, make credit more accessible and consequently support financial innovation and competition. The bill’s main objectives thus are:
- Ensure better conduct by banks and other lenders in terms of extending credit to retail financial customers. By categorically not defining lenders as banks, this, in our view, might be the introduction of licensing for credit companies that are not banks, mainly the non-deposit taking Microfinance Institutions (MFIs),
- Provide consumer protection, mainly for retail customers by ensuring their credit contracts are clear and well understood in terms of interest, fees, charges and costs on credit facilities, thereby removing the opacity that has been existent in loan pricing. With consumer protection a key facet of the law, the law seeks to cast a wider net on financial services institutions that fall under the ambit of the proposed financial markets conduct authority, which, presumably, should rope in mobile lending institutions into this bracket,
- Banking Sector Charter: The Central Bank of Kenya proposed to introduce a Banking Sector Charter that will guide service provision in the sector. The Charter aims to instill discipline in the banking sector in order to make it responsive to the needs of the banked population. It is expected to facilitate a market-driven transformation of the Kenyan banking sector, thereby considerably improving the quality of service provided, and increasing access to affordable financial services for the unbanked and under-served population. The impending implementation of the charter possibly in 2019, will likely introduce risk-based credit scoring, which requires banks to extend credit on the basis of their credit scores, as determined by licensed credit reference bureaus, and,
- Removal of the 70.0% of the CBR interest on deposits: The National Assembly voted to retain the cap on loans in the Finance Act 2018, effectively retaining the 4.0% cap above the Central Bank Rate (CBR) on interest chargeable on loans. However, the 70.0% of the CBR floor on interest payable on deposits was removed, effectively enabling banks to pay lower interest on their deposits. With the removal of the same, banks have adjusted accordingly, with various players indicating a lowering of their interest expense requirements, and a possible improvement in the Net Interest Margin, whose benefits will be fully realized in 2019. We however do not expect a significant adjustment in the aggregate cost of funds, given that most banks had already commenced re-adjustments and reclassification of accounts to transactional and non-interest bearing accounts.
- Asset Quality – The banking sector continued to record a deterioration in its asset quality in 2018, as indicated by the rise in the Gross Non-Performing Loans (NPLs) ratio to 9.7%, from 8.5% in FY’2017, much higher than the 5-year average of 8.4%. The effects of the harsh operating environment experienced in 2017 spilled over to 2018, with the economic recovery from the previous year being slower than anticipated, which resulted in an increase in the number and value of bad loans. The major sectors touted by banks as leading in asset quality deterioration include trade, retail, manufacturing and real estate, all of which were affected by the tough operating environment experienced in 2017, which was occasioned by a volatile political environment due to the prolonged electioneering period, and a severe prolonged drought that affected the agriculture sector, which remains the largest GDP contributor. Delayed payments by the government was also identified as a contributing factor, which affected various sectors, with small to mid-sized entities affected the most. Owing to the deteriorating asset quality, banks continued to implement their stringent lending policies in a bid to curb the relatively rising NPLs, and consequently the associated impairment charges. In addition to this, the 100 bps decline in the Central Bank Rate (CBR) resulted in reduced margins, and risk-adjusted returns for banks. Consequently, listed banks, on average, slowed their pace of credit extension to the economy, as shown in the chart below, with the listed banking sector’s net loan growth coming in at 4.3%, slower than the 6.1% growth experienced in FY’2017. With reduced credit extension to the private sector, largely the Micro, Small and Medium Enterprises (MSME) who make up approximately 80.0% of the private sector, the country’s economic growth will likely be affected in the long-run, due to reduced availability of capital for the acquisition and creation of capital goods.
- Improved Earnings Growth: Listed banks, on aggregate, recorded an improved profitability in 2018 compared to 2017, as evidenced by the 13.8% rise in the core Earnings per Share (EPS), from a 1.0% decline in FY’2017. The performance highlights the banking sector’s resilience, even in the face of the relatively tougher operating environment. The improved performance was largely driven by an improvement in the total operating income, coupled with an improvement in the operating expenses. The Net Interest Income (NII) improved to record a 2.6% growth, compared to the 3.8% decline recorded in FY’2017. The improvement in NII was largely due to the improvement in interest income, as most banks earned higher interest income from government securities, benefitting from the re-allocations to government securities in 2017, as they yielded relatively higher risk-adjusted returns compared to loans. Focus on NFI also helped grow the bottom line, albeit banks registered a mixed performance in NFI growth, with 6 banks recording growths in NFI while 5 banks recorded declines in NFI. For banks that recorded declines in NFI, the declines were largely on the fees and commission income, with the decline in fees and commissions on loans attributed to reduced lending and consequently the fee income, and the implementation of the EIR model under IFRS 9. Banks have however continued to exploit this space, with some forays being made into bancassurance, transactional income and brokerage. Examples of ventures undertaken in 2018 include:
- I&M Holdings completing a full buyout of Youjays Insurance Brokers for an undisclosed amount on 5thApril 2018,
- KCB Group partnering with Liberty Holdings for the education savings plan dubbed Elimisha in 5th June 2018;
Banks have also been promoting the usage of alternative channels of transactions such as mobile banking, internet banking, and agency banking as they seek to grow transactional income. Notable moves towards the alternative transaction channels segment in 2018 include:
- Housing Finance launching their own mobile banking app dubbed HF Whizz. The app aims to change the way consumers open and access their bank accounts. Users of the app will be able to open an account, access loans, and deposit and transfer cash via their mobile phones,
- Barclays Bank launched its own digital platform, dubbed Timiza, which allows customers to send money to their respective accounts, pay for utilities such as water and electricity, procure micro insurance, and pay for online taxi hailing services. In addition to this, the app grants customers with the access to micro loans of between Kshs 100 and Kshs 150,000 from the platform at interest rates of 1.2% monthly, and a one-off facilitation fee of 5.0%, with the loan repayable after 30-days,
- Equity Group launched its FinTech subsidiary, Finserve, a technological service company, tasked to drive disruptive technology innovation in the financial services segment. Finserve will operate as an autonomous commercial enterprise, delivering technological solutions not just for Equity Group, but also to the entire economy. Finserve houses products like Equitel, Equity Eazzy app, EazzyBiz and EazzyNet. Through Finserve, Equity Group aims to provide an edge in terms of integration with all major global card associations including American Express, Mastercard, Visa, JCB, Dinners, and Union Pay, becoming the single largest aggregator of card payments in the region.
Section II: Performance of the Banking Sector in FY’2018:
The table below highlights the performance of the banking sector, showing the performance using several metrics, and the key take-outs of the performance.
|
Bank |
Core EPS Growth |
Interest Income Growth |
Interest Expense Growth |
Net Interest Income Growth |
Net Interest Margin |
Non-funded income Growth |
NFI to Total Operating Income |
Growth in Total Fee and Commissions |
Deposit Growth |
Growth in Govt Securities |
Cost to Income |
Loan to Deposit ratio |
Loan Growth |
Cost of Funds |
Return on average equity |
|
Stanbic |
45.7% |
13.8% |
19.2% |
14.0% |
5.0% |
18.3% |
45.1% |
15.5% |
13.5% |
3.7% |
59.5% |
79.7% |
22.1% |
3.5% |
14.3% |
|
NBK |
33.5% |
(10.5%) |
(10.9%) |
(22.6%) |
6.5% |
(30.3%) |
24.8% |
(72.5%) |
4.9% |
29.7% |
94.3% |
66.9% |
(3.0%) |
2.8% |
0.1% |
|
KCB |
21.8% |
4.1% |
14.1% |
0.9% |
8.2% |
(0.1%) |
32.0% |
(25.3%) |
7.6% |
9.1% |
52.8% |
84.8% |
7.9% |
3.2% |
21.9% |
|
SCBK |
17.1% |
2.3% |
(3.0%) |
4.5% |
7.5% |
4.9% |
32.2% |
19.7% |
5.1% |
(10.7%) |
58.6% |
52.9% |
(6.1%) |
3.3% |
17.5% |
|
I&M |
17.1% |
6.4% |
17.3% |
0.3% |
6.7% |
32.8% |
32.8% |
59.1% |
25.9% |
0.9% |
53.0% |
78.2% |
9.0% |
4.9% |
17.2% |
|
Co-op |
11.6% |
6.6% |
(0.2%) |
9.5% |
9.5% |
(4.4%) |
29.5% |
(3.0%) |
6.5% |
10.4% |
58.8% |
80.2% |
(3.3%) |
3.8% |
18.3% |
|
Barclays |
7.1% |
7.0% |
31.6% |
0.9% |
8.6% |
14.7% |
30.6% |
6.7% |
11.5% |
58.9% |
66.4% |
85.5% |
5.3% |
3.5% |
16.8% |
|
Equity |
4.8% |
10.0% |
8.9% |
(0.9%) |
8.5% |
(6.3%) |
38.4% |
(16.6%) |
13.3% |
1.9% |
57.7% |
70.3% |
6.5% |
2.7% |
22.5% |
|
DTBK |
2.3% |
1.8% |
2.0% |
1.8% |
6.2% |
3.0% |
21.3% |
5.7% |
6.2% |
2.6% |
56.9% |
68.3% |
(1.5%) |
4.9% |
13.9% |
|
NIC |
2.0% |
4.8% |
14.1% |
(1.8%) |
5.7% |
11.4% |
30.5% |
9.2% |
4.0% |
12.9% |
61.7% |
81.7% |
(1.4%) |
5.2% |
12.1% |
|
HF |
N/A |
(15.2%) |
(9.1%) |
(23.9%) |
4.2% |
(2.0%) |
36.8% |
23.3% |
(5.3%) |
75.0% |
(118.2%) |
89.1%* |
(12.5%) |
7.4% |
(5.5%) |
|
2018 Mkt cap Weighted Average* |
13.8% |
6.5% |
10.6% |
2.6% |
7.9% |
3.8% |
33.2% |
(1.0%) |
10.3% |
9.1% |
57.8% |
75.5% |
4.3% |
3.5% |
19.0% |
|
2017 Mkt cap Weighted Average* |
(1.0%) |
(2.4%) |
2.6% |
(3.8%) |
8.4% |
9.1% |
33.6% |
13.4% |
12.5% |
22.2% |
61.1% |
80.0% |
6.1% |
3.6% |
17.6% |
|
*Market cap weighted as at 30th December 2018/2017 respectively |
|||||||||||||||
Key takeaways from the table above include:
- Listed Kenyan banks recorded a 13.8% average increase in core Earnings Per Share (EPS), compared to a decline of 1.0% in FY’2017, and consequently, the Return on Average Equity (RoAE) increased to 19.0%, from 17.6% in FY’2017. All banks apart from HF Group recorded growths in their core EPS, with Stanbic Holdings recording the highest growth of 45.7%, and the lowest being HF Group, which recording a loss per share of Kshs 1.7,
- The sector recorded weaker deposit growth, which came in at 10.3%, slower than the 12.5% growth recorded in FY’2017. Despite the slower deposit growth, interest expenses increased by 10.6%, indicating banks have been mobilizing expensive deposits. However, with the removal of the limit of interest payable on deposits, the associated interest expenses on deposits is expected to improve in 2019, and possibly improve the cost of funds,
- Average loan growth came in at 4.3%, which was lower than the 6.1% recorded in FY’2017, indicating that there was an even slower credit extension to the economy, due to sustained effects of the interest rate cap and the relatively tougher operating environment that saw banks tighten their credit standards. Government securities on the other hand recorded a growth of 9.1% y/y, which was faster compared to the loans, albeit slower than 22.2% recorded in FY’2017. This highlights banks’ continued preference towards investing in government securities, which offer better risk-adjusted returns. Interest income increased by 6.4%, compared to a decline of 2.4% recorded in FY’2017, as increased allocations to government securities bore fruit. The Net Interest Income (NII) thus grew by 2.5% compared to a decline of 3.8% in FY’2017,
- The average Net Interest Margin in the banking sector currently stands at 7.9%, down from the 8.4% recorded in FY’2017, despite the Net Interest Income increasing by 2.6% y/y. The decline was mainly due to the faster 9.1% increase in allocation to relatively lower yielding government securities, coupled with the decline in yields on loans due to the 100 bps decline in the Central Bank Rate (CBR), and,
- Non Funded Income grew by 3.8% y/y, slower than 9.1% recorded in FY’2017. The growth in NFI was weighed down as total fee and commission declined by 1.0%, compared to the 13.4% growth recorded in FY’2017. The fee and commission income continued to be subdued by the slow loan growth, coupled with the implementation of the Effective Interest Rate (EIR) model under IFRS 9, which requires banks to amortize the fees and commissions on loans, over the tenor of the loan.
Section III: Outlook and Focus Areas of the Banking Sector Going Forward:
In summary, the banking sector had an improved performance, largely aided by the relatively better operating environment compared to 2017, however, the banking sector has been fraught by two main challenges:
- Deteriorating asset quality brought about by the spillover effects of the challenging operating environment experienced in 2017, and the delayed payments by the Government, and
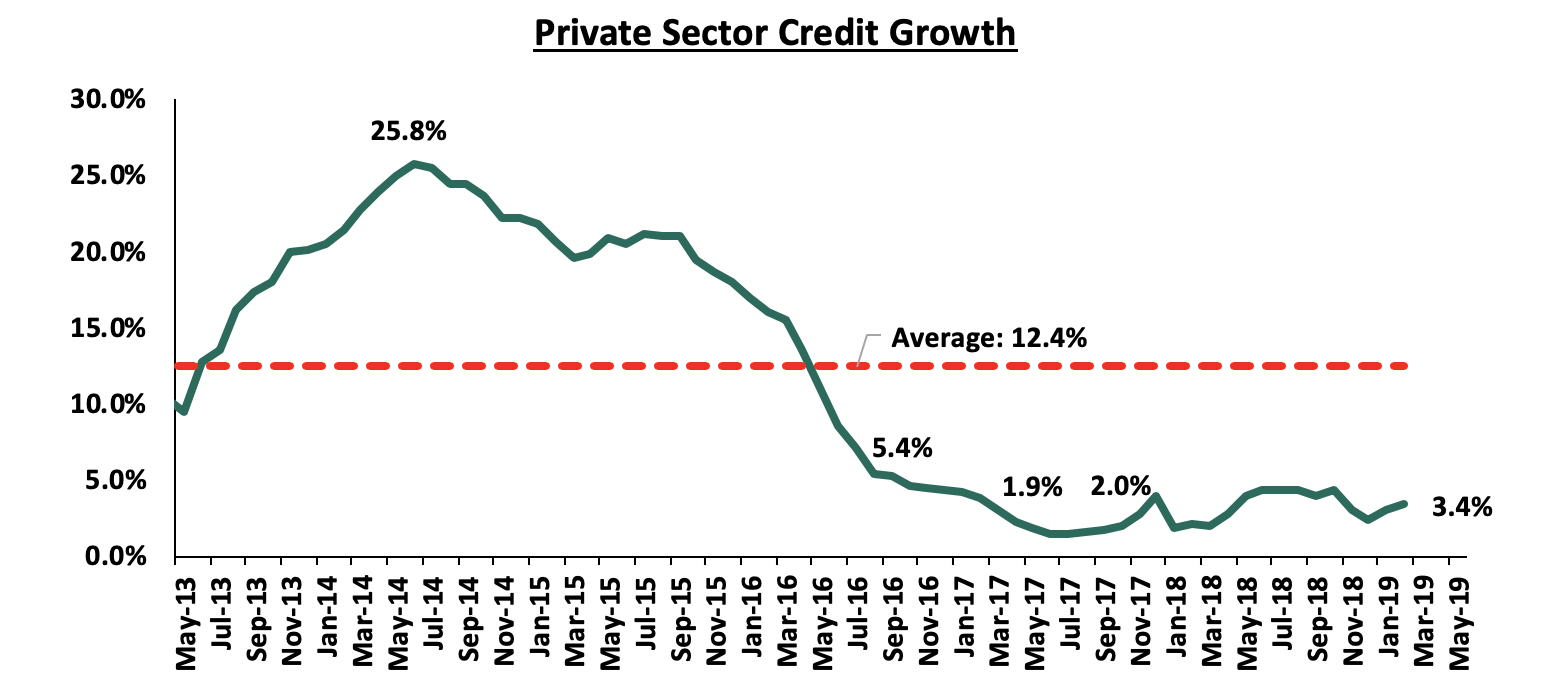
- The capping of interest rates, which has continued to subdue credit extension to the private sector. Instead, banks have been allocating even more of their deposits into government securities. The increased allocation to relatively lower yielding assets has consequently reduced the Net Interest Margin (NIM). Private sector credit growth has remained subdued, coming in at 2.4% in December 2018, and 3.4% as at February 2019, way below the 5-year average of 12.4%.
We maintain our view that the interest rate cap has not achieved its intended objectives of easing the access to credit and reducing the cost of credit. International Institutions such as the International Monetary Fund (IMF) have advocated for a repeal of the law, as it constricts credit extension to the economy, making it even harder for the MSMEs to conduct their business. We continue to be proponents of promoting competing sources of financing, which should reduce the overreliance on bank funding in the economy that is currently between 90.0% to 95.0% of all funding. By having various competing sources of financing, this would trigger a self- regulated pricing structure, in the event of a repeal of the law.
Thus, for 2019, we expect:
- A review of the Banking (Amendment) Act 2015, with the high court having suspended the law terming it as illegal, and a Member of Parliament proposing a revision of the law to include a ceiling of 6.0% above the limit set by the Banking (Amendment) Act, 2015 for the high risk borrowers, and 4.0% above the CBR for low risk borrowers,
- Relatively low credit extension. With the interest rate cap law remaining in place, we expect private sector credit growth to remain below 5.0%, as banks continue to skew their asset allocation to government securities that yield higher risk-adjusted returns,
- We also expect consolidation activity in the banking sector to continue, as the relatively tougher operating conditions make it even harder for the smaller undercapitalized banks to operate, especially those that do not serve a niche, which may see them getting acquired by the larger players who seek to grow their market share and product offerings.
We expect banks to focus on the following business aspects in 2019:
- Asset quality management: Banks will look to manage the deteriorating asset quality, which will lead to further tightening of credit standards as banks cherry pick low risk credit consumers and increase focus on secured, collateral-based lending,
- Revenue diversification: In the current regime of compressed interest margins, focus on Non-Funded Income (NFI) is likely to continue, as banks aim to grow transactional income via alternative channels such as agency banking, internet and mobile technologies,
- Operational efficiency: Cost containment is likely to continue being a focus area. We thus expect continued restructuring, possibly leading to staff layoffs, as banks take advantage of efficient alternative channels of distributions, and,
- Downside regulatory compliance risk management: With increased emphasis on anti-money laundering and fraudulent transactions, we expect banks to be keener on streamlining their operational processes and procedures in line with global standards and regulatory requirements.
For more information, see our Cytonn FY’2018 Banking Sector Review
Disclaimer: The views expressed in this publication are those of the writers where particulars are not warranted. This publication, which is in compliance with Section 2 of the Capital Markets Authority Act Cap 485A, is meant for general information only and is not a warranty, representation, advice or solicitation of any nature. Readers are advised in all circumstances to seek the advice of a registered investment advisor.

- Talk to us
- Kenya
- P.O Box 20695 - 00200, Nairobi, Kenya
- Cell +254709101200
- Tel +254709101200
- WhatsApp +254741676635
- United States
- +254709101200
- DOWNLOAD OUR APP
-


- Kenya
- 8th Floor, Pinetree Plaza, Kaburu Drive, Ngong Road, Nairobi, Kenya
- USA
- Suite 1150, 1775 Eye Street NW, USA, Washington DC 20006, USA
- Investments
- High Yield
- Private Equity
- Real Estate
- Real Estate
- RiverRun Estates
- Cytonn Towers
- The Ridge
- Taraji Heights
- The Alma