Kenya Retail Report 2020 & Cytonn Weekly #47/2020
By Cytonn Research Team, Nov 22, 2020
Executive Summary
Fixed Income
During the week, T-bills were oversubscribed, with the overall subscription rate coming in at 104.2% down from 126.6%, the previous week, mainly attributable to the concurrent primary bond auction, where there were two bonds re-opened namely, FXD2/2013/15 and FXD1/2018/20, which recorded a higher overall subscription rate of 140.0%.
During the week, the Energy and Petroleum Regulatory Authority (EPRA) released their monthly statement on the Maximum Retail Prices in Kenya for the period 15th November 2020 to 14th December 2020. The monthly petroleum prices decreased by 1.3%, 2.4% and 2.5%, respectively for petrol, diesel and kerosene all decreasing by respectively.
The Monetary Policy Committee (MPC) is set to meet on Thursday, 26th November 2020, to review the outcome of its previous policy decisions and recent economic developments, and to decide on the direction of the Central Bank Rate (CBR) which we expect them to maintain 7.0%;
Equities
During the week, the equities market was on a downward trajectory, with both the NASI and NSE 20 declining by 0.2% while NSE 25 declined by 0.8% respectively, taking their YTD performance to losses of 13.6%, 32.7% and 20.6%, for NASI, NSE 20 and NSE 25 respectively. The equities market performance was driven by losses recorded by Standard Chartered Bank, Equity Group, KCB Group and ABSA Bank which were down by 4.5%, 3.9%, 3.5%, and 3.2%, respectively. The losses were however mitigated by gains recorded by Bamburi, NCBA Group and Co-operative Bank which gained by 13.3%, 3.2% and 2.2%, respectively. The Insurance Regulatory Authority (IRA), recently released the Q2’2020 Insurance Industry Report highlighting that the industry’s gross premium income increased by 3.2% to Kshs 121.0 bn, from Kshs 117.3 bn recorded in Q2’2019. Additionally, during the week, ABSA Bank, Co-operative Bank and Standard Chartered Bank released their Q3’2020 financial results;
Real Estate
During the week, Kenya National Bureau of Statistics released the Leading Economic Indicators - September 2020, highlighting that the number of international arrivals rose by 4.5% from 13,919 in August 2020 to 20,164 in September 2020. In the residential sector, Centum Real Estate, through its project development arm, Two Rivers Development Limited, submitted regulatory filings to the National Environmental Management Authority (NEMA) seeking approval to begin construction of a residential development dubbed Mzizi Court at Two Rivers Mall along Limuru Road. The firm also floated a Kshs 4.0 bn housing bond to finance projects that would deliver more than 1,400 housing units to the market. Fairdeal Properties announced plans to develop a 229-unit residential project dubbed Fairvalley Heights, to be located in Gimu area, near CITAM Athi River in Mavoko at a cost of Kshs 500.0 mn. In the retail sector, Tuskys supermarket announced plans to shut half of its branches to be 25 in number, in an attempt to stay in operation while Naivas supermarket announced plans to open two outlets to be located at Lifestyle Mall in Nairobi CBD’s Monrovia Street and Rongai town. In listed real estate, Acorn Investment Management Limited was granted a Real Estate Investment Trust (REIT) manager license by the Capital Markets Authority (CMA) following the fulfilment of applicable regulations;
Focus of the Week
The 2020 period recorded subdued performance across the various real estate themes resulting from the tough operating environment as the economy grappled with effects of the Coronavirus pandemic. In the retail sector, performance declined recording average rental yields of 6.7%, 0.3% points lower than the 7.0% recorded in 2019. The subdued performance is largely attributed to: i) reduction in rental rates in a bid to attract tenants amid a tough economic environment which saw the rental rates in the sector post a 2.1% decline to Kshs 115.1 per SQFT in 2020, from Kshs 118.0 per SQFT in 2019, and, ii) reduced occupancy rates which declined by 0.7% points Y/Y from 77.3% in 2019 to 76.6% in 2020 attributable to reduced demand for physical retail space due to growing focus on e-commerce and scaling down of retailers in the wake of reduced revenue inflows. In this week’s topical, we will look at the Kenya retail sector performance by covering the overview of the Kenya Retail Sector in 2020, Kenya Retail Sector Performance Summary in 2020, Retail Space Demand Analysis, Retail Sector Investment Opportunity, and, Retail Sector Outlook.
- Weekly Rates:
-
- Cytonn Money Market Fund closed the week at a yield of 10.50%. To invest, just dial *809#;
- Cytonn High Yield Fund closed the week at a yield of 13.45% p.a. To invest, email us at sales@cytonn.com and to withdraw the interest you just dial *809#;
- For an exclusive tour of Cytonn’s real estate developments, visit: Sharp Investor's Tour and for more information, email us at sales@cytonn.com;
- We continue to offer Wealth Management Training daily, from 9:00 am to 11:00 am, through our Cytonn Foundation. The training aims to grow financial literacy among the general public. To register for any of our Wealth Management Training, click here;
- For Pension Scheme Trustees and members, we shall be having different industry player’s talk about matters affecting Pension Schemes and the pensions industry at large. Join us every Wednesday from 9:00 am to 11:00 am for in-depth discussions on matters pension;
- If interested in our Private Wealth Management Training for your employees or investment group, please get in touch with us through wmt@cytonn.com;
- For recent news about the company, see our news section here;
Money Markets, T-Bills & T-Bonds Primary Auction:
During the week, T-bills were oversubscribed, with the overall subscription rate coming in at 104.2% down from 126.6%, the previous week, mainly attributable to focus on the primary bond auction, where there were two bonds re-opened namely, FXD2/2013/15 and FXD1/2018/20, which recorded a higher overall subscription rate of 140.0%. The highest subscription rate was in the 91-day paper, which came in at 139.6%, down from 220.3% recorded the previous week. The subscription rate for the 364-day and 182-day papers both dropped to 129.3% and 65.0%, respectively, from 135.4% and 80.3% recorded the previous week. The yields on all the three papers, 91-day, 182-day and 364-day increased marginally by 3.2 bps, 3.8 bps and 5.2 bps to 6.7%, 7.2% and 8.1%. The acceptance rate declined slightly to 96.6% from 97.7%, recorded the previous week, with the government accepting bids worth Kshs 24.2 bn out of the Kshs 25.0 bn worth of bids received.
On the Primary bond market there was high demand for this month’s bond offers, with the overall subscription rate for the two bonds coming in at 140.0%, partly supported by the favorable liquidity in the market, and financial institutions bias towards the fixed income market in this period of economic uncertainty. The Central Bank of Kenya had re-opened 2 bonds the FXD2/2013/15 and FXD1/2018/20 with coupons of 12.0% and 13.2% and effective tenors of 7.5 years and 17.4 years, respectively. The government received bids worth Kshs 56.0 bn, higher than the Kshs 40.0 bn offered and accepted only Kshs 53.7 bn. Investors preferred the longer-term paper i.e. FXD1/2018/20, which received bids worth Kshs 28.9 bn, representing 51.2% of the total bids received. The weighted average rate of accepted bids for the two bonds came in at 11.4% and 13.3%, for FXD2/2013/15 and FXD1/2018/20, respectively. The government rejected high bids only accepting Kshs 53.7 bn out of the Kshs 56.0 bn worth of bids received, translating to an acceptance rate of 96.0%.
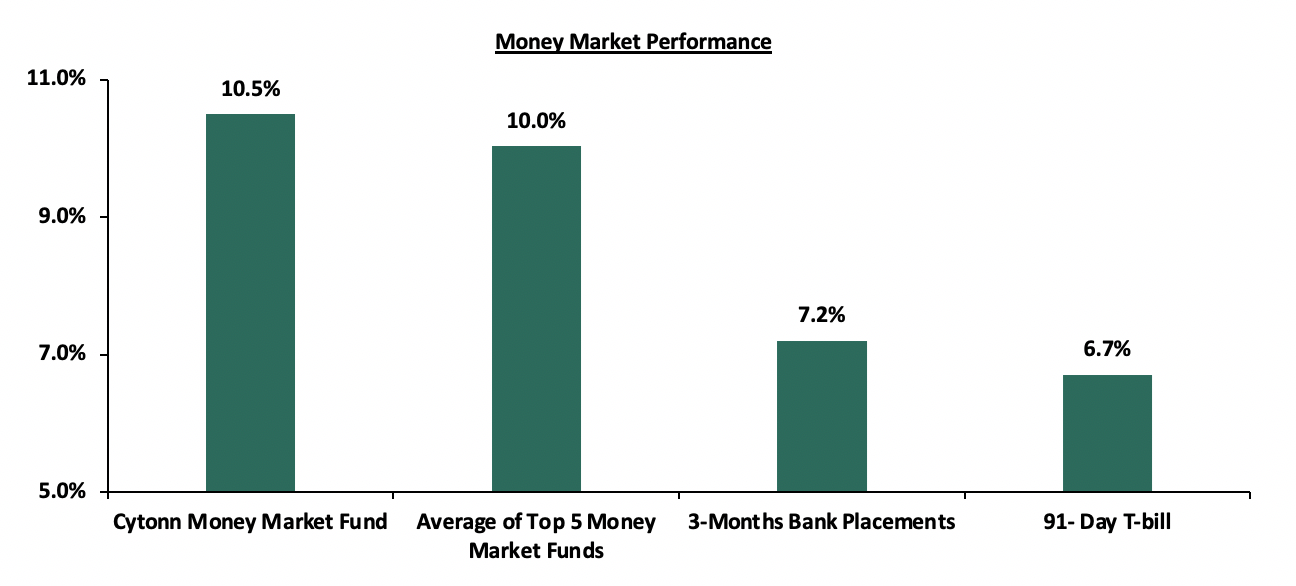
In the money markets, 3-month bank placements ended the week at 7.2% (based on what we have been offered by various banks), while the yield on the 91-day increased marginally by 3.2 bps to close at 6.7%. The average yield of the Top 5 Money Market Funds declined by 0.1% points to 10.0% from 10.1% recorded the previous week. The yield on the Cytonn Money Market Fund remained unchanged at 10.5%, similar to what was recorded the previous week.
Liquidity:
The money markets remained liquid during the week, with the average interbank rate increasing marginally by 0.2% points to 3.1%, from the 2.9% recorded the previous week. This was supported by government payments, which partly offset tax receipts. The average interbank volumes also declined by 42.0% to Kshs 4.7 bn from Kshs 8.2 bn, as recorded the previous week. According to the Central Bank of Kenya’s weekly bulletin released on 20th November 2020, commercial banks’ excess reserves came in at Kshs 8.2 bn in relation to the 4.3% Cash Reserve Ratio.
Kenya Eurobonds:
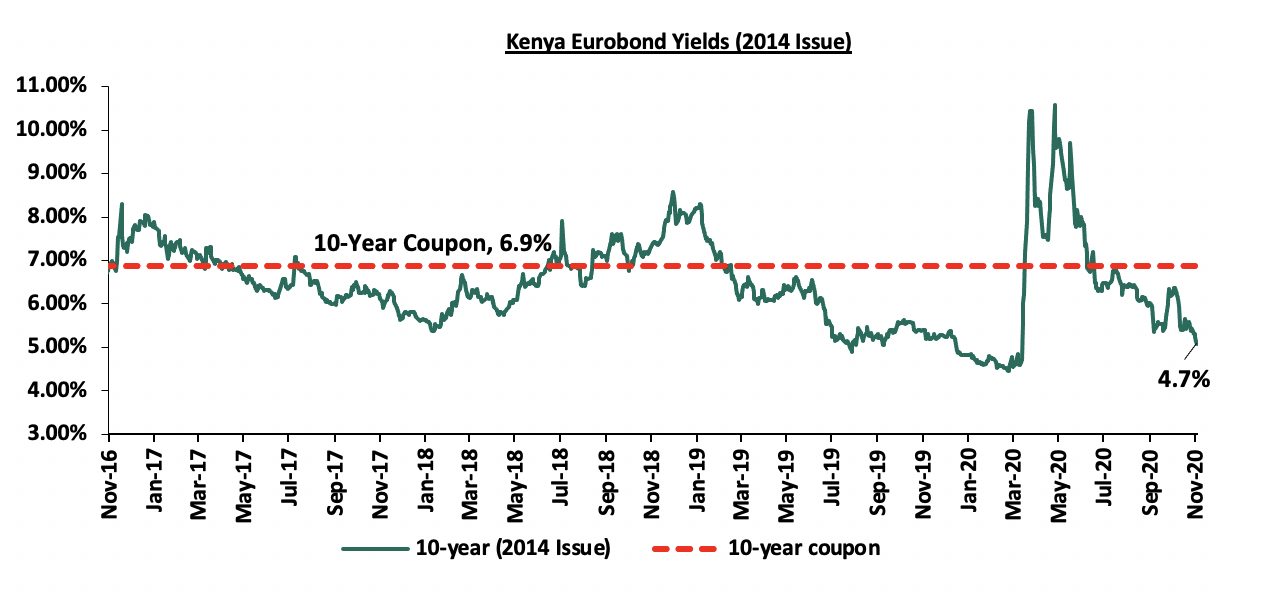
During the week, Kenyan Eurobonds recorded mixed performance with the yield on shorter-dated bond remaining unchanged, while the longer-dated bonds saw a declines in the yields. According to Reuters, the yield on the 10-year Eurobond issued in June 2014 remained unchanged closing the week at 4.7%, as was recorded the previous week.
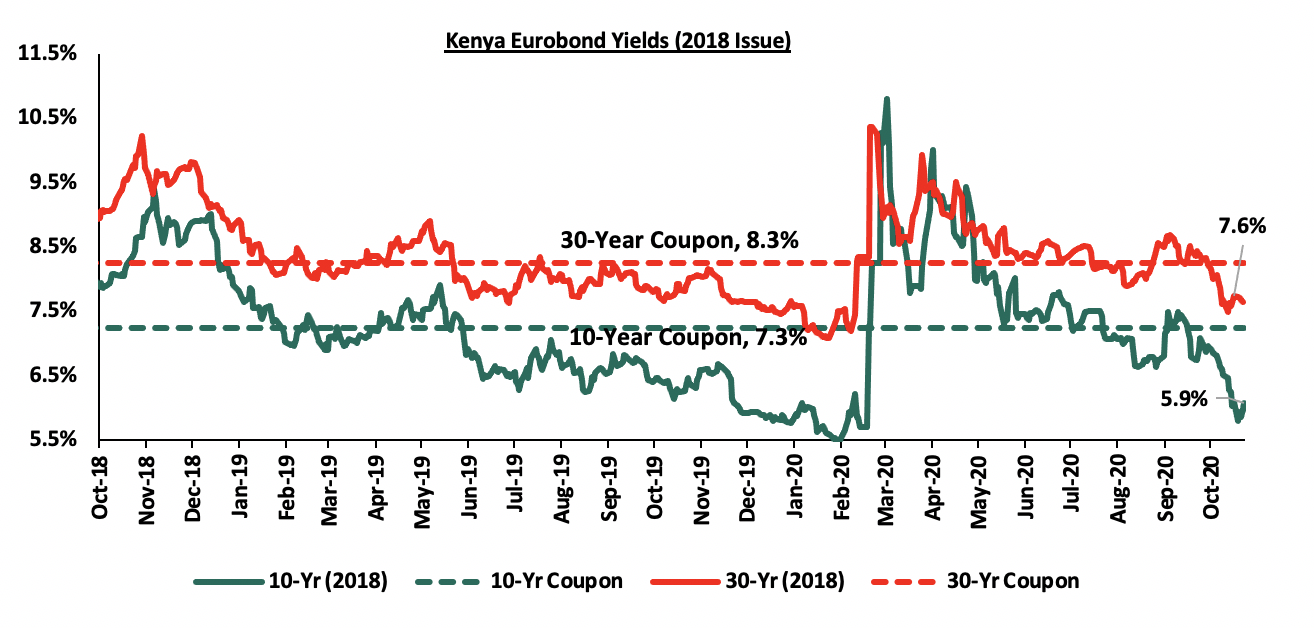
During the week, the yields on the 10-year and 30-year Eurobonds issued in 2018, on the other hand, declined by 0.2% points and 0.1% points to 5.9% and 7.6%, respectively, from 6.1% and 7.7% recorded previous week.
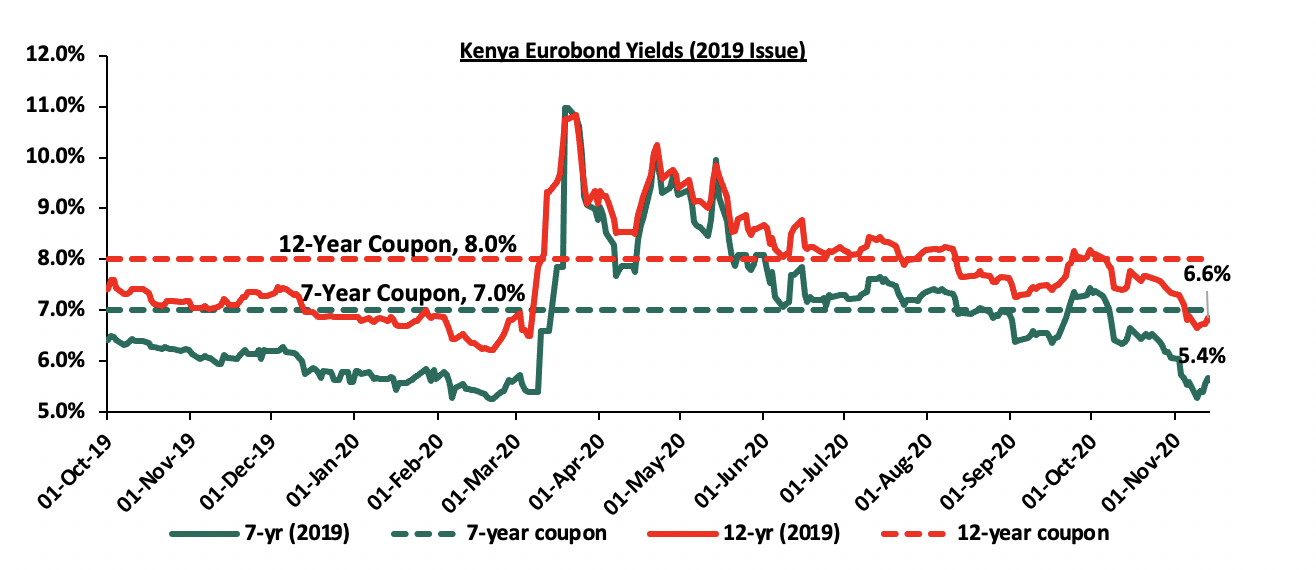
During the week, the yields on the 2019 dual-tranche Eurobonds increased, with the 7-year Eurobond and the 12-year Eurobond increasing by 0.3% points each to 5.4% and 6.6%, from 5.7% and 6.9% recorded last week.
Kenya Shilling:
During the week, the Kenyan shilling marginally depreciated against the US dollar by 0.3% to Kshs 109.4 from Kshs 109.1, mainly attributable to the persistent dollar demand from general goods importers and low inflows from sectors like tourism. On a YTD basis, the shilling has depreciated by 7.9% against the dollar, in comparison to the 0.5% appreciation in 2019. We expect continued pressures on the Kenyan shilling due to:
- Demand from merchandise and energy sector importers as they beef up their hard currency positions amid a slowdown in foreign dollar currency inflows, and,
- Continued uncertainty globally making people prefer holding dollars and other hard currencies.
However, in the short term, the shilling is expected to be supported by:
- The Forex reserves which are currently at USD 7.9 bn (equivalent to 4.9-months of import cover), which is above the statutory requirement of maintaining at least 4.0-months of import cover, and the EAC region’s convergence criteria of 4.5-months of import cover, and,
- The improving current account position which has seen a 39.9% decline during Q2’2020, coming in at Kshs 82.2 bn, from Kshs 136.9 bn in Q2’2019, equivalent to 7.0% of GDP from the 10.9% of GDP recorded in Q2’2019.
- Improving diaspora remittances evidenced by a 17.3% y/y increase to USD 263.1 mn in October 2020, from USD 224.3 mn recorded over the same period in 2019, has cushioned the shilling against further depreciation.
Weekly Highlight:
During the week, the Energy and Petroleum Regulatory Authority (EPRA) released their monthly statement on the Maximum Retail Prices in Kenya for the period 15th November 2020 to 14th December 2020. Below are the key take-outs from the statement:
- Petrol prices have declined by 1.3% to Kshs 105.9 per litre from Kshs 107.3 per litre previously, while diesel prices declined by 2.4% to Kshs 90.7 per litre from Kshs 92.9 per litre. Kerosene prices also declined by 2.5% to Kshs 81.6 per litre from Kshs 83.7 per litre.
- The changes in prices have been attributed to:
- A decline in the average landed cost of imported super petrol by 4.5% to USD 316.6 per cubic meter in October from USD 331.7 per cubic meter in September 2020 2020,
- Average landed costs for diesel decreased by 7.4% to USD 288.0 per cubic meter from USD 312.0 per cubic meter in September 2020,
- Landed costs for kerosene also decreased by 7.4% to USD 261.2 per cubic meter from USD 282.1 Per cubic meter in September 2020,
- A 5.2% decrease in Free on Board (FOB) price of Murban crude oil lifted in October 2020 to USD 40.2 per barrel, from USD 42.4 per barrel in September 2020,
- The Kenyan shilling depreciation by 0.5% against the dollar to close at Kshs 109.1 in October 2020, from Kshs 108.6 in September 2020.
We expect a slight decline, not only in the transport and fuel index, which carries a weighting of 8.7% in the total consumer price index (CPI), but also on the prices of other commodities such as food prices because of a trickle-down effect due to the lower cost of transport.
The Monetary Policy Committee (MPC) is set to meet on Thursday, 26th November 2020, to review the outcome of its previous policy decisions and recent economic developments, and to decide on the direction of the Central Bank Rate (CBR). In their previous meeting held on 29th September 2020, the committee decided to reconvene in November 2020, while highlighting that they would remain ready to reconvene earlier if necessary, as they continue to closely monitor the impact of the policy measures have had so far. Additionally, the MPC maintained the CBR at 7.0% citing that the accommodative policy stance adopted in March, April and May 2020 sittings was having the intended effects on the economy.
We expect the MPC to maintain the Central Bank Rate (CBR) at 7.0%, with their decision mainly being supported by:
- Stable inflation within the government’s target range of 2.5% -7.5% on account of the stable food prices being experienced in the country as a result of the favourable weather conditions,
- There is a lot of liquidity in the money market hence additional cuts are less likely to spur private sector growth given (a) the reduced economic activity in Kenya’s key sectors and (b) elevated credit risk resulting to a cautious lending stance by banks, with the possibility of heightened Non Performing Loans if the pandemic is to continue, and,
- Additional rate cuts could lead to a further depreciation of the Shilling thus reducing Kenya’s attractiveness as an investment destination.
For further analysis on the factors to be considered by the Monetary Policy Committee please see, MPC Note
Rates in the fixed income market have remained relatively stable due to the high liquidity in the money markets, coupled with the discipline by the Central Bank as they reject expensive bids. The government is 52.0% ahead of its prorated borrowing target of Kshs 187.0 bn having borrowed Kshs 284.3 bn. In our view, due to the current subdued economic performance brought about by the effects of the COVID-19 pandemic, the government will record a shortfall in revenue collection with the target having been set at Kshs 1.9 tn for FY’2020/2021 thus leading to a larger budget deficit than the projected 7.5% of GDP, ultimately creating uncertainty in the interest rate environment as additional borrowing from the domestic market may be required to plug the deficit. Owing to this uncertain environment, our view is that investors should be biased towards short-term to medium-term fixed income securities to reduce duration risk.
Market Performance
During the week, the equities market was on a downward trajectory, with both the NASI and NSE 20 declining by 0.2% while NSE 25 declined by 0.8% respectively, taking their YTD performance to losses of 13.6%, 32.7% and 20.6%, for NASI, NSE 20 and NSE 25 respectively. The equities market performance was driven by losses recorded by Standard Chartered Bank, Equity Group, KCB Group and ABSA Bank of 4.5%, 3.9%, 3.5%, and 3.2%, respectively. The losses were however mitigated by gains recorded by Bamburi, NCBA Group and Co-operative Bank of 13.3%, 3.2% and 2.2%, respectively.
Equities turnover increased by 4.9% during the week to USD 20.0 mn, from USD 19.0 mn recorded the previous week, taking the YTD turnover to USD 1.3 bn. Foreign investors turned net buyers during the week, with a net buying position of USD 0.2 mn, from a net selling position of USD 0.1 mn recorded the previous week, taking the YTD net selling position to USD 277.9 mn.
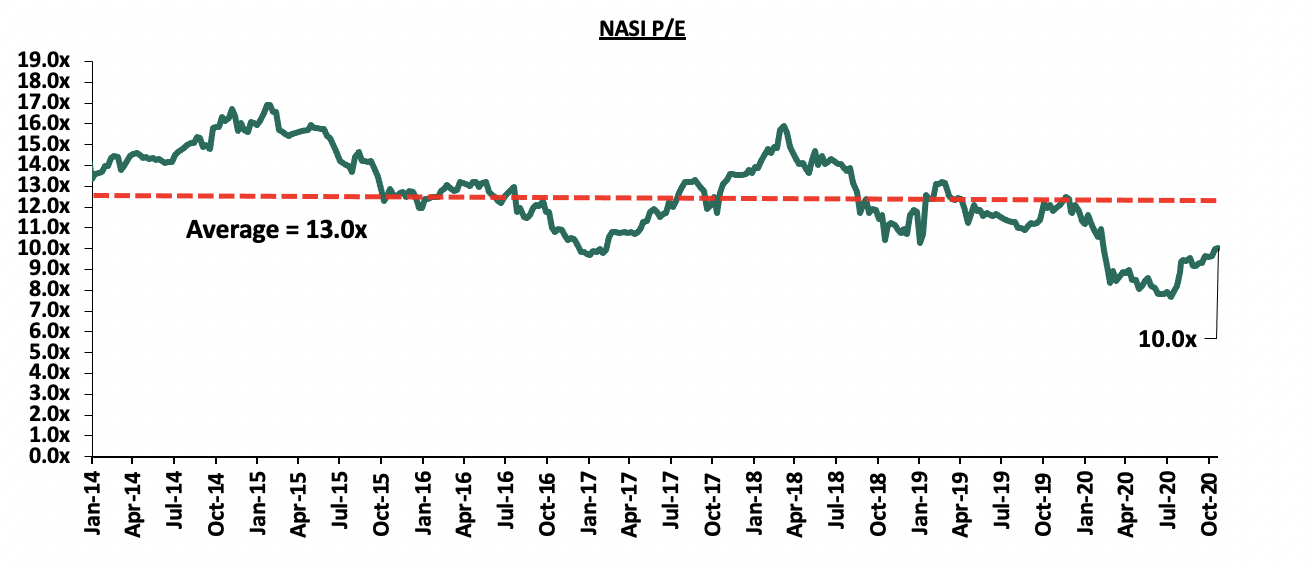
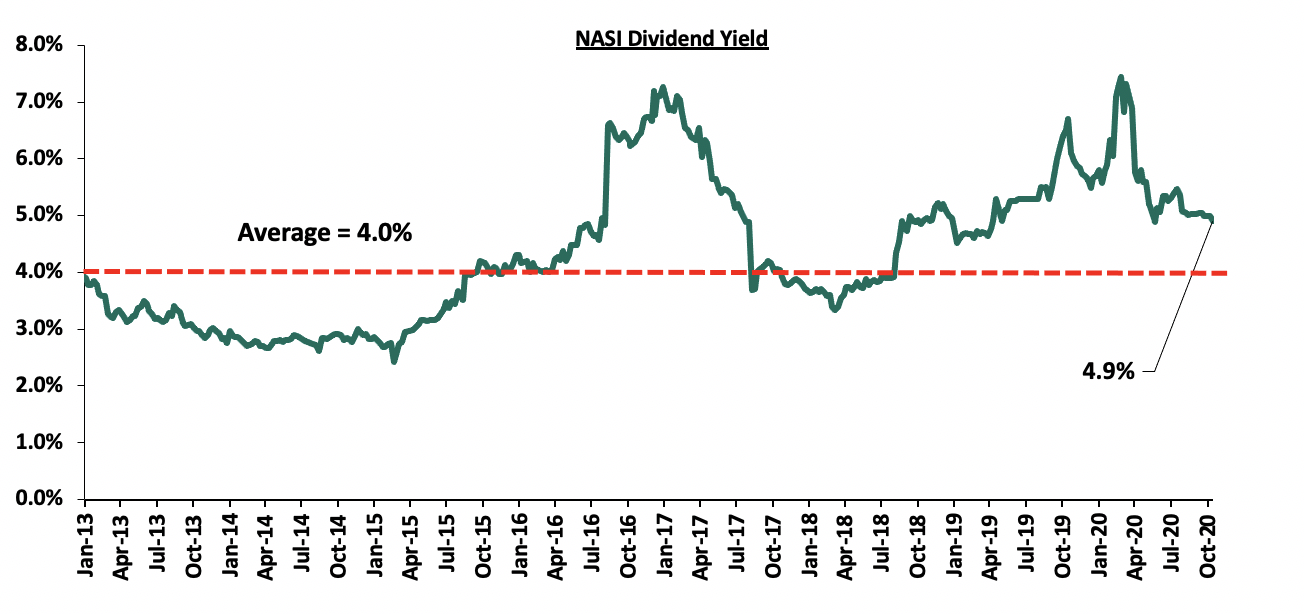
The market is currently trading at a price to earnings ratio (P/E) of 10.0x, 22.6% below the 11-year historical average of 13.0x. The average dividend yield is currently at 4.9%, unchanged from what was recorded the previous week, and 0.9% points above the historical average of 4.0%.
With the market trading at valuations below the historical average, we believe there are pockets of value in the market for investors with higher risk tolerance and are willing to wait out the pandemic. The current P/E valuation of 10.0x is 30.3% above the most recent valuation trough of 7.7x experienced in the first week of August 2020. The charts below indicate the historical P/E and dividend yields of the market.
Weekly Highlight
The Insurance Regulatory Authority (IRA), recently released the Q2’2020 Insurance Industry Report highlighting that the industry’s gross premium income increased by 3.2% to Kshs 121.0 bn, from Kshs 117.3 bn recorded in Q2’2019, with the general insurance business contributing 60.5% of the industry’s premium income, a 1.8% point decline from the 62.3% contribution witnessed in Q2’2019. The regulator noted that the COVID-19 pandemic had impacted the insurance sector mainly through reduced returns from the capital markets and the increase in insurance claims in the long term insurance business class.
Other key take-outs from the report include:
- Investment income declined by 46.2% to Kshs 12.4 bn in Q2’2020, from Kshs 23.0 bn recorded in Q2’2019 for long term insurance businesses, and declined by 26.7% for general insurance businesses to Kshs 4.4 bn from Kshs 6.0 bn. The declines can be attributed to increased investments in lower-yielding government securities by the sector, coupled with the fair value losses in equity investments following the increased volatility of the Equities Market,
- During the period under review, net claims for the long term insurance business increased by 12.6% to Kshs 30.6 bn, from Kshs 27.1 bn in Q2’2019, mainly driven by increased requests from individuals wishing to access their pension benefits given the reduction in their disposable income. This saw the loss ratio for the long term business rise to 68.9% from 66.1% recorded in Q2’2019, and,
- For the general insurance businesses, the loss ratio declined to 61.6% in Q2’2020 from 64.2% in Q2’2019 owing to the 2.6% decline in claims against a growth in gross premium income of 0.2%. Key to note, the 61.6% loss ratio for the quarter under review is the lowest in the last three years.
Given the effects emanating from the pandemic, we believe that the insurance sector’s penetration rate is set to be affected given the low demand for insurance products. Additionally, the reduction in the disposable income of some of the individuals coupled with the job losses will greatly affect the life insurance and pension products given that most individuals are struggling to sustain payment of their premiums. Despite the measures taken by the government to cushion individuals against the effects emanating from the pandemic, we believe that the industry’s loss ratio is set to increase in 2020 as more people file for claims while others use their contributions as collateral for loans.
Earnings Releases:
During the week, ABSA Bank, Co-operative Bank and Standard Chartered Bank released their Q3’2020 financial results. Below is a summary of their performance:
- Co-operative Bank of Kenya Ltd
|
Co-operative Bank Q3’2020 Key Highlights |
|||
|
Balance Sheet |
|||
|
Balance Sheet Items |
Q3’2019 (Kshs bn) |
Q3’2020 (Kshs bn) |
y/y change |
|
Government Securities |
94.6 |
142.3 |
50.5% |
|
Net Loans and Advances |
268.9 |
284.2 |
5.7% |
|
Total Assets |
440.8 |
510.9 |
15.9% |
|
Customer Deposits |
322.5 |
375.5 |
16.4% |
|
Deposits per Branch |
2.0 |
2.4 |
0.4% |
|
Total Liabilities |
365.4 |
427.3 |
16.9% |
|
Shareholders’ Funds |
73.9 |
82.0 |
10.9% |
|
Income Statement |
|||
|
Income Statement Items |
Q3’2019 (Kshs bn) |
Q3’2020 (Kshs bn) |
y/y change |
|
Net Interest Income |
21.2 |
23.6 |
11.7% |
|
Net non-Interest Income |
14.1 |
13.6 |
(3.5%) |
|
Total Operating income |
35.2 |
37.2 |
5.6% |
|
Loan Loss provision |
(2.1) |
(4.0) |
89.4% |
|
Total Operating expenses |
(19.8) |
(23.5) |
18.3% |
|
Profit before tax |
15.5 |
13.8 |
(10.5%) |
|
Profit after tax |
10.9 |
9.8 |
(10.2%) |
|
Core EPS |
1.6 |
1.4 |
(10.2%) |
|
Key Ratios |
|||
|
Ratios |
Q3’2019 |
Q3’2020 |
% point change |
|
Yield on Interest Earning Assets |
11.5% |
10.9% |
(0.6%) |
|
Cost of Funding |
2.6% |
2.2% |
(0.4%) |
|
Net Interest Margin |
8.1% |
8.0% |
(0.1%) |
|
Non-Performing Loans (NPL) Ratio |
10.5% |
13.2% |
2.7% |
|
NPL Coverage |
55.5% |
50.1% |
(5.4%) |
|
Cost to Income with LLP |
56.2% |
63.0% |
6.8% |
|
Loan to Deposit Ratio |
83.4% |
75.7% |
(7.7%) |
|
Cost to Income Without LLP |
50.2% |
52.2% |
2.0% |
|
Return on Average Assets |
3.1% |
2.7% |
(0.4%) |
|
Return on Average Equity |
18.4% |
16.4% |
(2.0%) |
|
Equity to Assets Ratio |
17.1% |
16.7% |
(0.4%) |
|
Capital Adequacy Ratios |
|||
|
Ratios |
Q3’2019 |
Q3’2020 |
% point change |
|
Core Capital/Total Liabilities |
20.0% |
19.0% |
(1.0%) |
|
Core Capital/Total Risk Weighted Assets |
15.4% |
16.3% |
0.9% |
|
Total Capital/Total Risk Weighted Assets |
15.7% |
16.8% |
1.1% |
Key take-outs from the earnings release include;
- Core earnings per share declined by 10.2% to Kshs 1.4 in Q3’2020, from Kshs 1.6 in Q3’2019, which was in-line with our projections. The performance was driven by an 18.3% increase in total operating expenses to Kshs 23.5 bn in Q3’2020 from Kshs 19.8 in Q3’2019 but was mitigated by the 5.6% increase in total operating income,
- Interest income rose by 7.1% to Kshs 32.6 bn in Q3’2020, from Kshs 30.4 bn in Q3’2019. The growth recorded was as a result of a 19.9% increase in interest income from government securities to Kshs 9.8 bn, from Kshs 8.2 bn in Q3’2019, as well as a 2.1% rise in interest income from loans and advances to Kshs 22.3 bn from Kshs 21.8 bn in Q3’2019,
- The Yield on Interest-Earning Assets (YIEA), however, declined to 10.9%, from 11.5% in Q3’2019 due to the faster 17.0% growth in the average interest-earning assets that outpaced the 7.7% growth in interest income,
- Interest expense declined by 3.5% to Kshs 8.9 bn in Q3’2020, from Kshs 9.2 bn in Q3’2019, largely due to a 3.0% decline in interest expense from customer deposits to Kshs 7.8 bn from Kshs 8.0 bn. Other interest expenses also declined by 5.3% to Kshs 1.1 bn from Kshs 1.2 bn in Q3’2019. Consequently, the cost of funds declined to 3.2%, from 3.6% in Q3’2019, owing to a 15.5% rise in interest-bearing liabilities, despite the 2.5% decline in interest expense,
- Total operating expenses rose by 18.3% to Kshs 23.5 bn in Q3’2020, from Kshs 19.8 bn in Q3’2019, largely driven by the 89.4% rise in Loan Loss Provisions (LLP) to Kshs 4.0 bn from Kshs 1.2 bn in Q3’2019, coupled with a 6.3% rise in staff costs to Kshs 9.7 bn in Q3’2020 from Kshs 9.1 bn in Q3’2019,
- The balance sheet recorded an expansion as total assets grew by 15.9% to Kshs 510.9 bn in Q3’2020 from Kshs 440.8 bn in Q3’2019, mainly attributable to the 50.5% growth in government securities to Kshs 142.3 bn from Kshs 94.6 bn, coupled with a 5.7% growth in net loans and advances to Kshs 284.2 bn in Q3’2020 from Kshs 268.9 bn in Q3’2019. Placements also rose by 11.9% to Kshs 27.2 bn in Q3’2020, from Kshs 24.3 bn,
- Total liabilities grew by 16.9% to Kshs 427.3 bn in Q3’2020 from Kshs 365.4 bn in Q3’2019 which was largely attributable to a 401.0% rise in placements to Kshs 6.9 bn in Q3’2020, from Kshs 1.4 bn, coupled with the 16.4% rise in customer deposits to Kshs 375.5 bn in Q3’2020 from Kshs 322.6 bn in Q3’2019. Borrowings declined by 12.0% to Kshs 26.2 bn from Kshs 29.7 bn in Q3’2019. Deposits per branch increased to Kshs 2.4 bn from Kshs 2.0 bn, as the number of branches remained unchanged at 159 branches,
- Gross Non-Performing Loans (NPLs) increased by 33.6% to Kshs 40.2 bn in Q3’2020, from Kshs 30.1 bn in Q3’2020. The NPL ratio deteriorated to 13.2% in Q3’2020, from 10.5% in Q3’2019 owing to slower growth in gross loans by 6.6% compared to the 33.6% growth in gross non-performing loans, and,
- NPL Coverage ratio dropped from 55.5% to 50.1%, which could suggest an under-provisioning. Had NPL Coverage remained at the 55.5% level recorded in Q3’2019, we would have had an additional provisioning of Kshs 2.2 bn, which would have reduced Earnings per Share (EPS) from the reported Kshs 1.4 to Kshs 1.1.
For a comprehensive analysis, please see our Cooperative Bank Kenya Q3’2020 Earnings Note
- Standard Chartered Bank
|
Standard Chartered Bank Q3’2020 Key Highlights |
|||
|
Balance Sheet |
|||
|
Balance Sheet Items |
Q3’2019 (Kshs bn) |
Q3’2020 (Kshs bn) |
y/y change |
|
Government Securities |
98.7 |
106.2 |
7.6% |
|
Net Loans and Advances |
118.5 |
131.7 |
11.1% |
|
Total Assets |
290.6 |
314.4 |
8.2% |
|
Customer Deposits |
224.8 |
242.8 |
8.0% |
|
Deposits per Branch |
6.7 |
7.3 |
8.0% |
|
Total Liabilities |
242.7 |
264.2 |
8.9% |
|
Shareholders’ Funds |
47.9 |
50.2 |
4.7% |
|
Income Statement |
|||
|
Income Statement Items |
Q3’2019 (Kshs bn) |
Q3’2020 (Kshs bn) |
y/y change |
|
Net Interest Income |
14.7 |
14.3 |
(2.4%) |
|
Net non-Interest Income |
7.0 |
6.3 |
(8.8%) |
|
Total Operating income |
21.6 |
20.7 |
(4.5%) |
|
Loan Loss provision |
0.7 |
2.7 |
274.2% |
|
Total Operating expenses |
12.5 |
14.1 |
12.9% |
|
Profit before tax |
9.1 |
6.6 |
(28.2%) |
|
Profit after tax |
6.2 |
4.3 |
(30.4%) |
|
Core EPS |
16.5 |
11.5 |
(30.4%) |
|
Key Ratios |
|||
|
Ratios |
Q3’2019 |
Q3’2020 |
% point change |
|
Yield on Interest Earning Assets |
9.9% |
8.9% |
(1.0%) |
|
Cost of Funding |
3.0% |
2.1% |
(0.9%) |
|
Net Interest Margin |
7.5% |
7.0% |
(0.5%) |
|
Non-Performing Loans (NPL) Ratio |
14.9% |
14.8% |
(0.1%) |
|
NPL Coverage |
77.0% |
78.2% |
1.2% |
|
Cost to Income with LLP |
57.7% |
68.2% |
10.5% |
|
Loan to Deposit Ratio |
52.7% |
54.2% |
1.5% |
|
Cost to Income Without LLP |
54.4% |
55.0% |
0.6% |
|
Return on Average Assets |
2.8% |
2.1% |
(0.7%) |
|
Return on Average Equity |
16.9% |
12.9% |
(4.0%) |
|
Equity to Assets Ratio |
16.3% |
16.2% |
(0.1%) |
|
Capital Adequacy Ratios |
|||
|
Ratios |
Q3’2019 |
Q3’2020 |
% point change |
|
Core Capital/Total Liabilities |
15.8% |
16.7% |
0.9% |
|
Core Capital/Total Risk Weighted Assets |
15.7% |
16.1% |
0.4% |
|
Total Capital/Total Risk Weighted Assets |
18.9% |
18.7% |
(0.2%) |
Key take-outs from the earnings release include;
- Core earnings per share declined by 30.4% to Kshs 11.5, from Kshs 16.5 in Q3’2019, driven by a 12.9% growth in total operating expenses to Kshs 14.1 bn, from Kshs 12.5 bn in Q3’2019, coupled with the 4.5% decline in total operating income to Kshs 20.7 bn, from Kshs 21.6 bn in Q3’2019. The decline in core earnings per share was not in line with our expectations of a 21.8% decline, with the variance being attributable to the 274.2% rise Loan Loss Provisions to Kshs 2.7 bn, from Kshs 0.7 bn in Q3’2019, against our expectations of a 160.1% increase,
- Interest income declined by 5.8% to Kshs 17.9 bn, from Kshs 19.1 bn in Q3’2019. This was driven by a 10.7% decline in interest income from government securities to Kshs 7.2 bn from Kshs 8.1 bn in Q3’2019, coupled with a 6.8% decline in interest income on loans and advances to Kshs 9.4 bn, from Kshs 10.1 bn in Q3’2019. The interest income from deposits and placements increased by 30.5% to Kshs 1.0 bn, from Kshs 0.8 bn helping to cushion the declines in interest income from loans and advances and government securities,
- Yield on interest-earning assets (YIEA) declined to 8.9% from 9.9% in Q3’2019, attributable to the 5.6% decline in interest income, which was despite a 5.4% y/y growth in average interest-earning assets to Kshs 272.3 bn, from Kshs 258.2 bn in Q3’2019,
- Interest expense declined by 17.3% to Kshs 3.6 bn, from Kshs 4.4 bn in Q3’2019, following a 15.2% decline in interest expense on customer deposits to Kshs 3.3 bn from Kshs 3.9 bn in Q3’2019 which may be attributed to bank possibly dropping costly deposits during the period and a 43.5% decline in other interest expenses to Kshs 0.3 bn from Kshs 0.4 bn in Q3’2019. The interest expenses on deposits and placements increased by 130.8% to cushion the declines. Cost of funds, on the other hand, declined to 2.1%, from 3.0% in Q3’2019, owing to a 17.3% decline in interest expense, despite a 13.6% growth in average interest-bearing liabilities,
- Net Interest Margin (NIM) declined to 7.0% from 7.5% in Q3’2019, owing to a 2.4% decline in Net Interest Income (NII), despite a 5.4% growth in average interest-earning assets,
- Total operating expenses grew by 12.9% to Kshs 14.1 bn, from Kshs 12.5 bn, largely driven by 274.2% rise in Loan Loss Provisions (LLP) to Kshs 2.7 bn in Q3’2020, from Kshs 0.7 bn in Q3’2019 on account of the poor operating environment brought about by COVID-19. Staff costs, on the other hand, recorded a 2.5% decline to Kshs 5.4 bn from Kshs 5.6 bn in Q3’2019,
- The balance sheet recorded an expansion as total assets grew by 8.2% to Kshs 314.4 bn, from Kshs 290.6 bn in Q3’2019. This growth was largely driven by an 11.1% growth recorded in the loan book to Kshs 131.7 bn, from Kshs 118.5 bn in Q3’2019, coupled with a 12.0% increase in placements from banking institutions to Kshs 46.6 bn in Q3’2020, from Kshs 41.6 bn in Q3’2019. Investment in government and other securities increased by 7.6% to Kshs 106.2 bn, from Kshs 98.7 bn in Q3’2019,
- Total liabilities rose by 8.9% to Kshs 264.2 bn, from Kshs 242.7 bn in Q3’2019, driven by an 8.0% increase in customer deposits to Kshs 242.8 bn, from Kshs 224.8 bn in Q3’2019, coupled with a 260.8% increase in the placements held to Kshs 2.0 bn, from Kshs 0.6 bn in Q3’2019. Deposits per branch rose by 8.0% to Kshs 7.3 bn from Kshs 6.7 bn in Q3’2019 with the number of branches at 36,
- Gross Non-Performing Loans (NPLs) increased by 10.3% to Kshs 22.0 bn in Q3’2020, from Kshs 19.9 bn in Q3’2019. The NPL ratio, however improved marginally to 14.8%, from 14.9% in Q3’2019, attributable to the faster 11.2% growth in gross loans, which outpaced the 10.3% growth in Gross Non-Performing Loans (NPLs), and,
- NPL Coverage ratio increased to 78.2% in Q3’2020, from 77.0% in Q3’2019, which could suggest sufficient provisioning.
For a comprehensive analysis, please see our SCBK Q3’2020 Earnings Note.
- ABSA Bank Kenya
|
ABSA Bank Q3’2020 Key Highlights |
|||
|
Balance Sheet |
|||
|
Balance Sheet Items |
Q3’2019 (Kshs bn) |
Q3’2020 (Kshs bn) |
y/y change |
|
Government Securities |
118.5 |
134.0 |
13.1% |
|
Net Loans and Advances |
194.2 |
209.2 |
7.8% |
|
Total Assets |
359.8 |
387.9 |
7.8% |
|
Customer Deposits |
235.4 |
246.6 |
4.7% |
|
Deposits per Branch |
2.7 |
2.9 |
9.7% |
|
Total Liabilities |
315.8 |
343.2 |
8.7% |
|
Shareholders’ Funds |
44.0 |
44.6 |
1.4% |
|
Income Statement |
|||
|
Income Statement Items |
Q3’2019 (Kshs bn) |
Q3’2020 (Kshs bn) |
y/y change |
|
Net Interest Income |
16.8 |
17.1 |
1.6% |
|
Net non-Interest Income |
8.0 |
8.3 |
4.5% |
|
Total Operating income |
24.8 |
25.4 |
2.5% |
|
Loan Loss provision |
(3.1) |
(7.6) |
146.7% |
|
Total Operating expenses |
(15.7) |
(20.1) |
27.9% |
|
Profit before tax |
8.2 |
3.4 |
(58.6%) |
|
Profit after tax |
5.6 |
1.9 |
(65.4%) |
|
Core EPS |
1.0 |
0.4 |
(65.4%) |
|
Key Ratios |
|||
|
Ratios |
Q3’2019 |
Q3’2020 |
% point change |
|
Yield on Interest Earning Assets |
10.7% |
9.5% |
(1.2%) |
|
Cost of Funding |
3.4% |
3.2% |
(0.2%) |
|
Net Interest Margin |
7.9% |
7.1% |
(0.8%) |
|
Non-Performing Loans (NPL) Ratio |
6.8% |
7.6% |
0.8% |
|
NPL Coverage |
78.6% |
64.9% |
(13.7%) |
|
Cost to Income with LLP |
63.3% |
79.0% |
15.7% |
|
Loan to Deposit Ratio |
82.5% |
84.9% |
2.4% |
|
Cost to Income Without LLP |
50.9% |
49.1% |
(1.8%) |
|
Return on Average Assets |
2.4% |
1.0% |
(1.4%) |
|
Return on Average Equity |
17.4% |
15.2% |
(2.2%) |
|
Equity to Assets Ratio |
14.1% |
11.9% |
(2.2%) |
|
Capital Adequacy Ratios |
|||
|
Ratios |
Q3’2019 |
Q3’2020 |
% point change |
|
Core Capital/Total Liabilities |
16.7% |
16.6% |
(0.1%) |
|
Core Capital/Total Risk Weighted Assets |
14.2% |
13.7% |
(0.5%) |
|
Total Capital/Total Risk Weighted Assets |
16.1% |
16.5% |
0.4% |
Key take-outs from the earnings release include;
- Core earnings per share declined by 65.4% to Kshs 0.4, from Kshs 1.0 in Q3’2019, not in line with our expectation of a 32.8% decline to Kshs 0.7. The performance was driven by a 27.9% increase in total operating expenses, which grew faster than the 2.5% growth in total operating income. The variance in core earnings per share growth against our expectations was largely due to the 146.7% increase in Loan Loss Provisions to Kshs 7.6 bn, from Kshs 3.1 bn in Q3’2019, against our expectation of a 111.3% increase to Kshs 6.5 bn,
- Interest income rose by 1.4% to Kshs 23.2 bn, from Kshs 22.9 bn in Q3’2019. This was driven by a 9.6% growth in interest income from government securities to Kshs 6.7 bn, from Kshs 6.1 bn in Q3’2019. The increased was however weighed down by a 0.8% decline in Interest income from Loans and Advances to Kshs 16.4 bn from Kshs 16.5 bn in Q3’2019, as well as a 46.7% decline in interest income from placements to Kshs 0.2 bn from Kshs 0.3 bn in Q3’2019,
- Yield on interest-earning assets (YIEA) declined to 9.5%, from 10.7% in Q3’2019, attributed to the faster 16.6% y/y increase in average interest earning assets to Kshs 331.4 bn, from Kshs 284.2 bn in Q3’2019, that outpaced the slower 3.5% growth in trailing interest income,
- Interest expenses increased by 0.8% to Kshs 6.11 bn, from Kshs 6.06 bn in Q3’2019, following a 25.6% rise in placement liabilities to Kshs 1.2 bn from Kshs 0.9 bn in Q3’2019. The rise was however mitigated by a 4.4% decline in interest expense on customer deposits to Kshs 4.8 bn, from Kshs 5.0 bn in Q3’2019. Cost of funds, on the other hand, declined marginally by 0.2% points to 3.2%, from 3.4% in Q3’2019, owing to the faster 7.6% growth in average interest bearing liabilities, despite a 0.8% decline in trailing interest expense,
- Net Interest Margin (NIM) on the other hand declined to 7.1%, from 7.9% in Q3’2019, owing to the faster 16.6% growth in average interest earning assets which outpaced the 1.6% growth in Net Interest Income (NII),
- Total operating expenses rose by 27.9% to Kshs 20.1 bn, from Kshs 15.7 bn in Q3’2019, largely driven by a 146.7% increase in Loan Loss Provisions (LLP) to Kshs 7.6 bn in Q3’2020, from Kshs 3.1 bn in Q3’2019, coupled with a 1.9% increase in staff costs to Kshs 7.5 bn in Q3’2020, from Kshs 7.3 bn in Q3’2019. The increased provisions is attributed to the bank adopting a cautious stance on the back of the expectations of increase in defaults due to the subdued operating environment. The rise in operating expenses was however mitigated by a 5.2% decline in other operating expense to Kshs 5.0 bn from Kshs 5.3 bn in Q3’2019,
- The balance sheet recorded an expansion as total assets rose by 7.8% to Kshs 387.9 bn, from Kshs 359.8 bn in Q3’2019. This growth was largely driven by a 13.1% increase in government securities to Kshs 134.0 bn, from Kshs 118.5 bn in Q3’2019, coupled with an 7.8% growth in the loan book to Kshs 209.2 bn, from Kshs 194.2 bn in Q3’2019,
- Total liabilities rose by 8.7% to Kshs 343.2 bn, from Kshs 315.8 bn in Q3’2019, driven by a 4.7% increase in customer deposits to Kshs 246.6 bn, from Kshs 235.4 bn in Q3’2019, coupled with an 11.3% increase in other liabilities Kshs 85.6 mn, from Kshs 77.0 mn in Q3’2019. The growth in liabilities was weighted down by a 225.8% growth in placement liabilities to Kshs 11.1 bn, from Kshs 3.4 bn in Q3’2019. Deposits per branch increased by 9.7% to Kshs 2.9 bn, from Kshs 2.7 bn in Q3’2019, with the number of branches having reduced to 84 in Q3’2020, from 88 in Q3’2019,
- Gross Non-Performing Loans (NPLs) increased by 20.8% to Kshs 16.8 bn in Q3’2020, from Kshs 13.9 bn in Q3’2019. The NPL ratio thus deteriorated to 7.6% in Q3’2020, from 6.8% in Q3’2019, owing to the faster 20.8% growth in gross NPLs, which outpaced the 7.3% growth in gross loans (after adding back interest suspense), and,
- NPL Coverage ratio dropped to 64.9% in Q3’2020, from 78.6% recorded in Q3’2019 which could suggest an under-provisioning. Had NPL Coverage remained at the 78.6%% level recorded in Q3’2019, we would have had an additional provisioning of Kshs 2.3 bn, which would have reduced Earnings per Share (EPS) from the reported Kshs 0.4 to Kshs (0.1).
For a comprehensive analysis, please see our ABSA Bank Kenya Q3’2020 Earnings Note
The table below highlights the performance of the banks that have released so far, showing the performance using several metrics, and the key take-outs of the performance.
|
Bank |
Core EPS Growth |
Interest Income Growth |
Interest Expense Growth |
Net Interest Income Growth |
Net Interest Margin |
Non-Funded Income Growth |
NFI to Total Operating Income |
Growth in Total Fees & Commissions |
Deposit Growth |
Growth in Government Securities |
Loan to Deposit Ratio |
Loan Growth |
Return on Average Equity |
|
ABSA |
(65.4%) |
1.4% |
0.8% |
1.6% |
7.1% |
4.5% |
32.7% |
(10.7%) |
4.7% |
13.1% |
84.9% |
7.8% |
15.2% |
|
KCB |
(43.2%) |
23.0% |
20.8% |
23.7% |
7.8% |
1.5% |
30.8% |
(14.2%) |
31.7% |
83.9% |
74.7% |
18.7% |
13.1% |
|
SCBK |
(30.4%) |
(5.8%) |
(17.3%) |
(2.4%) |
7.0% |
(8.8%) |
31.1% |
(9.7%) |
8.0% |
7.6% |
54.2% |
11.2% |
12.9% |
|
Equity |
(13.9%) |
21.7% |
21.6% |
21.8% |
7.6% |
10.1% |
38.7% |
(1.3%) |
44.5% |
37.2% |
65.7% |
30.1% |
16.9% |
|
CO-OP |
(10.2%) |
7.1% |
(3.5%) |
11.7% |
8.0% |
(3.5%) |
36.5% |
(31.7%) |
16.4% |
50.5% |
75.7% |
5.7% |
16.4% |
|
Q3'20 Mkt Weighted Average* |
(29.7%) |
13.8% |
10.0% |
15.2% |
7.6% |
2.5% |
34.5% |
(12.0%) |
27.1% |
45.7% |
70.8% |
17.9% |
15.1% |
|
Q3'19Mkt Weighted Average** |
8.7% |
4.5% |
4.3% |
4.9% |
7.7% |
15.8% |
37.9% |
22.6% |
11.0% |
3.3% |
75.7% |
11.6% |
19.3% |
|
*Market-cap-weighted as at 20/11/2020 |
|||||||||||||
|
**Market-cap-weighted as at 29/11/2019 |
|||||||||||||
Key takeaways from the table above include:
- For the Five banks they have recorded a (29.7%) weighted average decline in core Earnings Per Share (EPS), compared to a weighted average growth of 8.7% in Q3’2019 for the entire listed banking sector,
- They have recorded a weighted average deposit growth of 27.1%, faster than the 11.0% growth recorded in Q3’2019.
- Interest expense, on the other hand, grew faster by 10.0%, compared to 4.3% in Q3’2019. Cost of funds, however, declined, coming in at a weighted average of 2.7% in Q3’2020, from 3.2% in Q3’2019, owing to the faster growth in average interest-bearing liabilities, an indication that the listed banks were able to mobilize cheaper deposits,
- Average loan growth came in at 17.9%, faster than the 11.6% recorded in Q3’2019, but slower than the 45.7% growth in government securities, an indication of the banks preference of investing in Government securities as opposed to lending,
- Interest income rose by 13.8%, compared to a growth of 4.5% recorded in Q3’2019. The faster growth in interest income may be attributable to the increased allocation to government securities. Despite the rise in interest income, the Yield on Interest Earning Assets (YIEA) declined to 10.1% from the 10.5% recorded in Q3’2019, an indication of the increased allocation to lower-yielding government securities by the sector. The decline in the YIEA can also be attributed to the reduced lending rates for customers by the sector, in line with the Central Bank Rate cuts. Consequently, the Net Interest Margin (NIM) now stands at 7.6%, 0.1% points lower than the 7.7% recorded in Q3’2019 for the whole listed banking sector, and,
- Non-Funded Income grew by 2.5% y/y, slower than 15.8% growth recorded in Q3’2019. The performance in NFI was on the back of declined growth in fees and commission of (12.0%), which was slower than the 22.6% growth recorded in Q3’2019. The poor performance of the growth in fees and commission can be attributed to the waiver on fees on mobile transactions below Kshs 1,000 and the free bank-mobile money transfer. Banks with a large customer base who rely heavily on mobile money transactions are likely to take the biggest hit.
Universe of Coverage:
|
Company |
Price at 13/11/2020 |
Price at 20/11/2020 |
w/w change |
YTD Change |
Year Open |
Target Price* |
Dividend Yield |
Upside/ Downside** |
P/TBv Multiple |
Recommendation |
|
Kenya Reinsurance |
2.2 |
2.1 |
(2.3%) |
(30.0%) |
3.0 |
4.0 |
5.2% |
93.9% |
0.2x |
Buy |
|
Diamond Trust Bank*** |
63.0 |
63.3 |
0.4% |
(42.0%) |
109.0 |
119.4 |
4.3% |
93.0% |
0.3x |
Buy |
|
Sanlam |
12.0 |
11.6 |
(3.3%) |
(32.6%) |
17.2 |
18.4 |
0.0% |
58.6% |
1.2x |
Buy |
|
Standard Chartered*** |
156.3 |
149.3 |
(4.5%) |
(26.3%) |
202.5 |
197.2 |
8.4% |
40.5% |
1.2x |
Buy |
|
KCB Group*** |
37.5 |
36.2 |
(3.5%) |
(33.0%) |
54.0 |
46.4 |
9.7% |
37.8% |
0.8x |
Buy |
|
I&M Holdings*** |
43.7 |
45.0 |
3.0% |
(16.7%) |
54.0 |
57.8 |
5.7% |
34.1% |
0.7x |
Buy |
|
NCBA*** |
22.0 |
22.7 |
3.2% |
(38.4%) |
36.9 |
30.7 |
1.1% |
36.3% |
0.6x |
Buy |
|
HF Group |
3.5 |
3.2 |
(8.1%) |
(50.9%) |
6.5 |
4.1 |
0.0% |
29.3% |
0.2x |
Buy |
|
Liberty Holdings |
7.2 |
7.5 |
3.6% |
(27.5%) |
10.4 |
9.8 |
0.0% |
30.7% |
0.6x |
Buy |
|
Co-op Bank*** |
11.4 |
11.7 |
2.2% |
(28.7%) |
16.4 |
14.2 |
8.6% |
30.5% |
0.8x |
Buy |
|
Equity Group*** |
36.8 |
35.4 |
(3.9%) |
(33.9%) |
53.5 |
44.5 |
5.7% |
31.5% |
0.9x |
Buy |
|
ABSA Bank*** |
9.9 |
9.6 |
(3.2%) |
(28.2%) |
13.4 |
10.8 |
11.5% |
24.2% |
1.2x |
Buy |
|
Jubilee Holdings |
270.0 |
266.0 |
(1.5%) |
(24.2%) |
351.0 |
313.8 |
3.4% |
21.3% |
0.5x |
Buy |
|
Britam |
7.6 |
7.5 |
(1.6%) |
(16.9%) |
9.0 |
8.6 |
3.3% |
18.3% |
0.8x |
Accumulate |
|
Stanbic Holdings |
80.0 |
83.0 |
3.8% |
(24.0%) |
109.3 |
84.9 |
8.5% |
10.8% |
0.6x |
Accumulate |
|
CIC Group |
2.1 |
2.1 |
0.5% |
(22.8%) |
2.7 |
2.1 |
0.0% |
1.4% |
0.7x |
Lighten |
|
*Target Price as per Cytonn Analyst estimates as at H1’2020. We are currently reviewing our target prices for the Banking Sector coverage **Upside/ (Downside) is adjusted for Dividend Yield ***For Disclosure, these are banks in which Cytonn and/ or its affiliates are invested in |
||||||||||
We are “Neutral” on equities for investors because, despite the sustained price declines, which have seen the market P/E decline to below its historical average presenting investors with attractive valuations in the market. The economic outlook remains grim.
- Industry Reports
During the week, Kenya National Bureau of Statistics (KNBS) released the Leading Economic Indicators - September 2020. The key take-outs were as follows:
- The total number of international arrivals through Jomo Kenyatta International Airport (JKIA) and Moi International Airport (MIA) increased from 13,919 persons in August 2020 to 20,164 persons in September 2020. This is an indication of gradual recovery of the tourism industry which will boost the hospitality sector. The sector recovery is largely supported by government strategies such as the Ministry of Tourism post-corona recovery funds aimed at offering financial aid to hotel and other establishments in the hospitality industry through the Tourism Finance Corporation (TFC), repackaging of the tourism sector products to appeal to domestic tourists, relaxation of travel advisories and reopening of Kenya’s key tourism markets.
The graph below shows the number of international arrivals in Kenya in the last five years;
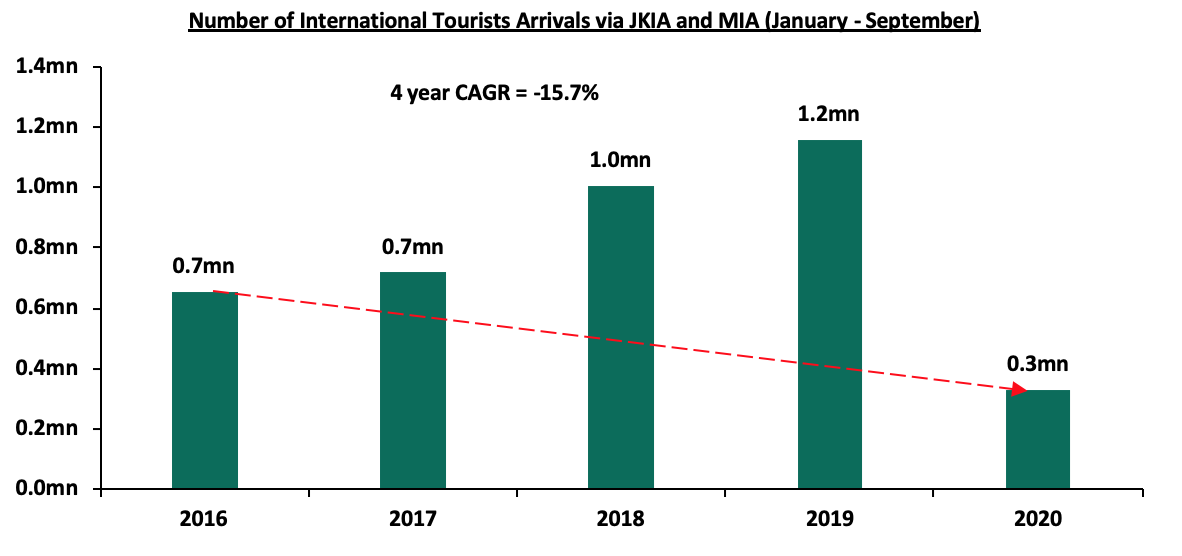
Source: Kenya National Bureau of Statistics (KNBS)
- Consumption of cement rose by 2.2% from 594,028 metric tonnes in July 2020 to 607,383 metric tonnes in August 2020. This is attributed to an increase in the value of building approvals from 6.0 bn in May 2020 to 7.2 bn in August 2020 with no approvals made in June and July following Covid-19 lockdown restrictions.
Given the above statistics, we expect to the real estate sector to record activities mainly on the hospitality front supported by gradual recovery of the tourism industry. In addition, we expect the reopening of the economy and government offices such as the National Lands Commission to facilitate the issuing of building approvals, which will result in continued increase in development activities within the sector.
- Residential Sector
During the week, Centum Real Estate, through its project development arm, Two Rivers Development Limited, submitted regulatory filings to the National Environmental Management Authority seeking approval to begin construction of a residential development dubbed Mzizi Court in Two Rivers. The development will sit on approximately 6.7 acres bordering the on-going River Bank housing project, and will comprise of approximately 1,650 one, two and three-bedroom (with domestic servant quarters) units (details of the prices and unit sizes remain undisclosed). Some of the other affordable ongoing housing projects by Centum include; 265 Elmer One Apartments in Kasarani, and 365 Pavilion Place Apartments in Ruaraka.
Fairdeal Properties, a real estate developer, announced plans to develop a 229-unit residential project dubbed Fairvalley Heights, to be located in Gimu area, near CITAM Athi River in Mavoko at a cost of Kshs 500.0 mn. The development will comprise of 3 blocks of apartments with 8 floors each and a total of 24 one-bedrooms, 102 two-bedrooms, 85 three- bedrooms and 18 four-bedrooms.
The table below shows a summary of the unit types, sizes and prices for the development;
|
Fair Valley Heights Development |
|||
|
No. of bedrooms |
Unit size (SQM) |
Unit price (Kshs) |
Price per SQM (Kshs) |
|
1 |
47 |
1.9 mn |
40,426 |
|
2 |
72 |
2.9 mn |
40,278 |
|
3 |
97 |
3.8 mn |
39,175 |
|
4 |
150 |
7.5 mn |
50,000 |
Source: Online Research
The above pricing translates to Kshs 42,470 per SQM, 27.2% lower than the Athi River market average of Kshs 58,311 according to Cytonn Q3’2020 Markets Review, indicating that Fairvalley Heights will offer relatively affordable housing units in terms of pricing. In terms of performance, Athi River had the highest rental yield coming in at 6.2% in Q3’2020, 0.6% points higher than the market average of 5.6% indicating sustained demand for rental units. Total returns came in at 4.4%, 1.3% points lower than the market average of 5.7% attributable to a decline in house prices amid a tough economic environment.
The table below shows the performance of apartments in satellite towns in Q3’2020;
|
Satellite Towns Apartments Performance Q3'2020 |
||||||||
|
Area |
Average Price Per SQM Q3'2020 |
Average Rent per SQM Q3'2020 |
Average Occupancy Q3'2020 |
Average Uptake Q3'2020 |
Average Annual Uptake Q3'2020 |
Average Rental Yield Q3'2020 |
Average Price Appreciation Q3'2020 |
Total Returns Q3'2020 |
|
Thindigua |
110,224 |
590 |
96.4% |
93.2% |
18.8% |
5.8% |
2.3% |
8.1% |
|
Syokimau |
69,225 |
362 |
88.3% |
79.9% |
14.2% |
5.5% |
1.4% |
6.8% |
|
Ruiru |
89,781 |
495 |
76.4% |
60.7% |
20.4% |
5.0% |
1.3% |
6.2% |
|
Kikuyu |
81,090 |
416 |
86.0% |
84.4% |
26.5% |
5.7% |
0.1% |
5.8% |
|
Athi River |
58,311 |
340 |
84.6% |
90.1% |
15.3% |
6.2% |
(1.8%) |
4.4% |
|
Kitengela |
60,027 |
325 |
88.1% |
99.5% |
13.6% |
6.0% |
(1.7%) |
4.3% |
|
Ruaka |
100,215 |
520 |
89.9% |
86.2% |
25.6% |
5.3% |
(1.3%) |
4.0% |
|
Average |
81,268 |
436 |
87.1% |
84.8% |
19.2% |
5.6% |
0.0% |
5.7% |
Source: Cytonn Research 2020
Athi River’s attractiveness as an area of investment is supported by; i) availability of affordable development land, ii) industrialization which has led to influx of population hence need for real estate development to accommodate the growing population, and, iii) improved infrastructure with expansion of Mombasa Road, presence of the Standard Gauge Railway station in the town and construction of Athi River interchange attracting developers.
Other highlights during the week;
- Centum Real Estate floated a Kshs 4.0 bn housing bond to finance projects that would deliver more than 1,400 units to the market. This comes three weeks after their announcement in October to issue the three-year zero coupon bond whose yield will be competitively determined by the market. According to the company’s management, the bond will be issued as a private placement, however, it will later be introduced at the Nairobi Stock Exchange (NSE) for trading. The firm’s real estate projects will act as security with the pools of deposits collected flowing into a sinking fund as a strategy to protect the bond holder’s funds. The move by Centum to issue a bond is an indication that developers have continued to explore diversified sources of financing for their real estate projects. Please see the Cytonn Monthly- October 2020 for more analysis.
We expect the residential sector to record increased activities supported by the continued launch of affordable housing projects in satellite towns such as Athi River supported by availability of affordable development land in bulk, growing population, in addition to some developers seeking to explore structured financing options for the funding of real estate projects.
- Retail Sector
During the week, Tuskys supermarket, a local retail chain, announced plans to close down half of its branches, in an attempt to stay in operation. Tuskys, which currently has 52 operational branches, has been battling financial woes amid supplier debts and mounting rent arrears despite securing financial support amounting to Kshs 2.0 bn from an undisclosed Mauritius-based private equity fund in August. The retailer has so far shut down 14 branches since the beginning of the year and we are of the view that to survive, Tuskys will require an infusion of significant equity capital from a disclosed and credible financier, with the aim of; (i) boosting the cash flows, (ii) helping clear the pressing debt issues, and, (iii) enabling the retailer gain control over its business.
Naivas supermarket, a local retail chain, announced plans to open two outlets to be located at Lifestyle Mall along Nairobi CBD’s Monrovia Street, a space previously occupied by Nakumatt while the other outlet will be situated in Rongai town. The retailer is targeting the high number of footfall in Nairobi’s CBD and the growing population in Ongata Rongai, in line with its expansion strategy of increasing its footprint in satellite towns. Once opened the two outlets will bring the retailer’s operational outlets to 68 with another two outlets expected to be opened by the end of the year. Currently, Naivas has the highest number of outlets locally at 66, five of which were opened this year. With 66 branches, Naivas has for the first time surpassed the 65 number of branches held by Nakumatt in its prime days. The continued expansion of the retailer as well as other retail chains such as QuickMart and Carrefour, taking up prime retail space left behind by troubled chains such as Tuskys and Nakumatt, is expected to cushion the retail sector performance which is currently witnessing; i) reduced demand for physical space due to shifting focus to online shopping, ii) reduced purchasing power among consumers amid a tough economic environment, and, iii) reduced rental rates as landlords offer rental concessions to retain tenants.
The table below shows the summary of the number of stores of the key local and international retail supermarket chains in Kenya;
|
Main Local and International Retail Supermarket Chains |
||||||
|
Name of Retailer |
Initial number of branches |
Number of branches opened in 2020 |
Closed branches |
Current number of Branches |
Branches expected to be opened / closed |
Projected total number of branches |
|
Naivas Supermarket |
61 |
5 |
0 |
66 |
4 |
70 |
|
Tuskys |
64 |
2 |
14 |
52 |
27 |
25 |
|
QuickMart |
29 |
6 |
0 |
35 |
0 |
35 |
|
Chandarana Foodplus |
19 |
1 |
0 |
20 |
0 |
20 |
|
Carrefour |
7 |
1 |
0 |
8 |
3 |
11 |
|
Uchumi |
37 |
0 |
33 |
4 |
0 |
4 |
|
Game Stores |
2 |
1 |
0 |
3 |
0 |
3 |
|
Choppies |
15 |
0 |
13 |
2 |
0 |
2 |
|
Shoprite |
4 |
0 |
2 |
2 |
0 |
2 |
|
Nakumatt |
65 |
0 |
65 |
0 |
0 |
0 |
|
Total |
303 |
16 |
127 |
192 |
34 |
172 |
Source: Online research
In terms of performance in 2020, Nairobi Metropolitan Area retail sector recorded an average rental yield of 7.5%, 0.5% points lower than 8.0% recorded in 2019. The performance is attributed to high rental rates of Kshs 168.5 per SQFT, which is 46.4% higher than the market average rates of Kshs 115.1 per SQFT amid an oversupply of 3.1 SQFT as at 2020. Satellite towns on the other hand offered the lowest rental rates averaging Kshs 130.0 hence an opportunity for retailers such as Naivas to take up affordable space.
The table below shows a summary of 2020 retail performance in the Nairobi Metropolitan Area;
|
Nairobi Metropolitan area (NMA) 2020 Retail Performance |
|||||||||
|
Area |
Rent/SQFT 2020 |
Occupancy% 2020 |
Rental Yield 2020 |
Rent Kshs/SQFT FY’ 2019 |
Occupancy FY’ 2019 |
Rental Yield FY’ 2019 |
Fy’ 2020 ∆ in Rental Rates |
Fy’ 2020 ∆ in Occupancy (% points) |
Fy’ 2020 ∆ in Rental Yield (% points) |
|
Westlands |
207.5 |
80.9% |
9.8% |
203.6 |
84.6% |
9.2% |
1.9% |
(3.7% |
0.6% |
|
Karen |
215.5 |
79.1% |
9.2% |
207.9 |
77.0% |
9.1% |
3.5% |
2.1% |
0.1% |
|
Kilimani |
169.5 |
83.0% |
8.6% |
170.4 |
87.2% |
9.9% |
(0.5%) |
(4.2% |
(1.3%) |
|
Ngong Road |
179.8 |
79.3% |
8.5% |
179.4 |
83.1% |
9.2% |
0.2% |
(3.8% |
(0.7%) |
|
Kiambu road |
174.8 |
65.3% |
6.8% |
166.0 |
61.7% |
6.8% |
5.0% |
3.6% |
0.0% |
|
Mombasa road |
140.8 |
70.8% |
6.2% |
148.1 |
64.0% |
6.3% |
(5.2%) |
6.8% |
(0.1%) |
|
Thika Road |
160.1 |
69.0% |
6.2% |
165.4 |
73.5% |
7.5% |
(3.3%) |
(4.5% |
(1.3% |
|
Eastlands |
138.3 |
69.2% |
6.1% |
145.0 |
74.5% |
7.5% |
(4.8%) |
(5.3% |
(1.4% |
|
Satellite towns |
130.0 |
73.6% |
5.8% |
131.4 |
70.3% |
6.0% |
(1.1%) |
3.3% |
(0.2%) |
|
Average |
168.5 |
74.5% |
7.5% |
168.6 |
75.1% |
8.0% |
(0.1%) |
(0.6%) |
(0.5%) |
Source: Cytonn Research 2020
We expect the performance of the retail sector to be cushioned by the continued expansion by local international chains supported by; i) continued improvement of infrastructure opening up areas for investment, ii) relatively high population growth rate, iii) investor confidence due to the ease of doing business in Kenya, having been ranked position #56 by World Bank in the ease of doing business, and, iii) the growing middle class with increased purchasing power.
- Listed Real Estate
During the week, Acorn Investment Management Limited, a subsidiary of Acorn Holdings was granted a Real Estate Investment Trust (REIT) manager license by the Capital Markets Authority (CMA) following the fulfilment of applicable regulations. This follows the launching of an 8-week roadshow in September by Acorn to woo fund managers to its Acorn student accommodation REITs to be established by the end of this year.
As a fund manager, some of the duties of Acorn will include; i) formulation of prudent investment policies and investment of the fund’s assets, ii) valuation of the fund and setting the dealing prices in accordance with the information memorandum, iii) preparing and issuing dividend distributions and financial statements to investors, and, iv) dealing with investors when they wish to invest in the fund or redeem their existing holdings and issuing confirmation of the details of the transactions, among other functions. The licensing by CMA is an indication of confidence in regulated product development which will allow the firm to register their anticipated Development REIT (D-REIT), estimated at Kshs 4.0 bn and Income REIT (I-REIT) estimated at Kshs 4.1 bn, allowing them to access a pool of investor capital that wishes to take specific real estate exposure. Acorn is seeking for investors to invest a total of 24.0% equity on the development of student accommodation D-REIT, and up to 67.0% in the I-REIT. So far the firm has secured Kshs 1.0 bn equity investment from one of its anchor investor, InfraCo, a private infrastructure development group. The development real estate investment trust (D-REIT) is expected to finance the student hostels, having announced that it is set to build two hostels next to the University of Nairobi Chiromo Campus under the Qwetu and Qejani brands, whereas the Investment real estate investment trust (I-REIT) will be used to acquire property for rental income. The REIT market in Kenya has remained underdeveloped mainly due to; i) inadequate investor knowledge on REITs, ii) high minimum amount required to invest in REITS at Kshs 5.0 mn locking out many potential investors, and, iii) shallow investment grade assets pipeline among other challenges.
Following the licensing of Acorn Investment Management, the total number of licensed REIT Managers will be 10. We are of the view that effort in improving the REIT market by licensing more fund managers will encourage investor confidence leading to increased funding for real estate development through structured products such as REITs away from the traditional sources of funding such as bank funding. However, more needs to be done by the regulator to improve the REIT market as currently, the REIT market remains muted as evidenced by the fact there is only an I-REIT in the market and so far no successful D-REIT in the market. Additionally, Stanlib Fahari I-REIT’s performance, the only listed I-REIT on the Nairobi Securities Exchange, has been on a downturn since November 2015 when it was first listed, an indication of the dwindling interest for the instrument by investors. As such, we believe that in order for CMA to improve the REIT Market and make it more attractive to local and foreign investors, the following supportive frameworks need to be put in place;
- Broaden the pool of trustees by reducing the minimum capital requirement which currently stands at Kshs 100.0 mn. This high minimum effectively limits the eligible trustees to only banks, which is not good for market development. We ought to allow for corporate trustees who are solely focussed on the trustee business,
- Remove the intense conflicts of interest in the governance structure of the both CMA and the fund structures so that there is more tolerance to constructive feedback. In normal functioning economies, Capital Markets make up 60.0% of business funding with only 40.0% of it coming from bank funding, while in Kenya Capital Markets make up only a paltry 1.0% with the balance of 99.0% coming from bank funding. In short, our Capital Markets are stifled and hence we need to;
- Reduce the minimum investments for real estate finance vehicles. The minimum of Kshs 5.0 mn per investor for the formation of a development REIT is too high for a country where the median income is just Kshs 50,000, hence the minimum investment is 100 times higher than the median income, no wonder there is not a single Development REIT formed so far, making it hard to finance real estate initiatives such as the President’s housing agenda, and,
- Develop institutional grade real estate assets which will lead to high returns.
We expect the real estate sector performance to register improvement attributable to continued focus on development of affordable housing projects, expansion by local retailers taking up prime retail space left by troubled retailers and increased activities in the REIT market.
According to the Kenya Retail Sector Report – 2019 themed “Increased Market Activity to promote Retail Growth”, released in October 2019, the retail sector’s performance in key urban cities softened, recording average rental yields of 7.0% in 2019, 1.6% points lower than the 8.6% recorded in 2018, attributed to a reduction in rental rates and surplus retail space coupled with stiff competition among malls.
This week, we update those findings with the Kenya Retail Sector Report – 2020 themed “E-commerce Shaping the Retail Sector”. We conducted research in 8 nodes within the Nairobi Metropolitan Area, as well as key urban cities and regions in Kenya, including North Rift, Coastal Region, Western/Nyanza, and Mt. Kenya, and made findings based on rental yields, occupancy rates, as well as demand and supply in order to evaluate the performance of the sector during the year in comparison to 2019 and the years before to identify the trends, and hence, identify the investment opportunity and outlook for the sector. The report covers;
- Overview of the Kenya Retail Sector in 2020
- Kenya Retail Sector Performance Summary in 2020,
- Retail Space Demand Analysis,
- Retail Sector Investment Opportunity, and
- Retail Sector Outlook.
Section I: Overview of the Kenya Retail Sector in 2020
The 2020 period recorded subdued performance in the retail sector resulting from the tough operating environment as the economy grappled with effects of the Coronavirus pandemic. This was evidenced by the scaling down of outlets by retailers such as Shoprite, Deacons, and Tuskys, with the latter currently facing financial woes. Nevertheless, the sector saw entry of international retailers such as i) Turkish home furnish retailer Istikbal, ii) Spanish fashion retailer Tendam Group, iii) Massmart Holdings, a subsidiary of South African Game stores, and, iv) Hong Kong fashion chain Giordano earlier in the year among others. The sector also recorded expansion by various local and international retail chains including i) Carrefour which opened an outlet along Uhuru Highway Nairobi and announced plans to expand to Mombasa, iii) Naivas which opened outlets at Mountain View Mall, the Waterfront mall along Mombasa Road among others, and, iii) Quickmart opened several outlets including Nanyuki Branch in Nanyuki Mall, CBD along Tom Mboya Street and in Kilimani among others. These entry and expansion by some retailers has cushioned the performance of the retail sector through taking up prime retail spaces left behind by their troubled counterparts. The trend towards e-commerce has been on the rise with online shopping being embraced as it registered an 8.6% growth in internet subscription rates according to Economic Survey 2020 by Kenya National Bureau of Statistics (KNBS).This has further been enabled by mobile wallets gaining popularity, thus making online shopping more convenient. Overall, the retail sector recorded a 34,000 SQFT increase in mall space in 2020 with the introduction of Golden Life Mall in Nakuru, leading to a supply of 12.6 mn SQFT on overall.
The growth of the formal retail sector was mainly driven by:
- Positive Demographics: Kenya’s urban population continues to expand at an annual rate of 4.0% as per the World Bank, against the global average of 1.9% increasing the need for formal retail space,
- Changing Consumer Tastes & Preferences:Growth in the middle-class with increased disposable income has made Kenyan shoppers more aware of global retail trends and more demanding of the local shopping experience, goods and services,
- Infrastructure:The continued investment in infrastructure has opened up areas thus encouraging growth in mall space,
- Low Penetration of Formal Retail: Penetration of formal retail in Kenya is 30.0% compared to 60.0% in South Africa, indicating there is still significant room for growth
- Recognition of Kenya as a Regional Hub: This has attracted many international organisations and retailers into the country thus the continued growth of the shopping population in addition to a growing demand for retail space, and,
- Entry and Expansion of Both Local and International Retailers: International retailers such as Carrefour and local retailers such as Naivas have continued to expand taking up prime retail spaces left behind by troubled retailers such as Nakumatt and Choppies.
The table below shows a summary of the number of stores of main local and international retail chains in Kenya;
|
Main Local and International Retail Supermarket Chains |
|||||||
|
Name of Retailer |
Category |
Initial number of branches |
Number of branches opened in 2020 |
Closed branches |
Current number of Branches |
Branches expected to be opened / (Closed) |
Projected total number of branches |
|
Naivas Supermarket |
Local |
61 |
5 |
0 |
66 |
4 |
70 |
|
Tuskys |
Local |
64 |
2 |
14 |
52 |
27 |
25 |
|
QuickMart |
Local |
29 |
6 |
0 |
35 |
0 |
35 |
|
Chandarana Foodplus |
Local |
19 |
1 |
0 |
20 |
0 |
20 |
|
Carrefour |
International |
7 |
1 |
0 |
8 |
3 |
11 |
|
Uchumi |
Local |
37 |
0 |
33 |
4 |
0 |
4 |
|
Game Stores |
International |
2 |
1 |
0 |
3 |
0 |
3 |
|
Choppies |
International |
15 |
0 |
13 |
2 |
0 |
2 |
|
Shoprite |
International |
4 |
0 |
2 |
2 |
0 |
2 |
|
Nakumatt |
Local |
65 |
0 |
65 |
0 |
0 |
0 |
|
Total |
|
303 |
16 |
127 |
192 |
34 |
172 |
Source: Online Research
During the period under review, the key challenges facing the retail sector were:
- Constrained access to credit due to high risk of default in payment, with private sector credit growth coming in at 7.6% as of June 2020 similar to a 5-year average of the same,
- Continued exit by some retailers such as Shoprite to cushion themselves against the impact of the COVID-19 pandemic,
- Constrained spending power among consumers due to a tough economic environment, and,
- Growing focus on e-commerce thus reduced demand for physical retail space.
Despite the continued exit of troubled retailers such as Tuskys, we expect the entry and expansion of local and international retailers taking up prime retail space left behind will cushion the retail real estate sector’s performance supported by the changing tastes and preferences of consumers and the growing middle class with higher purchasing power. Overall, formal retail sector penetration in Kenya remains relatively low at approximately 30.0%, in comparison to countries such as South Africa with 60.0% according to Nielsen report 2018, however, Kenya is the second best in the Sub-Saharan Africa after South Africa. The low formal retail penetration is attributed competition from informal retail spaces, and consumer preference for convenience as most informal retail spaces are more accessible. However, in the long run, we expect growth in the formal retail sector with the entry of local and international retailers aiming to increase their footprint in the country.
Section II: Kenya Retail Sector Performance in 2020
In 2019, Kenya’s retail sector performance declined with average rental yields decreasing by 1.6% point’s y/y to 7.0%, from 8.6% in 2018, attributed to the tough economic environment in 2019. In 2020, the sector’s performance has further declined recording average rental yields of 6.7%, 0.3% points lower than the 7.0% recorded in 2019. The reduced performance is largely attributed to:
- Reduced Rental Rates – Reduction in rental rates in a bid to attract tenants amid a tough economic environment saw the rental rates in the sector post a 2.1% decline to Kshs 115.1 per SQFT in 2020, from Kshs 118.0 per SQFT in 2019, and,
- Reduced Occupancy Rates - Average occupancies declined by 0.7% points Y/Y from 77.3% in 2019 to 76.6% in 2020 attributable to reduced demand for physical retail space due to growing focus on e-commerce and scaling down of retailers in the wake of reduced revenue inflows.
Our analysis of the retail market performance in 2020 covers the general market performance within key nodes in the Nairobi Metropolitan Area by node and class and finally performance of key urban cities in the country.
- Retail Sector Performance in Kenya Over Time
In 2020, the Kenyan retail sector’s performance dropped slightly with average rental yields declining by 0.3% points to 6.7% in 2020, from 7.0% in 2019, while the occupancy rates declined by 0.7% points to 76.6% in 2020, from 77.3% in 2019. The decline in performance is mainly attributed to:
- Constrained access to credit by businesses and reduced spending power among consumers, due to a tough economic environment,
- Tough economic times leading to the scaling down of operations by retailers, and,
- The existing oversupply of retail space in select submarkets which has resulted in pressure on landlords to provide concessions and other incentives to attract new clientele and/or retain existing tenants.
The performance of the sector across the key cities is as summarized below:
(All values in Kshs unless stated otherwise)
|
Kenya’s Retail Performance Summary-2020 |
||||||
|
Item |
2016 |
2017 |
2018 |
2019 |
2020 |
∆ Y/Y 2020/2019 |
|
Asking rents (Kshs/SQFT) |
154.9 |
140.9 |
132.1 |
118 |
115.1 |
(2.1%) |
|
Average Occupancy (%) |
82.9% |
80.2% |
86.0% |
77.3% |
76.6% |
(0.7%) points |
|
Average Rental Yields |
8.7% |
8.3% |
8.6% |
7.0% |
6.7% |
(0.3%) points |
|
||||||
Source: Cytonn Research
- Nairobi Metropolitan Area (NMA) Retail Market Performance
In 2020, the rental yields within the NMA declined by 0.5% points to 7.5% from 8.0% in 2020 attributable to decline in demand for space evidenced by a drop in occupancies by 0.6% points from 75.1% in 2019 to 74.5% in 2020 and marginal decline in rent of by 0.1% to Kshs 168.5 from Kshs 168.6. The subdued performance is also attributed to the current oversupply of retail report spaces by 3.1 mn SQFT, shifting focus to e-commerce leading to decline in demand for physical retail spaces, constrained consumer spending given the tough economic environment and exit by some retailers to cushion themselves against the negative effects of the Coronavirus pandemic.
- Performance by Nodes
Westlands and Karen were the best performing retail nodes with rental yields of 9.8% and 9.2%, respectively attributed to presence of affluent residents with high consumer purchasing power as the areas host high-end and middle income earners, relatively good infrastructure thus ease of access into the areas and relatively high occupancy rates of 80.9% and 79.1%, respectively above the market average of 74.5%.
Eastlands and satellite towns recorded the lowest rental yields of 6.1% and 5.8%, respectively attributed to low rents of Kshs 138.3 per SQFT and Kshs 130.0 per SQFT, respectively compared to the market average of Kshs 168.5 per attributable to competition from informal retail spaces and constrained consumer spending.
The performance of the key nodes in the Nairobi Metropolitan Area (NMA) is as summarized below:
(All values in Kshs unless stated otherwise)
|
Nairobi Metropolitan area (NMA) 2020 Retail Performance |
|||||||||
|
Area |
Rent/SQFT 2020 |
Occupancy% 2020 |
Rental Yield 2020 |
Rent Kshs/SQFT FY’ 2019 |
Occupancy FY’ 2019 |
Rental Yield FY’ 2019 |
Fy’ 2020 ∆ in Rental Rates |
Fy’ 2020 ∆ in Occupancy (% points) |
Fy’ 2020 ∆ in Rental Yield (% points) |
|
Westlands |
207.5 |
80.9% |
9.8% |
203.6 |
84.6% |
9.2% |
1.9% |
(3.7% |
0.6% |
|
Karen |
215.5 |
79.1% |
9.2% |
207.9 |
77.0% |
9.1% |
3.5% |
2.1% |
0.1% |
|
Kilimani |
169.5 |
83.0% |
8.6% |
170.4 |
87.2% |
9.9% |
(0.5%) |
(4.2% |
(1.3%) |
|
Ngong Road |
179.8 |
79.3% |
8.5% |
179.4 |
83.1% |
9.2% |
0.2% |
(3.8% |
(0.7%) |
|
Kiambu road |
174.8 |
65.3% |
6.8% |
166.0 |
61.7% |
6.8% |
5.0% |
3.6% |
0.0% |
|
Mombasa road |
140.8 |
70.8% |
6.2% |
148.1 |
64.0% |
6.3% |
(5.2%) |
6.8% |
(0.1%) |
|
Thika Road |
160.1 |
69.0% |
6.2% |
165.4 |
73.5% |
7.5% |
(3.3%) |
(4.5% |
(1.3% |
|
Eastlands |
138.3 |
69.2% |
6.1% |
145.0 |
74.5% |
7.5% |
(4.8%) |
(5.3% |
(1.4% |
|
Satellite towns |
130.0 |
73.6% |
5.8% |
131.4 |
70.3% |
6.0% |
(1.1%) |
3.3% |
(0.2%) |
|
Average |
168.5 |
74.5% |
7.5% |
168.6 |
75.1% |
8.0% |
(0.1%) |
(0.6%) |
(0.5%) |
Source: Cytonn Research, 2020
- Performance by Class
To analyze the performance of malls by class we classified malls into three bands as below:
- Regional Centers / Destination Malls: They are the largest malls, with a gross lettable area (GLA) of 400,000 - 800,000 SQFT and characteristically have two or more anchor tenants (except NextGen), in Nairobi these include; Sarit Centre, Two Rivers Mall, NextGen Mall, and Garden City,
- Community Centers: These are the second largest mall types, occupying spaces of between 125,001 - 400,000 SQFT and characteristically have zero to two anchor tenants, in Nairobi these include; The Hub, Capital Centre, Galleria, Village Market, Junction Mall, and Westgate, and,
- Neighborhood Centers: They have minimum mall space, with a gross lettable area (GLA) of 20,000 SQFT and characteristically having a maximum of one or even no anchor tenant, in Nairobi these include; Prestige Plaza, Rosslyn Riviera and Ridgeways Mall.
On performance by class, destination malls were the best performing recording average rental yields of 8.5%, attributable to high rental charges averaging at Kshs 201.9 per SQFT, 11.7% higher than the market average of Kshs 178.2 per SQFT. This is as the malls charge premium rents for the high-quality retail space, facilities provided, and have higher footfall attracted by the presence of international retailers.
Community malls recorded an average rental yield of 7.4% slightly lower than the market average of 7.8%, while neighborhood malls recorded an average rental yield and occupancy rate of 7.4% and 73.4%, respectively, attributed to lower rental rates averaging Kshs 163.7 per SQFT compared to the market average of Kshs 178.2 per SQFT.
The summary of performance by class is as shown below:
(All Values in Kshs unless stated otherwise)
|
Retail Market Performance in Nairobi by Class 2020 |
|||
|
Class |
Rent 2020 per SQFT |
Occupancy 2020 |
Rental Yield 2020 |
|
Destination |
201.9 |
76.4% |
8.5% |
|
Community |
169.2 |
75.1% |
7.4% |
|
Neighbourhood |
163.7 |
73.4% |
7.4% |
|
Average |
178.2 |
75.0% |
7.8% |
Source: Cytonn research
- Retail Market Performance in Key Urban Cities in Kenya
The performance in key urban towns slightly softened with declines in rental yields by 0.3% points to 6.7% from 7.0% in 2019. This is attributed to declines in the occupancy rates by 0.7% points from 77.3% in 2019 to 76.6% in 2020 and a 2.1% drop in rental rates. The slowdown in performance is attributed to reduced demand of physical retail space as a result of shifted focus to e-commerce, constrained consumer spending as a result of tough economic times and competition from informal retail spaces in some submarkets. In addition, rental rates have declined as landlords use strategies such as discounts to woe new clients and maintain existing tenants.
Mount Kenya was the best performing node with an average rent of Kshs 125.0 per SQFT and average rental yields of 7.7%. However, the rental yields dropped by 0.9% points from 8.6% in 2019, while the occupancy rates declined from 80.0% to 78.0%, a decline by 2.0% points. The relatively good performance of the region is attributable to relatively high demand for quality retail space amid an undersupply of 0.7 mn SQFT.
Nakuru was the lowest performing node recording an average yield of 5.9% against the market average of 6.7%. The decline is attributed to low rental rates of Kshs 55.7 per SQFT due to the limited supply of quality retail space and competition from informal retail market.
The performance of the key urban centres in Kenya is as summarized below:
(All values in Kshs unless stated otherwise)
|
Summary of Retail Performance in Key Urban Cities in Kenya |
||||||||
|
Region |
Rent/SQFT 2020 |
Occupancy% 2020 |
Rental Yield 2020 |
Rent Kshs/SQFT 2019 |
Occupancy 2019 |
Rental Yield 2019 |
2020 ∆ in Occupancy (% points) |
2020 ∆ in Rental Yield (% points) |
|
Mount Kenya |
125.0 |
78.0% |
7.7% |
129.8 |
80.0% |
8.6% |
(2.0%) |
(0.9%) |
|
Nairobi |
168.5 |
74.5% |
7.5% |
168.6 |
75.1% |
8.0% |
(0.6%) |
(0.5%) |
|
Mombasa |
114.4 |
76.3% |
6.6% |
122.8 |
73.3% |
7.3% |
3.0% |
(0.7%) |
|
Kisumu |
97.2 |
74.0% |
6.3% |
96.9 |
75.8% |
5.6% |
(1.8%) |
0.7% |
|
Eldoret |
130.0 |
80.2% |
5.9% |
131.0 |
82.3% |
7.9% |
(2.1%) |
(2.0%) |
|
Nakuru |
55.7 |
76.6% |
5.9% |
59.2 |
77.5% |
4.5% |
(0.9%) |
1.4% |
|
Average |
115.1 |
76.6% |
6.7% |
118.1 |
77.3% |
7.0% |
(0.7%) |
(0.3%) |
|
||||||||
Source: Cytonn Research
Section III: Retail Space Demand Analysis
We worked out a retail space demand analysis to help track retail market gaps across the country, and therefore inform investors on both overserved and underserved markets. Our demand analysis is based on the current and incoming retail space supply and the required retail space demand per region dependent on the population.
To determine the retail space demand per region we looked at net space uptake (the total retail space adequate to serve a region dependent on the population less the vacancy rates in malls) per person in SQM, shopping population, and current retail market occupancy rates. For calculation of the net space uptake, we used the average uptake in Kilimani as a guideline. In this analysis:
- Total Demand/Gross Uptake is the total retail space adequate to serve a region dependent on the population. This is calculated by multiplying the net space uptake per person by the total shopping population,
- Net Demand/Uptake is the gross uptake less the vacancy rates in malls in a specific region. This is calculated by multiplying the gross uptake by respective market occupancy rates,
- Supply is calculated by summing up the completed retail stock and the incoming retail space,
- To get the over/undersupply (gap) in the market, the supply is subtracted from the demand/net uptake.
Key assumptions are:
- Number of persons per household at 3.6 based on the average household size in urban areas as per Kenya Population and Housing Census 2019, and,
- Percentage of shopping population (14 years and above)
(If the figure is positive, then the market has an undersupply I.e, demand is more than supply and if it is a negative figure then the market has an oversupply, i.e. supply is more than demand).
The retail space demand across key regions in Kenya is as shown below;
|
Demand Analysis of Retail Spaces in Key Urban Cities |
||||||||||
|
Region |
2019 |
Urban Population |
Urban population 2019 |
Shopping People |
Net Space Uptake per pax in SQM (Based on Uptake per pax in Kilimani) |
Occupancy (2 year Average) |
Gross Space Uptake per Pax (Required Space Kilimani) |
Net Uptake (Space Required) for each market |
Current supply |
GAP at current market performance |
|
Mt Kenya |
2.8 |
38.0% |
1.1 |
0.6 |
1.5 |
79.2% |
1.7 |
1.3 |
0.4 |
0.7 |
|
Kiambu |
2.1 |
60.0% |
1.3 |
0.7 |
1.9 |
74.8% |
2.1 |
1.6 |
0.9 |
0.6 |
|
Machakos |
1.3 |
52.0% |
0.7 |
0.4 |
1.0 |
74.8% |
1.1 |
0.8 |
0.3 |
0.1 |
|
Kajiado |
1.1 |
41.0% |
0.5 |
0.3 |
0.7 |
74.8% |
0.7 |
0.5 |
0.3 |
0.1 |
|
Mombasa |
1.3 |
100.0% |
1.3 |
0.8 |
1.9 |
74.8% |
2.1 |
1.6 |
1.4 |
0.0 |
|
Uasin Gishu |
1.3 |
44.0% |
0.6 |
0.3 |
0.8 |
81.3% |
0.9 |
0.8 |
0.4 |
(0.1) |
|
Nakuru |
2.2 |
45.0% |
1.0 |
0.6 |
1.4 |
77.1% |
1.6 |
1.2 |
0.6 |
(0.1) |
|
Kisumu |
1.2 |
50.0% |
0.6 |
0.3 |
0.9 |
74.9% |
1.0 |
0.7 |
1.0 |
(0.2) |
|
Nairobi |
4.6 |
100.0% |
4.6 |
2.7 |
6.7 |
74.8% |
7.4 |
5.5 |
7.3 |
(3.1) |
|
Total |
18. |
|
11.6 |
6.7 |
16.8 |
|
18.6 |
14.1 |
12.5 |
(2.0) |
|
|
|||||||||
Section IV: Retail Space Investment Opportunity
To determine the investment opportunity within the retail sector in Kenya, we analysed the regions based on three metrics, which is performance (rental yield), required retail space and household expenditure as a proxy for purchasing power, which have been allocated 30.0%, 30.0% and 40.0% weights, respectively.
Methodology Used:
- Rental Yield – Measures the expected return from development hence the higher the better. This carried 30% of the weight. The area with the highest yield was given the highest score of 9, while the area with the least yield was given the least score of 1,
- Household Expenditure - It shows the ability of the population to spend and thus the higher the better. This carried a 40% weight, hence, the area with a high household expenditure was given the highest score of 9, while the area with least household expenditure was given the least score of 1, and,
- Retail Space Demand – Measures the amount of space a region can take up at the current market occupancy rates. The higher the better. This carried a 30% weight, hence, an area with a high retail space demand was given the highest score of 9, while the area with least retail space demand was given the least score of 1.
|
Retail Space Opportunity 2020 |
|||||
|
Region/Weight |
Retail Yield Score |
Retail Space Score |
Household expenditure (per adult) score |
|
|
|
30.0% |
30.0% |
40.0% |
Weighted score |
Rank |
|
|
Kiambu |
8 |
8 |
7 |
7.6 |
1 |
|
Mt Kenya |
8 |
9 |
5 |
7.1 |
2 |
|
Mombasa |
4 |
5 |
8 |
5.9 |
3 |
|
Nairobi |
5 |
1 |
9 |
5.4 |
4 |
|
Machakos |
5 |
6 |
3 |
4.5 |
5 |
|
Kajiado |
5 |
7 |
2 |
4.4 |
6 |
|
Kisumu |
3 |
2 |
6 |
3.9 |
7 |
|
Nakuru |
1 |
3 |
4 |
2.8 |
8 |
|
Uasin Gishu |
1 |
4 |
1 |
1.9 |
9 |
|
|||||
Source: Cytonn Research 2019
Section V: Retail Sector Outlook
The table below summarizes metrics that have a possible impact on the retail sector, that is the retail space supply, performance, retail space demand, and concluding with the market opportunity/outlook in the sector;
|
Kenya Retail Sector Outlook 2020 |
||||
|
Measure |
Sentiment 2019 |
Sentiment 2020 |
2019 Outlook |
2020 Outlook |
|
Retail Space Supply |
Majority of the Kenyan regions that is Kiambu County, Mt Kenya region, Machakos, Mombasa and Kajiado are undersupplied and therefore, we expect to see developers shifting their focus to these regions. However, in the short-run we expect developers to scale back on the top-tier regions that are oversupplied, that is, Nairobi, Kisumu, Uasin Gishu and Nakuru with more development picking up based on demand from international retailers and investors as well as improved financial environment |
Main urban cities such as Nairobi and Kisumu have an existing oversupply of space while regions such as Kiambu County and Mt Kenya region are undersupplied and therefore, we expect to see developers shifting their focus to these regions. This will be supported by demand from international retailers and expansion by local retail chains |
Neutral |
Neutral |
|
Retail Market Performance |
The retail sector performance in the Nairobi Metropolitan Area declined by 5.4% and 4.7%, respectively to record rental yields of 8.0% and occupancy rates of 75.1%, respectively. Nairobi and Mt Kenya were the best performing region with average rental of 8.6% and 8.0%, respectively. Kisumu’s performance dropped significantly due to increased mall supply |
The retail sector performance recorded a decline of 0.3% and 0.7% points in average rental yields and occupancy rates, respectively, coming in at 6.7% and 76.6%, respectively Nairobi and Mt. Kenya were the best performing regions with average rental yields of 7.7% and 7.5%, respectively, attributable to relatively high demand for quality retail space demand for space in malls. We expect the sector’s performance to be cushioned by entry of local and international retailers taking up prime retail space left by their troubled counterparts. |
Neutral |
Neutral |
|
Retail Space Demand |
Despite four major cities i.e. Nakuru, Uasin Gishu, Kisumu and Nairobi being oversupplied, the rest are undersupplied including Kiambu with a retail space demand of 0.8mn SQFT |
Nairobi, Kisumu and Nakuru are the most oversupplied areas by 3.1 mn, 0.3 mn and 0.2 mn SQFT of space, respectively while areas such as Mt Kenya are under supplied by 0.7 mn SQFT |
Neutral |
Neutral |
|
Market Outlook
|
The outlook for the sector is NEUTRAL and we expect to witness increased development activity in areas outside Nairobi, with developers shifting to satellite towns and county headquarters in markets such as Kiambu and Mt. Kenya that have an existing retail space demand of 0.6 mn and 0.7 mn SQFT, respectively. |
|||
For more information, please see the full report.
Disclaimer: The views expressed in this publication are those of the writers where particulars are not warranted. This publication, which is in compliance with Section 2 of the Capital Markets Authority Act Cap 485A, is meant for general information only and is not a warranty, representation, advice or solicitation of any nature. Readers are advised in all circumstances to seek the advice of a registered investment advisor.

- Talk to us
- Kenya
- P.O Box 20695 - 00200, Nairobi, Kenya
- Cell +254709101200
- Tel +254709101200
- WhatsApp +254741676635
- United States
- +254709101200
- DOWNLOAD OUR APP
-


- Kenya
- 8th Floor, Pinetree Plaza, Kaburu Drive, Ngong Road, Nairobi, Kenya
- USA
- Suite 1150, 1775 Eye Street NW, USA, Washington DC 20006, USA
- Investments
- High Yield
- Private Equity
- Real Estate
- Real Estate
- RiverRun Estates
- Cytonn Towers
- The Ridge
- Taraji Heights
- The Alma