Cytonn Q3’2020 Markets Review
By Cytonn Research, Oct 4, 2020
Executive Summary
Global Markets Review
According to the World Bank June report, the global economy is expected to contract at a rate of 5.2% in 2020 largely driven by the 7.0% contraction in developed economies. The key challenges currently facing the global economy include among others; the onset of a new wave of the pandemic which is now apparent in the Euro area, subdued business confidence and early relaxation of monetary and fiscal policies. There is a projection of recovery in 2021 but this will largely be dependent on the ability of the governments to come up with the right policies to build confidence;
Sub-Saharan Africa Regional Review
According to the World Bank, following the severe economic strains caused by the COVID-19 pandemic more so during H1’2020, the African regional growth is expected to contract by 2.8% in 2020 and rebound and grow at 3.1% in 2021. All select currencies depreciated against the US Dollar in Q3’2020 with the Zambian Kwacha being the worst performer, depreciating by 42.2% against the dollar YTD;
Kenya Macroeconomic Review
Kenya’s economy grew by 4.9% in Q1’2020, a decline from the 5.5% recorded in Q1’2019, which was due to; a 9.3% slowdown in the accommodation and food services sector compared with the growth of 11.0% recorded in Q1’2019. Economic growth for Kenya is projected to be significantly lower with the IMF projecting a growth of 1.0% while the treasury projected a 2.5% growth. Inflation rates have remained relatively stable with the average inflation ending the quarter at 4.2% compared to 3.8% recorded in Q3’2019;
Fixed Income
Demand for government securities remained high in the first two months of the quarter with Treasury bills being 152.6% subscribed over the quarter as the government received bids worth Kshs 424.7 bn compared to Kshs 312.0 bn amounts on offer but the government accepted only Kshs 317.8 bn. Treasury bonds received a 196.5% subscription rate with Kshs 405.3 bn worth of bids being received, compared to the Kshs 220.0 bn offered amount and the government accepting only Kshs 264.0 bn.
During the week, T-bills remained undersubscribed, with the subscription rate coming in at 64.9% up from 29.7% the previous week. The subscription rates for the 91-day paper increased to 154.7% from 28.0% recorded the previous week with investors preferring to hold the shortest dated paper due to uncertainty in the market. The subscription for the 182-day and 364-day papers also increased to 40.6% and 53.3%, respectively, from 12.7% and 47.3%, recorded the previous week. The yields on the 91-day, 182-day, and 364-day papers increased by 9.1 bps, 6.6 bps, and 5.4 bps, to 6.4%, 6.8%, and 7.7%, respectively;
Equities
In Q3’2020, the equities market recorded mixed performance, with NASI and NSE 25 gaining by 1.6% and 1.3%, respectively, while NSE 20 declined by 4.6%. The performance was driven by gains recorded by large caps such as BAT, KCB, Equity Group and EABL, which gained by 9.5%, 7.6%, 5.8% and 4.2%, respectively. The gains were however weighed down by losses recorded by other large cap stocks such as Bamburi, Diamond Trust Bank (DTB-K) and NCBA, which declined by 15.9%, 15.2% and 13.4%, respectively. During the third quarter of 2020, listed banks in Kenya released their H1’2020 results, recording a decline in their earnings growth, with their core EPS declining by 33.6%;
Real Estate
During Q3’2020, the real estate sector recorded a decline in development activities and transactions attributed to the ongoing pandemic. In terms of performance, the average rental yields declined marginally in the retail and commercial office sectors to 7.4% and 7.2% in Q3’2020, from 7.8% and 7.5%, respectively in FY’2019. In the residential sector, apartments registered relatively higher average total returns to investors at 5.4% compared to detached markets at 4.2%. The land sector recorded an overall annualized capital appreciation of 2.4%, indicating that investors still consider land as a good investment asset in the long term.
- Given the recent inaccurate, sensational and misleading reporting around the Cytonn brand, we welcome clients, stakeholders and the interested public to join our CEO, Edwin H. Dande, and the management team, for a Cytonn Stakeholder Engagement Forum. The forum is to provide accurate information for your consideration and to answer any questions you may have. You can dial in for any one session this week from 11.30 AM to 1.00 PM, Monday through Saturday: cytonn.com/stakeholderforum
- Weekly Rates:
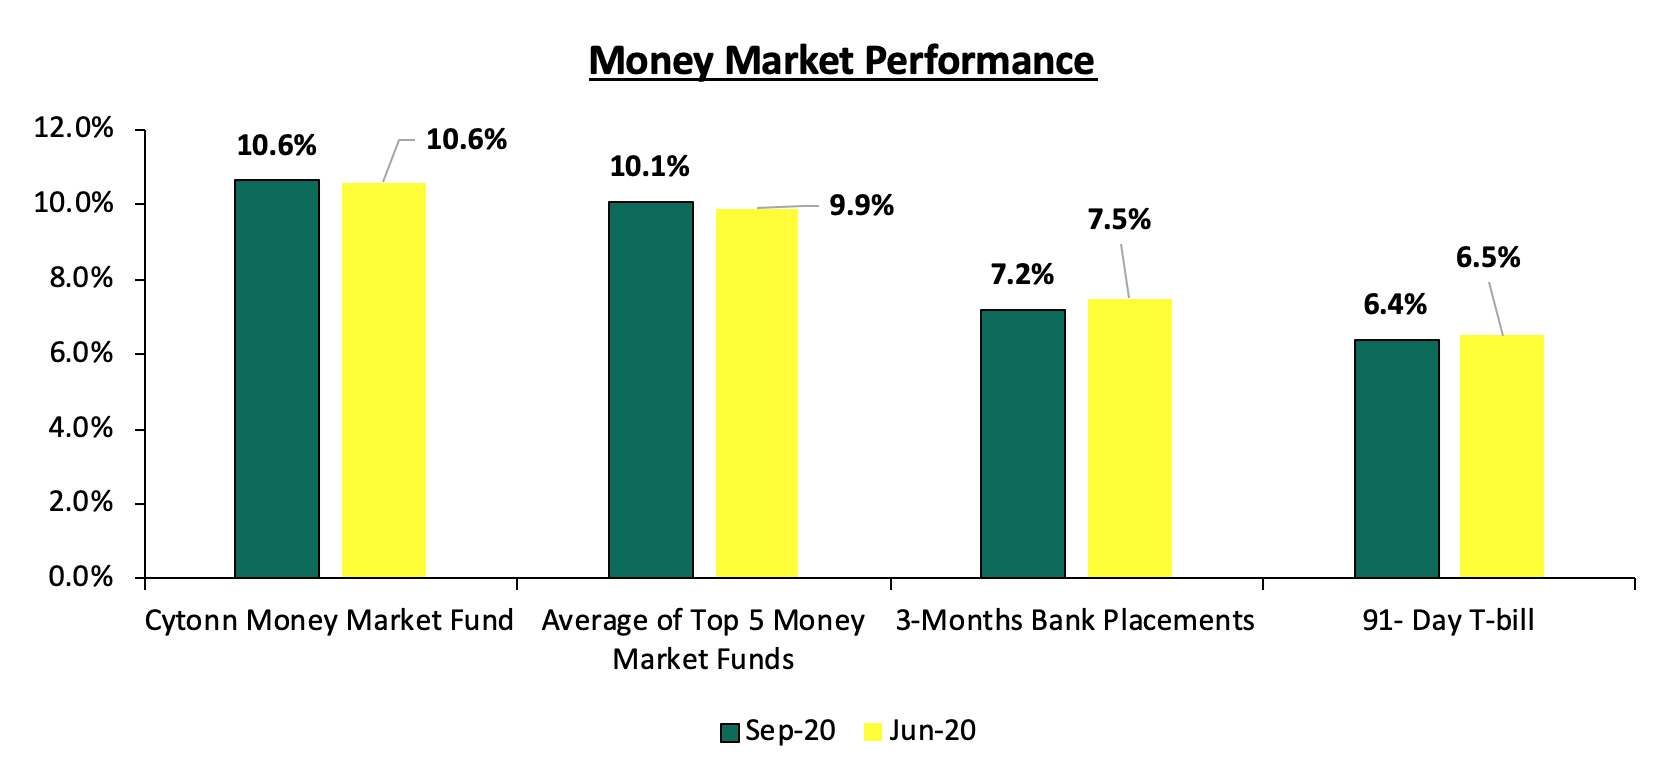
- Cytonn Money Market Fund closed the week at a yield of 10.6%. To invest or withdraw, just dial *809#;
- Cytonn High Yield Fund closed the week at a yield of 12.8% p.a. To invest, email us at sales@cytonn.com and to withdraw the interest you just dial *809#
- For an exclusive tour of Cytonn’s real estate developments, visit: Sharp Investor's Tour and for more information, email us at sales@cytonn.com;
- We continue to offer Wealth Management Training daily, from 9:00 am to 11:00 am, through our Cytonn Foundation. The training aims to grow financial literacy among the general public. To register for any of our Wealth Management Training, click here;
- For Pension Scheme Trustees and members, we shall be having different industry players talk about matters affecting Pension Schemes and the pensions industry at large. Join us every Wednesday from 9:00 am to 11:00 am for in-depth discussions on matters pension;
- If interested in our Private Wealth Management Training for your employees or investment group, please get in touch with us through wmt@cytonn.com;
- For recent news about the company, see our news section here;
- We have 10 investment-ready projects, offering attractive development and buyer targeted returns. See further details here: Summary of Investment-ready Projects.
Introduction
The Global Economy is expected to contract at a rate of between 4.9 and 5.2% in 2020 with countries worst hit by the pandemic leading the recession. The developed economies are projected to decline by between 7.0% and 8.0% while the less developed market are projected to decline by between 2.0% and 3.0%. The worst hit sector is the services sector with the global PMI index coming in at 51.9, a decline from the 52.2 reading recorded in 2019.
Some of the themes underpinning the outlook include:
- Continued worsening of the pandemic in some economies despite levelling in others, leading to even larger disruptions in business activity than expected,
- Decline in consumption and services as people have had to rely on their savings as they adhere to social distancing and movement restrictions set in place to reduce the Virus spread,
- Depressed mobility as travel is impacted,
- A contraction in global trade, and
- Lower Inflation due to subdued demand in most economies coupled with the current low oil prices.
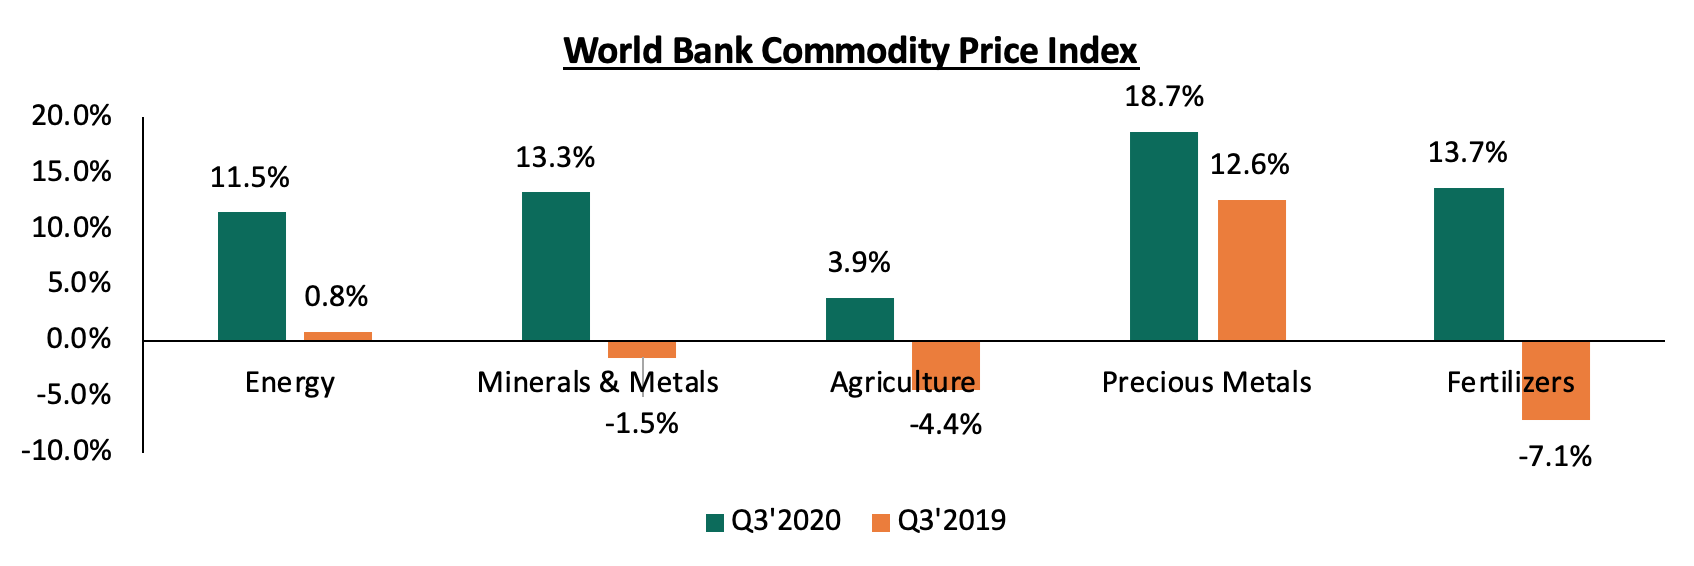
Commodity Prices:
Global commodity prices improved in Q3’2020 led by precious metals as investors sought them as the key store of value during this uncertain times. Below is a summary performance of various commodities:
According to the World Bank, the African regional growth is expected to contract by 2.8% in 2020 and rebound by 3.1% in 2021. The region has been more resilient with much fewer COVID-19 related deaths compared to the other regions.
Currency Performance
All select currencies depreciated against the US Dollar in Q3’2020 with the Zambian Kwacha being the worst performer, depreciating by 42.2% against the dollar YTD. The depreciation recorded by the currencies is partly attributable to the ongoing COVID-19 pandemic, which has seen a fast-falling demand for export commodities given the lockdown measures put in place. The performance of the Zambian Kwacha can be attributable to the low economic productivity given the fall of copper prices as well as high demand for hard currency from the government as it seeks to meet its debt repayment obligations. The Kenya Shilling depreciated by 7.1% in Q3’2020 to close at Kshs 108.4 against the US Dollar.
Below is a table showing the performance of select African currencies:
|
Select Sub Saharan Africa Currency Performance vs USD |
|||||
|
Currency |
Sep-19 |
Dec-19 |
Sep-20 |
Last 12 Months change (%) |
YTD change (%) |
|
Tanzanian Shilling |
2293.0 |
2293.0 |
2315.0 |
(1.0%) |
(1.0%) |
|
Ghanaian Cedi |
5.4 |
5.7 |
5.7 |
(5.8%) |
(1.3%) |
|
Ugandan Shilling |
3678.0 |
3660.0 |
3712.0 |
(0.9%) |
(1.4%) |
|
Malawian Kwacha |
727.5 |
729.1 |
743.9 |
(2.3%) |
(2.0%) |
|
Kenyan Shilling |
103.8 |
101.3 |
108.4 |
(4.5%) |
(7.1%) |
|
Mauritius Rupee |
36.1 |
36.2 |
39.7 |
(10.0%) |
(9.7%) |
|
Botswana Pula |
11.1 |
10.5 |
11.7 |
(5.0%) |
(11.0%) |
|
South African Rand |
15.1 |
14.0 |
16.7 |
(10.6%) |
(19.6%) |
|
Nigerian Naira |
306.0 |
306.0 |
380.6 |
(24.4%) |
(24.4%) |
|
Zambian Kwacha |
13.1 |
14.1 |
20.0 |
(53.0%) |
(42.2%) |
Source: Reuters
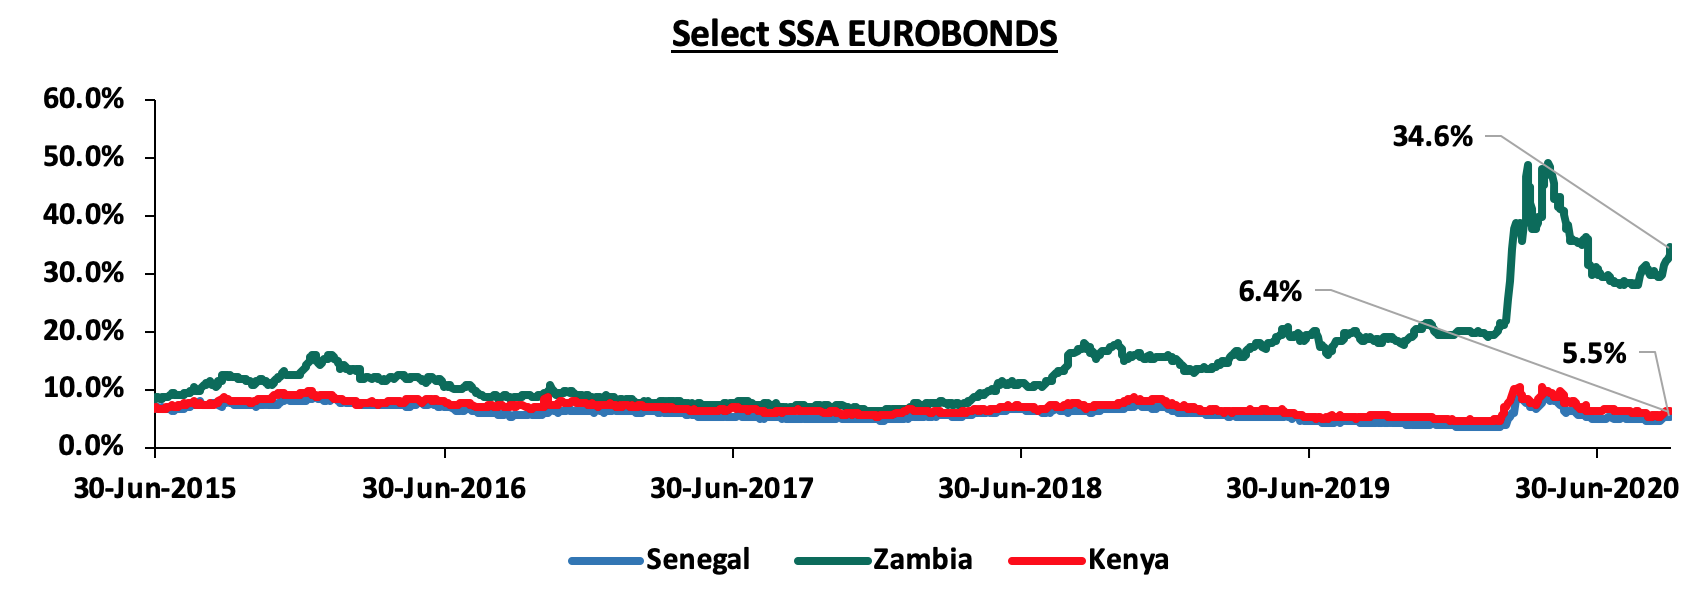
African Eurobonds:
Yields on the African Eurobonds increased in Q3’2020 partly attributable to the COVID-19 health crisis which saw investors attaching a high risk premium to the COVID-19 affected regions due to the anticipation of slow economic growth. Below is a graph showing the Eurobond secondary market performance of select 10-year Eurobonds issued by the respective countries:
Source: Reuters
Key Takeout from the chart:
- Yields on the Zambia Eurobond increased in Q3’2020 by 15.0% points to 34.6% from 19.6% recorded at the end of December 2019, attributable to the flight by foreign investors amid concerns of the country’s high debt burden. Fitch ratings recently downgraded the county’s Long Term Debt Rating pointing out that Zambia is bound to face acute liquidity pressures given their high debt serving levels which is likely to elevate their defaulting risks.
Equities Market Performance
Most of the Sub-Saharan African (SSA) stock markets recorded negative returns in Q3’2020, attributable to foreign investors’ selloffs in favor of safe havens, given the expected economic fallout. Below is a summary of the performance of key exchanges:
|
Equities Market Performance (Dollarized*) |
||||||
|
Country |
Index |
Sep-19 |
Dec-19 |
Sep-20 |
Last 12 Months change (%) |
YTD change (%) |
|
Rwanda |
RSEASI |
0.1 |
0.1 |
0.2 |
4.1% |
5.5% |
|
Kenya |
NASI |
1.4 |
1.6 |
1.3 |
(8.0%) |
(19.4%) |
|
Nigeria |
NGSEASI |
90.3 |
87.7 |
70.5 |
(21.9%) |
(19.6%) |
|
Ghana |
GGSECI |
407.7 |
405.5 |
323.6 |
(20.6%) |
(20.2%) |
|
South Africa |
JALSH |
3,622.9 |
4,079.3 |
3,242.8 |
(10.5%) |
(20.5%) |
|
Uganda |
USEASI |
0.4 |
0.5 |
0.4 |
(13.5%) |
(26.6%) |
|
Zambia |
LASILZ |
336.2 |
303.3 |
190.2 |
(43.4%) |
(37.3%) |
|
Tanzania |
DARSDSEI |
0.8 |
1.5 |
0.7 |
(15.2%) |
(52.5%) |
|
*The index values are dollarized for ease of comparison |
||||||
Source: Reuters
Analysis of trends observed in the chart above is as follows:
- Rwanda is the best performing index showing resilience amid the COVID-19 pandemic following gains made by cross-listed stocks such as Equity Bank, which has recorded YTD gains of 25.7%,
- DARSDSEI was the worst-performing index with losses of 52.5% YTD, attributable to the continued selloffs brought by concerns about the economic fallout caused by the Coronavirus. The ban on International travel bans took a toll on the country’s tourism sector, which had been one of the fastest-growing sectors in the economy, and,
- Nairobi All Share Index (NASI), recorded losses of 19.4% YTD, attributable to the huge capital flight by investors as they sought for safer havens.
GDP growth in Sub-Saharan Africa region is expected to decline owing to the ongoing COVID-19 pandemic that is expected to disrupt global supply chains and as the currencies lose value against the dollar in an uncertain global economy. Key risks remain difficult business conditions and poor infrastructure, reliance on commodity exports, political tension in some countries and debt sustainability due to high levels of public debt in most economies in the region. Stock market valuations remain unattractive for long-term investors.
Kenya’s economy grew by 4.9% in Q1’2020, a decline from the 5.5% recorded in Q1’2019, which was due to: a 9.3% slowdown in the accommodation and food services sector compared with the growth of 11.0% recorded in Q1’2019. The decline was however mitigated by; the agricultural sector which recorded a slightly faster growth of 4.9%, compared to 4.7% seen in Q1’2019, and, faster growth in the: mining and quarrying, education, health and agriculture and forestry sectors which grew by 9.5%, 5.3%, 5.8% and 4.9% in Q1’2020, from 1.4%, 4.3%, 5.4% and 4.7%, respectively, recorded in Q1’2019;
Economic growth for Kenya is projected to be significantly lower with the IMF projecting a growth of 1.0% while the treasury projected 2.5% growth. For the first quarter of 2020, the impacts of the virus had not taken a big toll and we saw growth coming in at 4.9% a 2 – year low, compared to 5.5% recorded in a similar period of review in 2019. The economic prospects have been improving with the Stanbic Bank’s Monthly Purchasing Manager’s Index (PMI), for August coming in at 53.0 after a recording of 54.2 in July 2020, which is higher than the H1’2020 average of 42.2. For more information, see our Q1’2020 GDP Note;
Inflation:
Inflation rates have remained relatively stable with the quarterly average at 4.3% down from 5.0% recorded in Q3’2019. The September inflation rate came in at 4.2%. The low inflation rate can be attributed to the low food prices which has more than offset the increases in oil prices over the year. Below chart is the inflation chart
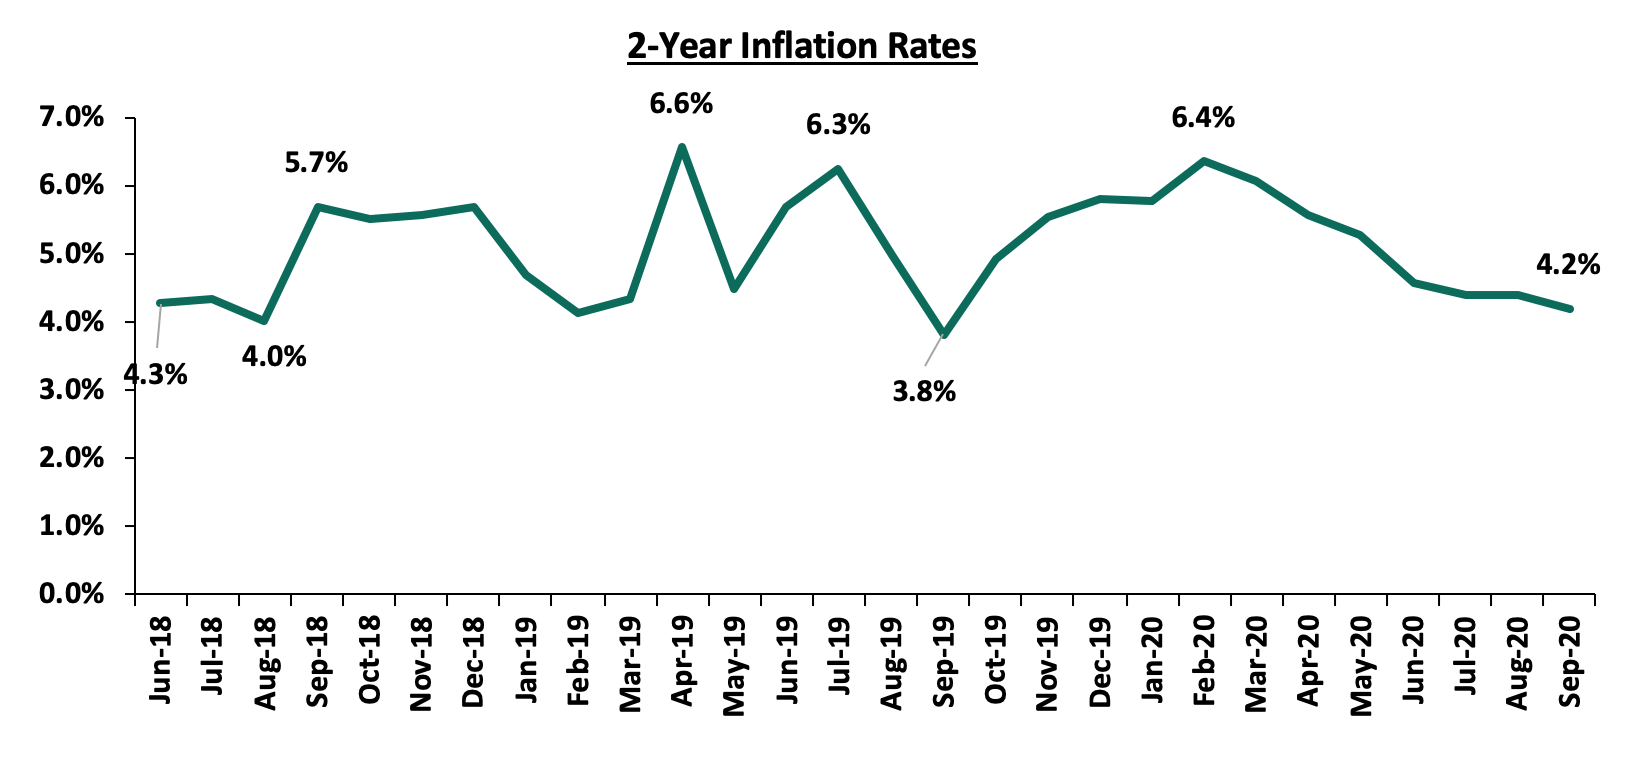
We expect inflation to remain stable despite supply-side disruption due to COVID-19 as low demand for commodities compensates for the cost-push inflation. The recent reopening of a majority of the global markets will also address supply chain issues causing import prices to stabilize.
The Kenya Shilling:
The Kenya Shilling depreciated by 1.9% during the quarter bringing the YTD deprecation to 7.1% against the US Dollar to close at Kshs 108.5, from Kshs 101.3 at the end of December 2019. The depreciation can be attributed to the uncertainty in the global economy and also the decline in dollar inflows as trade is impacted. Going forward the shilling shall remain under pressure due to:
- Continued uncertainty globally making people prefer holding dollars and other hard currencies,
- A deteriorating current account position: we saw current account deficit deteriorate by 10.2% during Q1’2020, coming in at Kshs 110.9 bn, from Kshs 100.6 bn in Q1’2019 attributable to;
- 0% decline in the secondary income (transfers recorded in the balance of payments whenever an economy provides or receives goods, services, income or financial items) balance, to Kshs 124.1 bn, from Kshs 128.0 bn in Q1’2019, and,
- A 67.0% decline in the services trade balance (the difference between the imports and exports of services) to Kshs 20.4 bn, from Kshs 61.9 bn.
- Demand from merchandise and energy sector importers as they beef up their hard currency positions amid a slowdown in foreign dollar currency inflows,
However the shilling is expected to have support from;
- The high levels of forex reserves, currently at USD 8.5 bn (equivalent to 5.2-months of import cover), above the statutory requirement of maintaining at least 4.0-months of import cover, and the EAC region’s convergence criteria of 4.5-months of import cover,
- Relatively strong Diaspora remittances that increased by 27.9% to USD 274.1 million in August compared to USD 214.3 million in August 2019, despite being 1.0% lower than the USD 277.0 million in July 2020.
Monetary Policy:
During the quarter the Monetary Policy Committee met twice and, in both instances, held the both the Central Bank Rate stable at 7.0% and the Cash Reserve ratio remained unchanged at 4.25%. This move was after a reduction of the Central Bank Rate to 7.00% from 8.25% and Cash Reserve Ratio to 4.25% from 5.25% at the beginning of the year. The Committee’s move was supported by the fact that the economy was positively reacting to the changes earlier in the year.
Budget Watch 2020/2021
During Q3’2020 the Parliamentary Budgetary Office highlighted in their Budget watch 2020/21 and the Medium Term, that the current budget would most likely not steer the country out of the current crisis. Some of the highlights from the report included;
- Revenue Prospects during the Pandemic: The ordinary revenue collected as of June 2020 was Kshs 1.6 tn, Kshs 300.0 bn (16.0%) below the set target of Kshs 1.9 tn according to the Budget estimates. The National Treasury projects ordinary revenue to decline from Kshs 1,643.4 bn in 2019/20 (revised estimates II) to Kshs 1,621.4 bn in 2020/21. A decline in income tax collection is expected to be among the major drivers of the expected decline in revenue due to income loss by workers across most sectors. According to the treasury, the ministry is targeting a fiscal deficit of 7.3% for FY2021/2022, down from the current financial year’s deficit of 8.4%,
- Debt Management FY’2020/21: The country’s debt servicing will be a significant source of liquidity pressures in FY’2020/21. Public debt service expenses are projected to increase by Kshs 157.7bn (about 20.0%) to Kshs 925.9 bn in FY’2020/21, and,
- Monetary Policy: To support the economy, the Central Bank initiated various measures to ensure there is ample liquidity in the economy. These include; the lowering of the Central Bank Rate so as to make loans more affordable, lowering the cash reserve ratio by 100 bps to 4.25%, and increasing the maximum tenor of repurchase agreements from 28 days to 91 days. As a result of the accommodative stance, lending rates have declined to 11.9% as of June 2020, from 12.3% seen in December 2019. For more information, see our Cytonn Weekly #37/2020
Money Markets, T-Bills & T-Bonds Primary Auction:
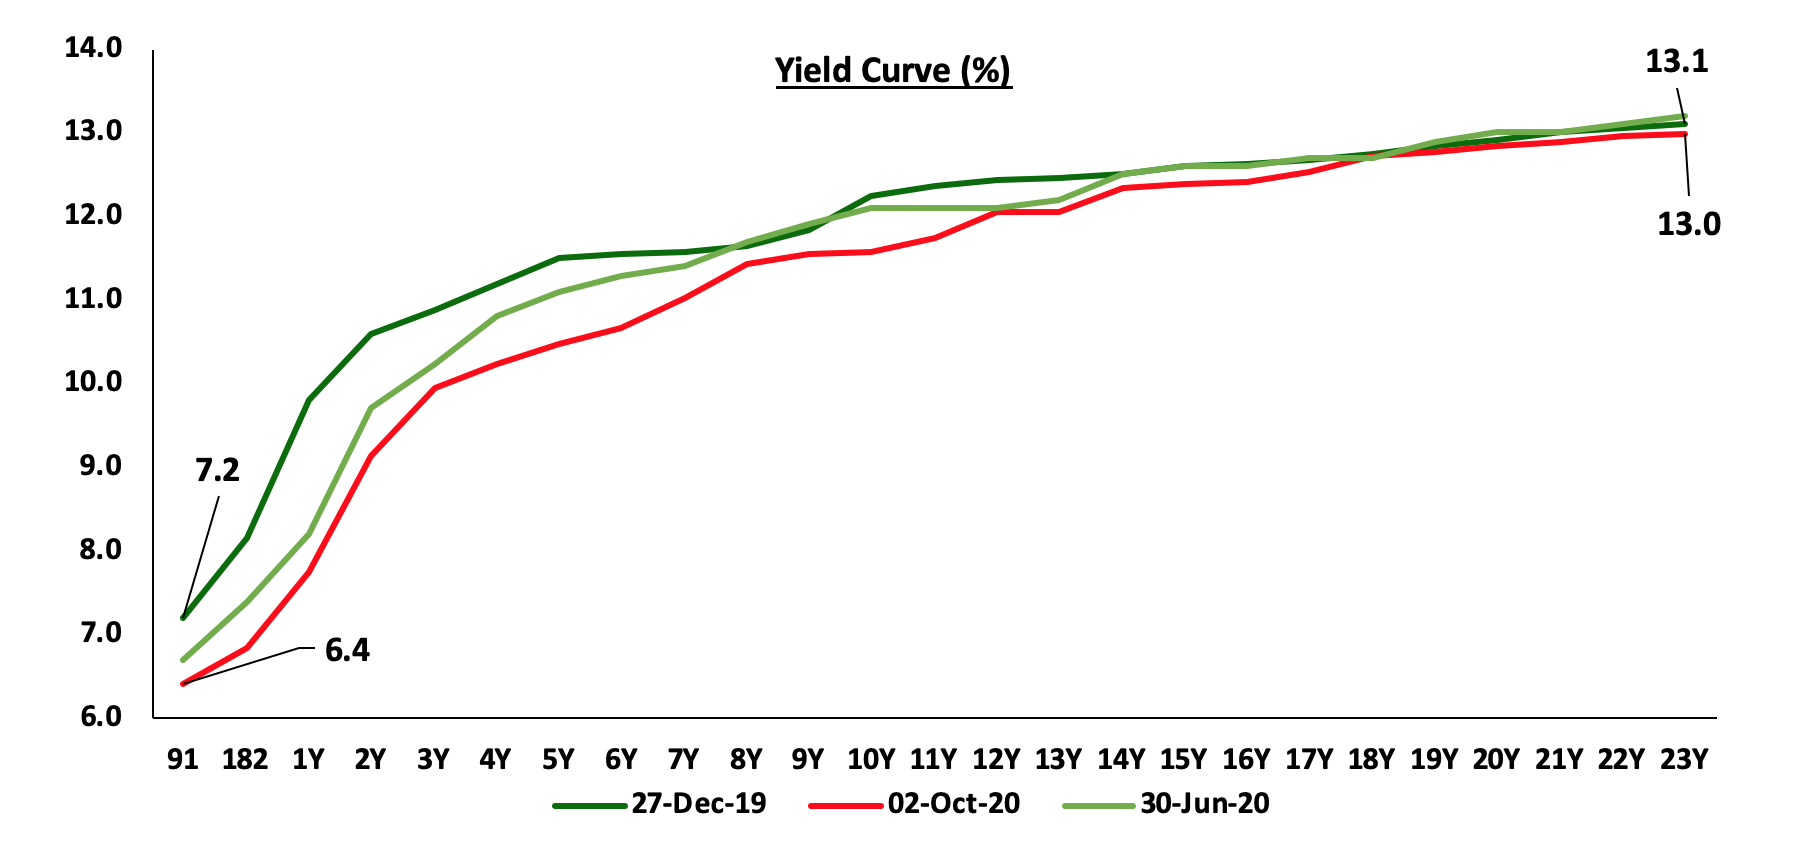
Demand for government securities remained high in the third quarter of 2020 with Treasury bills being 152.6% subscribed, attracting bids worth Kshs 424.7 bn, and the government accepting Kshs 317.8 bn. Treasury bonds received a 196.5% subscription, Kshs. 405.3 bn worth of bids and the government accepting only Kshs 264.0 bn. The yields on the 91-day T-bill and 182-day T-bill declined to end the quarter at 6.3%, 6.8%, and 7.7% in Q3’2020, from 6.7%, 7.4%, and 8.2% at the end of the second quarter.
During the week, T-bills remained undersubscribed, with the subscription rate coming in at 64.9% up from 29.7% the previous week. The subscription rates for the 91-day paper increased to 154.7% from 28.0% recorded the previous week with investors preferring to hold the shortest dated paper due to uncertainty in the market. The subscription for the 182-day and 364-day papers also increased to 40.6% and 53.3%, respectively, from 12.7% and 47.3%, recorded the previous week. The acceptance rate decreased to 68.7%, from 85.4% recorded the previous week, with the government accepting only Kshs 10.7 bn of the Kshs 15.6 bn worth of bids received. The yields on the 91-day, 182-day, and 364-day papers increased by 9.1 bps, 6.6 bps, and 5.4 bps, respectively to 6.4%, 6.8%, and 7.7%.
The yield curve witnessed downward pressure as the Central bank continued to reject expensive bids and this lead to the FTSE bond index gaining by 0.3% on a YTD basis, and 1.2% during the quarter.
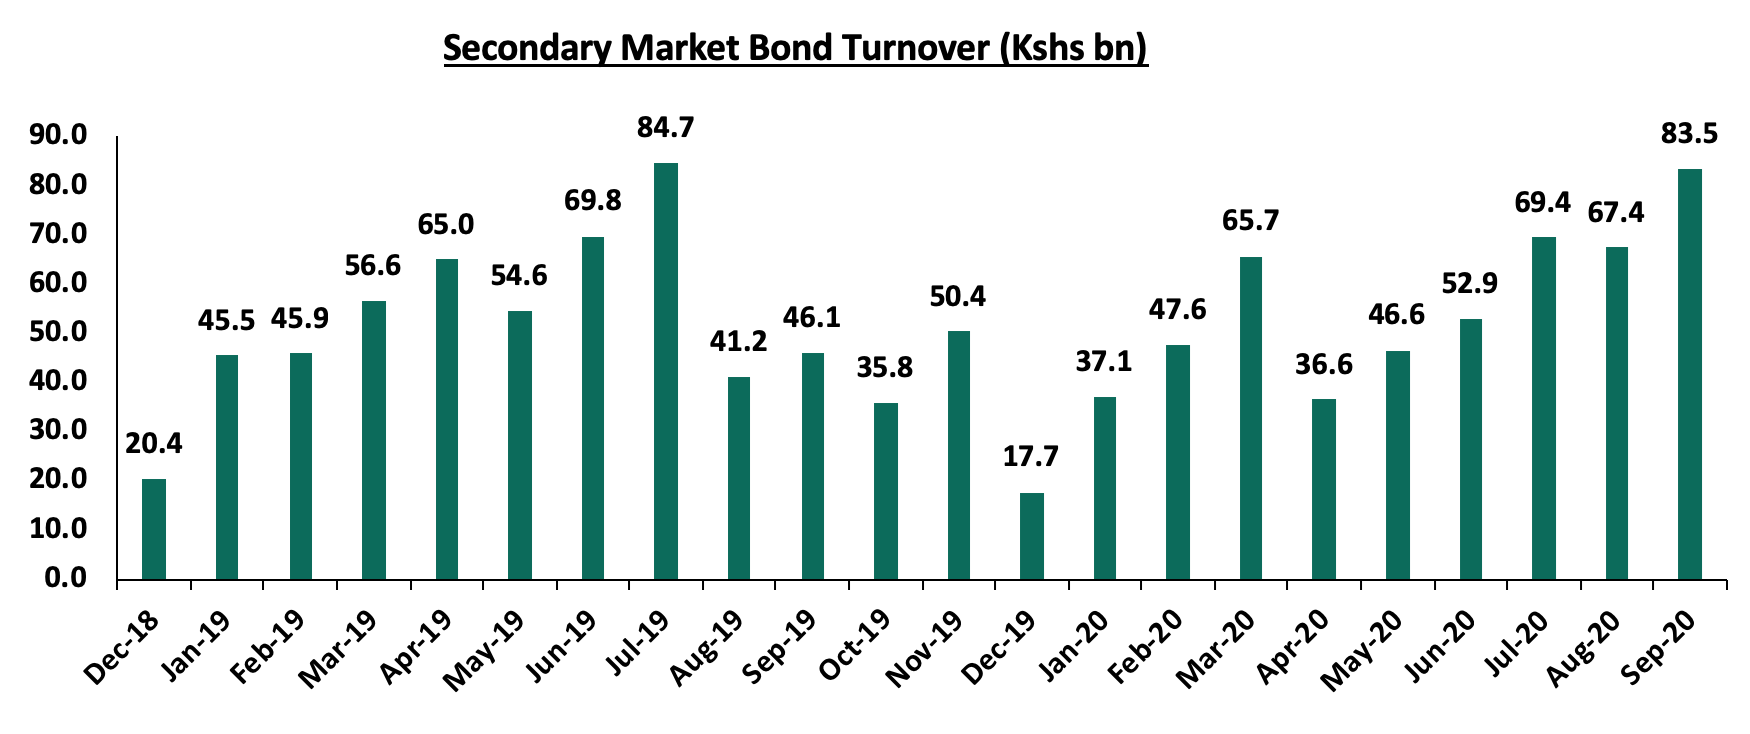
Secondary Bond Market Activity:
Activity in the secondary bond market remained high with the turnover declining marginally by 0.5% to Kshs 506.8 bn from Kshs 509.4 bn in Q3’2020.
Yields on the money markets remained relatively stable losing slightly as can be seen in the chart below.
Kenya Eurobonds:
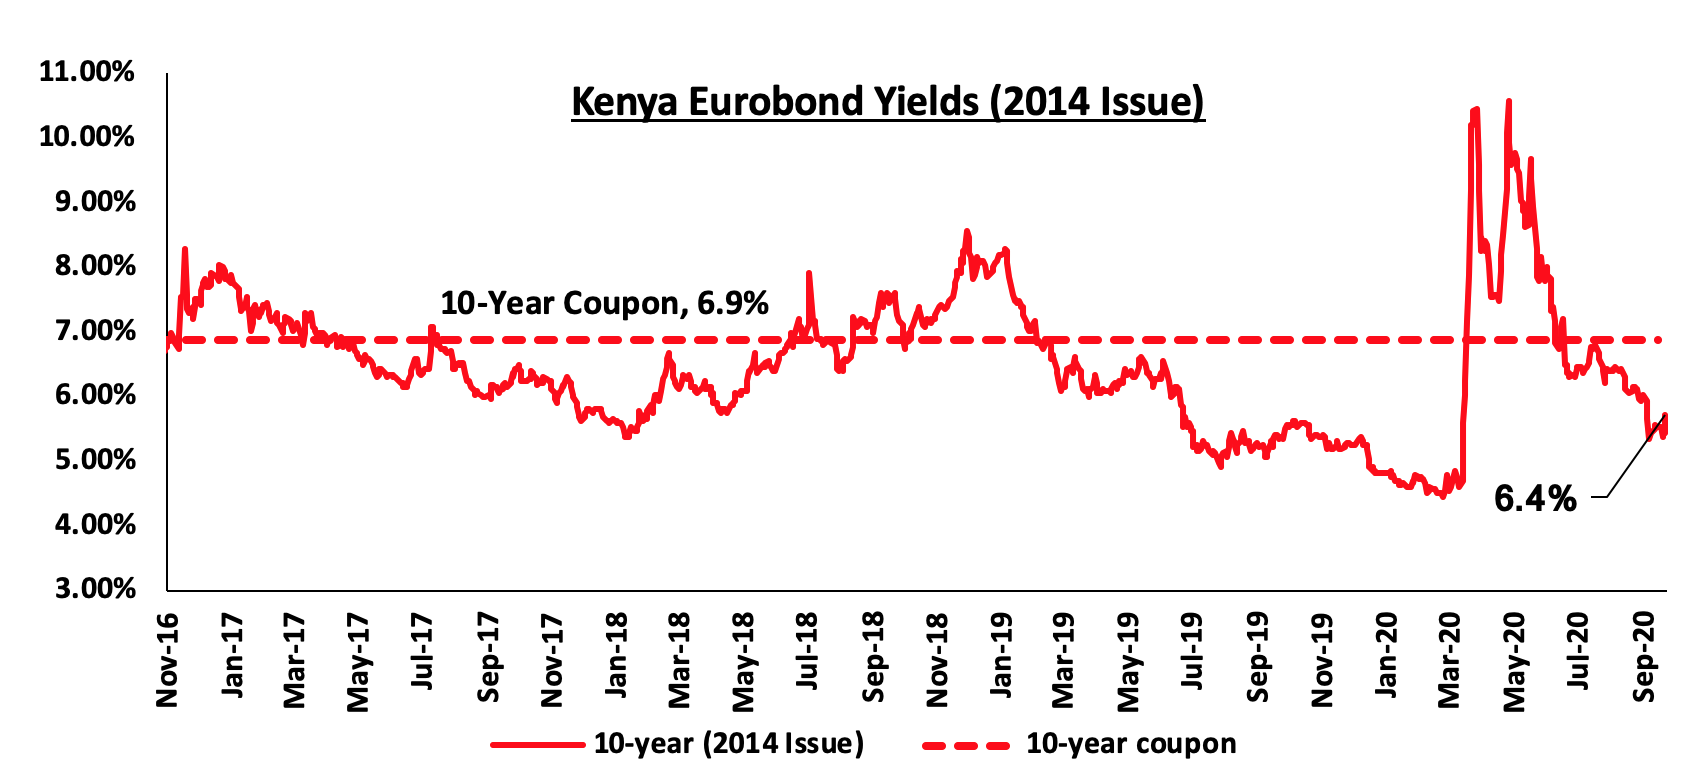
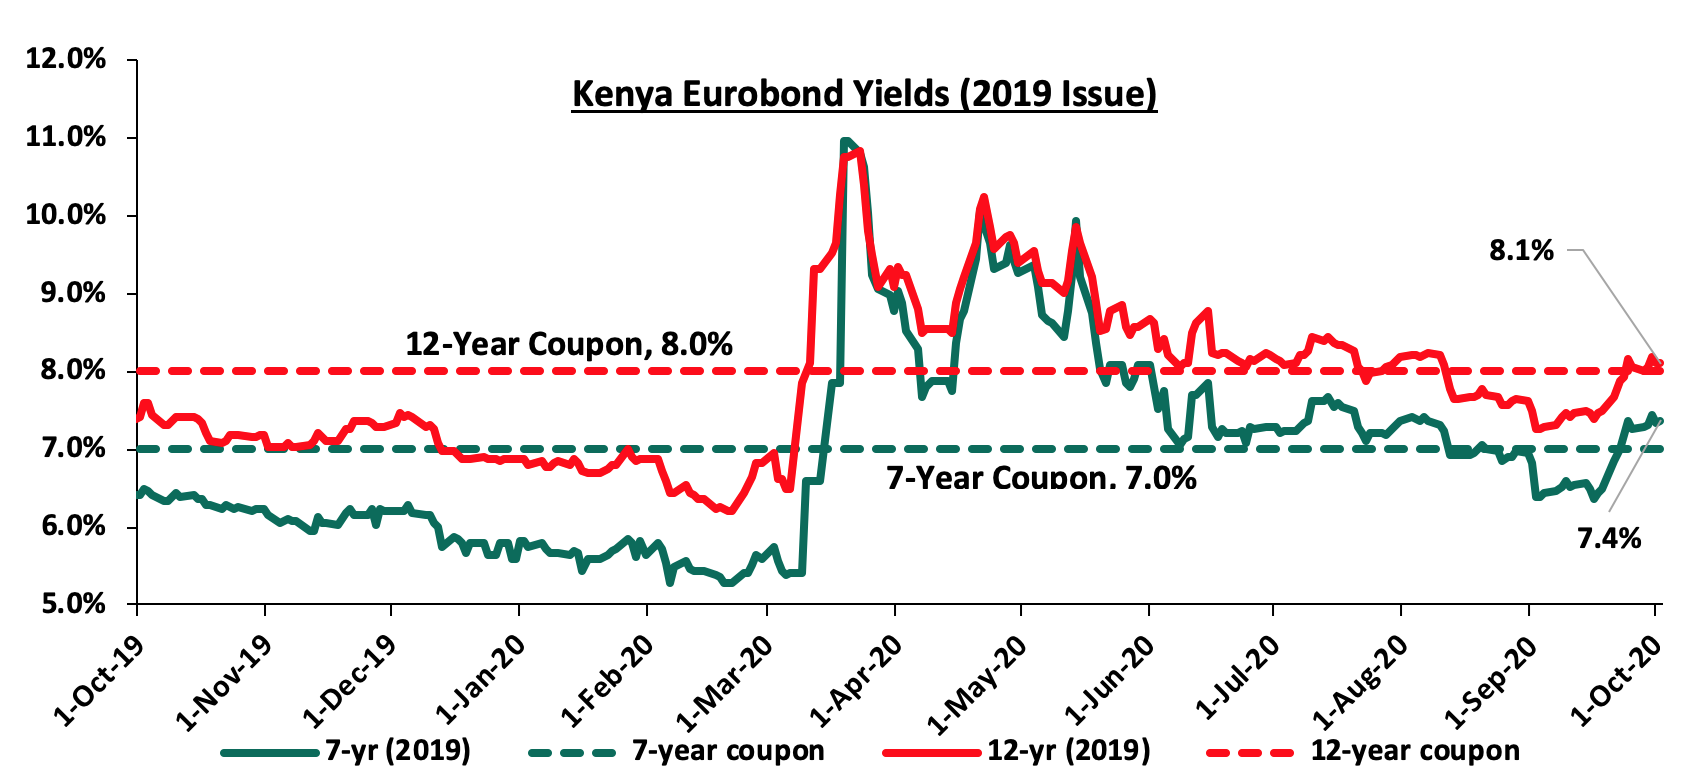
During Q3’2020, the yield on most Eurobonds declined marginally attributable to investors attaching a lower risk premium on the country as the cases of the Corona virus continued to decrease and economic activity normalizes. According to Reuters, the yield on the 10-year Eurobond issued in 2014, decreased by 0.1% points to close at 6.4%, in Q3’2020, from 6.5% at the end of H1’2020. However, during the week, it increased by 0.2% points to close at 6.4%, from the 6.2% recorded the previous week.
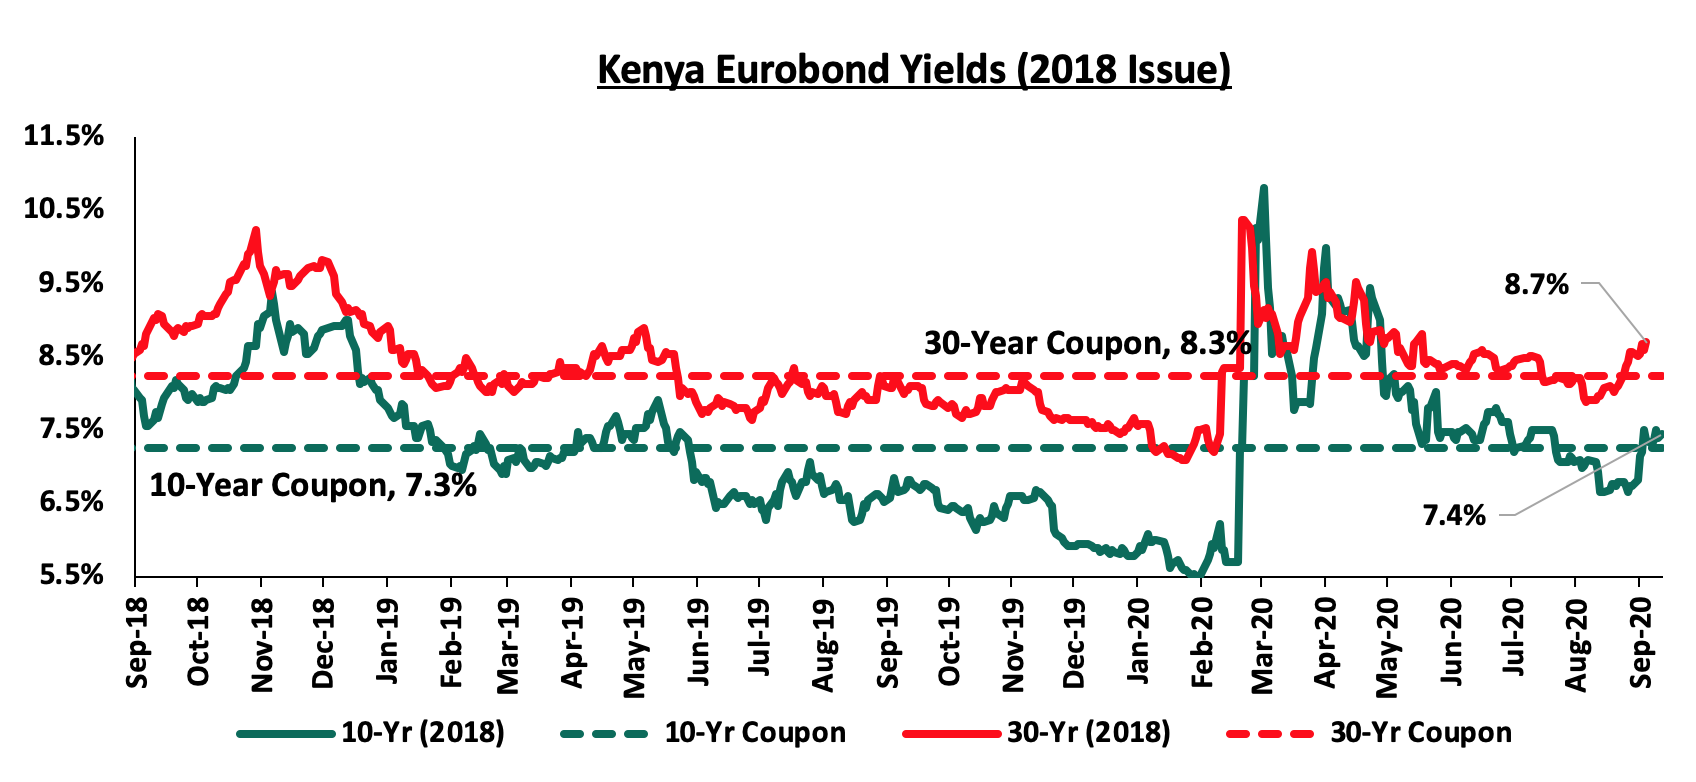
During Q3’2020, the Eurobonds issued in 2018 registered an increase in the yields with 10 year increasing 7.5% from 7.4% in June 2020 while the 30-year increased by 0.3% points to close at 8.6%. During the week, the yield on the 30-year increased marginally by 0.1% points to 8.7%, from the 8.6% recorded last week, while the yield on the 10-year Eurobond remained unchanged at 7.4%.
During Q3’2020, the yields on the 7-year Eurobond issued in 2019 increased marginally by 0.1% points to 7.4% from 7.3% recorded at the close of H1’2020, while that of the 12-year Eurobond remained unchanged at 8.2%. Key to note is that these bonds have 6.6-years and 11.6-years to maturity, respectively. During the week, the yield on the 7-year Eurobond issued in 2019 increased by 0.1% points, to 7.4%, from 7.3% recorded the previous week while the yields on the 12-year Eurobond issued in 2019 remaining unchanged at 8.1% similar to what was recorded the previous week.
Rates in the fixed income market have remained relatively stable due to the high liquidity in the money markets, coupled with the discipline by the Central Bank as they reject expensive bids. The government is 57.1% ahead of its prorated borrowing target of Kshs 130.9 bn having borrowed Kshs 205.7 bn. In our view, the government will not be able to meet their revenue collection targets of Kshs 1.9 tn for FY’2020/2021 because of the current subdued economic performance in the country brought about by the spread of COVID-19, and therefore leading to a larger budget deficit than the projected 7.5% of GDP, ultimately creating uncertainty in the interest rate environment as additional borrowing from the domestic market may be required to plug in the deficit. Owing to this uncertain environment, our view is that investors should be biased towards short-term to medium-term fixed income securities to reduce duration risk.
Markets Performance
In Q3’2020, the equities market recorded mixed performance, with NASI and NSE 25 gaining by 1.6% and 1.3%, respectively, while NSE 20 declined by 4.6%. The equities market performance during the quarter was driven by gains recorded large caps such as BAT, KCB, Equity Group and EABL, which gained by 9.5%, 7.6%, 5.8% and 4.2%, respectively. The gain was however weighed down by losses recorded by other large cap stocks such as Bamburi, Diamond Trust Bank (DTB-K) and NCBA, which declined by 15.9%, 15.2% and 13.4%, respectively.
During the week, the equities market recorded mixed performances, with NSE 20 recording marginal gains of 0.3% while NASI declined by 0.1%. NSE 25 on the other hand, remained unchanged from the previous week. This week’s performance takes the indices YTD performance to losses of 15.7%, 30.2%, and 20.9%, for NASI, NSE 20 and NSE 25, respectively. The NASI performance was driven by losses recorded by large-cap stocks such as ABSA, EABL and Co-operative Bank, which declined by 2.0%, 1.8% and 1.7%, respectively. The decline was however mitigated by gains recorded by other large-cap stocks such as Diamond Trust Bank and Standard Chartered Bank of 2.1% and 0.8%, respectively.
In Q3’2020, equities turnover declined by 5.4% to USD 350.4 mn from USD 370.2 mn in Q2’2020. Foreign investors remained net sellers during the quarter with a net selling position of USD 40.6 mn from a net selling position of USD 91.2 mn in Q2’2020. During the week, equities turnover declined by 55.7% to USD 14.0 mn, from USD 31.7 mn recorded the previous week, taking the YTD turnover to USD 1.2 bn. Foreign investors remained net sellers during the week, with a net selling position of USD 2.8 mn, from a net selling position of USD 3.6 mn recorded the previous week, taking the YTD net selling position to USD 257.2 mn.
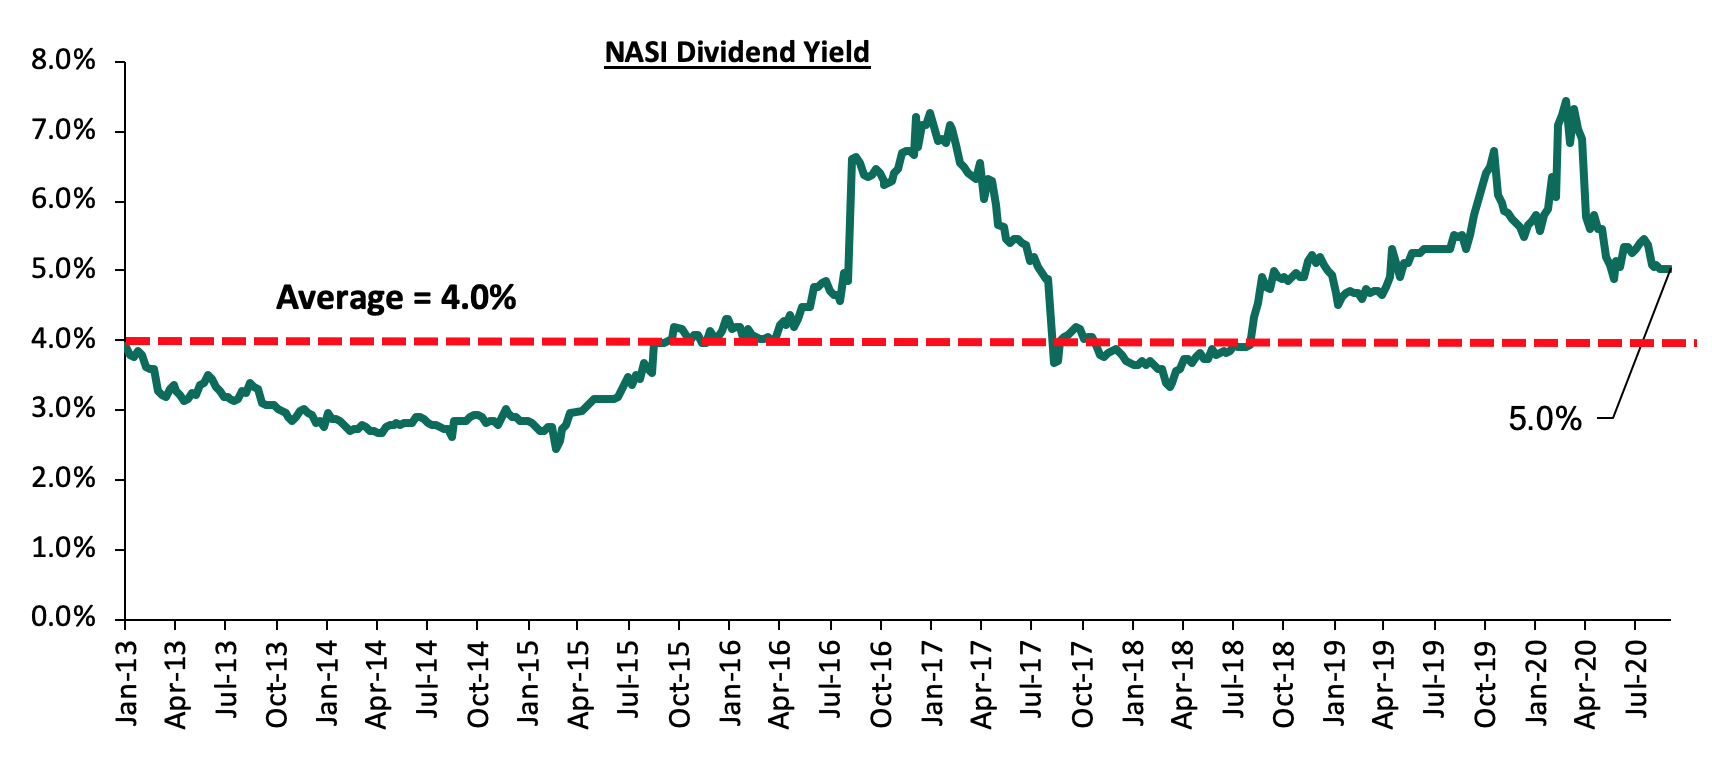
The market is currently trading at a price to earnings ratio (P/E) of 9.2x, 29.4% below the 11-year historical average of 13.0x. The average dividend yield is currently at 5.0%, unchanged from the previous week and 1.0% points above the historical average of 4.0%.
With the market trading at valuations below the historical average, we believe there are pockets of value in the market for investors with higher risk tolerance and are willing to wait out the pandemic. The current P/E valuation of 9.2x is 19.2% above the most recent valuation trough of 7.7x experienced in the first week of August 2020. The charts below indicate the historical P/E and dividend yields of the market.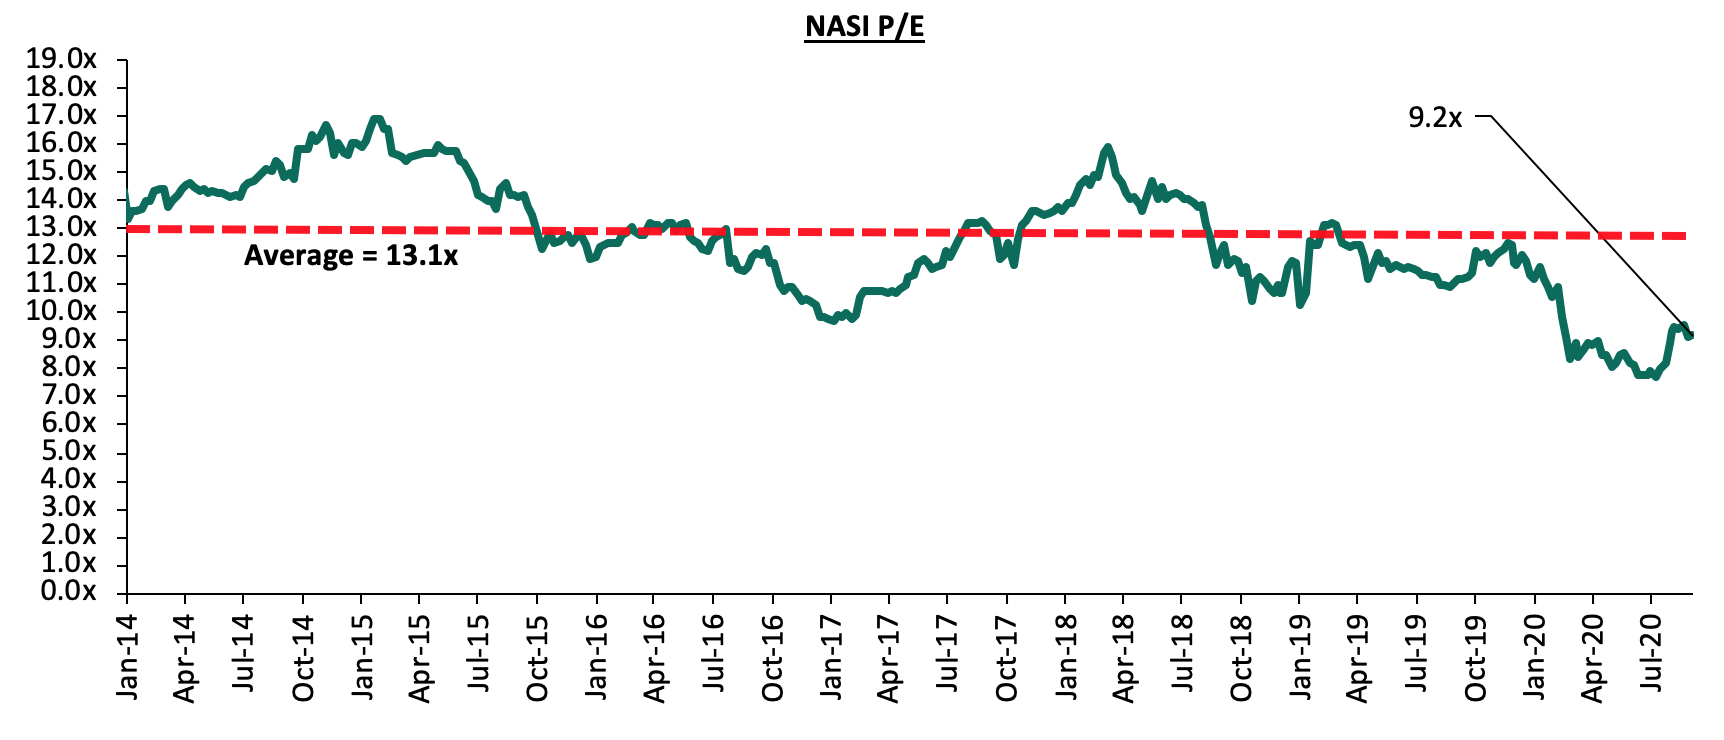
During the third quarter of 2020, listed banks in Kenya released their H1’2020 results, recording a decline in their earnings growth, with their core EPS declining by 33.6%.
Listed Banks H1’2020 Highlights:
The table below highlights the performance of the banking sector, showing the performance using several metrics, and the key take-outs of the performance.
|
Bank |
Core EPS Growth |
Interest Income Growth |
Interest Expense Growth |
Net Interest Income Growth |
Net Interest Margin |
Non-Funded Income Growth |
NFI to Total Operating Income |
Growth in Total Fees & Commissions |
Deposit Growth |
Growth in Government Securities |
Loan to Deposit Ratio |
Loan Growth |
Return on Average Equity |
|
ABSA |
(84.8%) |
0.9% |
(3.3%) |
2.5% |
7.3% |
4.2% |
32.8% |
4.1% |
8.3% |
17.4% |
81.2% |
8.2% |
15.9% |
|
KCB |
(40.4%) |
23.2% |
25.7% |
22.3% |
7.6% |
6.0% |
31.0% |
4.3% |
34.6% |
54.5% |
73.8% |
17.0% |
16.0% |
|
NCBA |
(38.3%) |
9.6% |
7.7% |
11.2% |
3.4% |
28.0% |
47.3% |
61.3% |
9.1% |
24.0% |
63.6% |
4.0% |
8.9% |
|
DTBK |
(36.5%) |
(3.3%) |
(9.0%) |
1.2% |
5.6% |
5.9% |
25.3% |
24.2% |
(0.1%) |
9.8% |
75.2% |
5.6% |
9.8% |
|
SCBK |
(31.3%) |
(6.3%) |
(12.1%) |
(4.6%) |
6.9% |
6.6% |
31.9% |
(5.2%) |
12.3% |
2.1% |
52.4% |
11.9% |
13.7% |
|
Stanbic |
(31.2%) |
(4.8%) |
(3.1%) |
(0.7%) |
4.5% |
(18.8%) |
44.0% |
(36.7%) |
20.6% |
(13.4%) |
81.9% |
32.8% |
10.9% |
|
I&M |
(29.5%) |
3.4% |
9.4% |
(1.4%) |
5.5% |
(7.1%) |
37.8% |
7.7% |
6.4% |
30.1% |
73.1% |
7.2% |
15.4% |
|
Equity |
(24.4%) |
18.5% |
23.6% |
16.9% |
8.1% |
(13.0%) |
36.9% |
(10.8%) |
18.6% |
24.2% |
72.0% |
22.0% |
17.5% |
|
Co-op |
(3.6%) |
6.8% |
(4.4%) |
11.6% |
8.4% |
(5.1%) |
34.3% |
(42.5%) |
18.9% |
28.8% |
70.8% |
5.7% |
18.6% |
|
HF Group |
N/A |
(12.7%) |
(18.20%) |
(3.9%) |
4.3% |
(68.8%) |
22.4% |
42.1% |
15.8% |
13.5% |
97.4% |
(5.8%) |
(3.0%) |
|
H1'20 Mkt Weighted Average* |
(33.6%) |
10.4% |
10.0% |
10.9% |
7.0% |
(1.1%) |
35.2% |
(3.4%) |
18.5% |
25.9% |
71.5% |
14.5% |
15.4% |
|
H1'19Mkt Weighted Average** |
9.0% |
3.7% |
5.3% |
3.8% |
7.7% |
16.5% |
37.2% |
12.7% |
8.6% |
12.1% |
73.8% |
9.8% |
19.3% |
|
*Market-cap-weighted as at 28/08/2020 **Market-cap-weighted as at 06/09/2019 |
|||||||||||||
Key takeaways from the table above include:
- For the first half of 2020, the core Earnings Per Share (EPS) declined by (33.6%) as compared to a 9.0% growth in H1’2019,
- The sector recorded a deposit growth of 18.5% up from the 8.6% growth recorded in H1’2019. Interest expense, on the other hand, grew faster by 10.0%, compared to 5.3% in H1’2019. Cost of funds, however, declined, coming in at a weighted average of 2.9% in H1’2020, from 3.0% in H1’2019, an indication that the sector was able to mobilize cheaper deposits,
- Average loan growth came in at 14.5%, which was faster than the 9.8% recorded in H1’2019, but slower than the 25.9% growth in government securities, an indication of the banks preference of investing in government securities compared to lending to individuals and businesses,
- Interest income rose by 10.4%, compared to a growth of 3.7% recorded in H1’2019. The faster growth in interest income may be attributable to the 16.1% growth in loans and increased allocation to government securities. Despite the rise in interest income, the Yield on Interest Earning Assets (YIEA) declined to 9.7% from the 10.4% recorded in H1’2019, an indication of the increased allocation to lower-yielding government securities by the sector. The decline in the YIEA can also be attributed to the reduced lending rates for customers by the sector, in line with the Central Bank Rate cuts. Consequently, the Net Interest Margin (NIM) now stands at 7.0%, compared to the 7.7% recorded in H1’2019 for the listed banking sector, and,
- Non-Funded Income declined by 1.1% y/y, slower than 16.5% growth recorded in H1’2019. The performance in NFI was on the back of declined growth in fees and commission of 3.4%, which was slower than the 12.7% growth recorded in H1’2019. The slow growth in fees and commission can be attributed to the recent waiver on fees on mobile transactions below Kshs 1,000 and the free bank-mobile money transfer. Banks with a large customer base who rely heavily on mobile money transactions are likely to take the biggest hit.
Quarterly Highlights:
During the quarter:
- Equity Group disclosed it was seeking to raise up to Kshs 50.0 bn in long-term debt from international financiers in the next three years as it seeks to boost its liquidity and capital positions. This is reflective of the trend by local banks, which are increasingly seeking loans from global financiers such as the International Finance Corporation (IFC) and European Investment Bank. For more information, please see Cytonn Weekly #29/2020,
- I&M Holdings PLC issued a cautionary statement to its shareholders on its intention to acquire 90.0% share capital of Orient Bank Limited Uganda (OBL). The transaction will see I&M spend more than Kshs 2.0 bn in the acquisition of the Ugandan Bank, whose book value stood at Ushs 114.1 bn (Kshs 3.3 bn) in FY’2019. For more information, please see Cytonn Weekly #30/2020,
- Equity Group Holdings completed the 66.5% stake acquisition of the Banque Commerciale Du Congo (BCDC) at a cost of USD 95.0 mn (Kshs 10.3 bn). The acquisition was first announced by the group on 18th November 2019 and was subject to approvals from the Central Bank of Kenya (CBK), Democratic Republic of Congo’s Central Bank, and the COMESA Competition Commission. Initially, the deal was to cost USD 105.0 mn (Kshs 11.4 bn), however factoring in the adverse effects of the COVID-19 pandemic on the two economies, the two parties agreed to reduce the amount to USD 95.0 mn (Kshs 10.3 bn). For more information, please see Cytonn Weekly #33/2020,
- Co-operative Bank Kenya completed the 90.0% acquisition of Jamii Bora Bank. As highlighted in our Cytonn Weekly #32/2020, the Central Bank of Kenya approved the acquisition of a 90.0% stake of Jamii Bora’s shareholding by Co-operative Bank, which was to be completed on 21st August 2020 after the deal received all regulatory approvals following approval by the National Treasury on 4th August 2020. For more information, please see Cytonn Weekly #35/2020,
- The Central Bank of Kenya (CBK), directed that banks will have to get approval before declaring dividends for the current financial year, in a bid to ensure that the banks have enough capital that will enable them to respond appropriately to the COVID-19 pandemic. The CBK has given guidance to lenders asking them to revise their ICAAP (Internal Capital Adequacy Assessment Process) based on the pandemic. For more information, please see Cytonn Weekly #35/2020,
- The Capital Markets Authority (CMA) granted African Diaspora Asset Managers (ADAM) Ltd a fund Manager’s License. In the statement by CMA, the fund manager will offer financial products and services such as asset management, wealth management, unit trusts, discretionary portfolio management, etc. and will target clients in the Kenyan markets as well as Africans in the diaspora. This will bring the total number of licensed fund managers to 25. For more information, please see Cytonn Weekly #37/2020,
- The Capital Markets Authority (CMA) published guidelines to Collective Investments Schemes on the valuation, performance measurement and reporting. CMA highlighted that given the inconsistencies in the performance measurement and presentation by the fund managers, there was a need for standardization by the Collective Investment Schemes in order to enhance the comparability and consistency of the information presented across the sector. The guidance will be applicable to all approved Collective Investment Schemes and will take effect on 1st January 2021. For more information, please see Cytonn Weekly #38/2020
Weekly Highlights:
During the week, Jubilee Holdings Limited disclosed that it had entered into an agreement with Allianz Africa Holding, one of the world’s leading insurers and asset managers, to establish a strategic partnership in regards to Jubilee’s short-term insurance business operations in its countries of operations. In the press release, Jubilee discloses that Allianz will acquire a controlling stake ranging from 51.0% - 66.0% in each of Jubilee’s operating subsidiaries engaged in short-term general insurance in Kenya, Uganda, Tanzania, Burundi and Mauritius. The total net consideration for the transaction will be Kshs 10.8 bn of which Kshs 7.8 bn will be received by Jubilee Holdings. Key to note, the transaction does not include Jubilee’s Life business or Medical Insurance Business in Kenya, Uganda and Tanzania. Following the transaction, Jubilee will be a minority stake holder in each of the acquired subsidiaries. As of H1’2020, the general insurance subsidiaries contributed Kshs 4.0 bn to the group’s total assets, and as such, this transaction will translate to a trading multiple of 2.7x Price to Book. The proposed transaction will be subject to Jubilee’s shareholders’ approval, regulatory approval in the 5 countries i.e. Kenya, Tanzania, Uganda, Burundi and Mauritius as well as the completion of the restructuring of the Ugandan and Tanzanian entities. In our view, the partnership is a commendable move by Jubilee as this will see the group broaden its insurance markets across Africa and also leverage on Allianz’s expertise in the insurance industry. Additionally, we believe that the Kshs 7.8 bn receivable by Jubilee from the transaction will see Jubilee invest the cash in the expansion of its business in line with its corporate strategy of offering innovative, affordable and technically advanced products to the market.
Universe of Coverage:
|
Company |
Price at 25/09/2020 |
Price at 02/10/2020 |
w/w change |
q/q change |
YTD Change |
Year Open |
Target Price* |
Dividend Yield |
Upside/ Downside** |
P/TBv Multiple |
Recommendation |
|
Diamond Trust Bank*** |
60.0 |
61.3 |
2.1% |
(15.2%) |
(43.8%) |
109.0 |
119.4 |
3.9% |
98.9% |
0.3x |
Buy |
|
Kenya Reinsurance |
2.3 |
2.4 |
3.0% |
12.1% |
(20.8%) |
3.0 |
4.0 |
4.6% |
71.3% |
0.2x |
Buy |
|
Sanlam |
13.1 |
12.5 |
(4.6%) |
(3.7%) |
(27.3%) |
17.2 |
18.4 |
0.0% |
47.2% |
1.2x |
Buy |
|
I&M Holdings*** |
44.4 |
43.6 |
(1.9%) |
(11.5%) |
(19.4%) |
54.0 |
57.8 |
5.1% |
37.8% |
0.7x |
Buy |
|
NCBA*** |
23.1 |
22.7 |
(1.7%) |
(13.4%) |
(38.5%) |
36.9 |
30.7 |
1.0% |
36.5% |
0.6x |
Buy |
|
KCB Group*** |
38.9 |
38.5 |
(1.0%) |
7.6% |
(28.7%) |
54.0 |
46.4 |
9.9% |
30.4% |
0.8x |
Buy |
|
Standard Chartered*** |
159.8 |
161.0 |
0.8% |
(5.7%) |
(20.5%) |
202.5 |
197.2 |
7.8% |
30.3% |
1.2x |
Buy |
|
Co-op Bank*** |
11.9 |
11.7 |
(1.7%) |
(2.5%) |
(28.4%) |
16.4 |
14.2 |
8.4% |
29.8% |
0.8x |
Buy |
|
Equity Group*** |
36.1 |
36.0 |
(0.4%) |
5.8% |
(32.8%) |
53.5 |
44.5 |
5.9% |
29.7% |
0.9x |
Buy |
|
Liberty Holdings |
7.8 |
7.6 |
(2.1%) |
(5.0%) |
(26.4%) |
10.4 |
9.8 |
0.0% |
28.6% |
0.6x |
Buy |
|
ABSA Bank*** |
10.0 |
9.8 |
(2.0%) |
(1.8%) |
(26.6%) |
13.4 |
10.8 |
12.0% |
22.2% |
1.2x |
Buy |
|
Britam |
7.2 |
7.4 |
2.5% |
(2.1%) |
(17.6%) |
9.0 |
8.6 |
3.3% |
19.2% |
0.8x |
Accumulate |
|
Stanbic Holdings |
76.0 |
80.0 |
5.3% |
(3.3%) |
(26.8%) |
109.3 |
84.9 |
9.0% |
15.1% |
0.6x |
Accumulate |
|
Jubilee Holdings |
220.0 |
291.8 |
32.6% |
0.0% |
(16.9%) |
351.0 |
313.8 |
3.6% |
11.1% |
0.5x |
Accumulate |
|
HF Group |
4.0 |
4.0 |
(0.5%) |
(10.0%) |
(38.2%) |
6.5 |
4.1 |
0.0% |
2.8% |
0.2x |
Lighten |
|
CIC Group |
2.1 |
2.2 |
5.8% |
(7.9%) |
(18.3%) |
2.7 |
2.1 |
0.0% |
(4.1%) |
0.7x |
Sell |
|
*Target Prices as per Cytonn Analyst estimates **Upside/ (Downside) is adjusted for Dividend Yield ***For disclosure, there are banks in which Cytonn and/or its affiliates are invested in |
|||||||||||
We are “Neutral” on equities for investors because, despite the sustained price declines, which have seen the market P/E decline to below its historical average presenting investors with attractive valuations in the market, the economic outlook remains grim.
During Q3’2020, the real estate sector recorded a decline in transactions evidenced by the 0.7% points decline in annual uptake of residential units from 18.6% in H1’2020 to 17.9%, while the commercial office sector registered 0.4% points decline in occupancy rates from 80.3% to 79.9%, attributed to the ongoing pandemic. Key challenges that have affected the performance of the sector during the Q3’2020 include;
- Lower purchasing power as people have lost their jobs,
- Travel restrictions which mainly affected the performance of the hospitality sector,
- Business restructuring with some firms downsizing,
- Constrained financing for developers, and,
- The existing oversupply in the commercial office and retail sectors, with a surplus of 6.3 mn SQFT and 2.0 mn SQFT, respectively.
In the long run, we expect the performance of the sector to be cushioned by;
- Improved access to mortgage loans especially through the Kenya Mortgage Refinancing Company (KMRC),
- Continued investor focus on affordable housing,
- Positive demographics,
- Easing of travel restrictions which is expected to boost the performance of the hospitality sector, and,
- Improving infrastructure such as the launch of a 12 kilometer new sewer line in Ruiru thus supporting development.
Sectoral Market Performance:
- Residential Sector
During Q3’2020, apartments registered relatively higher average total returns to investors at 5.4% compared to detached houses at 4.2%, attributed to higher demand as people downsize due reduced disposable income. Price appreciation in the market remained subdued with both detached units and apartments recording declines to (0.1%) during the quarter.
|
Residential Performance Summary Q3’2020 |
|||||||||
|
Segment |
Average Rental Yield Q3'2020 |
Average Y/Y Price Appreciation Q3'2020 |
Average Total Returns Q3'2020 |
Average Rental Yield H1'2020 |
Average Y/Y Price Appreciation H1'2020 |
Average Total Returns H1'2020 |
Change in Rental Yield (% Points) |
Change in Price Appreciation (% Points) |
Change in Total Returns (% Points) |
|
Detached Units |
|||||||||
|
High End |
3.7% |
0.0% |
3.7% |
4.2% |
0.0% |
4.2% |
(0.5%) |
0.0% |
(0.5%) |
|
Upper Mid-End |
4.7% |
0.2% |
4.9% |
4.9% |
1.4% |
6.2% |
(0.2%) |
(1.2%) |
(1.3%) |
|
Satellite Towns |
4.3% |
(0.4%) |
3.9% |
4.8% |
(0.4%) |
4.4% |
(0.5%) |
0.0% |
(0.5 %) |
|
Average |
4.2% |
(0.1%) |
4.2% |
4.6% |
0.3% |
5.0% |
(0.4%) |
(0.4%) |
(0.8%) |
|
Apartments |
|||||||||
|
Upper Mid-End |
5.1% |
(0.3%) |
4.7% |
5.4% |
(0.7%) |
4.6% |
(0.3%) |
0.4% |
0.1% |
|
Lower Mid-End: Suburbs |
5.7% |
0.1% |
5.8% |
5.7% |
0.3% |
6.1% |
0.0% |
(0.2%) |
(0.3%) |
|
Lower Mid-End: Satellite Towns |
5.6% |
0.0% |
5.7% |
5.4% |
(0.1%) |
5.3% |
0.2% |
0.1% |
0.4% |
|
Average |
5.5% |
(0.1%) |
5.4% |
5.5% |
(0.2%) |
5.3% |
0.0% |
0.1% |
0.1% |
|
|||||||||
Source: Cytonn Research
- Detached Units Performance
Detached units registered an overall drop in performance in Q3’2020 with average total returns coming in at 4.2% ,0.8% points lower than 5.0% recorded in H1’2020. The decline in returns is attributed to a decline in asking prices by (0.1%) owing to a decline in demand for units amid a tough economic environment. The average price per SQM came in at Kshs 132,540 from Kshs 135,042 in H1’2020 as developers were forced to offer price discounts to attract homebuyers. Rental yields recorded a marginal drop of 0.4% points, coming in at 4.2% from 4.6% in H1’2020 attributed to a decline in rental rates in a bid to attract tenants.
The upper mid- end market recorded average total returns of 4.9%, 0.7% points higher than the detached market average of 4.2% with Ridgeways and Runda-Mumwe being the best performing nodes, posting total returns of 8.4%, 7.4%, respectively, attributable to the areas’ appeal to the growing middle-class pre-COVID. The high-end market registered a relatively low rental yield of 3.7% compared to 4.7% and 4.3% in the upper and lower mid- end segments, respectively attributable to reduced occupancy rates, following the shift to relatively affordable housing options and relocation of expatriates to their home countries due to the pandemic. Karen submarket recorded the highest decline in returns attributable to the relatively low rental prices which dropped from Kshs 756 per SQM in H1’2020 to Kshs 698 per SQM, and a 9.4% points decline in occupancy rates from 83.7% H1’2020 to 74.3%, thus a resultant low rental yield which came in at 3.2% compared to the 4.1% in H1’2020.
(All Values in Kshs unless stated otherwise)
|
Detached Units Performance Q3'2020 |
||||||||
|
Area |
Average Price per SQM Q3'2020 |
Average Rent per SQM Q3'2020 |
Average Occupancy Q3'2020 |
Average Uptake Q3'2020 |
Average Annual Uptake Q3'2020 |
Average Rental Yield Q3'2020 |
Average Price Appreciation Q3'2020 |
Total Returns Q3'2020 |
|
High-End |
||||||||
|
Rosslyn |
172,556 |
830 |
82.9% |
92.5% |
14.0% |
4.5% |
0.0% |
4.5% |
|
Runda |
200,463 |
836 |
89.7% |
98.0% |
12.6% |
4.1% |
0.4% |
4.5% |
|
Kitisuru |
204,374 |
734 |
87.5% |
85.4% |
20.4% |
4.2% |
0.0% |
4.2% |
|
Karen |
186,982 |
698 |
74.3% |
83.8% |
17.1% |
3.2% |
(0.5%) |
2.7% |
|
Lower Kabete |
149,267 |
478 |
60.6% |
77.5% |
21.0% |
2.4% |
0.3% |
2.7% |
|
Average |
182,728 |
715 |
79.0% |
87.5% |
17.0% |
3.7% |
0.0% |
3.7% |
|
Upper Mid-End |
||||||||
|
Ridgeways |
143,915 |
682 |
88.6% |
100.0% |
17.8% |
5.4% |
3.0% |
8.4% |
|
Runda Mumwe |
134,104 |
706 |
89.9% |
91.7% |
20.7% |
4.8% |
2.6% |
7.4% |
|
South B/C |
120,061 |
556 |
94.7% |
98.6% |
18.6% |
5.2% |
1.2% |
6.4% |
|
Loresho |
138,123 |
554 |
94.8% |
98.5% |
14.8% |
4.3% |
(1.1%) |
3.2% |
|
Langata |
144,975 |
603 |
87.4% |
95.7% |
12.3% |
4.2% |
(2.2%) |
2.0% |
|
Lavington |
156,142 |
720 |
84.3% |
97.9% |
18.8% |
4.4% |
(2.6%) |
1.8% |
|
Average |
139,553 |
637 |
90.0% |
97.1% |
17.2% |
4.7% |
0.2% |
4.9% |
|
Lower Mid-End |
||||||||
|
Ruiru |
82,706 |
392 |
92.6% |
92.6% |
20.8% |
4.8% |
0.2% |
5.0% |
|
Ngong |
59,333 |
283 |
83.0% |
78.8% |
13.7% |
4.4% |
0.3% |
4.7% |
|
Syokimau/Mlolongo |
71,607 |
276 |
75.2% |
64.8% |
13.6% |
3.8% |
0.7% |
4.4% |
|
Athi River |
82,873 |
334 |
82.1% |
98.1% |
19.0% |
4.1% |
0.2% |
4.3% |
|
Donholm & Komarock |
91,204 |
358 |
88.3% |
89.9% |
18.8% |
4.2% |
(0.5%) |
3.7% |
|
Thika |
65,735 |
320 |
97.5% |
87.5% |
11.2% |
4.4% |
(1.5%) |
2.9% |
|
Kitengela |
73,901 |
308 |
95.0% |
86.4% |
17.9% |
4.7% |
(2.3%) |
2.4% |
|
Average |
75,337 |
324 |
87.7% |
85.4% |
16.4% |
4.3% |
(0.4%) |
3.9% |
Cytonn Research 2020
- Apartments Performance
Apartments posted a marginal increase in total returns averaging 5.4% in Q3’2020, 0.3% points higher than 5.1% in H1’2020. This is attributed to slight decrease in prices by 0.1% compared to 0.2% in H1’2020.
The lower mid-end suburbs registered the highest average occupancy rates at 90.8% compared to 84.5% and 87.1% in upper mid-end and satellite towns, respectively. This is attributed to the areas attracting a working population due to their proximity to key commercial nodes such as CBD, Kilimani and Upperhill.
The upper mid-end markets registered the lowest returns to investors at 4.7%, 0.8% points lower than the apartments market average of 5.5% and this is attributed to relatively lower rental yields that came in at 5.1%, and relatively low average occupancy rate at 84.5%, attributed to the decline in foreign expatriates who are the main clientele.
Prices in the lower mid-end satellite towns remained flat, as more people opted to rent in areas such as Athi River and Kitengela where housing is relatively affordable yet offering amenities, at a time when disposable income for potential buyers has continued to be affected by liquidity pressures amidst slow economic growth.
(All Values in Kshs unless stated otherwise)
|
Apartments Performance Q3’2020 |
||||||||
|
Area |
Average Price Per SQM Q3'2020 |
Average Rent per SQM Q3'2020 |
Average Occupancy Q3'2020 |
Average Uptake Q3'2020 |
Average Annual Uptake Q3'2020 |
Average Rental Yield Q3'2020 |
Average Price Appreciation Q3'2020 |
Total Returns Q3'2020 |
|
Upper Mid-End |
||||||||
|
Loresho |
112,601 |
541 |
90.0% |
89.0% |
11.4% |
5.4% |
0.8% |
6.1% |
|
Westlands |
172,924 |
775 |
88.2% |
88.1% |
23.3% |
5.8% |
(0.2%) |
5.6% |
|
Parklands |
116,456 |
613 |
91.1% |
81.5% |
15.3% |
5.2% |
0.2% |
5.4% |
|
Kileleshwa |
128,500 |
662 |
79.2% |
84.2% |
18.8% |
4.7% |
(0.5%) |
4.2% |
|
Upperhill |
130,030 |
741 |
71.6% |
77.3% |
18.2% |
4.0% |
0.0% |
4.0% |
|
Kilimani |
134,924 |
904 |
87.0% |
82.3% |
27.3% |
5.3% |
(2.3%) |
2.9% |
|
Average |
132,573 |
706 |
84.5% |
83.7% |
19.0% |
5.1% |
(0.3%) |
4.7% |
|
Lower Mid-End: Suburbs |
||||||||
|
South C |
111,827 |
681 |
97.7% |
68.3% |
19.2% |
6.6% |
1.0% |
7.6% |
|
Dagoretti |
92,925 |
500 |
85.4% |
90.1% |
25.9% |
5.4% |
1.0% |
6.4% |
|
Imara Daima |
78,060 |
421 |
89.4% |
74.0% |
12.9% |
5.6% |
(0.2%) |
5.3% |
|
Langata |
92,718 |
416 |
89.9% |
81.1% |
18.0% |
5.1% |
0.1% |
5.1% |
|
Donholm & Komarock |
71,993 |
396 |
91.3% |
92.3% |
16.6% |
5.8% |
(1.3%) |
4.6% |
|
Average |
89,504 |
483 |
90.8% |
81.2% |
18.5% |
5.7% |
0.1% |
5.8% |
|
Lower Mid-End: Satellite Towns |
||||||||
|
Thindigua |
110,224 |
590 |
96.4% |
93.2% |
18.8% |
5.8% |
2.3% |
8.1% |
|
Syokimau |
69,225 |
362 |
88.3% |
79.9% |
14.2% |
5.5% |
1.4% |
6.8% |
|
Ruiru |
89,781 |
495 |
76.4% |
60.7% |
20.4% |
5.0% |
1.3% |
6.2% |
|
Kikuyu |
81,090 |
416 |
86.0% |
84.4% |
26.5% |
5.7% |
0.1% |
5.8% |
|
Athi River |
58,311 |
340 |
84.6% |
90.1% |
15.3% |
6.2% |
(1.8%) |
4.4% |
|
Kitengela |
60,027 |
325 |
88.1% |
99.5% |
13.6% |
6.0% |
(1.7%) |
4.3% |
|
Ruaka |
100,215 |
520 |
89.9% |
86.2% |
25.6% |
5.3% |
(1.3%) |
4.0% |
|
Average |
81,268 |
436 |
87.1% |
84.8% |
19.2% |
5.6% |
0.0% |
5.7% |
Cytonn Research 2020
The following are the key highlights during Q3’2020 (See Cytonn Monthly - July 2020 and Cytonn Monthly - August 2020 Residential Sector highlights);
- Nairobi Metropolitan Services Director of Housing, Charles Sikuku announced that 1,562 low-cost housing units within the government’s affordable housing Pangani Estate were set for completion in December 2020. For more information, see Cytonn Weekly #38/2020,
- Kenya Mortgage and Refinance Company (KMRC), a Treasury backed lender, announced plans to lend approximately Kshs 37.2 bn to Kenyans earning a maximum of Kshs 150,000 per month and seeking to purchase affordable housing units. The mortgage loans will be capped at Kshs 4.0 mn for those seeking residence within the Nairobi Metropolitan Area (NMA) which also covers Kiambu, Machakos and Kajiado and at Kshs 3.0 mn for all other areas outside the NMA. For more information, see Cytonn Weekly #38/2020,
- NCBA Bank Kenya Plc, partnered with Tatu City, to provide mortgage facilities to home buyers within their mixed-use development. The mortgage financing, which will be available for both salaried and non-salaried individuals, is expected to be at an interest rate of 13.0% with a minimum deposit rate of 10.0% of the property value. For more information, see Cytonn Weekly #39/2020, and,
- Harambee Sacco became the first lender to offer mortgages at an annual subsidized interest of 7.0% under Kenya Mortgage and Refinance Company’s home loans refinancing plan. Each beneficiary will be expected to pay a 10.0% deposit for a mortgage ranging from Kshs 500,000 to a maximum of Kshs 4.0mn and those who qualify for the subsidized loans will have to top up their loans with commercial credit should they seek a home priced above the Kshs 4.0 mn.
We expect the residential sector to record increased activities during the last quarter driven by the ongoing affordable housing projects, and the licensing of Kenya Mortgage Refinance Company (KMRC) which will avail relatively affordable mortgage facilities thus complement government effort in enhancing affordable home ownership.
- Commercial Office Sector
In Q3’2020, the commercial office sector recorded a decline of 0.4% and 0.3% points in average occupancy rates, and rental yield to 79.9%, and 7.2% from 80.3% and 7.5%, respectively in FY’2019. The decline is attributed to ongoing COVID-19 pandemic which has resulted in reduced demand for office spaces as businesses restructure their operations leading to the scaling down by some firms while others adopt working from home strategies. The asking rents also declined by 1.9% to an average of Kshs 94.2 per SQFT in Q3’2020 from Kshs 96.0 per SQFT in FY’2019 while the asking price declined by 1.3% to Kshs 12,497 per SQFT in Q3’2020 from Kshs 12,638 per SQFT in FY’2019. The decline in asking rent and prices is attributed to the financial strain amid tough economic times which has resulted in landlords’ willingness to close deals faster by giving incentives such as discounts to either attract tenants or to retain the already existing ones.
The table below highlights the performance of the Nairobi Metropolitan Area (NMA) Commercial Office sector over time:
(All values in Kshs unless stated otherwise)
|
Nairobi Metropolitan Area (NMA) Commercial Office Returns Over Time |
||||||||
|
Year |
Q1' 2019 |
H1' 2019 |
Q3' 2019 |
FY' 2019 |
Q1’2020 |
H1’2020 |
Q3' 2020 |
∆ FY'2019/
Q3 '2020 |
|
Occupancy % |
82.4% |
81.0% |
80.5% |
80.3% |
81.7% |
80.0% |
79.9% |
(0.4%) |
|
Asking Rents (Kshs/SQFT) |
100.3 |
96.6 |
96.0 |
96.0 |
96.7 |
95.1 |
94.2 |
(1.9%) |
|
Average Prices (Kshs/SQFT) |
12,574 |
12,637 |
12,638 |
12,638 |
12,535 |
12,516 |
12,479 |
(1.3%) |
|
Average Rental Yields (%) |
8.0% |
7.8% |
7.7% |
7.5% |
7.8% |
7.3% |
7.2% |
(0.3% ) |
|
||||||||
Source: Cytonn Research
Gigiri, Westlands and Karen were the best performing submarkets in Q3’2020 recording rental yields of 9.0%, 8.1%, and, 8.1%, respectively, attributed to the relatively good infrastructure mainly the road networks easing access to the areas and exclusivity of the areas with high quality offices thus attracting high- end clients and premium rental prices.
Most of the office nodes recorded a decline in occupancy rates apart from Gigiri, Parklands, and, Karen which recorded an increase of 4.2%, 1.0%, and, 2.1% points, respectively indicating increase in demand attributed to undersupply of quality office space in the areas.
Mombasa Road was the worst performing area recording 4.9% average rental yield in Q3’2020, 0.6% points lower than 5.5% FY’2019, attributed to the low asking price of Kshs 74.5 per SQFT lower than the market average asking rent of Kshs 94.2 Per SQFT, traffic congestion, and zoning regulations as Mombasa Road is mainly an industrial area thus making it unattractive to firms.
The table below shows the Nairobi Metropolitan Area (NMA) sub-market performance:
(All values in Kshs unless stated otherwise)
|
NMA Commercial Office Submarket Performance Q3’2020 |
|||||||||||
|
Location |
Price Kshs/ SQFT Q3'2020 |
Rent Kshs/SQFT Q3'2020 |
Occupancy Q3'2020(%) |
Rental Yield (%) Q3 '2020 |
Price Kshs/ SQFT FY’2019 |
Rent Kshs/SQFT FY’2019 |
Occupancy FY 2019(%) |
Rental Yield (%) FY 2019 |
∆ in Rent |
∆ in Occupancy (% points) |
∆ in Rental Yields (% points) |
|
Gigiri |
13,400 |
118.0 |
84.6% |
9.0% |
13,833 |
117.0 |
80.4% |
9.2% |
0.9% |
4.2% |
(0.2%) |
|
Westlands |
12,262 |
103.9 |
78.9% |
8.1% |
12,370 |
104.0 |
80.3% |
8.3% |
(0.1%) |
(1.4%) |
(0.2%) |
|
Karen |
13,665 |
107.8 |
86.3% |
8.1% |
13,665 |
111.0 |
85.3% |
8.3% |
(2.9%) |
1.0% |
(0.2%) |
|
Parklands |
11,794 |
92.5 |
85.2% |
8.0% |
12,369 |
97.0 |
83.1% |
8.2% |
(4.6%) |
2.1% |
(0.2%) |
|
UpperHill |
12,592 |
92.8 |
79.9% |
7.1% |
12,397 |
98.0 |
80.0% |
7.5% |
(5.3%) |
(0.1%) |
(0.4%) |
|
Nairobi CBD |
12,200 |
82.7 |
84.6% |
6.9% |
12,425 |
89.0 |
85.6% |
7.1% |
(7.1%) |
(1.0%) |
(0.2%) |
|
Kilimani |
12,546 |
93.9 |
79.6% |
6.8% |
12,680 |
91.0 |
80.9% |
7.1% |
3.1% |
(1.3%) |
(0.3%) |
|
Thika Road |
12,500 |
81.7 |
76.3% |
6.0% |
12,600 |
84.0 |
80.4% |
6.3% |
(2.8%) |
(4.2%) |
(0.3%) |
|
Mombasa road |
11,350 |
74.5 |
63.9% |
4.9% |
11,400 |
73.0 |
66.5% |
5.5% |
2.1% |
(2.6%) |
(0.6%) |
|
Average |
12,479 |
94.2 |
79.9% |
7.2% |
12,638 |
96.0 |
80.3% |
7.5% |
(1.9%) |
(0.4%) |
(0.3%) |
Source: Cytonn research
Notable highlights during Q3’2020 include;
- Industrial and Development Corporation (ICDC), a Kenyan government owned development finance institution, completed the purchase of Development Bank-owned Finance House building, located along Loita Street in Nairobi’s CBD, for Kshs 1.2 bn. For more information, see Cytonn Weekly #34/2020.
We retain a negative outlook for the NMA commercial office sector attributed to the existing oversupply, amid the COVID-19 pandemic which has resulted to a shift in demand for office spaces as some firms downsize due to financial constraints while others continue embracing working from home leaving office spaces unoccupied. Landlords are expected to continue adopting strategies to attract and retain tenants such as giving discounts and better bargaining terms leaving tenants with a higher bargaining power and as such, we expect a further decline in rental prices. The best areas of focus for investors are Gigiri, Westlands and Karen where returns are relatively high compared to the market averages in addition to the existing undersupply of quality space.
- Retail Sector
The retail sector performance recorded a 0.4% decline in rental yields to 7.4% in Q3’2020 from 7.8% in FY’2019. The average occupancy dropped by 1.7% points from 75.9% in FY’2020 to 74.2% in Q3’2020, while the average monthly rent rates declined by 3.8% to Kshs 169.0 per SQFT from Kshs 175.6 per SQFT in FY’2019. The decline in the performance of the retail sector is attributed to; i) exit by some retailers to cushion themselves against the impact of the COVID-19 pandemic, ii) growing focus on e-commerce thus reduced demand for physical space, iii) reduced consumer spending power attributed to the tough economic environment, and, iv) the existing oversupply of retail space in certain locations which has resulted in pressure on landlords to provide concessions and other incentives to attract new clientele or retain existing tenants.
The table below shows the performance of the retail sector in Nairobi over time:
(All values in Kshs unless stated otherwise)
|
Summary Of Retail Performance Over Time |
|||||||||
|
Item |
Q1' 2019 |
H1' 2019 |
Q3' 2019 |
FY' 2019 |
Q1’2020 |
H1’2020 |
Q3' 2020 |
∆ Y/Y |
∆ FY’2019/ Q3’2020 |
|
Average Asking Rents (Kshs/SQFT) |
174.3 |
170 |
167 |
175.6 |
172.7 |
170.3 |
169.0 |
1.2% |
(3.8%) |
|
Average Occupancy (%) |
76.8% |
75.6% |
74.5% |
75.9% |
76.3% |
74.0% |
74.2% |
(0.3%) points |
(1.7%) points |
|
Average Rental Yields |
8.5% |
8.2% |
8.0% |
7.8% |
7.7% |
7.4% |
7.4% |
(0.6%) points |
(0.4%) points |
|
|||||||||
Source: Cytonn Research
In terms of the sub markets analysis, Westlands and Karen were the best performing nodes recording average rental yields of 9.7% and 9.3%, respectively, compared to the overall market average of 7.4%, the performance is attributed to presence of affluent residents who have a high consumer purchasing power with the areas hosting high end income earners, the ease of access to the areas and relatively high occupancy rates of above 78.5% against the market average of 74.2%.
Eastlands and Satellite Towns recorded the lowest yields of 5.9% and 5.6%, respectively, attributed to low rental charges of Kshs 135.8 and Kshs 129.0 per SQFT, respectively, against the market average of Kshs 168.0, constrained consumer spending, and competition from informal retail spaces.
(All values in Kshs unless stated otherwise)
|
Nairobi Retail Market Performance Q3’2020 |
|||||||||
|
Area |
Rent Kshs/SQFT Q3’ 2020 |
Occupancy Q3’2020 |
Rental Yield Q3'2020 |
Rent Kshs/SQFT FY’ 2019 |
Occupancy FY’ 2019 |
Rental Yield FY’ 2019 |
Q3’ 2020 ∆ in Rental Rates |
Q3’ 2020 ∆ in Occupancy (% points) |
Q3’ 2020 ∆ in Rental Yield (% points) |
|
Westlands |
205.0 |
81.0% |
9.7% |
215.0 |
82.8% |
10.3% |
(4.7%) |
(1.8%) |
(0.6%) |
|
Karen |
219.5 |
78.5% |
9.3% |
222.0 |
80.0% |
9.5% |
(1.1%) |
(1.5%) |
(0.2%) |
|
Kilimani |
172.5 |
81.0% |
8.5% |
167.0 |
87.4% |
8.8% |
3.3% |
(6.4%) |
(0.3%) |
|
Ngong Road |
181.3 |
80.6% |
8.3% |
181.0 |
80.5% |
8.3% |
0.1% |
0.1% |
0.0% |
|
Kiambu road |
176.5 |
65.3% |
6.8% |
180.0 |
67.6% |
7.2% |
(1.9%) |
(2.3%) |
(0.4%) |
|
Thika Road |
160.4 |
68.4% |
6.2% |
173.0 |
72.8% |
7.1% |
(7.3%) |
(4.4%) |
(0.9%) |
|
Mombasa road |
140.6 |
71.0% |
6.0% |
156.0 |
66.8% |
6.3% |
(9.9%) |
4.2% |
(0.3%) |
|
Eastlands |
135.8 |
69.1% |
5.9% |
150.0 |
71.7% |
6.8% |
(9.4%) |
(2.6%) |
(0.9%) |
|
Satellite towns |
129.0 |
72.9% |
5.6% |
136.0 |
73.3% |
5.9% |
(5.1%) |
(0.4%) |
(0.3%) |
|
Average |
169.0 |
74.2% |
7.4% |
175.6 |
75.9% |
7.8% |
(4.0%) |
(1.7%) |
(0.4%) |
Source: Cytonn research
Notable highlights during the quarter include;
- Artcaffe, a local restaurant chain, opened its third store in Nairobi’s Central Business District (CBD), located in Chester House, along Kimathi Street marking its 30th branch in Kenya. For more information, see Cytonn Weekly #29/2020,
- L.C Waikiki, a Turkish fashion retailer, opened a new store in Nairobi Mega Mall along Uhuru Highway, Nairobi, marking the retailer’s 7th branch locally since opening its first store in 2017. For more information, see Cytonn Monthly-July 2020,
- Naivas Supermarket, opened its 64th store along Mombasa Road opposite the Syokimau Railway station dubbed Naivas Airport View. Additionally, the management of the Waterfront Mall, Karen and Naivas Supermarket, signed an agreement that will see the retailer take up space that was previously occupied by Shoprite at the mall bringing the total number of stores in operation to 65. For more information, see Cytonn Monthly-July 2020 ,and, Cytonn Weekly #39/2020,
- South African Retailer, Shoprite, announced plans to exit the Kenya retail market barely two years since its entry, citing underperformance of its branches. This is after the closure of its branch in Nyali Mombasa, effective 31st August, revealing that trading at the branch was not viable. For more information, see Cytonn Weekly #32/2020, and, Cytonn Weekly #37/2020,
- Massmart, a South Africa retail chain opened a Kshs 500.0 mn building material outlet dubbed Builders Warehouse in Karen’s Waterfront Mall bringing the retailer’s total number of outlets in Kenya to 3. For more information, see Cytonn Weekly #34/2020,
- Tuskys Supermarket was forced to shut down several outlets, among them being branches located at the Juja City Mall in Juja, Nairobi’s Greenspan Mall in Donholm, Kisumu branch at the United Mall and Eldoret branches located along Uganda Road and Komora Plaza due to rent arrears. For more information, see Cytonn Weekly #34/2020, Cytonn Weekly #35/2020, Cytonn Weekly #37/2020, and, Cytonn Weekly #38/2020,
- The board of directors of Tuskys, confirmed that they had signed terms of agreement with an undisclosed Mauritius-based private equity fund for the provision of a financing facility amounting to approximately Kshs 2.0 bn. So far the retailer has allegedly received Kshs 500.0 mn of the funds aimed at easing the financial pressure and stabilizing its operations. For more information, see Cytonn Weekly #35/2020, and, Cytonn Weekly #39/2020,
- Deacons East Africa Limited, a fashion and clothing retailer, is set to shut down its operations in East Africa, announcing the sale of its business and assets after 60 years in the fashion and clothing industry, due to constrained cash flows. For more information, see Cytonn Weekly #37/2020,
- Carrefour announced plans to open three stores in Mombasa, to be located at City Mall in Nyali, Center Point Plaza in Diani and Shanzu Mall in Shanzu. For more information see, Cytonn Weekly #39/2020, and,
- Optica, a local eye-wear retailer, opened its 42nd Kenyan outlet at the Thika Road Mall (TRM), Nairobi, as part of the retailer’s expansion strategy. The entry of the retailer to the TRM mall is supported by i) strategic positioning of the mall attracting people from the neighboring areas of Kasarani, ii) relatively good infrastructure thus ease of access, and, iii) availability of high quality retail space at the mall.
We expect the retail sector to continue recording the entry of local and international retailers taking up space exited by struggling retailers thus cushioning the sector’s performance. Factors likely to shape the sector include; i) shifting focus to e-commerce with a growing trend towards doing online shopping and deliveries thus reducing uptake of physical space, and, ii)reduced disposable income among consumers amid the COVID-19 pandemic.
- Hospitality Sector
During the quarter, 2 hospitality industry related reports were released and the key take outs were as follows;
|
Report |
Key Take-Outs |
|
Leading Economic Indicators (LEI) July 2020 by Kenya National Bureau of Statistics |
|
|
Tourism Performance August 2020 by the Ministry of Tourism |
|
In terms of development activities during the period under review;
- In July, global hotel groups, Accor Hotels and Radisson Hotel Group announced that they would continue with their expansion plans in Kenya and the African region as a whole despite the slump in the sector due to the COVID-19 pandemic. The announcement affirms Kenya’s hospitality sector’s attractiveness to global investors driven by; (i) heightened security, (ii) recognition of Kenya as a regional hub, (iii) relaxation of travel advisories by governments of key tourism markets, and (iv) political stability that has prevailed in the country. For more analysis see Cytonn Weekly#28/2020,
- The Ministry of Tourism and Wildlife Cabinet Secretary, Najib Balala, announced that the National Government had set aside Kshs 10 bn aimed at offering cheap loans to hotels and firms operating in the tourism sector through a state-backed credit scheme. For more analysis see Cytonn #30/2020,
- Global chain International Hotels Group, announced the halting of operations and closure of the InterContinental Hotel, located along City Hall Way in Nairobi, amid the coronavirus economic tumble. For more information, see Cytonn Weekly #32/2020, and,
- In August, Sankara, a 5-star hotel in Westlands, resumed operations after nearly five months of closure following the coronavirus outbreak. For more information, see Cytonn Monthly-August 2020.
The hospitality sector has been the hardest hit by the COVID-19 pandemic due to its reliance on tourism and conferences, and this is evidenced by the cessation of operations by key hospitality facilities especially in the second quarter of the year due to reduced demand for the same. Nevertheless, for the latter part of the third quarter, the sector has been gradually recovering following the easing of travel restriction in and out of the country, opening up of key tourism markets such as the USA, resumption of flight operations starting 1st August and reopening of hospitality facilities. We expect the recovery to be supported by the Ministry of Tourism’s post-corona recovery strategy funds, the government’s stimulus package which, among others, seeks to offer soft loans to hotels and related establishments through the Tourism Finance Corporation (TFC) thus stimulating the hospitality sector, and, the tourism sector’s plan to repackage their products to appeal to a wider scope of domestic tourists.
- Land Sector
During Q3’2020, the land sector recorded an overall annualized capital appreciation of 2.4%, indicating that investors still consider land a good investment asset in the long term. Asking land prices for unserviced land in satellite towns recording the highest annualized capital appreciation of 4.8%, attributable to the growing demand for land in these areas fueled by the affordability with an asking price of approximately Kshs 26.2 mn per acre compared to suburbs with relatively high asking prices of up to Kshs 415.2 mn per acre. Land in commercial zones recorded a (2.1%) price correction, attributed to reduced demand for development land in the wake of an existing space oversupply of commercial space, in addition to the relatively high asking land prices of up to Kshs 415. 2 mn thus developers are not able to achieve favorable returns from the investments.
Below is the summary of the performance:
All values in Kshs unless stated otherwise
|
NMA Summary of Land Performance |
|||||
|
Segment |
FY'2017 |
FY'2018 |
FY'2019 |
Q3'2020 |
Annualized Capital App. Q3'20 |
|
Unserviced Land- Satellite Towns |
21.4 mn |
24.1 mn |
24.9 mn |
26.2 mn |
4.8% |
|
Serviced Land- Satellite Towns |
14.4 mn |
14.3 mn |
14.3 mn |
15.2 mn |
4.5% |
|
Nairobi Suburbs - Low Rise Residential Areas |
82.4 mn |
89.4 mn |
91.6 mn |
94.3 mn |
2.8% |
|
Nairobi Suburbs - High Rise Residential Areas |
134.6 mn |
135.0 mn |
137.5 mn |
142.2 mn |
1.9% |
|
Nairobi Suburbs - Commercial Areas |
429.8 mn |
447.3 mn |
428.5 mn |
415.2 mn |
(2.1%) |
|
Average |
136.5 mn |
142.0 mn |
139.4 mn |
138.6 mn |
2.4% |
|
|||||
Source: Cytonn Research
Performance per Node:
- Asking land prices for unserviced land in satellite towns recorded an annualized capital appreciation of 4.8%, supported by high demand for development land fueled by; i) affordability in comparison to Nairobi’s suburbs, and ii) improving infrastructure such as sewerage systems and roads in areas such as Ruiru. Athi River recorded the highest annualized capital appreciation at 9.6% attributed to the growing demand for land within the area due to affordability with the asking land price of approximately Kshs 4.8 mn compared to the market average of Kshs 26.2 mn
- Asking land prices within site and service schemes recorded an annualized capital appreciation of 4.5%, with Thika being ranked the highest attributed to the increased demand for land in the area from developers looking to cater for the mid-income and student population housing as a result of the push for individuals to move to satellite towns where housing is relatively affordable, in addition to the mushrooming tertiary institutions. Ruai recorded the lowest growth in asking land prices at 0.3% attributed to a slowdown in demand for land attributed to the recent demolitions of homes in a bid to reclaim land allegedly owned by the state-run Nairobi City Water and Sewerage Company (NSWSC)
The table below shows the performance of nodes within satellite towns:
All values in Kshs unless stated otherwise
|
Satellite Towns |
||||
|
Unserviced Land |
||||
|
Node |
FY'2018 |
FY'2019 |
Q3'2020 |
Annualized Capital App. Q3'20 |
|
Athi River |
3.7 mn |
4.2 mn |
4.8 mn |
9.6% |
|
Limuru |
17.1 mn |
17.4 mn |
19.2 mn |
7.7% |
|
Ongata Rongai |
11.4 mn |
12.1 mn |
12.8 mn |
4.2% |
|
Utawala |
12.9 mn |
15.1 mn |
15.8 mn |
3.5% |
|
Ruaka |
89.7 mn |
89.8 mn |
93.8 mn |
3.4% |
|
Juja |
10.1 mn |
10.8 mn |
10.9 mn |
0.7% |
|
Average |
24.1 mn |
24.9 mn |
26.2 mn |
4.8% |
|
Site and Service Schemes |
||||
|
Node |
FY'2018 |
FY'2019 |
Q3'2020 |
Annualized Capital App. Q3'20 |
|
Thika |
10.0 mn |
9.5 mn |
10.5 mn |
7.3% |
|
Ruiru |
20.6 mn |
20.9 mn |
22.9 mn |
7.2% |
|
Syokimau-Mlolongo |
12.1 mn |
13.9 mn |
14.7 mn |
4.7% |
|
Athi River |
12.9 mn |
13.1 mn |
13.8 mn |
3.8% |
|
Ongata Rongai |
16.7 mn |
16.4 mn |
17.1 mn |
3.4% |
|
Ruai |
13.6 mn |
12.3 mn |
12.3 mn |
0.3% |
|
Average |
14.3 mn |
14.3 mn |
15.2 mn |
4.5% |
Source: Cytonn Research
Among the Nairobi suburbs;
- Asking land prices in low rise residential areas recorded an annualized capital appreciation of 2.8% attributed to relatively high demand for land as it is relatively affordable at approximately Kshs 94.3 mn per acre as compared to the high-rise nodes, selling at Kshs 142.2 mn per acre on average. Additionally, family units are attracted to these areas as they are sparsely populated, thus offering exclusivity and privacy
- Asking land price in Kitisuru recorded the highest annualized capital appreciation at 4.6%, supported by the relatively low land prices at Kshs 83.2 mn compared to other high end suburbs with the market average at Kshs 94.3 mn. On the other hand, Spring Valley asking land prices recorded a (0.6%) correction attributed to a slowdown in demand for development land due to the relatively high land prices at approximately Kshs 167.5 mn thus investors are not able to achieve favorable returns on investments
- Asking land prices in high rise residential areas recorded a 1.9% annualized capital appreciation, with Kasarani being ranked highest at 4.8% attributable to continued demand for land supported by affordability with the asking land prices averaging at Kshs 78.5 mn compared to the node’s average of Kshs 142.2 mn, in addition to developers looking to cater for the expanding middle-income population. Embakasi has continued to perform poorly recording a (1.0%) correction attributed to traffic congestion in and out of the area, and high densification of the area making it unattractive to investors
- Asking land in commercial zones recorded an overall correction of (2.1%) following reduced demand for development land attributed to the existing oversupply of commercial office and retail spaces which stand at 6.3 mn SQFT and 2.0 mn SQFT, respectively, as at 2019, in addition to the relatively high asking land prices of Kshs 415.2 mn per acre on average thus developers are not able to achieve favorable returns from the investments
The table below shows the performance of nodes within the Nairobi Suburbs:
All values in Kshs unless stated otherwise
|
Nairobi Suburbs |
||||
|
Low Rise Residential Areas |
||||
|
Node |
FY'2018 |
FY'2019 |
Q3'2020 |
Annualized C. Appreciation Q3'20 |
|
Kitisuru |
77.3 mn |
78.3 mn |
83.2 mn |
4.6% |
|
Ridgeways |
71.6 mn |
76.7 mn |
81.0 mn |
4.2% |
|
Karen |
56.9 mn |
58.7 mn |
61.0 mn |
3.0% |
|
Runda |
77.1 mn |
75.7 mn |
78.7 mn |
3.0% |
|
Spring Valley |
164.0 mn |
168.8 mn |
167.5 mn |
(0.6%) |
|
Average |
89.4 mn |
91.6 mn |
94.3 mn |
2.8% |
|
High Rise Residential Areas |
||||
|
Node |
FY'2018 |
FY'2019 |
Q3'2020 |
Annualized C. Appreciation Q3'20 |
|
Kasarani |
64.7 mn |
73.8 mn |
78.5 mn |
4.8% |
|
Kileleshwa |
306.5 mn |
304.8 mn |
319.7 mn |
3.6% |
|
Dagoretti |
100.0 mn |
102.4 mn |
102.8 mn |
0.3% |
|
Embakasi |
68.8 mn |
69.0 mn |
68.0 mn |
(1.0%) |
|
Average |
135.0 mn |
137.5 mn |
142.2 mn |
1.9% |
|
Commercial Zones |
||||
|
Node |
FY'2018 |
FY'2019 |
Q3'2020 |
Annualized C. Appreciation Q3'20 |
|
Riverside |
395.8 mn |
340.5 mn |
337.6 mn |
(0.6%) |
|
Kilimani |
387.3 mn |
392.2 mn |
388.7 mn |
(0.7%) |
|
Westlands |
499.1 mn |
474.3 mn |
451.4 mn |
(3.6%) |
|
Upper Hill |
507.0 mn |
507.2 mn |
483.2 mn |
(3.6%) |
|
Average |
447.3 mn |
428.5 mn |
415.2 mn |
(2.1%) |
Source: Cytonn Research
The investment opportunity in the land sector lies in satellite towns which recorded an annualized capital appreciation of 4.8% for unserviced land. The key sub markets investors should focus on include Athi River and Limuru for unserviced land, which recorded an annualized capital appreciation of 9.6% and 7.7%, respectively. For site and service schemes, the key sub markets are Thika and Ruiru with the highest annualized capital appreciation at 7.3% and 7.2%, respectively. For suburbs, the opportunity lies in Kitisuru and Kasarani which recorded annualized capital appreciation of 4.6% and 4.8%, for low rise and high rise residential areas, respectively.
We expect the performance of the land sector to be cushioned by; (i) the growing demand for development land especially in the satellite towns as developers strive to drive the government’s Big Four government agenda on the provision of affordable housing, (ii) improving infrastructure, and (iii) increased demand for development land by the growing middle-income population.
- Infrastructure
During the quarter, the Ministry of Water and Sanitation principal secretary Joseph Irungu, announced that the Kshs 2.7 bn Mavoko, Athi River, drinking water project is set for completion on 8th march 2021. The dam project which is in partnership with the Belgium and Kenyan government is expected to ease the current water scarcity in the area by supplementing the current water supply with 12,000 cubic meters per day. Upon completion, the project will serve approximately 20,000 residents. According to the Kenya Population and Housing Census, Athi River had a population of 164,322, a 19.8% increase from 137,211 in 2009. The growing number of population is driven by the opening up of the area attributable to the improving infrastructure such as the dual carriage linking Athi River to Nairobi via the Nairobi-Mombasa Highway, availability of amenities such as shopping malls e. g. the upcoming Crystal Rivers Mall and the growing working population serving several companies in the area such as Bamburi Cement, Mombasa Cement, Athi River Mining among others. Athi River has continued to record increased development activities with developers seeking leverage on the positive demographics and availability of affordable development land in bulk. We expect the water project to make the area more habitable and boost the real estate sector.
Other highlights during the quarter;
- The government started repairs on the 68.0-kilometre road linking Thika town and Magumu along the Nairobi-Nakuru highway at a cost of Kshs 2.1 bn. For more information, see Cytonn Monthly-July 2020, and,
- Ruiru municipality officials announced the launch of a 12 kilometer new sewer line that is expected to benefit at least 50,000 homes in Githurai and Kahawa Wendani, Ruiru Sub County upon completion by June 2021. For more information, see Cytonn Weekly #37/2020.
The infrastructure sector is set to witness government championed partnerships in the undertaking of projects in the wake of reduced budget allocation as the economy grapples from the effects of the pandemic. On completion, we expect the improving infrastructure to enhance the opening up of areas for development thus boosting the real estate sector.
- Statutory Reviews
The National Treasury secretary, Ukur Yatani, published The Stamp Duty (Valuation of Immovable Property) Regulations 2020, aimed at simplifying land transactions in Kenya. Some of the key highlights in the new regulation include;
- Permits for valuations may either be done by a government valuer or a private valuer appointed by the Chief Government Valuer thus speeding up the land and building transfer processes,
- The appointed registered private property valuer will be expected to submit a valuation report to the Chief Government Valuer immediately a payment has been made by a transferee while the government valuer has a limit of 21 days to submit the valuation report from the date a transferee chooses to have valuations done,
- The person liable to pay the stamp duty and who is aggravated by the valuation of property may lodge objection in writing to the Chief Government Valuer within 21 days of receipt of the notice of valuation on limited grounds including; i) value assigned for the immovable property, ii) the apportionment of the area, dimensions or description of the immovable property, iii) in the case where the immovable property that should have been included in the valuation has been valued separately, iv) that the immovable property that should have been valued separately has been included in the valuation, and, v) the person named in the report is not the true transferee of the immovable property, and,
- In case of professional malpractice in the course of rendering services under the Stamp Duty Act, the person alleging the malpractice may report the matter to the Valuers Registration Board and if proven relevant sanctions in the valuers act will apply.
The new regulations will enable shortening of the lengthy process of acquiring land and buildings due the current delays at the Lands Ministry attributed to the shortage of government valuers. In our view, the effective implementation of the new regulations will enhance the ease of undertaking property transactions thus boosting the real estate sector.
Other policy reforms during the quarter include;
- Nairobi Metropolitan Services (NMS) established a new urban planning technical committee to handle building plans approvals in Nairobi County approximately two months after the disbandment of the Nairobi City County Pre-Technical Committee and the Nairobi City County Urban Planning Technical Committee by NMS director-general Mohammed Badi, citing corruption by its officials which led to delays in issuance of approvals. For more information see Cytonn weekly #28/2020,
- A committee appointed by the State Department of Housing and Urban Development on the 8thJune 2020 proposed the establishment of Real Estate Developers Regulatory Board aimed at regulation and promotion of the real estate sector in Kenya. For more information, see Cytonn monthly July 2020, and,
- The Ministry of Lands announced that land transactions in Nairobi city that include; searches, application for registration of documents, transfer of ownership or lease, caution and withdrawal of caution among others must be done online as per, The Land Registration (Electronic Land Transactions) Regulations 2019. For more information, see Cytonn weekly #33/2020.
- Listed Real Estate
During Q3’2020, the Fahari I-REIT closed the month of September at Kshs 5.2 per share, a 45.8% YTD decline from Kshs 9.6 at the beginning of the year. The instrument continued to perform poorly trading at an average of Kshs 7.2, a 74.0% decline from its initial price of Kshs 20.0 as at November 2015. The subdued performance of the instrument shows continued lack of investor understanding of the product and also the negative performance of listed securities due to the pandemic.
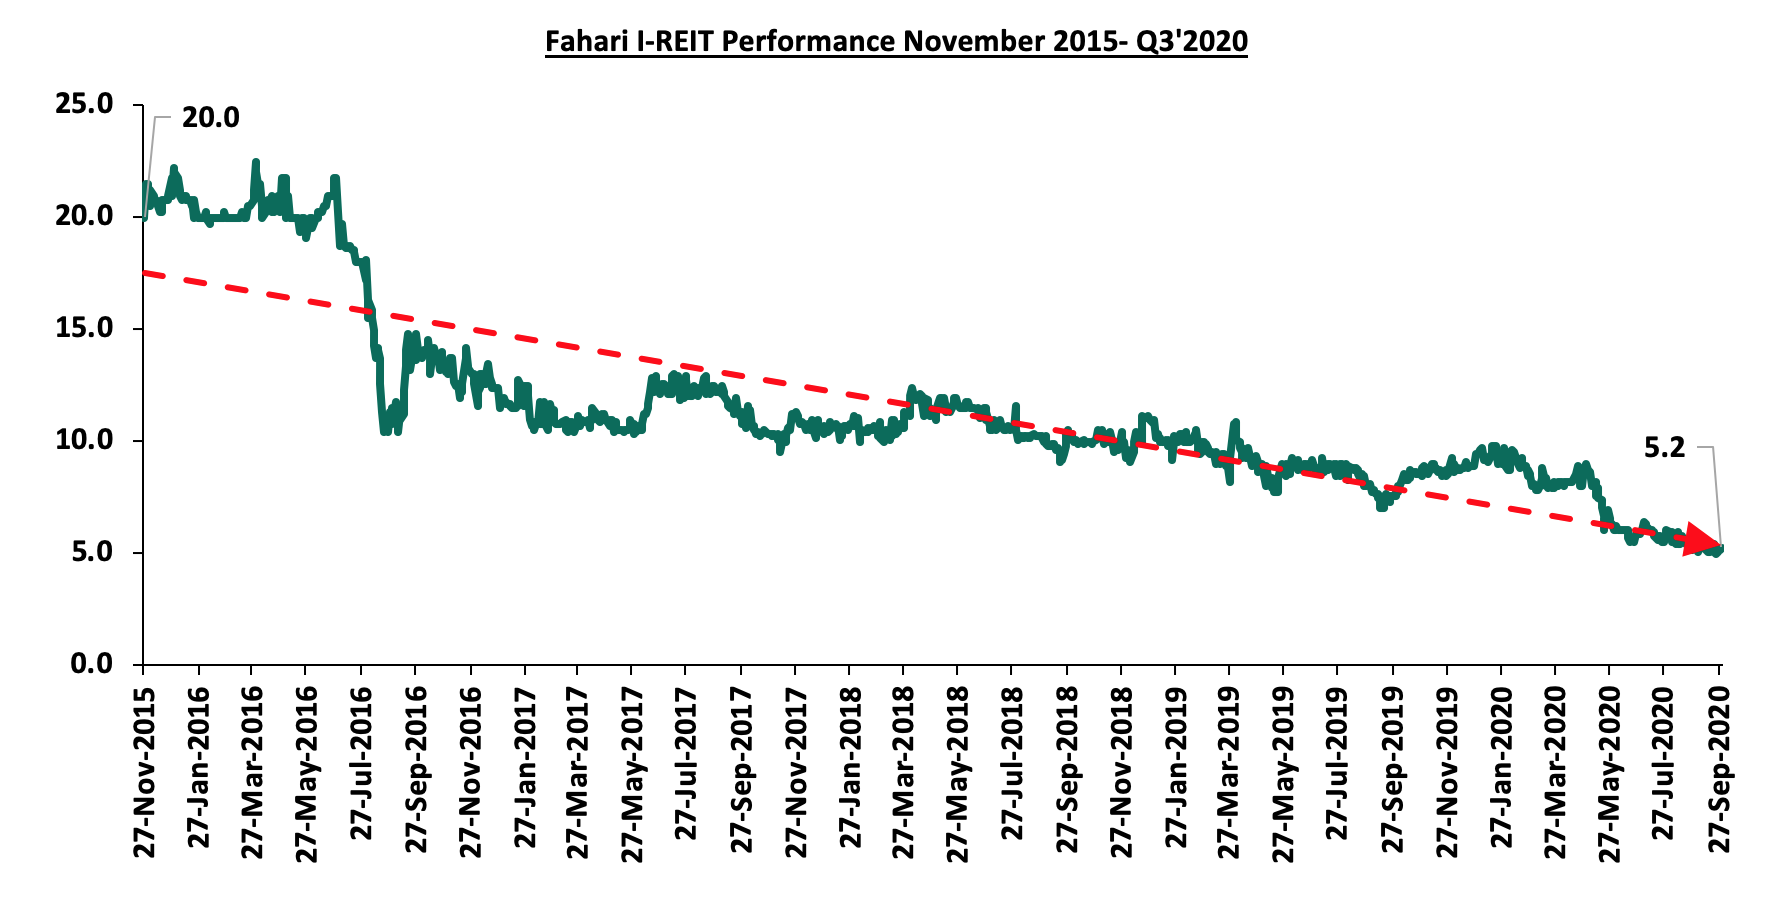
We expect listed real estate to continue performing poorly as a result of subdued performance of the office and retail sectors with the continued poor investor perception being the key hindrance to the I-REIT’s performance.
Real Estate Performance Summary and Outlook
Below is a summary of the sectorial performance in Q3’2020 and investment opportunities:
|
Theme |
Thematic Performance and outlook Q3’2020 |
Outlook |
|
Residential |
Apartments registered relatively higher average total returns to investors at 5.4% compared to detached markets at 4.2%, attributed to higher demand and resultant uptake of the former as buyers focus on affordable housing options in the wake of reduced disposable income and an overall tough economic environment |
Neutral |
|
We expect total returns to investors to remain suppressed in the last quarter as developers continue to offer discounts to homebuyers and landlords continue to offer reduced rental rates to attract tenants. The investment opportunity for apartments lies in the lower mid-end market in areas such as Thindigua and South C, which continued to post above-market returns and annual uptake. For detached units, opportunity lies in upper mid-end segment in submarkets such as Ridgeways and Runda Mumwe due to the attractive rental yields. |
||
|
Office |
The sector recorded a decline of 0.4% and 0.3% points in average occupancy rates, and rental yields to 79.9%, and 7.2% in Q3’2020 from 80.3%, and 7.5%, respectively in FY’2019, attributed to reduced demand for office spaces as some firms scale down their operations while others adopt the working from home strategies. |
Negative |
|
We retain a negative outlook for the sector attributed to the existing oversupply and dwindling demand for office spaces. The investment opportunity lies in Gigiri, Westlands and Karen supported by relatively high returns with yields of 9.0%, 8.1% and 8.1%, respectively, compared to the market average of 7.2%, in addition to the existing undersupply of quality space in the areas. |
||
|
Retail |
The sector recorded a 0.4% decline in rental yields to 7.4% in Q3’2020 from 7.8% in FY’2019, attributed to ; i) shifting focus to e-commerce, and, ii)reduced disposable income among consumers amid the COVID-19 pandemic |
Neutral |
|
We expect the sector to continue witnessing the entry of local and international retailers taking up space exited by struggling retailers thus cushioning the performance of sector. Investment opportunity lies in Westlands and Karen which recorded high rental yields of 9.7% and 9.3%, respectively, compared to the market average of 7.4%, attributed to high consumer purchasing power and ease of access to the areas. |
||
|
Hospitality |
The hospitality sector began to recover gradually following the easing of travel restriction in and out of the country, opening up of key tourism markets such as the USA, resumption of flight operations starting 1st August and reopening of hospitality facilities. |
Neutral |
|
We expect the recovery to be supported by the Ministry of Tourism’s post-corona recovery strategy funds, the government’s stimulus package and, the tourism sector’s plan to repackage their products to appeal to a wider scope of domestic tourists. The sector has pockets of value in the serviced apartments in areas such as Westlands & Parklands, and Kilimani markets with rental yields of above 10.8% and 9.5%, respectively |
||
|
Land |
The land sector recorded an overall annualized capital appreciation of 2.4%, indicating that investors still consider land a good investment asset in the long term. |
Positive |
|
The investment opportunity lies in Athi River and Limuru for unserviced land in satellite towns, which recorded an annualized capital appreciation of 9.6% and 7.7%, respectively. For site and service schemes, Thika and Ruiru with the highest annualized capital appreciation at 7.3% and 7.2%, respectively. |
||
|
Listed Real estate |
The I-REIT continued to perform poorly trading at an average of Kshs 7.2, a 74.0% decline from its initial price of Kshs 20.0 with lows of up to Kshs 5.0 in September, the lowest since the I-REIT’s inception in 2015. |
Negative |
|
We expect listed real estate to continue performing poorly as a result of subdued performance of the office and retail sectors and the continued poor investor perception. |
The real estate outlook is positive for one sector-land, neutral for three sectors-residential, retail and hospitality sector, and, negative for two sectors-commercial office and listed real estate. Therefore, the overall outlook for the real estate sector is NEUTRAL, supported by; positive demographics, improving infrastructure, improved access to mortgage, and, continued focus on affordable housing. Some factors likely to constrain the growth of the sector include; business restructuring and downsizing thus affecting uptake of office space, constrained finances for developers, tough economic environment which has limited consumer spending and existing oversupply in the office and retail sectors.
Disclaimer: The views expressed in this publication are those of the writers where particulars are not warranted. This publication, which is in compliance with Section 2 of the Capital Markets Authority Act Cap 485A, is meant for general information only and is not a warranty, representation, advice or solicitation of any nature. Readers are advised in all circumstances to seek the advice of a registered investment advisor.

- Talk to us
- Kenya
- P.O Box 20695 - 00200, Nairobi, Kenya
- Cell +254709101200
- Tel +254709101200
- WhatsApp +254741676635
- United States
- +254709101200
- DOWNLOAD OUR APP
-


- Kenya
- 8th Floor, Pinetree Plaza, Kaburu Drive, Ngong Road, Nairobi, Kenya
- USA
- Suite 1150, 1775 Eye Street NW, USA, Washington DC 20006, USA
- Investments
- High Yield
- Private Equity
- Real Estate
- Real Estate
- RiverRun Estates
- Cytonn Towers
- The Ridge
- Taraji Heights
- The Alma