Kenya’s IMF Standby Facility, & Cytonn Weekly #31/2018
By Cytonn Research Team, Aug 19, 2018
Executive Summary
Fixed Income
T-bills were oversubscribed during the week with the overall subscription rate coming in at 102.2%, an increase from 57.4% recorded the previous week. Yields on the 91-day, 182-day and 364-day papers remained unchanged at 7.7%, 9.0% and 10.0%, respectively. According to the Energy Regulatory Commission (ERC), petrol prices have increased by 1.3% to Kshs 113.7 from Kshs 112.2 per litre, while diesel and kerosene prices have declined by 0.5% and 0.9% to Kshs 102.7 and Kshs 85.0 per litre, respectively, effective 15th August – 14th September 2018
Equities
During the week, the equities market was on an upward trend, with NASI, NSE 20 and NSE 25 gaining 1.0%, 0.6% and 0.1%, respectively, taking their YTD performance to 2.0%, (10.1%) and 3.0%, respectively. For the last twelve months (LTM), NASI, NSE 20 and NSE 25 have gained by 5.1%, (17.5%) and 2.1%, respectively. KCB Group, Equity Group Holdings, Co-operative Bank and Barclays Bank released their H1’2018 financial results, recording growth in core earnings per share of 18.0%, 17.6%, 7.6% and 6.2%, respectively;
Private Equity
In fintech fundraising, InsurTech (Insurance Technology) company Jamii Africa announced receipt of an equity investment of USD 0.7 mn (Kshs 70.6 mn) from US-based entrepreneur Patrick Munis as it closes in on its target of USD 2.0 mn (Kshs 201.7 mn) for expansion into Kenya;
Real Estate
During the week, Nairobi Lands, Urban Renewal and Housing County Executive, Mr. Charles Kerich, announced that implementation of the Nairobi Urban Regeneration Plan will start in September 2018, with Pangani being the first estate to be redeveloped. Also in the week, Co-operative Bank announced that it will inject capital of Kshs 200.0 mn in The Kenya Mortgage Refinancing Company (KMRC) making it the first local financial institution to invest in the secondary mortgages company
Focus of the Week
The International Monetary Fund (IMF) recently concluded their visit to Kenya where they were holding discussions with the Kenyan Government on the second review under the precautionary Stand-By Arrangement (SBA). The precautionary SBA is a lending arrangement extended by the IMF to member countries in emerging markets in need of financial assistance, normally arising from financial crisis. It remains uncertain if Kenya’s access to the stand-by facility will be extended as talks with the government are set to continue. We are of the view that the availability of the program as a precautionary facility is important in cushioning the country from unforeseen exogenous shocks such as sharp rises in global oil prices, significant dollar outflows that would lead to volatility in the foreign exchange market, and other risks that would threaten forex reserves.
- Peris Kiarie, Risk and Compliance Assistant, discussed about steps required when making savings. Watch Peris on Njata T.V. here
- Nancy Murule, Senior Research Analyst, discussed the ongoing demolitions of building in Nairobi. See Nancy on K24 here
- The Q2’2018 issue of our quarterly Sharp Cents Magazine, themed Sustainable Finance, is out. Read the issue here or email clientservices@cytonn.com to get a copy
- The weekly workshops and site visits target both investors looking to invest in real estate directly and those interested in high yield investment products to familiarize themselves with how we support our high yields. Watch progress videos and pictures of The Alma, Amara Ridge, The Ridge, and Taraji Heights. Key to note is that our cost of capital is priced off the loan markets, where all-in pricing ranges from 16.0% to 20.0%, and our yield on real estate developments ranges from 23.0% to 25.0%, hence our top-line gross spread is about 6.0%. If interested in attending the site visits, kindly register here
- We continue to see very strong interest in our weekly Private Wealth Management Training (largely covering financial planning and structured products). The training is at no cost and is open only to pre-screened participants. We also continue to see institutions and investment groups interested in the training for their teams. The Wealth Management Training is run by the Cytonn Foundation under its financial literacy pillar. If interested in our Private Wealth Management Training for your employees or investment group please get in touch with us through wmt@cytonn.com. To view the Wealth Management Training topics, click here
- For recent news about the company, see our news section here
- We have 10 investment-ready projects, offering attractive development and buyer targeted returns of around 23.0% to 25.0% p.a. See further details here: Summary of Investment-Ready Projects
- We continue to beef up the team with ongoing hires for Senior Operations Manager, Operations Associate and Operations Analyst in Cytonn Group as well as Financial Advisors in Nairobi and Kisumu. Visit the Careers section on our website to apply.
- Cytonn Real Estate is looking for a 0.75-acre land parcel for a joint venture in Lavington, Karen or Kiambu Road. The parcel should be in a good location with frontage to a tarmac road. For more information or leads, email us at rdo@cytonn.com
- The September intake for diploma, certificate and short professional courses offered by Cytonn College is ongoing. Learn more about the college and refer potential students who are looking for practical hands-on experience to enrol for the ongoing intake here
T-Bills & T-Bonds Primary Auction:
T-bills were oversubscribed during the week, with the overall subscription rate coming in at 102.2%, a significant increase from 57.4% recorded the previous week due to improved liquidity, which the Central Bank of Kenya has attributed to reduced pressure on banks due to the fact they had attained the average monthly Cash Reserve Requirements threshold for the month of August. Yields on the 91-day, 182-day and 364-day papers remained unchanged at 7.7%, 9.0% and 10.0%, respectively. The acceptance rate for T-bills declined to 95.8% from 96.8% the previous week with the government accepting Kshs 23.5 bn of the Kshs 24.5 bn worth of bids received. The subscription rate for the 91-day, 182-day and 364-day papers improved to 153.9%, 72.8% and 110.9%, from 15.1%, 20.5% and 111.1% the previous week, respectively.
During the month of August 2018, the Kenyan Government has issued a new medium-term 10-year Treasury bond (FXD 1/2018/10) with a market-determined coupon rate, in a bid to raise Kshs 40.0 bn for budgetary support. The government has been issuing long-term bonds in a bid to lengthen the average time to maturity for the total debt portfolio which stood at 7.1 years as at the end of FY’2017/2018, a decline from 7.8 years as at the end of FY’2016/2017 as per data from the Medium Term Debt Management Strategy FY2018/19-FY2020/21 and FY2017/18-FY2019/20. The government has not achieved much in lengthening their liability profile mainly due to the poor performance of the longer dated bonds in the auction market. We attribute the low-performance rate to the relatively flat yield curve on the long-end making it relatively unattractive to hold longer-term bonds considering the current uncertainties in the interest rate environment. Given that the Treasury bonds with the same tenor are currently trading at a yield of 12.7%, we expect bids to come in at between 12.7% and 13.0%.
Liquidity:
The average interbank rate declined to 7.0%, from 8.3% the previous week, while the average volumes traded in the interbank market declined by 20.6% to Kshs 9.1 bn, from Kshs 11.4 bn the previous week. The decline in the average interbank rate points to improved liquidity, which the Central Bank of Kenya has attributed to reduced pressure due to the fact banks had attained the average monthly Cash Reserve Requirements threshold towards the end of cycle on August 14th, 2018.
Kenya Eurobonds:
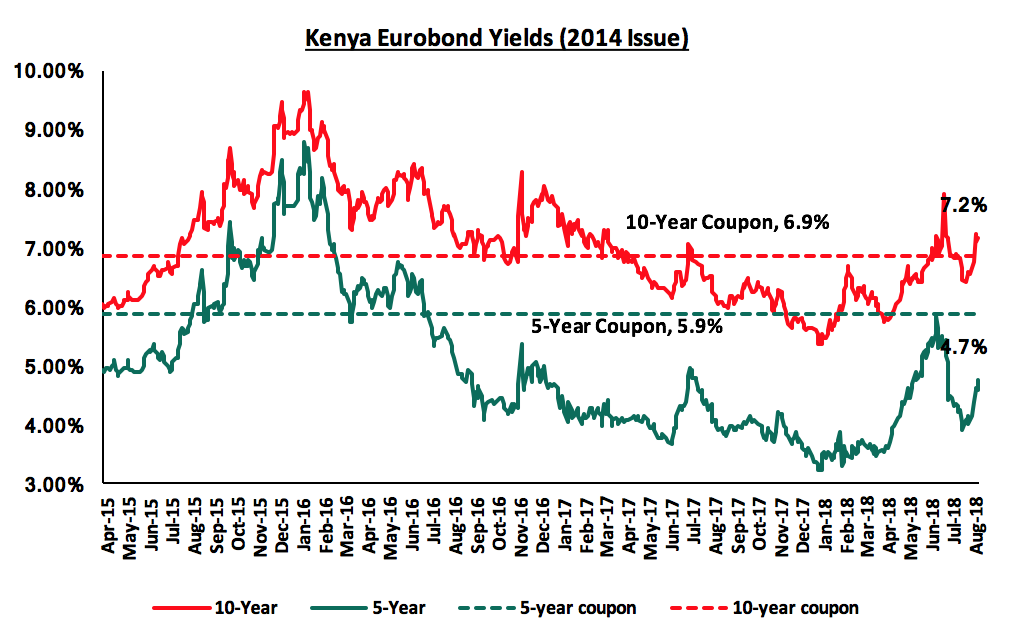
According to Bloomberg, the yield on the 5-Year and 10-year Eurobonds issued in 2014 increased by 0.3% points and 0.4% points to 4.7% and 7.2% from 4.4% and 6.8% the previous week, respectively. Since the mid-January 2016 peak, yields on the Kenya Eurobonds have declined by 4.1% points and 2.4% points for the 5-year and 10-year Eurobonds, respectively, an indication of the relatively stable macroeconomic conditions in the country. Key to note is that these bonds have 1-year and 6-years to maturity for the 5-year and 10-year, respectively.
For the February 2018 Eurobond issue, during the week, the yields on both the 10-year and 30-year Eurobonds increased by 0.2% points and 0.1% points to 7.8% and 8.7% from 7.6% and 8.6% the previous week, respectively. Since the issue date, the yields on the 10-year and 30-year Eurobonds have increased by 0.5% points and 0.4% points, respectively.
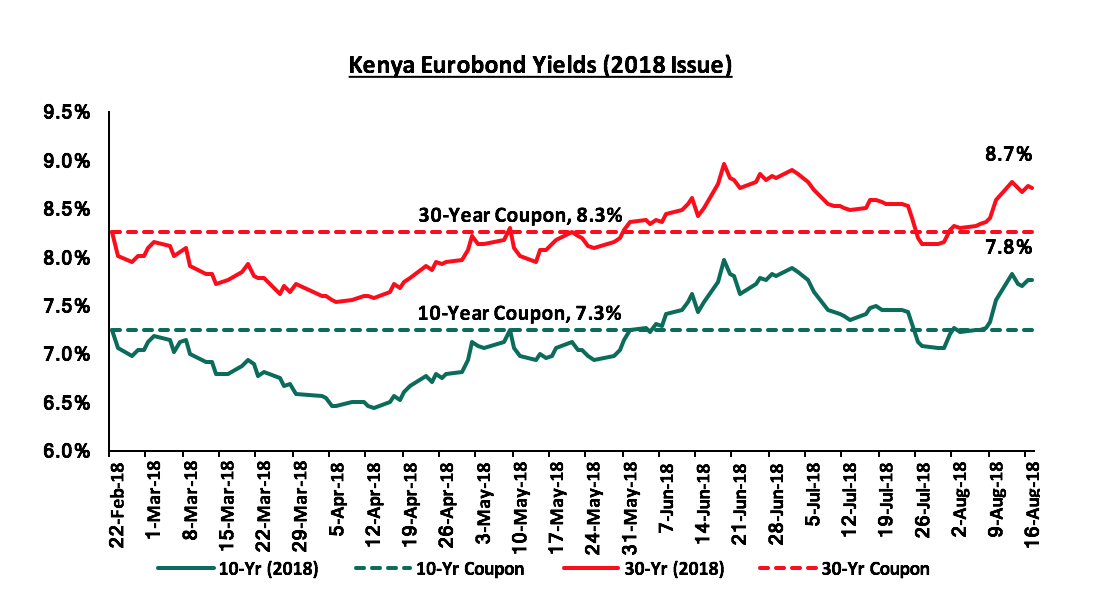
Key to note is that yields on all the Eurobond issues continued to rise this week, reflecting the general trend in the international bond market, which the CBK attributed to the adjustments of global yields to normalisation of monetary policies in the advanced economies.
The Kenya Shilling:
During the week, the Kenya Shilling depreciated by 0.4% against the US dollar to close at Kshs 100.8 from Kshs 100.4 the previous week, driven by dollar demand from traders and oil importers coupled with subdued inflows from exporters. The Kenyan shilling has appreciated by 2.3% year to date and in our view the shilling should remain relatively stable against the dollar in the short term, supported by:
- The narrowing of the current account deficit to 5.8% in the 12-months to June 2018, from 6.3% in March 2018, attributed to improved agriculture exports, and lower capital goods imports following the completion of Phase I of the Standard Gauge Railway (SGR) project,
- Stronger inflows from principal exports, which include coffee, tea and horticulture, which increased by 10.8% during the month of May to Kshs 24.3 bn from Kshs 21.9 bn in April, with the exports from coffee, tea and horticulture improving by 11.0%, 19.1% and 2.0% m/m, respectively,
- Improving diaspora remittances, which increased by 71.9% y/y to USD 266.2 mn from USD 154.9 mn in June 2017 and 4.9% m/m, from USD 253.7 mn in May 2018, with the largest contributor being North America at USD 130.1 mn attributed to; (a) recovery of the global economy, (b) increased uptake of financial products by the diaspora due to financial services firms, particularly banks, targeting the diaspora, and (c) new partnerships between international money remittance providers and local commercial banks making the process more convenient, and,
- High forex reserves, currently at USD 5.8 bn (equivalent to 8.7 months of import cover) and the USD 1.5 bn stand-by credit and precautionary facility by the IMF, still available until September 2018.
Highlights of the Week:
According to the Energy Regulatory Commission (ERC), petrol prices have increased by 1.3% to Kshs 113.7 from Kshs 112.2 per litre previously, while diesel and kerosene prices have declined by 0.5% and 0.9% to Kshs 102.7 and 85.0 per litre, respectively, effective 15th August – 14th September 2018. The changes in prices have been attributed to the rise in average landing costs of imported super petrol by 3.1% to USD 761.6 per ton in July from USD 738.8 in June. Landing costs for diesel as well increased marginally by 0.2% to USD 683.3 in July from USD 682.0 in June, while kerosene’s landing cost declined by 1.3% to USD 721.6 in July from USD 731.3 in June. The mean monthly USD to Kenyan Shilling exchange rate mitigated the rise in prices with the Kenyan Shilling appreciating by 0.4% to Kshs 100.6 in July from Kshs 101.0 in June. The faster rise in super petrol prices is expected to more than offset the decline in diesel prices, pushing the transport index up. We will release our inflation projection for the month of August 2018 in next week’s report.
Rates in the fixed income market have been on a declining trend, as the government continues to reject expensive bids as it is currently 31.3% ahead of its pro-rated borrowing target for the current financial year, having borrowed Kshs 54.9 bn against a prorated target of Kshs 41.8 bn. The 2018/19 budget gives a domestic borrowing target of Kshs 271.9 bn, 8.6% lower than the 2017/2018 fiscal year’s target of Kshs 297.6 bn, which may result in reduced pressure on domestic borrowing. However, the National Treasury has proposed to repeal the interest rate cap, which if repealed can result in an upward pressure on interest rates, as banks would resume pricing of loans to the private sector based on their risk profiles. With the cap still in place, we maintain our expectation of stability in the interest rate environment. With the expectation of a relatively stable interest rate environment, our view is that investors should be biased towards medium-term fixed-income instruments.
Market Performance:
During the week, the equities market was on an upward trend with NASI, NSE 20 and NSE 25 gaining 1.0%, 0.6% and 0.1%, respectively, taking their YTD performance to 2.0%, (10.1%) and 3.0%, respectively. This week’s performance was driven by gains in large cap stocks such as Safaricom, BAT and Bamburi Cement that gained by 2.7%, 1.3% and 0.6%, respectively. For the last twelve months (LTM), NASI, NSE 20 and NSE 25 have gained 5.1%, (17.5%) and 2.1%, respectively.
Equities turnover increased by 55.6% to USD 26.9 mn, from USD 17.3 mn the previous week. This takes the YTD turnover to USD 1.2 bn. Foreign investors remained net sellers, with a net foreign outflow of USD 5.5 mn during the week. On a YTD basis, foreign investors have remained net sellers, recording a net outflow of USD 194.2 mn as they exit the market at relatively expensive valuations so as to realize capital gains earned from the bullish rally witnessed from Q2’2017 to March 2018, for possible re-entry at cheaper valuations. We expect the market to remain supported by positive investor sentiment this year, as investors take advantage of the attractive stock valuations in select counters.
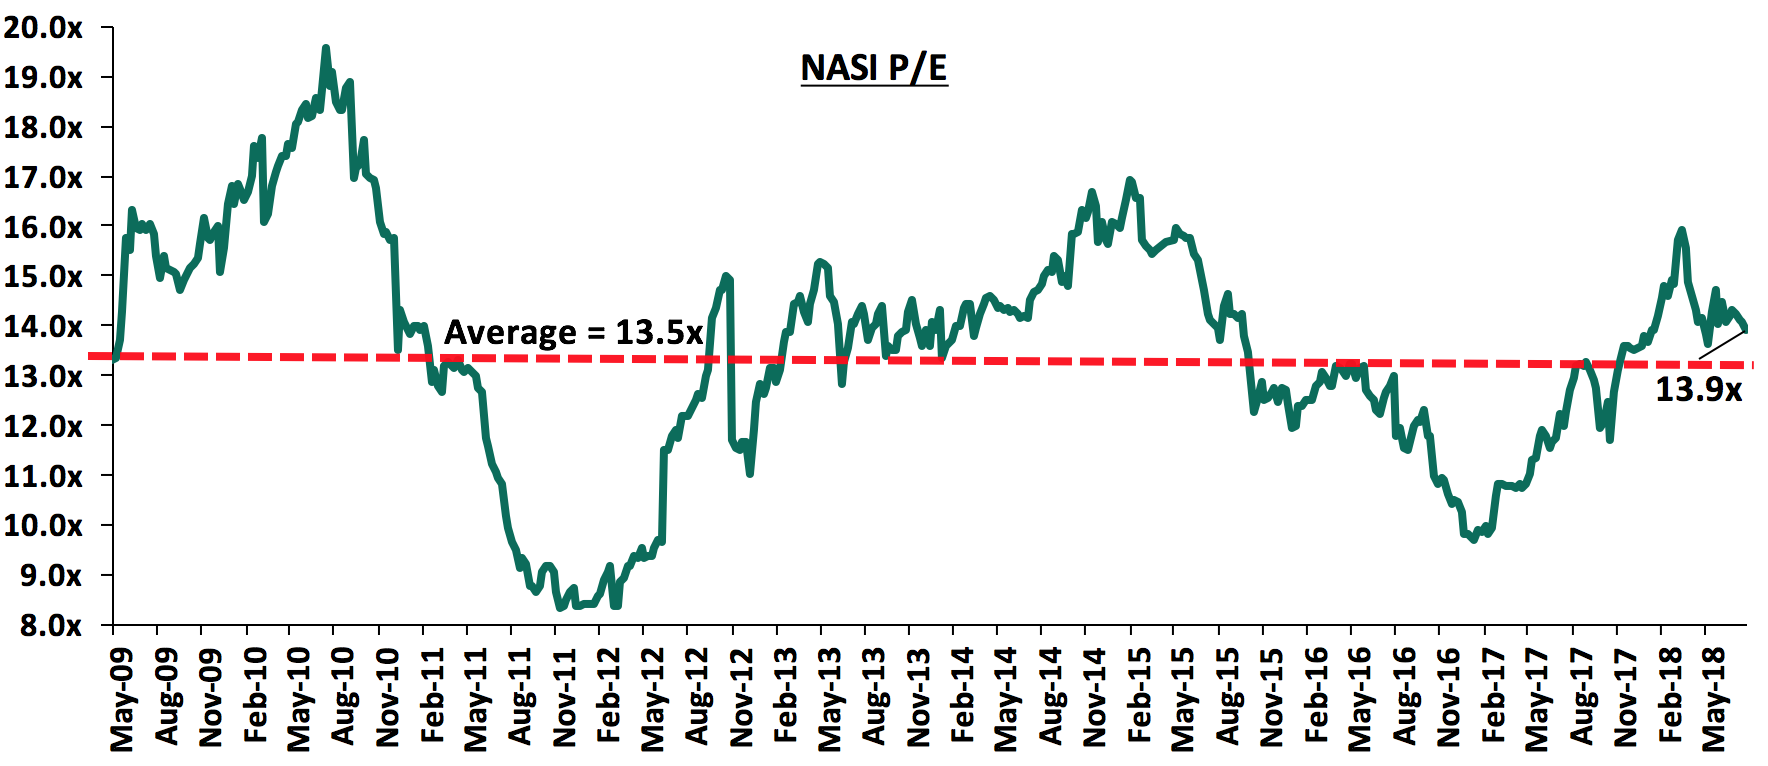
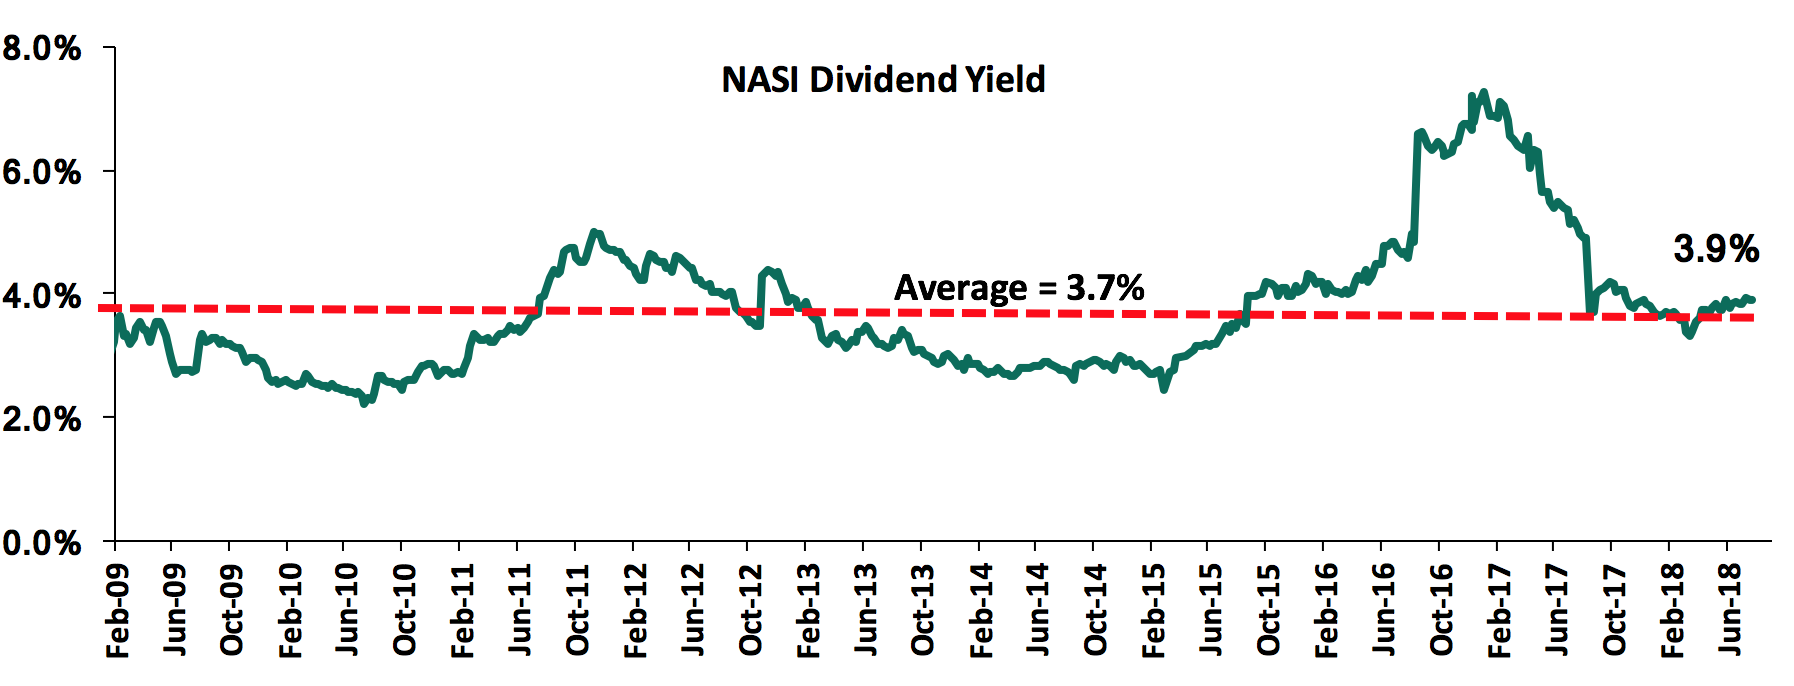
The market is currently trading at a price to earnings ratio (P/E) of 13.9x, which is 3.0% above the historical average of 13.5x, and a dividend yield of 3.9%, higher than the historical average of 3.7%. The current P/E valuation of 13.9x is 41.8% above the most recent trough valuation of 9.8x experienced in the first week of February 2017, and 67.5% above the previous trough valuation of 8.3x experienced in December 2011. The charts below indicate the historical P/E and dividend yields of the market.
Weekly highlights:
Equity Group Holdings released H1’2018 results during the week;
Equity Group Holdings released H1’2018 results, with core earnings per share increasing by 17.6% to Kshs 2.9 from Kshs 2.5 in H1’2017, below our expectation of a 20.7% increase to Kshs 3.0. Performance was driven by a 5.9% increase in total operating income, coupled with a 1.9% decrease in the total operating expenses. The variance in core earnings per share growth against our expectations was largely due to a slower growth in Non-Funded Income (NFI), which grew by 1.5% to Kshs 13.2 bn, against our expectation of an 8.3% growth to Kshs 14.1 bn. Highlights of the performance from H1’2017 to H1’2018 include:
- Total operating income increased by 5.9% to Kshs 32.8 bn in H1’2018, from Kshs 30.9 bn in H1’2017. This was due to a 9.1% increase in Net Interest Income (NII) to Kshs 19.6 bn from Kshs 17.9 bn in H1’2017, coupled with a 1.5% increase in Non-Funded Income (NFI) to Kshs 13.2 bn from Kshs 13.0 bn in H1’2017. The anemic NFI growth is concerning given that Equity Group has positioned itself as a transactions bank, hence we expected a stronger NFI growth,
- Interest income increased by 10.2% to Kshs 25.4 bn from Kshs 23.0 bn in H1’2017 bn. The interest income on loans and advances increased by 4.5% to Kshs 17.1 bn from Kshs 16.4 bn in H1’2017. Interest income on government securities increased by 26.8% to Kshs 7.9 bn in H1’2018 from Kshs 6.2 bn in H1’2017. The strong growth in government securities income relative to growth in loans should be a concern to policy makers as it indicates that government borrowing is crowding out the private sector. The yield on interest earning assets however declined to 11.4% in H1’2018 from 12.2% in H1’2017, due to a faster increase in allocation to government securities, that have a lower yield than loans,
- Interest expense increased by 14.0% to Kshs 5.8 bn from Kshs 5.1 bn in H1’2017, following an 11.6% increase in the interest expense on customer deposits to Kshs 4.7 bn from Kshs 4.2 bn in H1’2017. Interest expense on deposits and placements from banking institutions increased by 87.7% to Kshs 0.2 bn from Kshs 0.1 bn in H1’2017. Other interest expenses increased by 17.5% to Kshs 0.9 bn in H1’2018, from Kshs 0.8 bn in H1’2017. The cost of funds thus increased to 2.7% from 2.6% in H1’2017. Net Interest Margin declined to 8.8% from 9.7% in H1’2017,
- Non-Funded Income (NFI) increased by 1.5% to Kshs 13.2 bn from Kshs 13.0 bn in H1’2017. The growth in NFI was driven by a 21.9% increase in other income to Kshs 2.6 bn, from Kshs 2.1 bn in H1’2017. The growth in NFI was weighed down by a 2.5% decrease in fee and commission income on loans and advances to Kshs 2.8 bn from Kshs 2.9 bn in H1’2017, coupled with a 10.2% decline in foreign exchange trading income to Kshs 1.5 bn, from Kshs 1.7 bn in H1’2017. The current revenue mix stands at 60:40 funded to non-funded income as compared to 58:42 in H1’2017. The proportion of non-funded income to total revenue declined owing to the faster growth in NII as compared to NFI,
- Total operating expenses declined by 1.9% to Kshs 17.3 bn from Kshs 17.6 bn, largely driven by a 57.7% decrease in loan loss provisions to Kshs 0.8 bn in H1’2018 from Kshs 1.9 bn in H1’2017, coupled with a 12.3% decrease in depreciation on property and equipment to Kshs 1.6 bn in H1’2018 from Kshs 1.9 bn in H1’2017. Staff costs however increased by 1.3% to Kshs 5.23 bn from Kshs 5.16 bn in H1’2017.
- The cost to income ratio improved to 52.8% from 57.0% in H1’2017. Without LLP, the Cost to income ratio also improved, albeit marginally, to 50.4% from 51.0% in H1’2017,
- Profit before tax increased by 16.4% to Kshs 15.5 bn, up from Kshs 13.3 bn in H1’2017. Profit after tax increased by 17.6% to Kshs 11.0 bn in H1’2018, from Kshs 9.4 bn in H1’2017,
- The balance sheet recorded an expansion as total assets increased by 7.3% to Kshs 542.0 bn from Kshs 504.9 bn in H1’2017. This growth was largely driven by a 37.5% increase in government securities to Kshs 158.9 bn from Kshs 115.6 bn in H1’2017,
- The loan book increased by 3.8% to Kshs 275.0 bn in H1’2018 from Kshs 265.1 bn in H1’2017,
- Total liabilities rose by 8.7% to Kshs 455.7 bn from Kshs 419.1 bn in H1’2017, driven by an 8.5% increase in total deposits to Kshs 393.7 bn from Kshs 362.8 bn in H1’2017. Deposits per branch increased by 10.8% to Kshs 1.4 bn from Kshs 1.3 bn in H1’2017, with the growth attributed to the bank’s closure of 6 branches in H2’2017,
- The faster growth in deposits as compared to loans led to a decline in the loan to deposit ratio to 69.9% from 73.1% in H1’2017,
- Gross non-performing loans increased by 20.1% to Kshs 24.5 bn in H1’2018 from Kshs 20.4 bn in H1’2017. Consequently, the NPL ratio deteriorated to 8.5% in H1’2018 from 7.4% in H1’2017. General Loan Loss Provisions (LLPs) increased by 23.2% to Kshs 9.6 bn from Kshs 7.8 bn in H1’2017. Thus, the NPL coverage improved to 79.9% in H1’2018 from 69.5% in H1’2017, due to the relatively faster increase in the loan loss provisions. The increase in the non-performing loans was attributed to three major corporate clients. Large enterprises contributed the largest proportion of NLPs at 17.0%, with micro enterprises and agriculture contributing 14.9% and 8.1%, respectively,
- Shareholders’ funds increased marginally by 0.5% to Kshs 86.3 bn in H1’2018, from Kshs 85.9 bn in H1’2017.
- Equity Group Holdings is currently sufficiently capitalized with a core capital to risk weighted assets ratio of 18.3%, 7.8% above the statutory requirement. In addition, the total capital to risk weighted assets ratio was 18.4%, exceeding the statutory requirement by 3.9%. Adjusting for IFRS 9, the core capital to risk weighted assets stood at 19.1%, while total capital to risk weighted assets came in at 19.2%, indicating that the bank’s total capital relative to its risk-weighted assets declined by 0.8% due to implementation of IFRS 9,
Equity Group Holdings currently has a return on average assets of 3.9% and a return on average equity of 23.9%.
Going forward, we expect the bank’s growth to be further propelled by;
- Channeled diversification, which is likely to further improve on efficiency, with emphasis on alternative channels of transactions, as the bank rides on the digital revolution wave, thereby further improving the cost to income ratio by cost rationalization and revenue expansion. This will likely propel the bank’s prospects of achieving sustainable growth, as it replicates its successful business model across its various regional subsidiaries, and,
- The bank’s operating model of enhancing balance sheet agility, which is likely to place the bank in a prime position to take advantage of any opportunities that may arise, such as attractive inorganic growth via acquisitions or fast lending in the event of a repeal of the interest rate cap. The bank’s balance sheet agility is seen given the bank’s high liquidity ratio of 57.1%.
For a comprehensive analysis, see our Equity Group Holdings H1’2018 Earnings Note
KCB Group PLC released H1’2018 results during the week;
KCB Group PLC released H1’2018 results, with core earnings per share increasing by 18.0% to Kshs 7.9 from Kshs 6.7 in H1’2017, exceeding our expectation of a 9.4% increase to Kshs 7.3. Performance was driven by a 2.9% increase in total operating income, coupled with a 6.8% decline in total operating expenses. The variance in core earnings per share growth against our expectations was largely due to a 58.9% decline in Loan Loss Provisions (LLP) to Kshs 0.8 bn. We had expected a 9.5% decline in LLP to Kshs 1.8 bn from Kshs 2.0 bn in H1’2017. Highlights of the performance from H1’2017 to H1’2018 include:
- Total operating income increased by 2.9% to Kshs 35.6 bn in H1’2018 from Kshs 34.6 bn in H1’2017. This was due to a 4.3% increase in Net Interest Income (NII) to Kshs 24.1 bn from Kshs 23.1 bn in H1’2017, despite Non-Funded Income (NFI) remaining flat at Kshs 11.5 bn,
- Interest income increased by 6.1% to Kshs 32.2 bn from Kshs 30.4 bn in H1’2017, driven by a 7.1% increase in interest income on loans and advances to Kshs 25.6 bn from Kshs 23.9 bn, and a 3.6% increase in interest on government securities to Kshs 6.3 bn from Kshs 6.1 bn in H1’2017. As a result, the yield on interest-earning assets increased slightly to 11.4%, from 11.2% in H1’2017,
- Interest expense increased by 11.9% to Kshs 8.1 bn from Kshs 7.2 bn in H1’2017, following a 12.0% increase in the interest expense on customer deposits to Kshs 7.3 bn from Kshs 6.5 bn in H1’2017.Interest expense on deposits and placements from banking institutions increased by 11.4% to Kshs 0.8 bn from Kshs 0.7 bn in H1’2017. Consequently, the cost of funds increased to 3.0% from 2.7% in H1’2017, while the Net Interest Margin declined to 8.6% from 8.7% in H1’2017,
- Non-Funded Income remained flat at Kshs 11.5 bn. This was due to a 1.2% decline in fees and commissions on loans to Kshs 3.08 bn from Kshs 3.11 bn in H1’2017, and a 9.7% decline in other fees and commissions to Kshs 3.7 bn from Kshs 4.1 bn in H1’2017, which offset a 7.0% rise in forex income to Kshs 2.8 bn from Kshs 2.6 bn in H1’2017, and a 15.0% rise in other income to Kshs 1.9 bn from Kshs 1.6 bn in H1’2017. The current revenue mix stands at 68:32 funded to non-funded income as compared to 67:33 in H1’2017. The proportion of funded income to total revenue increased slightly owing to the growth in NII while NFI remained flat,
- Total operating expenses declined by 6.8% to Kshs 18.5 bn from Kshs 19.9 bn in H1’2017, largely driven by a 58.9% decline in loan loss provisions to Kshs 0.8 bn in H1’2018 from Kshs 2.0 bn in H1’2017, coupled with a 5.0% decline in staff costs to Kshs 8.6 bn from Kshs 9.1 bn in H1’2017. Depreciation charge on property and equipment however increased by 10.1% to Kshs 0.9 bn from Kshs 0.8 bn in H1’2017,
- The cost to income ratio improved to 52.0% from 57.0% in H1’2017. Without LLP, the cost to income ratio also improved to 49.7% from 51.6% in H1’2017,
- Profit before tax increased by 15.9% to Kshs 17.1 bn, up from Kshs 14.8 bn in H1’2017. Profit after tax increased by 18.0% to Kshs 12.1 bn from Kshs 10.3 bn in H1’2017,
- KCB declared an interim dividend of Kshs 1.0 per share, payable on 30th November 2018 to shareholder's registered at the close of business on 3rd September 2018. We expect a final dividend per share of Kshs 2.0, taking the total dividend for 2018 to Kshs 3.0 per share, translating to a dividend yield of 6.1%,
- The balance sheet recorded an expansion as total assets increased by 5.9% to Kshs 667.7 bn from Kshs 630.6 bn in H1’2017. This growth was driven by a 35.8% growth in other assets to Kshs 22.0 bn from Kshs 16.2 bn in H1’2017, and a loan book growth of 3.6% to Kshs 421.5 bn from Kshs 407.0 bn in H1’2017. Government securities declined by 2.8% to Kshs 112.5 bn from Kshs 115.8 bn in H1’2017,
- Total liabilities rose by 6.8% to Kshs 568.7 bn from Kshs 532.3 bn in H1’2017, driven by an 8.7% increase in customer deposits to Kshs 524.9 bn from Kshs 482.8 bn in H1’2017. Deposits per branch increased by 11.1% to Kshs 2.0 bn from Kshs 1.8 bn in H1’2017. The bank highlighted the closure of 3 branches in H1’2018. The faster growth in deposits compared to loans led to a decline in the loan to deposit ratio to 80.3% from 84.3% in H1’2017,
- Gross non-performing loans increased by 13.2% to Kshs 37.6 bn in H1’2018 from Kshs 33.2 bn in H1’2017. As a consequence, the NPL ratio deteriorated to 8.4% in H1’2018 from 7.7% in H1’2017. General Loan Loss Provisions increased by 1.4% to Kshs 19.4 bn from Kshs 19.1 bn in H1’2017.Thus, the NPL coverage declined marginally to 75.0% in H1’2018 from 75.4% in H1’2017, due to the relatively faster growth in gross non-performing loans compared to growth in loan loss provisions,
- Total shareholders’ funds increased by 6.8% to Kshs 99.0 bn in H1’2018 from Kshs 98.3 bn in H1’2017,
- KCB Group is currently sufficiently capitalized with a core capital to risk weighted assets ratio of 15.7%, 5.2% above the statutory requirement. In addition, the total capital to risk weighted assets ratio was 17.2%, exceeding the statutory requirement by 2.7%. Adjusting for IFRS 9, the core capital to risk weighted assets stood at 16.6%, while total capital to risk weighted assets came in at 18.3%, indicating that the bank’s total capital relative to its risky assets declined by 1.0%, due to implementation of IFRS 9,
- KCB Bank currently has a return on average assets of 3.5% and a return on average equity of 21.9%.
Going forward, we expect the bank’s growth to be driven by:
- Alternative Distribution Channels – By leveraging on alternative distribution channels for the bank’s products and services, such as agency banking, internet and mobile banking platforms, would address the stagnating growth in non-funded sources of income for the bank thereby creating efficiencies and improving overall profitability for the bank,
- Non-Funded Income Growth Initiatives - This includes increasing other fees and commission income by leveraging on mobile and internet banking to increase the transaction income. Additionally, the brand is underutilized in fee income businesses such as investment banking, brokerage, asset and investment management, and advisory – this remains the biggest source of potential growth for KCB Group. KCB’s NFI ratio currently stands at 32.0%, a decline from 33% in H1’2017. Just moving to an NFI ratio of 40% would mean Kshs 4.5 bn of additional revenue. KCB should diversify its sources of revenue in order to sustain profitability in the interest rate cap environment.
For a comprehensive analysis, see our KCB Group PLC H1’2018 Earnings Note
Co-operative Bank Kenya released H1’2018 results during the week;
Co-operative Bank released H1’2018 results, with core earnings per share increasing by 7.6% to Kshs 2.0 from Kshs 1.9 in H1’2017, in line with our expectation of a 6.1% increase to Kshs 2.0. Performance was driven by a 6.3% increase in total operating income, despite a 5.5% increase in total operating expenses. Highlights of the performance from H1’2017 to H1’2018 include:
- Total operating income increased by 6.3% to Kshs 21.8 bn in H1’2018 from Kshs 20.5 bn in H1’2017. This was due to a 10.4% increase in Net Interest Income (NII) to Kshs 14.8 bn from Kshs 13.4 bn in H1’2017, despite a 1.6% decline in Non-Funded Income (NFI) to Kshs 7.0 bn from Kshs 7.1 bn in H1’2017,
- Interest income increased by 7.9% to Kshs 20.8 bn from Kshs 19.3 bn in H1’2017. The interest income on loans and advances increased by 5.7% to Kshs 16.1 bn from Kshs 15.3 bn in H1’2017. Interest income on government securities increased by 17.5% to Kshs 4.5 bn from Kshs 3.9 bn in H1’2017. The yield on interest earning assets however declined to 12.2% in H1’2018 from 12.4% in H1’2017, due to the increase in interest earning assets mainly being government securities that have a lower yield than loans,
- Interest expense increased by 2.2% to Kshs 6.0 bn from Kshs 5.8 bn in H1’2017, following a 2.9% increase in the interest expense on customer deposits to Kshs 5.4 bn from Kshs 5.2 bn in H1’2017. Other interest expenses declined by 5.0% to Kshs 572.8 mn in H1’2018 from Kshs 602.7 mn in H1’2017. The cost of funds increased slightly to 3.9% from 3.8% in H1’2017. Consequently, the Net Interest Margin declined to 8.6% from 8.8% in H1’2017,
- Non-Funded Income decreased by 1.6% to Kshs 7.0 bn from Kshs 7.1 bn in H1’2017. The decline in NFI was caused by a 41.4% decrease in fees and commissions on loans to Kshs 0.8 bn from Kshs 1.4 bn in H1’2017. The decline in fees is attributable to a contracting loan book, and growth in loans extended to corporates, which the bank charged minimal fees and commissions. Other fees and commissions income rose 11.0% to Kshs 4.3 bn from Kshs 3.9 bn in H1’2017, while foreign exchange trading income declined by 1.7% to Kshs 0.8 bn from Kshs 0.6 bn in H1’2017. The current revenue mix stands at 68:32 funded to non-funded income as compared to 65:35 in H1’2017. The proportion of non-funded income to total revenue declined owing to the faster growth in NII, coupled with the decrease in NFI,
- Total operating expenses increased by 5.5% to Kshs 12.0 bn from Kshs 11.3 bn in H1’2017, largely driven by a 13.0% increase in staff costs to Kshs 5.3 bn in H1’2018 from Kshs 4.7 bn in H1’2017, coupled with an 8.4% increase in other operating expenses to Kshs 5.5 bn from Kshs 5.1 bn in H1’2017. Staff costs rose faster than industry average, in part due to specialized hires made by the bank in the IT department to be used for big data analytics and credit pre-scoring purposes, with the bank indicating the hires were being paid at a premium to average market rates. The additional staff costs are equivalent to an additional Kshs 51.3 mn monthly amount. The Loan Loss Provisions (LLP) declined by 27.6% to Kshs 1.1 bn from Kshs 1.5 bn in H1’2017,
- The cost to income ratio improved albeit marginally to 54.9% from 55.3% in H1’2017. Without LLP, the Cost to income ratio deteriorated to 49.9% from 47.9% in H1’2017,
- Profit before tax increased by 7.6% to Kshs 10.0 bn up from Kshs 9.3 bn in H1’2017. Profit after tax also increased by 7.6% to Kshs 7.1 bn in H1’2018 from Kshs 6.6 bn in H1’2017,
- The balance sheet recorded an expansion as total assets increased by 3.9% to Kshs 398.4 bn from Kshs 383.3 bn in H1’2017. This growth was largely driven by a 12.0% increase in government securities to Kshs 83.1 bn from Kshs 74.2 bn in H1’2017,
- The loan book contracted marginally by 0.6% to Kshs 251.1 bn from Kshs 252.6 bn in H1’2017. The proportion of the loans extended to SMEs and Personal banking increased during the period to 8.9% and 32.2%, up from 6.7% and 31.5%, respectively in H1’2017, while Corporate loans declined to 25.0% from 26.3% in H1’2017,
- Total liabilities rose by 3.3% to Kshs 329.6 bn from Kshs 319.0 bn in H1’2017, driven by a 3.9% increase in total deposits to Kshs 297.0 bn from Kshs 285.8 bn in H1’2017. Deposits per branch remained at Kshs 1.92 bn, similar to H1’2017 despite the number of branch outlets increasing by 2 branches to 155 during the quarter,
- The faster growth in deposits as compared to loans led to a decline in the loan to deposit ratio to 84.6% from 88.4% in H1’2017,
- Gross non-performing loans increased by 130.8% to Kshs 28.2 bn in H1’2018 from Kshs 12.2 bn in H1’2017. As a consequence, the NPL ratio deteriorated to 10.9% in H1’2018 from 4.7% in H1’2017. Loan loss provisions increased by 75.6% to Kshs 7.9 bn from Kshs 4.5 bn in H1’2017.The NPL coverage decreased to 31.0% in H1’2018 from 44.7% in H1’2017, due to the relatively faster increase in the gross non-performing loans. The increase in the non-performing loans was attributed to major clients in the trade and manufacturing sectors,
- Shareholders’ funds increased by 5.5% to Kshs 68.0 bn in H1’2018 from Kshs 64.5 bn in H1’2017,
- Cooperative Bank Holdings is currently sufficiently capitalized with a core capital to risk weighted assets ratio of 15.9%, 5.4% above the statutory requirement. In addition, the total capital to risk weighted assets ratio was 16.0%, exceeding the statutory requirement by 1.5%. Adjusting for IFRS 9, the core capital to risk weighted assets stood at 16.8%, while total capital to risk weighted assets came in at 16.9%, indicating that the bank’s total capital relative to its risk-weighted assets declined by 0.9% due to implementation of IFRS 9,
- Cooperative Bank currently has a return on average assets of 3.0% and a return on average equity of 18.0%.
Going forward, we expect the bank’s growth to be driven by:
- Non-Funded Income growth initiatives – Co-operative Bank’s NFI is below the industry average, coming in at 32.1%, which is lower than the industry average of 36.0%. The bank needs to focus on increasing fee income and transactional income. To this effect, the bank is taking advantage of its alternative channels such as the mobile wallet platform, MCoop Cash mobile app, and agency banking to increase its transactional income, as more customers increase the usage of these platforms,
- Increased adoption of alternative channels by customers will improve operational efficiency in addition to increasing the bank’s transactional income. The bank is planning to aggressively grow its number of agents to 20,000 agents from the current 10,000. Agency outlets will be transformed such that basic banking services such as account opening will be done by agents in a bid to migrate transactions from the bank’s branches. Such initiatives will see the bank’s cost-to-income ratio improve significantly from the current 54.9%.
For a comprehensive analysis, see our Cooperative Bank H1’2018 Earnings Note
Barclays Bank Kenya released H1’2018 results during the week;
Barclays Bank released H1’2018 results, with core earnings per share increasing by 6.2% to Kshs 0.69 from Kshs 0.65 in H1’2017, which was lower than our expectation of a 12.7% increase to Kshs 0.73. Performance was driven by a 4.8% increase in total operating income, despite a 6.0% increase in the total operating expenses. Variance in core earnings per share growth against our expectation was due to a 26.9% increase y/y in Loan Loss Provisions (LLPs). We had expected a 20.9% decrease in LLPs to Kshs 1.1 bn, but came in at Kshs 1.7 bn. Highlights of the performance from H1’2017 to H1’2018 include:
- Total operating income increased by 4.8% to Kshs 15.7 bn from Kshs 14.9 bn in H1’2017. This was due to a 4.1% increase in Net Interest Income (NII) to Kshs 11.0 bn from Kshs 10.5 bn in H1’2017, and a 6.9% increase in Non-Funded Income (NFI) to Kshs 4.7 bn from Kshs 4.4 bn in H1’2017,
- Interest income increased by 7.6% to Kshs 14.1 bn from Kshs 13.1 bn in H1’2017. The interest income on loans and advances increased marginally by 0.6% to Kshs 10.6 bn from Kshs 10.5 bn in H1’2017. Interest income on government securities increased by 36.1% to Kshs 3.5 bn from Kshs 2.6 bn in H1’2017. The yield on interest earning assets however declined to 11.7% in H1’2018 from 12.7% in H1’2017, due to the relatively faster increase in the interest earning assets by 13.2% to Kshs 256.4 bn from Kshs 226.4 bn in H1’2017, with the increase mainly being government securities that had lower yield than loans,
- Interest expense increased by 22.4% to Kshs 3.2 bn from Kshs 2.6 bn in H1’2017, as interest expense on customer deposits increased by 19.0% to Kshs 2.8 bn from Kshs 2.3 bn in H1’2017. Interest expense on deposits from other banking institutions rose by 50.6% to Kshs 416.1 mn from Kshs 276.4 mn in H1’2017. Consequently, the cost of funds increased to 2.6% from 2.5% in H1’2017. Thus, the Net Interest Margin declined to 9.0% from 9.8% in H1’2017,
- Non-Funded Income increased by 6.9% to Kshs 4.7 bn from Kshs 4.4 bn in H1’2017. The increase in NFI was driven by a 47.1% increase in fees and commissions income from loans and advances to Kshs 474.3 mn from Kshs 322.5 mn in H1’2017, coupled with a 10.9% increase in forex trading income to Kshs 1.6 bn from Kshs 1.5 bn in H1’2017. Other fees and commissions decreased by 4.2% to Kshs 2.3 bn from Kshs 2.4 bn in H1’2017. The revenue mix shifted to 70:30 funded to non-funded income in H1’2018 from 71:29 in H1’2017, due to the faster growth in NFI,
- Total operating expenses increased by 6.0% to Kshs 5.0 bn from Kshs 4.9 bn, largely driven by a 26.9% increase in loan loss provision (LLP) to Kshs 1.7 bn in H1’2018 from Kshs 1.4 bn in H1’2017, coupled with a 7.6% increase in other operating expenses to Kshs 3.6 bn from Kshs 3.3 bn in H1’2017. Staff costs decreased marginally by 0.4% to Kshs 5.10 bn in H1’2018 from 5.12 bn in H1’2017,
- The cost to income ratio deteriorated to 66.3% from 65.5% in H1’2017. Without LLP, however, the cost to income ratio improved to 55.3% from 56.5% in H1’2017,
- Profit before tax increased by 2.6% to Kshs 5.3 bn, up from Kshs 5.2 bn in H1’2017. Profit after tax increased 6.2% to Kshs 3.8 bn from Kshs 3.5 bn in H1’2017, with the effective tax rate being 33.6%,
- Barclays Bank declared an interim dividend of Kshs 0.2 per share, which is similar to H1’2017 interim dividend payout of Kshs 0.2 per share. We expect a final dividend per share of Kshs 0.8 per share, taking the total dividend for 2018 to Kshs 1.0 per share, translating to a dividend yield of 8.3%
- The balance sheet recorded an expansion with total assets increasing by 18.1% to Kshs 316.6 bn from Kshs 268.2 bn in H1’2017. This growth was largely driven by a 33.6% increase in government securities to Kshs 70.3 bn from Kshs 52.7 bn in H1’2017 and a loan book growth of 7.5% to Kshs 176.1 bn from Kshs 163.8 bn in H1’2017,
- Total liabilities rose by 21.3% to Kshs 275.8 bn from Kshs 227.4 bn in H1’2017, driven by a 14.9% increase in total deposits to Kshs 216.8 bn from Kshs 188.7 bn in H1’2017. Deposits per branch increased by 14.3% to Kshs 2.4 bn from Kshs 2.1 bn in H1’2017, as the bank closed 2 branches in H2’2017,
- The faster growth in deposits as compared to loans led to a decline in the loan to deposit ratio to 81.2% from 86.8% in H1’2017,
- Gross non-performing loans increased by 19.7% to Kshs 14.4 bn in H1’2018 from Kshs 12.0 bn in H1’2017. Consequently, the NPL ratio deteriorated to 7.7% in H1’2018 from 7.0% in H1’2017. General Loan loss provisions increased by 27.9% to Kshs 6.4 bn from Kshs 5.0 bn in H1’2017. The NPL coverage increased to 63.0% from 58.0% in H1’2017. The increase in the non-performing loans was attributed to large loan defaults by clients mainly in the retail business segment,
- Shareholders’ funds increased marginally by 0.5% to Kshs 40.81 bn from Kshs 40.79 bn in H1’2017,
- Barclays Bank is currently sufficiently capitalized with a core capital to risk weighted assets ratio of 14.7%, 4.2%above the statutory requirement. In addition, the total capital to risk weighted assets ratio was 16.7%, exceeding the statutory requirement by 2.2%. Adjusting for IFRS 9, the core capital to risk weighted assets stood at 15.0%, while total capital to risk weighted assets came in at 16.9%, indicating that the bank’s total capital relative to its risk-weighted assets decreased by 0.2% due to the impact of IFRS 9,
- Barclays Bank currently has a return on average assets of 2.6% and a return on average equity of 17.5%.
Going forward, we expect the bank’s growth to be further driven by:
- Non-Funded Income Growth Initiatives - Barclays’ NFI is improving as the bank focuses on digital innovation and alternative banking channels in the wake of the rebranding move. These will go a long way to grow the bank’s fee income, and,
- Cost Control – Barclays’ cost to income ratio currently stands at 66.3%. The bank needs to manage any rising costs, such as those that may arise from poor asset qualities, leading to increasing provisioning, and other operational expenses, which strain its revenue. Emphasis on operational efficiency by, for example, adopting alternative channels will likely boost profitability.
For a comprehensive analysis, see our Barclays Bank H1’2018 Earnings Note
Below is a summary of the H1’2018 results for the five listed banks that have released,
|
Bank |
Core EPS Growth |
Interest Income Growth |
Interest Expense Growth |
Net Interest Income Growth |
Net Interest Margin |
Non-Funded Income (NFI) Growth |
NFI to Total Operating Income |
Growth in Total Fees & Commissions |
Deposit Growth |
Growth in Govt. Securities |
Loan Growth |
LDR |
Cost of Funds |
IFRS 9 Impact on Capital |
Return on Average Equity |
|
Stanbic Holdings |
104.5% |
15.4% |
21.7% |
11.9% |
4.9% |
34.0% |
50.0% |
(4.2%) |
21.3% |
26.9% |
15.4% |
71.4% |
3.1% |
(0.9%) |
14.8% |
|
KCB Group |
18.0% |
6.1% |
11.9% |
4.3% |
8.6% |
(0.1%) |
32.2% |
(6.0%) |
8.7% |
(2.8%) |
3.6% |
80.3% |
3.0% |
(1.0%) |
21.9% |
|
Equity Group |
17.6% |
10.2% |
14.0% |
9.1% |
8.8% |
1.5% |
40.2% |
(1.0%) |
8.5% |
18.7% |
3.8% |
69.9% |
2.7% |
(0.8%) |
23.9% |
|
Co-op Bank |
7.6% |
7.9% |
2.2% |
10.4% |
8.6% |
(1.6%) |
32.1% |
(3.0%) |
3.9% |
12.0% |
(0.6%) |
84.6% |
3.9% |
(0.9%) |
18.0% |
|
Barclays Bank |
6.2% |
7.6% |
22.4% |
4.0% |
9.0% |
6.9% |
30.0% |
1.9% |
14.9% |
33.6% |
7.5% |
81.2% |
2.6% |
(0.2%) |
17.5% |
|
Weighted Average H1'2018* |
21.2% |
8.7% |
12.9% |
7.6% |
8.4% |
3.6% |
36.0% |
(2.6%) |
9.5% |
13.9% |
4.2% |
76.9% |
3.0% |
(0.8%) |
20.8% |
|
Weighted Average H1’2017* |
(13.8%) |
(8.3%) |
(9.3%) |
(6.9%) |
7.1% |
(6.9%) |
36.1% |
16.9% |
6.0% |
17.2% |
6.8% |
77.9% |
2.9% |
- |
21.0% |
|
*Market Cap weighted average as per 17-8-2018 & 17-8-2017 |
|||||||||||||||
Key takeaways from the table include:
- All listed banks recorded an increase in core EPS growth, with the weighted average increase coming in at 21.2% compared to a decrease of 13.8% for the same period last year. Growth is driven by an increase in the Net Interest Income (NII), which came in at 7.6%, and a 3.6% growth in NFI. This indicates that the banking industry has adjusted to the new operating environment;
- Average deposit growth came in at 9.5%. Interest expense paid on deposits recorded a faster growth of 12.9% on average, indicating that more interest earning accounts have been opened;
- Average loan growth came in at 4.2%, while investment in government securities has grown by 17.1%, outpacing the loan growth, showing increased lending to the government by banks as they avoid the risky borrowers. The loan to deposit ratio thus declined marginally to 76.9% from 77.9% in H1’2017; and,
- The average Net Interest Margin in the banking sector currently stands at 8.4%, an increase from the 7.1% recorded in H1’2017.
Corporate Governance Changes:
ARM Cement PLC, which has been put under administration, issued a press release with the following highlights:
- The retirement of Mr. Wilfred Murungi as Chairman and Director, and will be replaced by Mr. Linus Gitahi, former CEO of Nation Media Group, as Chairman,
- The retirement of Mr. Surendra Bhatia as Deputy Managing Director and from the Board. The appointment of Mr. Thierry Metro, former Board Director at Lafarge Africa Plc, as his replacement,
- Pradeep Paunrana (Ms. Navishka Paunrana is his alternate), Mr. John Ngumi (Non-Executive) and Ms. Aliya Shariff (Non-Executive) will remain on the Board. Mr. Paunrana will become a Non-Executive Director with the appointment of the new CEO.
Following the changes:
- The board size remains unchanged with 9 members, an odd number, hence the score remains the same at 1.0 since 11 is the optimal number of board members;
- Gender diversity also remains unchanged at 22.2% female composition; hence the metric score also remains the same at 0.5 since it’s less than 30.0%;
- The proportion of Non-Executive Directors improves to 100.0% since the incoming Director is Non-Executive, while Pradeep Paunrana who was the Executive director, transitioned to a Non-Executive Director, pending the appointment of a new CEO, hence the score remains unchanged at 1.0 as it is still greater than 50.0%.
Overall, the comprehensive score has therefore remained unchanged at 66.7%, and the rank remained unchanged at Position 25 in Cytonn’s Corporate Governance Index.
Equities Universe of Coverage:
Below is our Equities Universe of Coverage:
|
Banks |
Price as at 10/08/2018 |
Price as at 17/08/2018 |
w/w change |
YTD Change |
LTM Change |
Target Price* |
Dividend Yield |
Upside/ Downside** |
P/TBv Multiple |
|
NIC Bank*** |
34.8 |
34.8 |
0.0% |
3.0% |
5.5% |
54.1 |
2.9% |
58.6% |
0.8x |
|
Zenith Bank*** |
22.9 |
23.6 |
3.3% |
(8.0%) |
2.6% |
33.3 |
11.4% |
57.3% |
1.0x |
|
Ghana Commercial Bank*** |
5.2 |
5.3 |
2.5% |
5.0% |
3.1% |
7.7 |
7.2% |
56.5% |
1.3x |
|
I&M Holdings*** |
116.0 |
115.0 |
(0.9%) |
10.6% |
(7.3%) |
169.5 |
3.0% |
49.2% |
1.2x |
|
Union Bank Plc |
5.6 |
5.9 |
5.4% |
(25.0%) |
12.3% |
8.2 |
0.0% |
46.8% |
0.6x |
|
Diamond Trust Bank*** |
194.0 |
197.0 |
1.5% |
2.6% |
3.7% |
280.1 |
1.3% |
45.7% |
1.1x |
|
HF Group*** |
8.0 |
7.9 |
(1.3%) |
(24.0%) |
(27.0%) |
10.2 |
4.1% |
31.6% |
0.3x |
|
UBA Bank |
9.5 |
8.4 |
(11.6%) |
(18.9%) |
(10.2%) |
10.7 |
18.0% |
31.2% |
0.6x |
|
CRDB |
160.0 |
160.0 |
0.0% |
0.0% |
(20.0%) |
207.7 |
0.0% |
29.8% |
0.5x |
|
Ecobank |
8.3 |
9.0 |
8.0% |
17.9% |
40.8% |
10.7 |
0.0% |
29.3% |
2.4x |
|
KCB Group*** |
49.5 |
49.5 |
0.0% |
15.8% |
12.5% |
60.9 |
6.1% |
29.1% |
1.6x |
|
Barclays |
12.6 |
12.0 |
(4.4%) |
25.0% |
11.6% |
14.0 |
8.3% |
19.9% |
1.6x |
|
Co-operative Bank |
17.2 |
17.1 |
(0.6%) |
6.9% |
(2.0%) |
19.7 |
4.7% |
19.2% |
1.5x |
|
CAL Bank |
1.2 |
1.3 |
3.3% |
17.6% |
59.5% |
1.4 |
0.0% |
13.8% |
1.0x |
|
Stanbic Bank Uganda |
33.0 |
33.0 |
0.0% |
21.1% |
21.1% |
36.3 |
3.5% |
13.5% |
2.1x |
|
Equity Group |
51.5 |
50.0 |
(2.9%) |
25.8% |
15.6% |
55.5 |
4.0% |
11.8% |
2.6x |
|
Bank of Kigali |
290.0 |
290.0 |
0.0% |
(3.3%) |
15.1% |
299.9 |
4.8% |
8.2% |
1.6x |
|
Guaranty Trust Bank |
39.0 |
38.0 |
(2.6%) |
(6.7%) |
(5.1%) |
37.1 |
6.3% |
1.4% |
2.2x |
|
Access Bank |
10.0 |
9.6 |
(4.0%) |
(8.1%) |
(1.3%) |
9.5 |
4.2% |
(0.8%) |
0.7x |
|
SBM Holdings |
7.0 |
6.7 |
(4.0%) |
(10.7%) |
(15.0%) |
6.6 |
4.5% |
(1.5%) |
1.0x |
|
Standard Chartered |
205.0 |
206.0 |
0.5% |
(1.0%) |
(12.0%) |
184.3 |
6.1% |
(4.0%) |
1.6x |
|
Bank of Baroda |
140.0 |
120.0 |
(14.3%) |
6.2% |
9.1% |
130.6 |
2.1% |
(4.6%) |
1.2x |
|
Stanbic Holdings |
98.0 |
106.0 |
8.2% |
30.9% |
28.5% |
85.9 |
2.1% |
(10.2%) |
1.2x |
|
Stanbic IBTC Holdings |
49.4 |
50.1 |
1.4% |
20.6% |
35.3% |
37.0 |
1.2% |
(23.8%) |
2.5x |
|
Standard Chartered |
26.1 |
26.1 |
(0.0%) |
3.2% |
15.2% |
19.5 |
0.0% |
(25.3%) |
3.3x |
|
FBN Holdings |
9.6 |
9.8 |
2.1% |
11.4% |
63.3% |
6.6 |
2.6% |
(28.4%) |
0.5x |
|
National Bank |
6.0 |
6.1 |
0.8% |
(35.3%) |
(48.7%) |
2.8 |
0.0% |
(53.3%) |
0.4x |
|
Ecobank Transnational |
21.2 |
21.1 |
(0.5%) |
23.8% |
16.9% |
9.3 |
0.0% |
(56.1%) |
0.8x |
|
*Target Price as per Cytonn Analyst estimates **Upside / (Downside) is adjusted for Dividend Yield ***Banks in which Cytonn and/or its affiliates holds a stake. For full disclosure, Cytonn and/or its affiliates holds a significant stake in NIC Bank, ranking as the 5th largest shareholder **** Stock prices are in respective country currency |
|||||||||
We are “NEUTRAL” on equities for investors with a short-term investment horizon since the market has rallied and brought the market P/E slightly above its’ historical average. However, pockets of value exist, with a number of undervalued sectors like Financial Services, which provide an attractive entry point for long-term investors, and with expectations of higher corporate earnings this year, we are “POSITIVE” for investors with a long-term investment horizon.
Jamii Africa, an InsurTech (Insurance Technology) company based in Tanzania, received an equity investment of USD 0.7 mn (Kshs 70.6 mn) for an undisclosed stake from US-based entrepreneur, Patrick Munis. The latest injection of funding draws the enterprise a step closer to its target of USD 2.0 mn (Kshs 201.7 mn), a benchmark set to facilitate its efforts to expand into Kenya.
Launched in 2015, Jamii Africa focuses on making affordable health insurance services readily available and accessible to the underserved population by providing mobile micro-health. Towards this, the company developed a mobile policy management platform with the capacity to handle all the administrative activities of an insurer, whilst also granting users easy access to cheap insurance via its Unstructured Supplementary Service Data (USSD) platform. Through strategic partnerships with an insurer, Jubilee Insurance and mobile provider, Vodacom Tanzania, their platform manages the benefits ledger and is integrated to mobile money and insurer systems to facilitate premium collection and benefit pay-outs. With flexible plans starting out at as little as USD 1.0 (Kshs 101.1) per month per person, the platform claims to have provided health insurance coverage to more than 6,400 individuals since its inception, while assisting over 2,900 people in the aspect of making health insurance claims. According to Jamii, the platform enables cost cutting up to 99% of administration costs, which results to cheaper premiums affordable to their target market.
Patrick Munis is a US-based entrepreneur of Nigerian descent who is founder and CEO of NewWave Technologies, a technology solutions provider. This marks his first investment in Africa. In February 2018, The GSM Association, through its Mobile for Development team and as part of the GSMA Ecosystem Accelerator Innovation Fund, announced that it had granted Jamii (an undisclosed amount) as part of its start-up portfolio. In early 2017 Jamii closed a USD 0.75 mn (Kshs 75.6 mn) round of seed funding, split equally between grants and venture capital. This came on the back of a USD 0.25 mn (Kshs 25.2 mn) grant from the Bill and Melinda Gates Foundation.
Tech-driven disruption in the insurance industry continues to attract investments. In July 2018, German investment firm GreenTec Capital Partners, invested an undisclosed amount in Bismart Insurance, a Kenyan insurance aggregator start-up. In April 2018, Bismart received seed capital of Kshs 1.0 mn (USD 10,000.0) from Standard Chartered’s Women in Tech Program. For more information see our Cytonn Weekly #28/2018
As is the case in many African economies, low insurance penetration, low incomes and lack of product awareness make Tanzania’s market of over 55 million people difficult for insurers to tap. According to The Tanzania Insurance Regulatory Authority, insurance penetration was 0.7% in 2016, relatively low compared to regional standards. Data by The Swiss Re Institute indicated that Insurance penetration in Kenya was 2.6% while that of Africa in general was 2.7% in 2016, vs a global average of 6.1%. We however expect improvement in this regard given Tanzania’s high and rising mobile penetration. Mobile subscriptions have grown from 27.5 mn (61% of the population) in 2013 to reach 40.0 mn, or 78% of the population in 2016, according to the Tanzania Communications Regulatory Authority. Growth in micro-insurance, a segment characterised by large volumes of small premiums is set to be driven by these statistics. Most micro-insurance products are offered through mobile network operators and financial service providers, suggesting that rising mobile penetration and the launch of new distribution channels will support future growth.
Private equity investments in Africa remains robust as evidenced by the increasing investor interest, which is attributed to; (i) rapid urbanization, a resilient and adapting middle class and increased consumerism, (ii) the attractive valuations in Sub Saharan Africa’s private markets compared to its public markets, (iii) the attractive valuations in Sub Saharan Africa’s markets compared to global markets, and (iv) better economic projections in Sub Sahara Africa compared to global markets. We remain bullish on PE as an asset class in Sub-Sahara Africa. Going forward, the increasing investor interest and stable macro-economic environment will continue to boost deal flow into African markets.
Residential:
During the week, Nairobi Lands, Urban Renewal and Housing County Executive, Mr. Charles Kerich, announced that implementation of the Nairobi Urban Regeneration Plan is set to start in September 2018. The project will commence in Pangani Estate, where a developer known as Technofin (details and real estate track record have not been disclosed), will break ground. SS Malonza, a local advocate, will be the county’s legal consultant. In the plan, Nairobi County will partner with various developers, providing them
with free land. The developers will then finance and construct the houses, 70.0% of which will be in the affordable housing bracket, with a unit price ceiling of Kshs 3.0 mn while the developers will be allowed to charge a premium on the remaining 30.0% of the units.
As covered in our Cytonn Weekly #21/2016, the programme targets to redevelop Ngara, Pangani, Ngong Road, Suna, Uhuru, and Jevanjee-Bachelor estates in its first phase, resulting in the delivery of approximately 14,000 houses.
The details of the projects and estates are outlined below:
|
The Nairobi Urban Redevelopment Plan |
|||||
|
Estate |
Acreage |
Number of Units |
Contract Sum (Kshs) |
Developers |
Developers’ Real Estate Track Record |
|
Jevanjee |
7.6 |
1,500 |
9.1 bn |
Jabavu Village Ltd |
Hilton Hotel Upperhill (ongoing) |
|
Ngong Road Phase I |
21.5 |
2,520 |
24.0 bn |
Erdemann |
Greatwall Apartments, Lake Basin Mall Kisumu |
|
Ngong Road Phase II |
Lordship Africa |
88 Condominium, Karen Hills |
|||
|
New Ngara |
4.1 |
1,500 |
9.0 bn |
KCB |
Kencom Sacco Homes Runda |
|
Pangani |
5.2 |
1,000 |
5.2 bn |
Technofin |
Undisclosed |
|
Uhuru Estates |
7.5 |
- |
3.5 bn |
Stanlib Group |
Runs Kenya’s only Real Estate Investment trust (Fahari I-REIT) |
|
Old Ngara |
5.2 |
1,050 |
7.0 bn |
Kiewa Group |
Undisclosed |
|
Suna Road |
5.0 |
1,050 |
3.5 bn |
Directline Assurance Limited |
Undisclosed |
Online Source
The Nairobi Urban Redevelopment plan, which was launched in 2016, has had challenges kicking off mainly due to:
- Inadequate development funds,
- Lack of proper land documents for some of the City Council-owned land parcels,
- Issues of transparency and accountability, especially in the face of changing government regimes, and most recently,
- Tepid interest from private developers due to the challenging Public-Private Partnership (PPP) model in Kenya.
We expect the project to kick off as planned as most of these challenges have been solved as, the County Government has since then obtained titles for the land parcels to be redeveloped, the new government has also settled into office, and the Special Purpose Vehicles (SPVs) for the various projects set. Additionally, seasoned and well-known real estate players with private funding have been on-boarded, including Lordship Africa, KCB, Stanlib, and Jabavu Limited. Under the model, the government will be tasked with (i) monitoring all necessary approvals, (ii) improving support infrastructure, and more importantly (iii) provide the development land. On the other hand, the private developers will be tasked with (i) designing the projects to ensure highest and best use of the land, to ensure maximum utilization, (ii) financing the development and seeing their construction through, and (iii) selling or exiting of the projects. In our view, the government should employ transparency in the programme so as to ensure accountability of all parties involved. The developments should also be closely monitored, and progress tracked, to facilitate timely delivery.
During the week, The Kenya Mortgage Refinancing Company (KMRC) continued to gain much-needed financial support with Co-operative Bank announcing that it will invest Kshs 200.0 mn worth of share capital in support of the facility. The facility is also expected to receive Kshs 15.1 bn seed funding from the World Bank, and Kshs 1.5 bn from the National Treasury, with the state retaining maximum ownership of 20.0%. KMRC, a mortgage liquidity facility established earlier in 2018, was created with a target of supporting Kenya’s mortgage industry by creating sustained liquidity for mortgage lenders. This will enable end users to access mortgages at lower interest rates and with longer tenors of up to 30 years. Access to mortgages
in Kenya remains low, mainly due to (i) low-income levels that cannot service a mortgage, (ii) soaring property prices, (iii) high-interest rates and deposit requirements, which lock out many borrowers, (iv) exclusion of employees in the informal sector due to insufficient credit risk information, and (v) lack of capital markets funding towards real estate purchases for end buyers. According to Central Bank of Kenya, there were only 24,085 mortgages in Kenya as at December 2016, out of a total adult population of approximately 23.0 mn persons, with the mortgage to GDP ratio standing at 2.7%, compared to countries such as South Africa and USA, which have a ratio of above 30.0% and 70.0%, respectively. The Mortgage Refinancing Company is tipped to increase the number of active mortgages in Kenya by about 100.0% to at least 50,000 by 2022. However, despite the financial support, as stated in our April 2018 topical, other factors that are necessary to actualize KMRC’s operations and goals include;
- Transparency and effective regulation of the facility by an independent regulatory body to avoid fraud,
- Governance rules designed to ensure its efficiency, especially given that the government is the largest shareholder,
- A clear and efficient land titling process,
- Sufficient support from the private sector, especially in regards to bond issuance, and
- Provision of affordable homes.
Co-operative Bank’s move is commendable as it sets the path for other private institutions and investors while also validating the facility, which is bound to attract more private sector investment.
Commercial:
The retail industry saw a flurry of activity during the week, with renowned German engineering and electronics firm, Bosch, launching its first store in Central and East Africa in Westlands, at The Oval. The retailer intends to have Nairobi as its main regional hub before further expansion in the Central and East African market. The retailer also has offices in Egypt, Morocco, Nigeria, Angola and Mozambique, and a production plant in South Africa.
Also, fast-food chain Subway, announced plans to open 4 more branches in Nairobi. The food chain, which is looking to occupy spaces of 400-1,200 SQFT within the CBD, Upperhill, Lavington, and Mombasa Road, currently has 9 outlets in Kenya, and operations in 110 countries. Similarly, Chicken Inn parent group, Innscor, based in Zimbabwe announced plans to expand its footprint within the Kenyan market, in a USD 4.3 mn investment that is also aimed at increasing its operations in Zimbabwe and Mauritius. The fast-food chain has 121 local outlets, including its other chains such as Bakers’ Inn, Pizza Inn, and Creamy Inn. This reaffirms Nairobi’s attractiveness as a regional hub for investment, which is a positive sign especially for real estate investments. (A detailed analysis of the entry of international retailers in Kenya is covered in a note below)
Hospitality:
Regional airline, Jambojet announced plans to increase the frequency of its Nairobi-Kisumu flights by 20.0%, to 24 flights from the current 20 per week. Jambo Jet is the latest airline to increase flight frequency in Kenya, following increments by notable airlines such as;
- Air France, which increased their flight frequency between Paris and Nairobi by 66.7% from 3 per week to 5,
- Ethiopian Airline, which doubled its Mombasa flights from Addis Ababa, and,
- Local jet airline Silverstone, which has recently launched daily flights to Mombasa and the Maasai Mara.
The increase in the frequency of flights indicates a gain in popularity of air travel, which we attribute to;
- An increase in holiday travels, as well as an increase in MICE conferences; with local conferences held rising by 2.4% to 3,844 in 2017 from 3,755 in 2016, as per the KNBS Economic Survey,
- Improved infrastructure, such as upgrading airports to international status, such as in Kisumu, and Isiolo, as well as construction of another terminal at the Jomo Kenyatta International Airport (JKIA),
- A rise in living standards as the middle-income class grows, and,
- Competitive fares as a result of a rapidly growing air travel industry, for instance, Jambojet’s one-way ticket from Nairobi to Kisumu costs as low as Kshs 3,500, 133.3% higher than a one-way ticket for a bus; yet, a flight reduces the trip time by 966.7%, to 45 minutes from 8 hours by a bus.
Driven by the above factors, we to continue witnessing an increase in air travel locally that will necessitate further improvement of infrastructure, thus opening up new areas for real estate investments. Kisumu County also attracts a significant number of visitors with sites such as Kisumu Museum attracting the third highest number of visitors in Kenya p.a., after Nairobi National Park and Fort Jesus, as per The KNBS Economic Survey 2018. Additionally, the county has seen an improvement in its accommodation sector with 4-star hotels such as Acacia coming to the market in the last two years. Infrastructural developments in recent years have also improved ease of access to the city, further boosting its hospitality and tourism sectors. These developments include; upgrading of the airport to international status, and development of roads such as the Nyamasaria and Kisumu- Kisian Highway.
Other highlights of the week include:
- Superior Homes, the master-planned developer where Cytonn holds a strategic stake, completed the construction of its Nakuru (Lake Elementaita) holiday homes facility, seated on a 12-acre development named Lake Elementaita Mountain Lodge, consisting of 33 standard villas, 13 villa suites, and four executive villas, as well as a recreation and conference facility. The Kshs 800.0 mn project, is situated along Nairobi-Nakuru highway. According to Cytonn Hospitality Report 2016, Nakuru recorded an Average Daily Rate (ADR) of Kshs 218, compared to the national average of Kshs 212, indicating an opportunity for investors; while it came in fourth, in terms of investment opportunity, after Maasai Mara region, Nairobi, and Mt Kenya regions,
- In Kisumu, developers Victoria Housing Ltd unveiled a 12-acre project that will see the delivery of 55 units comprising of 2–bedroom apartments, and 3 & 4-bedroom detached units with price points of Kshs 10.0 mn, Kshs 17.0 mn and Kshs 20.0 mn, respectively, in the Kanyakwar Suburb. As per Cytonn Kisumu Investment Opportunity Report, the residential sector in Kisumu had average rental yields of 5.1%. Apartments outperformed detached units, recording average rental yields of 8.5%, and relatively high uptake of 23.4%, compared to detached units’ 3.8% and 16.1% for rental yields and uptake, respectively,
- Kenya’s Deputy President William Ruto, launched the construction of the 70 Km long Ngong-Suswa Road. The project, which is expected to take 2 years, is estimated to cost Kshs 4.0 bn. This is bound to enhance accessibility in the county, especially in the parts of Kajiado County where the road traverses, thus, opening up areas for real estate investments.
Listed Real Estate:
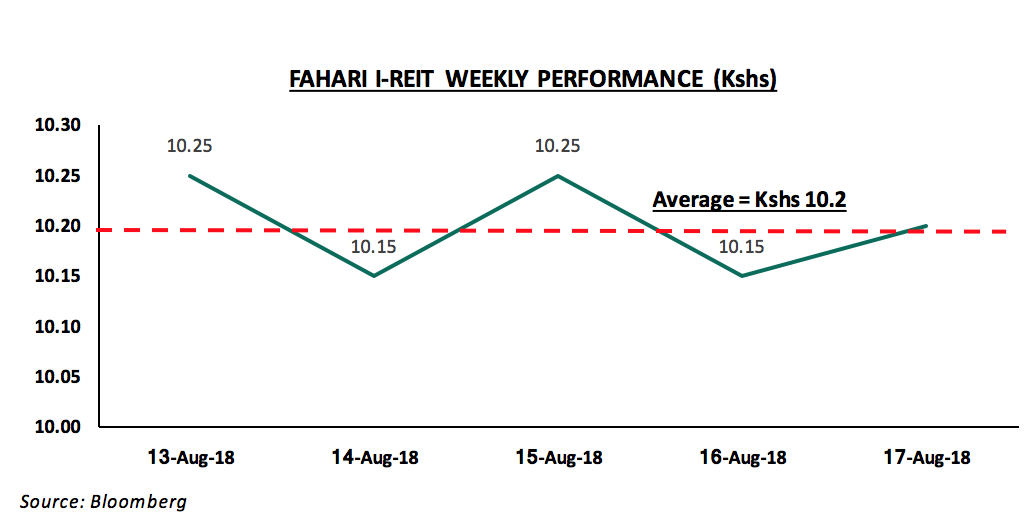
The Fahari I-REIT closed the week at Kshs 10.2, which was the same last week’s average, and a marginal decline from the week’s opening price of Kshs 10.25. During the week, it recorded an average of Kshs 10.2, which is a decline of 19.1% from last year’s trade price of Kshs 12.61 during the same period. This is as their H1’2018 earnings results registered a 16.3% y/y decline in earnings to Kshs 0.36 per unit from Kshs 0.43 per unit in H1’2017. The decline in performance is attributed to a temporary increase in vacancies, coupled with some tenants bargaining for reduced rentals upon the renewal of leases, leading to a reduction in rental income, thus resulting to low trade volumes, as an indication of low investor appetite.
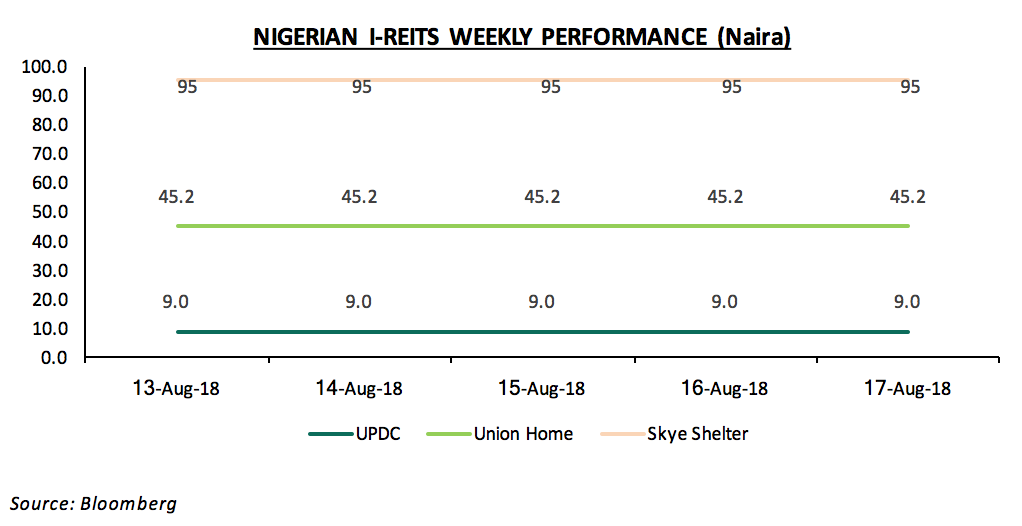
The Nigerian I-REIT market remained unchanged, with Union Homes, Skye Shelter, and UPDC, retaining a price per share of N45.2, N95 and N9, respectively, throughout the week. This is as a result of inadequate investor knowledge about the market hence low investor interest in the instrument, and poor valuation of the market, which leads to lower levels of demand by potential investors.
We expect to continue attracting international investors, on the back of continued infrastructural improvements, expanding middle class and sustained by the relatively high real estate returns, which have a 5-year average of 24.3% p.a.
International Retailers Mini Note
Kenya’s retail sector has been vibrant over the past few years, and we have witnessed the sector revolutionize from a predominantly informal sector to having the second highest penetration of formal retail in Africa with a 30.0% penetration of formal retail after South Africa with 60.0%. The growth of the sector has in turn, attracted global interest from renowned international retailers such as Carrefour, fast food restaurants such as Yum! Brands – the parent company of KFC and Pizza Hut, as well as select luxury
brand stores such as Swarovski, a crystal jewelry store; and luxury car brands such as Porsche and Bentley, just to name a few.
In this mini note, we look at:
- Notable international retailers who have penetrated the Kenyan market within the last 6-years,
- Factors that are driving these global giants’ growing interest in Kenya, and,
- Conclusion on the impact this is bound to have on the local market.
- The table below shows some of the notable shops and brands that have set up shop in Kenya within the last 6 years:
|
Select International Retailers in Kenya |
|||||
|
Outlet |
Parent Company |
Origin Country |
Year of Commencement |
No. of Local Outlets |
Number of Global outlets |
|
Food Chains |
|||||
|
Mugg & Beans |
Famous Brands |
South Africa |
2017 |
1 |
220 |
|
Burger King |
Restaurants Brand International |
United States |
2017 |
4 |
16,859 |
|
Pizza Hut |
Yum! Brands |
United States |
2016 |
2 |
16,796 |
|
Dominos |
Bain Capital, Inc. |
United States |
2014 |
3 |
15,000 |
|
Coldstone |
Kahala Brands |
United States |
2014 |
8 |
1,100 |
|
Chicken Inn/Pizza Inn/Bakers’ Inn/Creamy Inn |
Innscor Africa |
Zimbabwe |
2013 |
121 |
398 |
|
KFC |
Yum! Brands |
United States |
2012 |
19 |
20,404 |
|
Subway |
Doctor's Associates, Inc. |
United States |
2011 |
8 |
44,834 |
|
Hypermarkets |
|||||
|
Miniso |
Miniso |
Japan |
2017 |
6 |
>2,600 |
|
Choppies |
Choppies Enterprises Limited |
Botswana |
2017 |
12 |
212 |
|
Carrefour |
Majid Al Futtaim Holding |
France |
2016 |
6 |
12,300 |
|
Game |
Massmart |
South Africa |
2016 |
1 |
424 |
|
Other Stores |
|||||
|
LC Waikiki |
LC Waikiki Retailing Ltd |
Turkey |
2017 |
2 |
881 |
|
Swarovski |
Swarovski Group |
Austria |
2017 |
1 |
2,800 |
|
Bosch |
Robert Bosch Stiftung GmbH |
Germany |
2018 |
1 |
>440 |
|
Woolworths |
Woolworths Holdings Ltd |
South Africa |
2012 |
12 |
1,400 |
|
Incoming Retailers |
|||||
|
Shoprite |
Shoprite Holdings Ltd |
South Africa |
* |
|
>500 |
|
|
|
|
|
|
|
Source: Online, Wikipedia
* Shoprite is expected to enter the Kenyan market this year; taking up space in Garden City and Westgate malls
B. Factors driving the continued entry of these international retailers to Kenya are:
Increased Disposable Income: This has been as a result of an expanding middle class. According to KNBS Economic Survey 2018, private consumption expenditure recorded the highest growth, since 2013 when it recorded 8.4%, in 2017 by 7.0%, compared to 4.7% in 2016, 5.2% in 2015, and 4.3% in 2014,
- Stable Economic Growth: In addition to being a diversified economy, the grip on the nation’s inflation rates, interest rates and prices has been relatively stable, compared to other countries, thus creating an enabling environment for the retailers to make desirable profits,
- Positive Demographic Dividend: The country’s population has been steadily growing at approximately 2.6% p.a. with a rapid urbanization rate of 4.3%, in comparison to the global 1.2% and 2.1%, respectively. This has led to a demand for retail outlets especially in growing urban regions,
- Provision of high-quality spaces in line with international standards as well as infrastructure,
- Rise in Dollar Millionaires and Ultra-Wealthy Individuals: According to Knight Frank’s Wealth Report 2018, Kenya’s ultra-high net-worth individuals (UHNWI), worth USD 50.0 mn, excluding their primary residence in Kenya, increased by 13.0% to 90 in 2017 from 80 in 2016, while high net-worth individuals (HNWI) increased by 16.2% to 1,290 from 1,110, during the same period, with the number of wealthy Kenyans expected to increase by 58.3% on average by 2022. This specifically leads to an increase in demand for luxury brands,
- Increased Demand for International Brands: This is due to consumer’s change in tastes and preferences,
- Insufficient Competition Due to Struggling Local Retailers: Such as Nakumatt and Uchumi, creating an easy gap for the international retailer’s expansion, Carrefour, has taken up 4 of the 9 malls vacated by Nakumatt within Nairobi.
C. The entries have impacted the local sector in the following ways
- Developers are now keen to develop high-quality retail spaces that conform to international standards so as to attract multinational firms,
- Intense competition for footfall between local retailers and the international retailers,
- High retail sector yields as multinationals are willing to pay a premium for good space; with the retail real estate theme recording average retail yields of 9.7% in H1’2018, compared to 5.4% for residential and 9.3% for commercial office, and
- Consequently, this has led to an increase in retail construction activity both by local and international investors, with Nairobi’s mall space growing by an 8-year CAGR of 15.9% to approx. 6.5 mn SQFT as at 2018, from 2.0 mn SQFT in 2010. Other counties such as Kiambu, and Mombasa, also continue to attract foreign retailers evidenced by Choppies’ superstore in Kiambu, and LC Waikiki’s plan to expand to Mombasa. Kiambu and Mombasa are estimated to have a mall space of 0.9 mn SQFT, and 1.4 mn SQFT, respectively.
In our view, these entries reaffirm Kenya’s position as one of the leading regional hubs for investments in the continent. We therefore expect to see continued interest from foreign players and investors on the back of, (i) continued infrastructural improvements, (ii) attractive returns, and (iii) expanding middle-class, and hence growing disposable incomes
The International Monetary Fund (IMF) recently concluded their visit to Kenya where they were holding discussions with the Kenyan Government on the second review under a precautionary Stand-By Arrangement (SBA), which was extended to Kenya on 14th March 2016. The SBA is a lending arrangement extended by the IMF to member countries in emerging markets in need of financial assistance, normally arising from financial crisis. In a press statement after the Kenyan visit, the IMF stated that their mission to assess the Kenyan economy achieved significant progress, but it remains uncertain if Kenya’s access to the standby facility will be extended as talks with the government are set to continue. As such, this week we are focusing on whether Kenya needs the facility. In this note we shall address the following items:
- The IMF’s available programs and engagement with Kenya,
- The IMF’s visit to Kenya in 2018 and the key take outs,
- Economic factors that warrant the need for the IMF Facilities,
- Our view on the way forward.
Section I: The IMF’s available programs and engagement with Kenya:
The International Monetary Fund was created to protect the stability of financial systems globally. The IMF does this by offering loan facilities to countries facing Balance of Payment problems to stabilize and restore their economic growth while maintaining safe level of reserves on affordable terms as compared to financing from capital markets. Unlike the World Bank and other development agencies, the IMF does not finance projects and its main role is crisis resolution through various forms of lending, which include:
- Stand-By Arrangement (SBA): The SBA is the main lending arrangement advanced to emerging markets. It is a non-concessional lending arrangement with a market-based interest rate, though almost always lower than the rates from private markets financing arrangements,
- Flexible Credit Line (FCL): The FCL is advanced to countries with good track records and strong policies. A country has the flexibility of treating the FCL as a precautionary or draw from it once it is approved. The facility could be for either 1 or 2-years with the option of renewal. Once approved, the country is given the rights to access these resources without pre-set conditions on economic policies or in disbursements set in phases like in emerging countries. Countries that qualify for FCL must exhibit a strong track record and as a result the IMF has confidence that their economic policies would remain strong even in the event of external shocks,
- The Precautionary and Liquidity Line (PLL): The PLL serves as insurance for countries with strong economic policies, by providing financing to meet potential balance of payments needs a country may be facing. It has similar qualification process to FCL, but unlike FCL it has ex-post conditions with the purpose of addressing the likely vulnerabilities that might have been identified during the qualification process,
- Rapid Financing Instrument (RFI): Under this facility, member countries facing immediate Balance of Payment issues including those emerging from natural disasters, commodity price shocks, among others, can access financing without the need for a full-fledged program,
- Extended Fund Facility: This facility is advanced to address balance of payments resulting from structural problems a country may be facing that may require a long time to correct. The program is usually backed by measures aimed at improving the workings of the markets as well as institutions through measures such as financial sector and tax reforms,
- The Rapid Credit Facility (RCF): which is advanced low-income countries that are facing urgent balance of payment needs. The program mainly focuses on reduction of the country’s poverty levels as well as enhance its growth objectives by providing high levels of concessions as compared to market rates, and,
- The Standby Credit Facility (SCF): The program provides financing to low-income countries that are facing short-term Balance of Payments needs. The facility as well focuses mainly on poverty reduction while promoting the country’s growth objectives by charging low interest rates as compared to market rates. The facility can also be used on a precautionary basis to cushion the country from external shocks.
Kenya has in the past been able to access various forms of financing from the IMF dating back to 7th July 1975, with the latest ones being approved on 14th March 2016, where the IMF advanced a new arrangement totaling to USD 1.5 bn through a standby arrangement (SBA) and a standby credit facility (SCF) of USD 989.8 mn and USD 494.9 mn, respectively.
|
Amounts in USD, converted from SDR at current exchange rate 1 SDR=USD 1.39 (as at 15 August 2018) |
|||||||||||
|
Facility |
Date of Arrangement |
Expiration Date |
Amount Agreed |
Amount Drawn |
Amount Outstanding |
||||||
|
Standby Arrangement |
14-Mar-2016 |
13-Mar-2018 |
985,870.0 |
0 |
0 |
||||||
|
Standby Credit Facility |
14-Mar-2016 |
13-Mar-2018 |
492,934.3 |
0 |
0 |
||||||
|
Standby Credit Facility |
2-Feb-2015 |
14-Mar-2016 |
188,623 |
0 |
0 |
||||||
|
Standby Arrangement |
2-Feb-2015 |
14-Mar-2016 |
490,419.8 |
0 |
0 |
||||||
|
Extended Credit Facility |
31-Jan-2011 |
19-Dec-2013 |
679,042.8 |
679,042.8 |
642,072.9 |
||||||
|
Extended Credit Facility |
21-Nov-2003 |
20-Nov-2007 |
208,500 |
208,500 |
5,212.5 |
||||||
|
Extended Credit Facility |
4-Aug-2000 |
3-Aug-2003 |
264,100 |
46,704 |
0 |
||||||
|
Extended Credit Facility |
26-Apr-1996 |
25-Apr-1999 |
207,874.5 |
34,645.8 |
0 |
||||||
|
Extended Credit Facility |
22-Dec-1993 |
21-Dec-1994 |
62,869.7 |
62,869.7 |
0 |
||||||
|
Extended Credit Facility |
15-May-1989 |
31-Mar-1993 |
363,346 |
300,472.1 |
0 |
||||||
|
Structural Adjustment Facility Commitment |
1-Feb-1988 |
15-May-1989 |
138,166 |
39,476 |
0 |
||||||
|
Standby Arrangement |
1-Feb-1988 |
15-May-1989 |
118,150 |
87,014 |
0 |
||||||
|
Standby Arrangement |
8-Feb-1985 |
7-Feb-1986 |
118,428 |
118,428 |
0 |
||||||
|
Standby Arrangement |
21-Mar-1983 |
20-Sep-1984 |
244,570.5 |
244,570.5 |
0 |
||||||
|
Standby Arrangement |
8-Jan-1982 |
7-Jan-1983 |
210,585 |
125,100 |
0 |
||||||
|
Standby Arrangement |
15-Oct-1980 |
7-Jan-1982 |
335,685 |
125,100 |
0 |
||||||
|
Standby Arrangement |
20-Aug-1979 |
14-Oct-1980 |
170,240.3 |
0 |
0 |
||||||
|
Standby Arrangement |
13-Nov-1978 |
19-Aug-1979 |
23,977.5 |
23,977.5 |
0 |
||||||
|
Extended Fund Facility |
7-Jul-1975 |
6-Jul-1978 |
93,408 |
10,703 |
0 |
||||||
|
Total |
|
|
5,396,790 |
2,106,603 |
647,285 |
||||||
|
*SDR (Special Drawing Rights) - Artificial currency instrument used by the IMF, and is built from a basket of important national currencies. The IMF uses SDRs for internal accounting purposes 1 SDR=USD 1.39 (as at 15 August 2018) |
|||||||||||
On a letter of intent dated January 16th, 2015, the Government of Kenya made a request to the IMF to be granted access to a blended program supported by a Stand-By Credit Facility (SCF), with total access of SDR 488.5 mn (about USD 679.0), over the next 12-months, of which SDR 352.8 mn (about USD 490.4) under the SBA and SDR 135.7 mn (About USD 188.6) under the SCF. While noting that the country did not have balance of payments needs, the government cited concerns of possible vulnerabilities from exogenous shocks. This was due to the expected capital expenditure from the planned acceleration of infrastructural projects, which included (i) the Standard Gauge Railway, (ii) expansion of expansion of geo-thermal power generation capacity at the Olkaria III complex whose completion in 2016 added 29 MW, increasing the facility’s capacity to 139 MW, (iii) expansion of the port of Mombasa, and (iv) enhancement of food security by expanding irrigation. The expected reforms, coupled with incidences of terrorism, which has previously adversely affected investor’s risk, represented additional challenges and as such, the government saw the need for the program as a way of mitigating possible exogenous risks. The Executive Board of the IMF later on 2nd February 2015 approved a 1-year arrangement comprising of a SDR 352.8 mn (about USD 497.1 mn) Stand-By Arrangement and a SDR 135.7 mn (about USD 191.2 mn) arrangement under the Stand-By Credit Facility.
On 14th March 2016, after the expiry of the previous SBA and SCF for Kenya, the IMF approved a new arrangement totaling USD 1.5 bn comprising of a SDR 709.3 mn (about USD 989.8 mn) 24-month Stand-By Arrangement (SBA) and a SDR 354.6 mn (about USD 494.9 mn) 24-month Standby Credit Facility (SCF). Before the recent visit to Kenya by the IMF officials, only the 1st review had been completed on 25th January 2017. The Executive Board of the International Monetary Fund (IMF) had approved the Kenyan Government’s request for a 6-month extension of the Stand-By Arrangement (SBA) on 12th March, 2018, to allow more time for the completion of the outstanding reviews. Key to note, the 6-months extension request was only for the SBA arrangement and not the SCF since the SCF arrangement can be approved up to a maximum of 24-months, which had already lapsed. The 2nd and 3rd reviews of the arrangement had been pending since the fiscal balance, which is a key performance criterion, had not been met as at the end of December 2016 and June 2017 attributed to the shortfall in revenues and pressure on government spending, which was partly due to the challenging operating environment. An understanding could not be reached on corrective measures the government was to undertake to tackle the problems on account of the prolonged electioneering period thus the request for an extension. To resolve the fiscal deficit problem, the government highlighted its intention to reduce the expenditure as well as increase revenues through the introduction of the Finance Bill, which would have several tax reforms.
Section II: The IMF’s Visit to Kenya in 2018 and the key take outs:
A team from the International Monetary Fund (IMF) later visited Kenya from July 23rd to August 2nd, 2018, to hold discussions on the second review under a precautionary Stand-By Arrangement (SBA). From the discussions with the Kenyan authorities, they noted that:
- Kenya’s economy had continued to perform well with the GDP having expanded by 5.7% in Q1’2018, up from 4.9% growth experienced in Q1’2017, with the growth being driven by strengthened investor confidence following the conclusion of the prolonged electioneering period, improved weather conditions in 2018 with the country having experienced a drought in 2017 and a recovery in tourism, which can be evidenced by an increase in the total number of visitors arriving through Jomo Kenyatta International Airport and Moi International Airports, that increased by 2.1% to 76,608 in June 2018 from 75,028 in May 2018, despite a 4.4% decline y/y from 80,121 in June 2017, as per data from Kenya National Bureau of statistics (KNBS),
- Inflation has remained within the 2.5% - 7.5% government set target since July 2017. Inflation has been low, coming in at 4.4% in July and averaging 4.3% for the 1st 7-months of 2018, compared to 9.5% in a similar period in 2017. We expect inflation to remain within target in 2018 despite the expectations of upward pressure in H2’2018, partly due to the base effect, and the expected rise in fuel and transport prices with the introduction of 16.0% VAT on petroleum products as from September 2018 and other tax reforms proposed under the Finance Bill 2018,
- Kenya had managed to meet the IMF’s program fiscal target for the FY2017/2018, with the budget deficit for the 2017/2018 fiscal year coming in at Kshs 614.6 bn (equivalent to 7.0% of GDP), which is a significant narrowing from 9.0% of GDP previously,
- The current account deficit has started to adjust in 2018 after widening to 6.7% of GDP in 2017 from 5.2% in 2016, which was mainly driven by higher food imports and weaker agricultural exports due to the drought experienced during the year, coupled with higher fuel imports owing to rising global oil prices. The lower current account deficit so far in 2018, which narrowed to 5.8% in the 12-months to June 2018 from 6.3% in March 2018, has been attributed to improved agriculture exports, and lower capital goods imports following the completion of Phase I of the SGR project, and,
- The Kenyan Shilling has remained resilient against major currencies, while foreign exchange reserves have been relatively high currently standing at about USD 8.7 bn (equal to 5.8-months of projected imports for 2018).
Based on the above, GDP growth, inflation and the performance of the Kenyan shilling are positive while we are neutral on the fiscal deficit and the current account deficit. As such, we are of the view that Kenya is on the right trajectory towards improving the macroeconomic conditions of the country. From the FY 2018/2019 budget, the government is set to focus on a fiscal consolidation plan aimed at narrowing the fiscal deficit to 5.7% of GDP from 7.2% of GDP in the FY 2017/18 and further to around 3.0% of GDP by FY 2021/22. The government plans to achieve this through revenue enhancement measures, projected to raise revenue by 17.5% to Kshs 1.9 tn (equivalent to 20.0 percent of GDP) in the FY 2018/19 from the estimated Kshs 1.7 tn collected in the FY 2017/18, and a reduction in Government expenditure, which will in turn lead to reduced dependency on debt with the total borrowing requirement to plug in the deficit expected to decline to Kshs 558.9 bn from Kshs 620.8 bn, in a bid to reduce Kenya’s public debt burden. The existing program is set to expire on September 14th 2018 and it remains uncertain if Kenya’s access to the stand-by facility will be extended as talks with the government are set to continue in the coming week with the IMF team expected to submit final report to the IMF Board by the end of August.
Section III: Economic Factors that warrant the need for the IMF Facilities
Since the approval of the standby credit facility, Kenya has not tapped into the facility. We believe that the following economic factors may warrant the need for Kenya to take up the IMF facilities;
- Sustaining the strong performance of the Kenyan Shilling
The Kenyan Shilling has continued to be resilient against major global currencies having gained by 2.7% against the US dollar on a year to date basis, being the best performing currency in Sub Saharan Africa despite the dollar index also gaining by 4.9% in a similar period. The shilling has continued to be stable despite the extended electioneering period and global disturbances resulting from monetary policy decisions such as the Fed-rate hikes for the first time in 9-years that were expected to result in capital outflows from emerging markets as well as the tax-cutting policies being implemented in the USA. The stability of the shilling has further been supported by the high forex reserves currently at USD 8.7 bn (equivalent to 5.7 months of import cover) that are adequate to cushion the Kenyan Shilling against major global currencies. The high forex reserves have however mainly been boosted by debt capital as seen from the chart below, with the hike in 2017 being attributed to the USD 800 mn syndicated loan from 4 international banks and the USD 500 mn facility from the African Export-Import Bank (Afreximbank). The 2018 hike in the reserves has also been boosted by Kenya’s issue of a 10-year and 30-year Eurobond where it raised USD 2.0 bn, which propped up the Kenyan Shilling, coupled with the support from the improvements in primary exports, which include coffee, tea and horticulture, which increased by 10.8% during the month of May to Kshs 24.3 bn from Kshs 21.9 bn in April, with the exports from coffee, tea and horticulture improving by 11.0%, 19.1% and 2.0% m/m, respectively. The availability of the Standby-facility as a precautionary measure would be essential in cushioning the Kenyan shilling to eventualities of unforeseen external shocks.
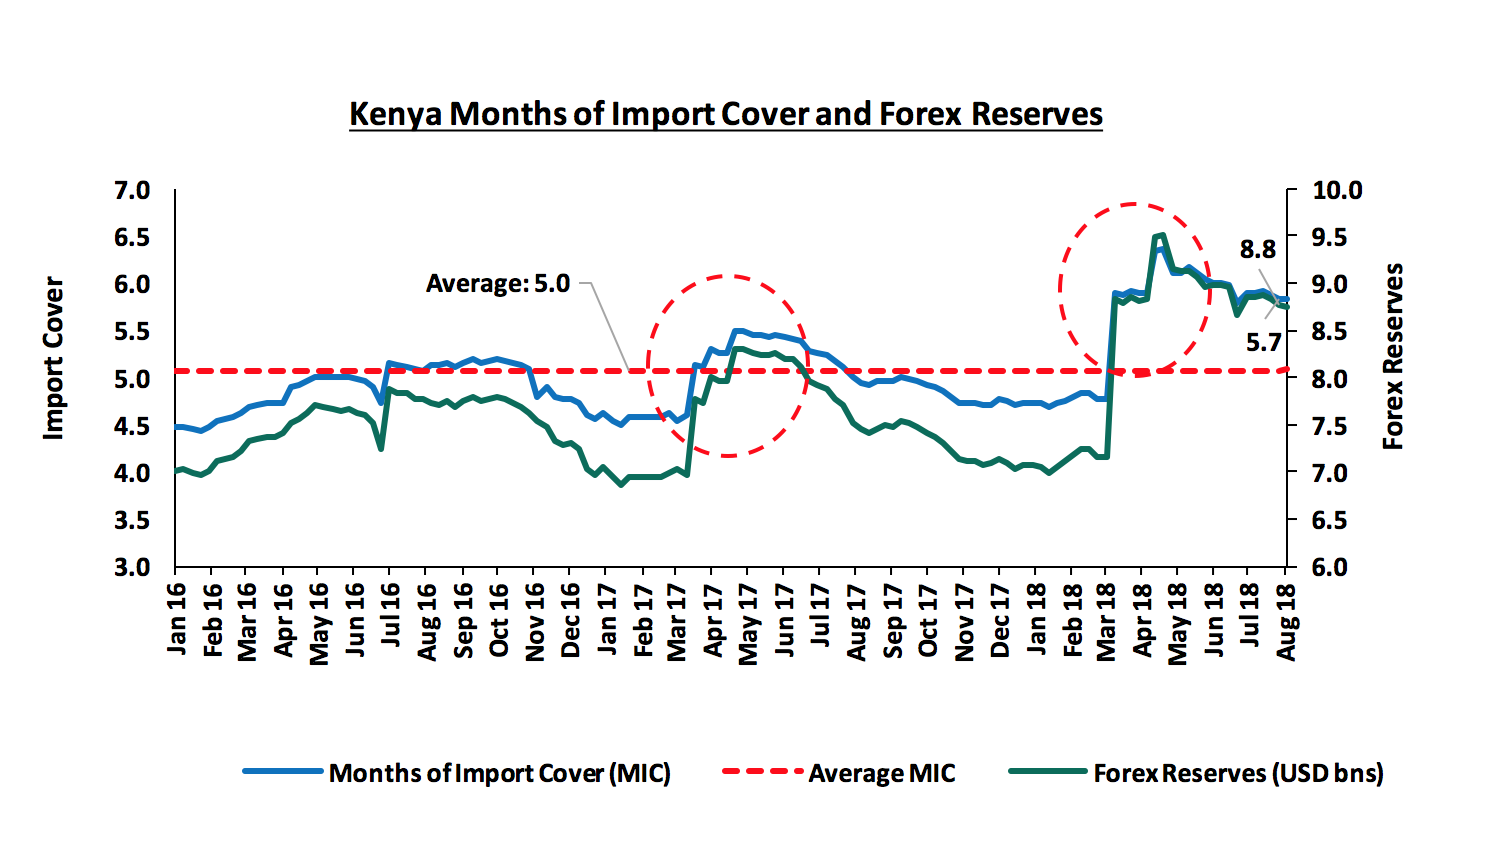
- Unsustainable Debt Levels
Kenya’s debt portfolio is high having hit 55.6% by the end of 2017, 5.6% above the East African Community (EAC) Monetary Union Protocol, the World Bank Country Policy and Institutional Assessment Index, and the IMF threshold of 50.0%. This was a rise from 43.9%, 5-years ago, and 38.4%, 10-years ago. It was estimated that Kenya would use approximately 40.3% of the revenues raised from tax collection to finance debt payments in the fiscal year 2017/18. Kenya’s current Public & Publicly Guaranteed External debt stood at USD 24.9 bn as at March 2018. With the expectations of outflows due to debt financing of the outstanding external debt, coupled with major infrastructural projects under the Big 4 Agenda, we expect the forex reserves to decline and as such, the IMF reserve would be essential as a precautionary measure to safeguard the country from any external shocks. As detailed in our topical on Kenya’s Public Debt, Should We Be Concerned?, the Kenyan Government has started embarking on measures to improve debt management, as detailed in the budget, which include:
- Raising revenue targets in order to minimize the reliance on debt,
- Building an export-driven economy by encouraging growth in the manufacturing sector to increase the value-added exports in a bid to improve the Balance of Payment,
- Active private sector involvement in development projects in order to reduce the strain on government expenditure and hence borrowing.
- The government is also recruiting debt management experts who will be tasked with providing guidance on determination of borrowing ceilings for national and county governments, as well as preparing proposals for debt restructuring and liaising with the Central Bank of Kenya (CBK) and other Treasury departments for effective debt management.
Section IV: Our View on the Way Forward:
We need to do all we can to qualify for the renewal of the SBA program because:
- Programs from the IMF largely comes attached with conditions aimed at enhancing fiscal discipline, which if implemented would reduce risk perception of Kenya and reassures investors. Conditions include - policy changes, such as the targeted inflation that the country must maintain, increased taxation in a bid to increase government revenues while minimizing dependency on debt, cutbacks of government spending and reduction of fiscal deficits. As such, this reduces the risk perception of countries while improving investor sentiments as signing up to undertake the fiscal policy measures in order to be granted access to the facilities would provide reassurance to investors of expected improvements and stability in the macroeconomic conditions of such a country. In the event of the country issuing more external debt, the availability of the facilities would lead to a reduction in the risk premium demanded by investors due to the improved risk perception,
- Cushioning from shocks: Despite the high forex reserves and improving macroeconomic conditions currently being experienced in Kenya, with the country having expanded by 5.7% in Q1’2018 and positive adjustments in the current account deficit having narrowed to 5.8% in the 12-months to June 2018, from 6.3% in March 2018, we are of the view that the availability of the program as a precautionary facility would be essential in cushioning the country from unforeseen exogenous shocks such as sharp rises in global oil prices, massive dollar outflows that would to a volatile dollar exchange rate, and other risks which would threaten forex reserves. The facility would also be essential in enhancing offshore investments, as it would show the level of preparedness of the country to eventualities of a weakening currency thus reducing currency risk.
Disclaimer: The views expressed in this publication are those of the writers where particulars are not warranted. This publication, which is in compliance with Section 2 of the Capital Markets Authority Act Cap 485A, is meant for general information only and is not a warranty, representation, advice or solicitation of any nature. Readers are advised in all circumstances to seek the advice of a registered investment advisor.

- Talk to us
- Kenya
- P.O Box 20695 - 00200, Nairobi, Kenya
- Cell +254709101200
- Tel +254709101200
- WhatsApp +254741676635
- United States
- +254709101200
- DOWNLOAD OUR APP
-


- Kenya
- 8th Floor, Pinetree Plaza, Kaburu Drive, Ngong Road, Nairobi, Kenya
- USA
- Suite 1150, 1775 Eye Street NW, USA, Washington DC 20006, USA
- Investments
- High Yield
- Private Equity
- Real Estate
- Real Estate
- RiverRun Estates
- Cytonn Towers
- The Ridge
- Taraji Heights
- The Alma