Kenya’s Public Debt: On a path to Distress?, and Cytonn Weekly #40/2021
By Cytonn Research, Oct 10, 2021
Executive Summary
Fixed Income
During the week, T-bills remained undersubscribed, with the overall subscription rate coming in at 40.9%, a decline from 42.2% recorded the previous week. The continued undersubscription is attributable to investors shifting to the bond market in search for higher yields. The 91-day paper recorded the highest subscription rate, receiving bids worth Kshs 3.4 bn against the offered Kshs 4.0 bn, translating to a subscription rate of 85.6%, an increase from 66.0% recorded the previous week. The yields on the 91-day, 182-day and 364-day papers increased by 4.0 bps, 3.4 bps and 7.9 bps to 6.9%, 7.3%, and 8.0%, respectively. In the Primary Bond Market, the government re-opened three bonds namely; FXD1/2013/15, FXD1/2019/15 and FXD1/2021/25 for the month of October, which recorded an undersubscription rate of 92.5%, attributable to tightened liquidity in the money market during the bond sale period. The government sought to raise Kshs 60.0 bn for budgetary support, received bids worth Kshs 55.5 bn and accepted bids worth Kshs 52.0 bn, translating to a 93.8% acceptance rate.
The headline Purchasing Manager’s Index (PMI) for the month of September 2021 decreased to 50.4 from 51.1 recorded in August 2021, indicating that the growth in Kenya’s business activities slowed down following the high inflation rates in September and the hike in fuel prices which affected the demand for goods. Additionally, during the week, the Kenya Revenue Authority (KRA) released the Q1’2021/2022 Revenue Performance highlighting that the Total Revenue collected was Kshs 476.6 bn, against the target of Kshs 461.7 bn, representing an out-performance rate of 103.2%;
Equities
During the week, the equities market was on a downward trajectory, with NASI, NSE 20, and NSE 25 declining by 1.1%, 2.2% and 2.1%, respectively, taking their YTD performance to gains of 15.6%, 6.7% and 12.3% for NASI, NSE 20 and NSE 25, respectively. The equities market performance was driven by losses recorded by large cap stocks such as Diamond Trust Bank (DTB-K), EABL, Safaricom, NCBA and ABSA, which declined by 4.7%, 4.2%, 3.6%, 2.9% and 2.4%, respectively;
Real Estate
During the week, the Central Bank of Kenya released the Monetary Policy Committee Hotels Survey-September 2021, highlighting that the number of operational hotels came in at 96.0%, representing a stagnation since July, following an increase from 94.0% in May 2021. In the infrastructure sector, the County government of Turkana and the Eastern Equatorial State of South Sudan signed a Memorandum of Understanding (MoU) that will allow the continuation of the construction of the Nadapal River Section A1 road, which is part of the Lokichar-Nadapal/Nakodok road upgrade that links Kenya to South Sudan. Additionally, the Cabinet Secretary for Ministry of Transport, Infrastructure, Housing and Urban Development, Hon. James Macharia, announced that the construction of the 233.0 Km Rironi-Nakuru-Mau Summit Road toll highway from Nairobi to Mau Summit will begin by December 2021;
Focus of the Week
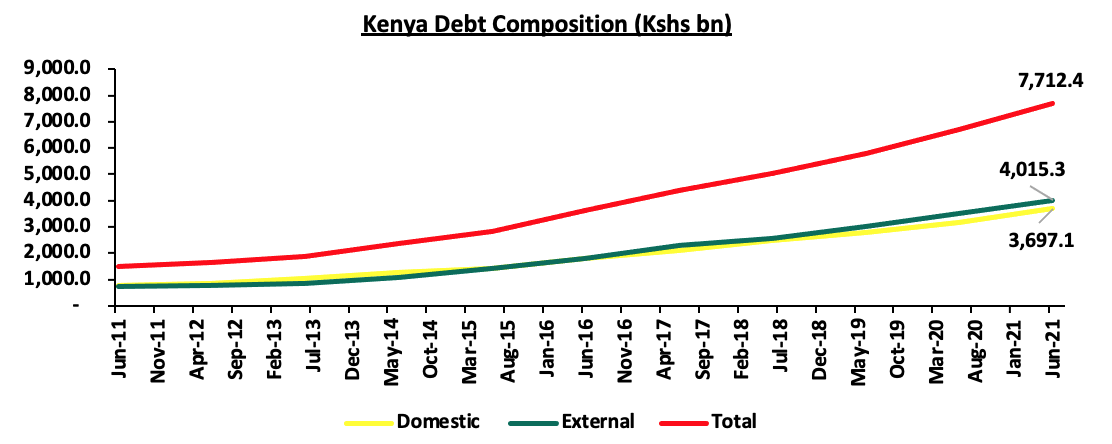
Kenya’s Public Debt has been on the rise, increasing by a 10-year CAGR of 18.5% to Kshs 7.7 tn as at June 2021, from Kshs 1.5 tn in June 2011. The rising debt has been brought about by the government’s significant borrowing in a bid to bridge the fiscal deficit that has averaged 7.4% of GDP over the 10 year period. The debt mix, as at June 2021 stood at 52:48 external to domestic debt, respectively, compared to 49:51 external to domestic debt in June 2011. The change in the mix is largely due to advances from Multilateral lenders such as the International Monetary Fund (IMF) of USD 2.3 bn ( Kshs 256.0 bn) and from the World Bank of USD 750.0 mn (Kshs 82.0 bn), in support of the country’s COVID-19 recovery efforts;
Investment Updates:
- Weekly Rates:
- Cytonn Money Market Fund closed the week at a yield of 10.59%. To invest, just dial *809#;
- Cytonn High Yield Fund closed the week at a yield of 14.05% p.a. To invest, email us at sales@cytonn.com and to withdraw the interest you just dial *809#;
- We continue to offer Wealth Management Training Monday through Saturday, from 9:00 am to 11:00 am, through our Cytonn Foundation. The training aims to grow financial literacy among the general public. To register for any of our Wealth Management Trainings, click here;
- If interested in our Private Wealth Management Training for your employees or investment group, please get in touch with us through wmt@cytonn.com;
- The court ordered the placement of the CHYS and CPN into administration to allow for proper reorganization of the two funds that have been facing some liquidity challenges. For more information, click here;
- As of 1st of September 2021, Cytonn CHYS and CPN Investors have converted Kshs 2.5 billion of their investment funds from the two illiquid funds into real estate, translating to a 20.0% resolution of the debt owed by the two funds. For more information, please see the Cytonn CHYS and CPN Conversion 2.5 bn Real Estate article;
- Any CHYS and CPN investors still looking to convert is welcome to consider one of the five projects currently available for conversion, click here for the latest conversion term sheet;
- Cytonn Insurance Agency acts as an intermediary for those looking to secure their assets and loved ones’ future through insurance namely; Motor, Medical, Life, Property, WIBA, Credit and Fire and Burglary insurance covers. For assistance, get in touch with us through insuranceagency@cytonn.com;
- Cytonnaire Savings and Credit Co-operative Society Limited (SACCO) provides a savings and investments avenue to help you in your financial planning journey. To enjoy competitive investment returns, kindly get in touch with us through clientservices@cytonn.com;
Real Estate Updates:
- For an exclusive tour of Cytonn’s real estate developments, visit: Sharp Investor's Tour, and for more information, email us at sales@cytonn.com;
- Phase 3 of The Alma is now ready for occupation. To rent please email properties@cytonn.com;
- We have 8 investment-ready projects, offering attractive development and buyer targeted returns; See further details here: Summary of Investment-ready Projects;
- For recent news about the group, see our news section here;
Hospitality Updates:
- We currently have promotions for Staycations. Visit cysuites.com/offers for details or email us at sales@cysuites.com;
- Share a meal with a friend during the Sunday Brunch at The Hive Restaurant at Cysuites Hotel and Apartment. Every Sunday from 11.00 AM to 4.00 PM at a price of Kshs 2,500 for Adults and Kshs 1,500 for children under 12 years;
Money Markets, T-Bills Primary Auction:
During the week, T-bills remained undersubscribed, with the overall subscription rate coming in at 40.9%, a decline from 42.2% recorded the previous week. The continued undersubscription is attributable to investors shifting to the bond market in search for higher yields. The 91-day paper recorded the highest subscription rate, receiving bids worth Kshs 3.4 bn against the offered Kshs 4.0 bn, translating to a subscription rate of 85.6%, an increase from 66.0% recorded the previous week. The subscription rate for the 182-day paper decreased to 39.6%, from 53.4% recorded the previous week, while the subscription rate for the 364-day paper increased to 24.4%, from 21.6% recorded the previous week. The yields on the 91-day, 182-day and 364-day papers increased by 4.0 bps, 3.4 bps and 7.9 bps to 6.9%, 7.3%, and 8.0%, respectively. The government accepted Kshs 9.78 bn out of the 9.82 bn bids received, translating to an acceptance rate of 99.5%.
In the Primary Bond Market, the government re-opened three bonds namely; FXD1/2013/15, FXD1/2019/15 and FXD1/2021/25 for the month of October, which recorded a subscription rate of 92.5%. The government sought to raise Kshs 60.0 bn for budgetary support, received bids worth Kshs 55.5 bn and accepted bids worth Kshs 52.0 bn, translating to a 93.8% acceptance rate. The undersubscription is attributable to tightened liquidity in the market, with the average interbank rates increasing to 6.3%, from 3.3% recorded the first week of September. Investors preferred the longer-tenure issue i.e. FXD1/2021/25, which received bids worth Kshs 28.7 bn, representing 51.7% of the total bids received. The coupons for the three bonds were; 11.3%, 12.3% and 13.9%, and the weighted average yield for the issues were; 11.9%, 12.8% and 13.8%, for FXD1/2013/15, FXD1/2019/15 and FXD1/2021/25, respectively.
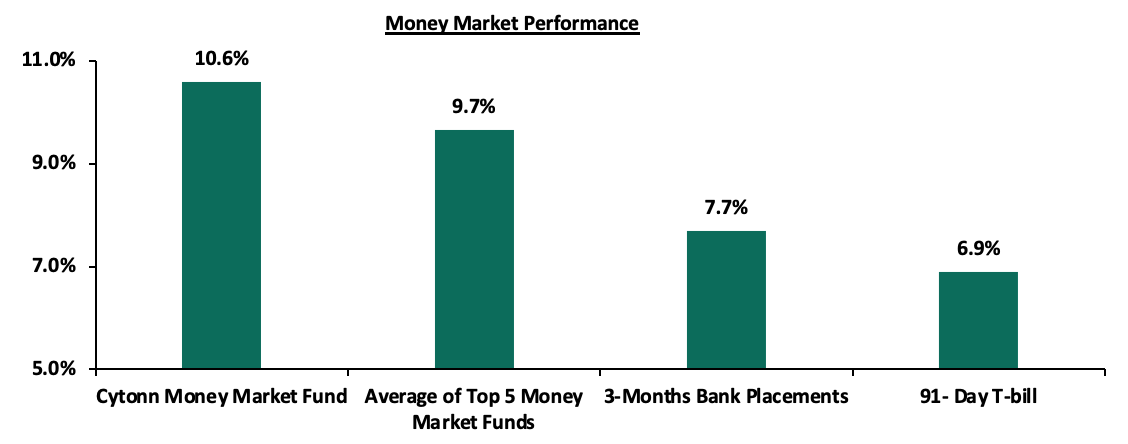
In the money markets, 3-month bank placements ended the week at 7.7% (based on what we have been offered by various banks), while the yield on the 91-day T-bill increased by 4.0 bps to 6.9%. The average yield of the Top 5 Money Market Funds declined by 0.2% points to 9.7%, from 9.9%, recorded the previous week. The yield on the Cytonn Money Market Fund declined marginally by 0.04% points to 10.59%, from 10.63% as was recorded the previous week.
The table below shows the Money Market Fund Yields for Kenyan Fund Managers as published on 8th October:
|
Money Market Fund Yield for Fund Managers as published on 8th October 2021 |
|||
|
Rank |
Fund Manager |
Daily Yield |
Effective Annual Rate |
|
1 |
Cytonn Money Market Fund |
10.07% |
10.59% |
|
2 |
Zimele Money Market Fund |
9.56% |
9.91% |
|
3 |
Sanlam Money Market Fund |
9.01% |
9.42% |
|
4 |
Nabo Africa Money Market Fund |
8.83% |
9.23% |
|
5 |
Madison Money Market Fund |
8.72% |
9.12% |
|
6 |
CIC Money Market Fund |
8.68% |
8.98% |
|
7 |
Apollo Money Market Fund |
9.10% |
8.95% |
|
8 |
Dry Associates Money Market Fund |
8.35% |
8.68% |
|
9 |
Co-op Money Market Fund |
8.30% |
8.65% |
|
10 |
GenCapHela Imara Money Market Fund |
8.28% |
8.64% |
|
11 |
British-American Money Market Fund |
8.10% |
8.41% |
|
12 |
ICEA Lion Money Market Fund |
8.03% |
8.36% |
|
13 |
NCBA Money Market Fund |
8.02% |
8.33% |
|
14 |
Orient Kasha Money Market Fund |
7.88% |
8.20% |
|
15 |
Old Mutual Money Market Fund |
6.96% |
7.18% |
|
16 |
AA Kenya Shillings Fund |
6.48% |
6.68% |
Source: Business Daily
Liquidity:
During the week, liquidity in the money market eased, with the average interbank rate declining to 6.3%, from 6.7% recorded the previous week, partly attributable to government payments, including Term Auction Deposits (TADs) maturities of Kshs 17.6 bn which offset tax remittances and settlements of government securities. Additionally, there was a 4.3% decrease in the average volumes traded in the interbank market to Kshs 11.0 bn, from Kshs 11.5 bn recorded the previous week.
Kenya Eurobonds:
During the week, the yields on all Eurobonds increased, with the yields on the 30-year bond issued in 2018 and the 12-year bond issued in 2019 increasing by 0.3% points to 7.8% and 6.8% respectively, while the yields on the 10-year bond issued in 2014, 10-year bond issued in 2018, 7-year bond issued in 2019 and 12-year bond issued in 2021 increased by 0.2% points to 3.5%, 5.7%, 5.4%, and, 6.7%, respectively. Below is a summary of the performance:
|
Kenya Eurobond Performance |
||||||
|
|
2014 |
2018 |
2019 |
2021 |
||
|
Date |
10-year issue |
10-year issue |
30-year issue |
7-year issue |
12-year issue |
12-year issue |
|
31-Dec-20 |
3.9% |
5.2% |
7.0% |
4.9% |
5.9% |
- |
|
30-Sep-21 |
3.2% |
5.4% |
7.5% |
5.0% |
6.5% |
6.5% |
|
1-Oct-21 |
3.2% |
5.4% |
7.5% |
5.1% |
6.6% |
6.5% |
|
4-Oct-21 |
3.3% |
5.5% |
7.6% |
5.2% |
6.6% |
6.5% |
|
5-Oct-21 |
3.4% |
5.7% |
7.7% |
5.3% |
6.7% |
6.7% |
|
6-Oct-21 |
3.5% |
5.7% |
7.8% |
5.4% |
6.8% |
6.7% |
|
7-Oct-21 |
3.5% |
5.7% |
7.8% |
5.4% |
6.8% |
6.7% |
|
Weekly Change |
0.2% |
0.2% |
0.3% |
0.2% |
0.3% |
0.2% |
|
MTD Change |
0.2% |
0.3% |
0.3% |
0.3% |
0.3% |
0.2% |
|
YTD Change |
(0.9%) |
(0.2%) |
0.2% |
(0.1%) |
0.3% |
- |
Kenya Shilling:
During the week, the Kenyan shilling depreciated by 0.2% against the US dollar to close the week at Kshs 110.7, from Kshs 110.5 recorded the previous week, mainly attributable to increased dollar demand from commodity and energy sector importers outweighing the supply of dollars from exporters. On a YTD basis, the shilling has depreciated by 1.4% against the dollar, in comparison to the 7.7% depreciation recorded in 2020. We expect the shilling to remain under pressure for the remainder of 2021 as a result of:
- Rising uncertainties in the global market due to the Coronavirus pandemic, which has seen investors continue to prefer holding their investments in dollars and other hard currencies and commodities,
- Increased demand from merchandise traders as they beef up their hard currency positions in anticipation of more trading partners reopening their economies globally, and,
- Rising global crude oil prices on the back of supply constraints at a time when demand is picking up with the easing of COVID-19 restrictions and as economies reopen.
The shilling is however expected to be supported by:
- The Forex reserves, currently at USD 9.4 bn (equivalent to 5.7-months of import cover), which is above the statutory requirement of maintaining at least 4.0-months of import cover, and the EAC region’s convergence criteria of 4.5-months of import cover. In addition, the reserves were boosted by the USD 1.0 bn proceeds from the Eurobond issued in July, 2021 coupled with the USD 407.0 mn IMF disbursement and the USD 130.0 mn World Bank loan financing received in June, 2021, and,
- Improving diaspora remittances evidenced by a 14.2% y/y increase to USD 312.9 mn in August 2021, from USD 274.1 mn recorded over the same period in 2020, which has continued to cushion the shilling against further depreciation.
Weekly Highlight:
- Stanbic Bank’s Monthly Purchasing Manager’s Index (PMI)
The headline Purchasing Manager’s Index (PMI) for the month of September 2021 decreased to 50.4 from 51.1 recorded in August 2021, indicating that the growth in Kenya’s business activities slowed down following the high inflation rates in September and the hike in fuel prices which affected the demand for goods. This is the lowest PMI recorded since April 2021. There was a marginal increase in output levels and an increase in new orders in sectors such as agriculture driven by the continued economic recovery, with the manufacturing sector being the only monitored sector that did not record an increase. Additionally, the rate of employment increased, following the increased work backlogs that necessitated increase of staff levels in various companies. The chart below summarizes the evolution of the PMI over the last 24 months:
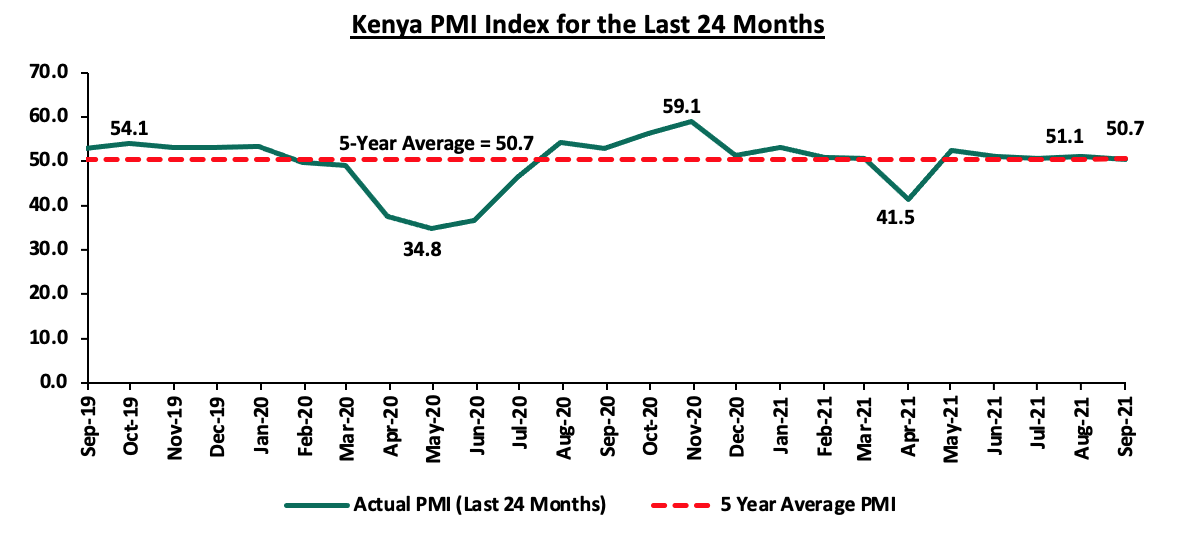
*** Key to note, a reading above 50.0 signals an improvement in business conditions, while readings below 50.0 indicate a deterioration
In line with the decrease in the PMI index reading for the month of September 2021, we maintain a cautious outlook in the short-term owing to the increasing cost pressures, high cost of living, slowing sales growth and concerns of an uptick in COVID-19 infections. The existence and emergence of new COVID-19 variants, especially the Delta variant, which is more easily transmissible, poses economic uncertainty since it might lead to another wave of infections and more restrictions that will adversely affect the business environment.
- Revenue Performance Q1’2021/2022
During the week, the Kenya Revenue Authority (KRA) released the Q1’2021/2022 Revenue Performance highlighting that the Total Revenue collected was Kshs 476.6 bn, against the target of Kshs 461.7 bn, representing an out-performance rate of 103.2%. For the month of September 2021, KRA collected Kshs 184.9 bn, against the target of Kshs 175.0 bn, recording an outperformance rate of 105.6%. The outperformance is mainly attributable to;
- Enhanced compliance enforcement efforts and the implementation of new tax measures, focused on ensuring that that non-compliant taxpayers pay their due taxes,
- Improved business performance following the relaxation of COVID-19 containment measures, and,
- Improving Macro-Economic environment with Gross Domestic Product expected to grow by 6.3% in FY’2021/2022 compared to a contraction of 0.3% in 2020.
The positive revenue performance for the first quarter of the current fiscal year does not come as a surprise given that KRA registered a revenue outperformance in the first five months of 2021, with the monthly average revenue collection coming in at Kshs 128.0 bn. We expect a continued revenue outperformance in the medium term, partly attributable to the expanded tax base coupled with the expected economic recovery. However, we note that historically, KRA has always fallen short of its revenue collection target save for FY’2020/2021 whereby it recorded a 101.0% outperformance as highlighted in our Cytonn Weekly #27/2021. Given the ongoing pandemic and the emergence of new COVID-19 variants, we believe that should the spread of the virus continue and further lockdown measures are put in place, the government might struggle to raise revenue.
Rates in the fixed income market have remained relatively stable due to the sufficient levels of liquidity in the money markets and the government discipline in rejecting expensive bids. The government is 59.0% ahead of its prorated borrowing target of Kshs 190.0 bn having borrowed Kshs 301.9 bn of the Kshs 658.5 bn borrowing target for the FY’2021/2022. We expect a gradual economic recovery going into FY’2021/2022 as evidenced by KRAs collection of Kshs 476.6 bn in revenues during the first quarter of the current fiscal year, which is equivalent to 103.2% of the prorated revenue collection target. However, despite the projected high budget deficit of 7.5% and the lower credit rating from S&P Global to 'B' from 'B+', we believe that the monetary support from the IMF and World Bank will mean that the interest rate environment may stabilize since the government will not be desperate for cash.
Markets Performance
During the week, the equities market was on a downward trajectory, with NASI, NSE 20, and NSE 25 declining by 1.1%, 2.2% and 2.1%, respectively, taking their YTD performance to gains of 15.6%, 6.7% and 12.3% for NASI, NSE 20 and NSE 25, respectively. The equities market performance was driven by losses recorded by large cap stocks such as Diamond Trust Bank (DTB-K), EABL, Safaricom, NCBA and ABSA, which declined by 4.7%, 4.2%, 3.6%, 2.9% and 2.4%, respectively.
During the week, equities turnover increased by 77.1% to USD 26.0 mn, from USD 14.7 mn recorded the previous week, taking the YTD turnover to USD 954.7 mn. Foreign investors remained net sellers, with a net selling position of USD 7.2 mn, from a net selling position of USD 3.8 mn recorded the previous week, taking the YTD net selling position to USD 25.9 mn.
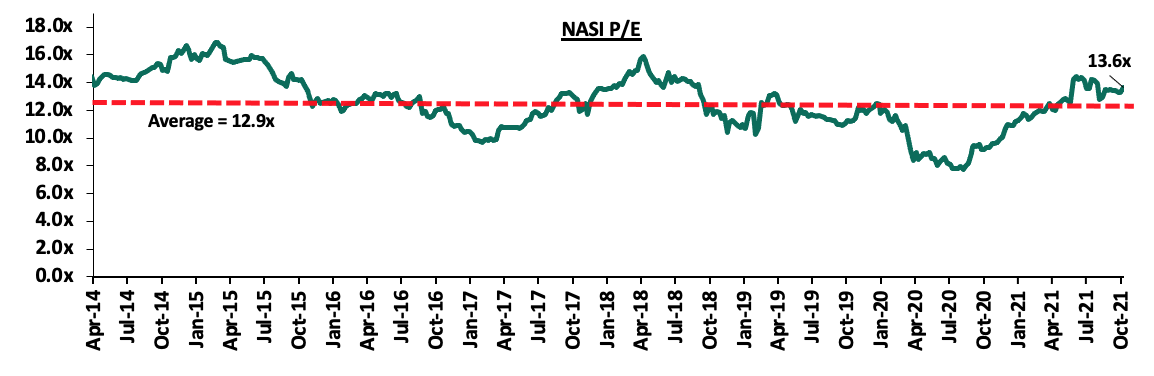
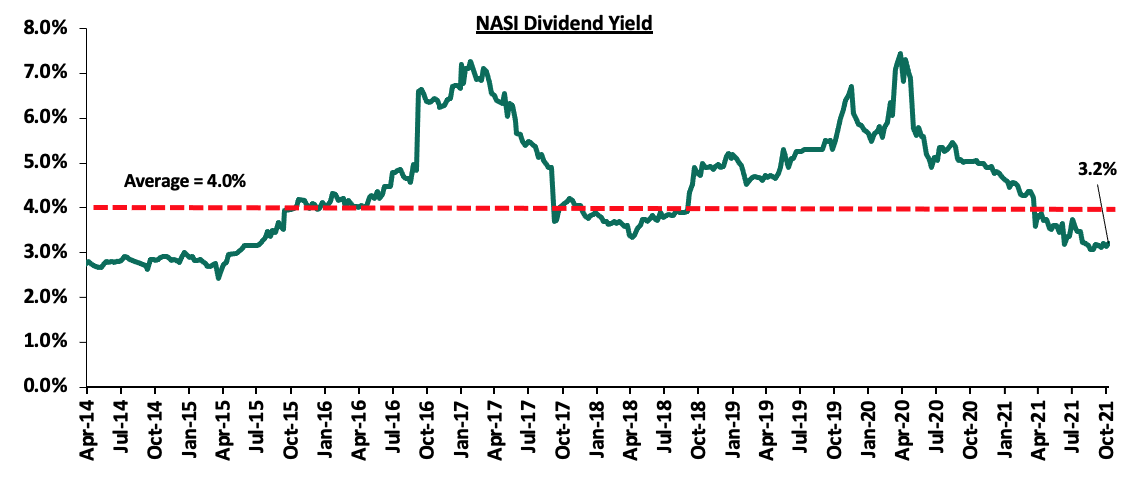
The market is currently trading at a price to earnings ratio (P/E) of 13.6x, 5.1% above the historical average of 12.9x, and a dividend yield of 3.2%, 0.8% points below the historical average of 4.0%. Key to note, NASI’s PEG ratio currently stands at 1.5x, an indication that the market is trading at a premium to its future earnings growth. Basically, a PEG ratio greater than 1.0x indicates the market may be overvalued while a PEG ratio less than 1.0x indicates that the market is undervalued. Excluding Safaricom, which is currently 61.7% of the market, the market is trading at a P/E ratio of 11.3x and a PEG ratio of 1.3x. The current P/E valuation of 13.6x is 76.5% above the most recent trough valuation of 7.7x experienced in the first week of August 2020. The charts below indicate the historical P/E and dividend yields of the market.
Universe of Coverage:
|
Company |
Price as at 01/10/2021 |
Price as at 08/10/2021 |
w/w change |
YTD Change |
Year Open 2021 |
Target Price* |
Dividend Yield |
Upside/ Downside** |
P/TBv Multiple |
Recommendation |
|
I&M Group*** |
22.8 |
21.8 |
(4.2%) |
(51.4%) |
44.9 |
32.0 |
10.3% |
57.1% |
0.6x |
Buy |
|
ABSA Bank*** |
10.5 |
10.3 |
(2.4%) |
7.7% |
9.5 |
13.8 |
0.0% |
34.6% |
1.2x |
Buy |
|
Kenya Reinsurance |
2.5 |
2.5 |
0.0% |
8.2% |
2.3 |
3.1 |
8.0% |
32.0% |
0.3x |
Buy |
|
NCBA*** |
26.0 |
25.3 |
(2.9%) |
(5.1%) |
26.6 |
31.0 |
5.9% |
28.7% |
0.6x |
Buy |
|
Standard Chartered*** |
130.8 |
129.3 |
(1.1%) |
(10.6%) |
144.5 |
145.4 |
8.1% |
20.6% |
1.0x |
Buy |
|
KCB Group*** |
46.8 |
46.1 |
(1.4%) |
20.1% |
38.4 |
53.4 |
2.2% |
18.0% |
1.0x |
Accumulate |
|
Equity Group*** |
50.5 |
49.4 |
(2.3%) |
36.1% |
36.3 |
57.5 |
0.0% |
16.5% |
1.3x |
Accumulate |
|
Co-op Bank*** |
13.4 |
13.2 |
(1.9%) |
4.8% |
12.6 |
14.1 |
7.6% |
14.8% |
0.9x |
Accumulate |
|
Stanbic Holdings |
92.0 |
86.3 |
(6.3%) |
1.5% |
85.0 |
96.6 |
2.0% |
14.0% |
0.8x |
Accumulate |
|
Diamond Trust Bank*** |
63.5 |
60.5 |
(4.7%) |
(21.2%) |
76.8 |
67.3 |
0.0% |
11.2% |
0.3x |
Accumulate |
|
Liberty Holdings |
8.1 |
7.8 |
(3.9%) |
1.3% |
7.7 |
8.4 |
0.0% |
7.7% |
0.6x |
Hold |
|
Sanlam |
11.5 |
11.9 |
3.5% |
(8.5%) |
13.0 |
12.4 |
0.0% |
4.2% |
1.1x |
Lighten |
|
Jubilee Holdings |
350.0 |
350.0 |
0.0% |
26.9% |
275.8 |
330.9 |
2.6% |
(2.9%) |
0.7x |
Sell |
|
HF Group |
4.0 |
3.7 |
(6.8%) |
17.5% |
3.1 |
3.1 |
0.0% |
(16.0%) |
0.2x |
Sell |
|
Britam |
8.1 |
8.1 |
0.0% |
15.4% |
7.0 |
6.7 |
0.0% |
(17.1%) |
1.5x |
Sell |
|
CIC Group |
3.0 |
2.8 |
(5.1%) |
33.2% |
2.1 |
1.8 |
0.0% |
(35.9%) |
1.0x |
Sell |
|
Target Price as per Cytonn Analyst estimates **Upside/ (Downside) is adjusted for Dividend Yield ***For Disclosure, these are stocks in which Cytonn and/or its affiliates are invested in Key to note, I&M Holdings YTD share price change is mainly attributable to the counter trading ex-bonus issue |
||||||||||
We are “Neutral” on the Equities markets in the short term. With the market currently trading at a premium to its future growth (PEG Ratio at 1.5x), we believe that investors should reposition towards companies with a strong earnings growth and are trading at discounts to their intrinsic value. Additionally, we expect the recent discovery of new strains of COVID-19 coupled with the introduction of strict lockdown measures in major economies to continue dampening the economic outlook.
- Industry Reports
During the week, the Central Bank of Kenya released the Monetary Policy Committee Hotels Survey-September 2021, a survey that was intended to assess the extent of the recovery of the hospitality industry as a result of COVID-19 pandemic. Some of the key take outs from the report include:
- The number of operational hotels came in at 96.0%, representing a stagnation since July, following an increase from 94.0% in May 2021. This is attributed to the reopening of the economy after a partial lock down during the first quarter of the year. The graph below shows the overall percentage of the number of operating hotels in Kenya between June 2020 – September 2021;
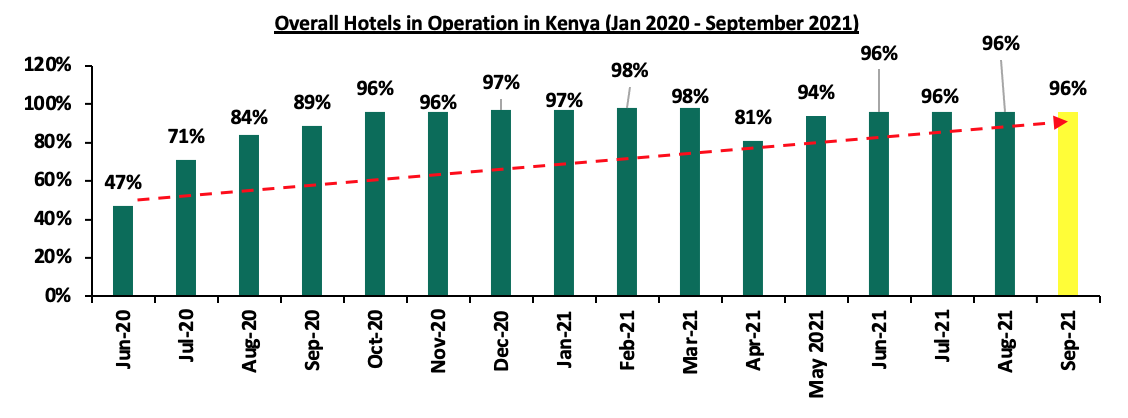
Source: Central Bank of Kenya
- Local guests continued to account for majority of clientele population at 79.5% for accommodation and 78.9% for restaurant services between August and September 2021 which was an increase from 62.0% and 68.7%, respectively, recorded in the pre-COVID period. The recovery is mainly attributed to the slow but rising number of international tourism arrivals as people still limit their traveling options to cushion themselves against the virus. International visitors accounted for 20.5% and 21.1% of the accommodation and restaurant services, respectively, in September, which is a 0.7% and 2.2% increase from the 19.8% and 18.9% realized between June and July 2021, respectively. This can be attributed to the lower travel restrictions and the continued vaccination activities boosting travel confidence. The graph below highlights the client rates served by hotels in Kenya between June 2021 and September 2021;
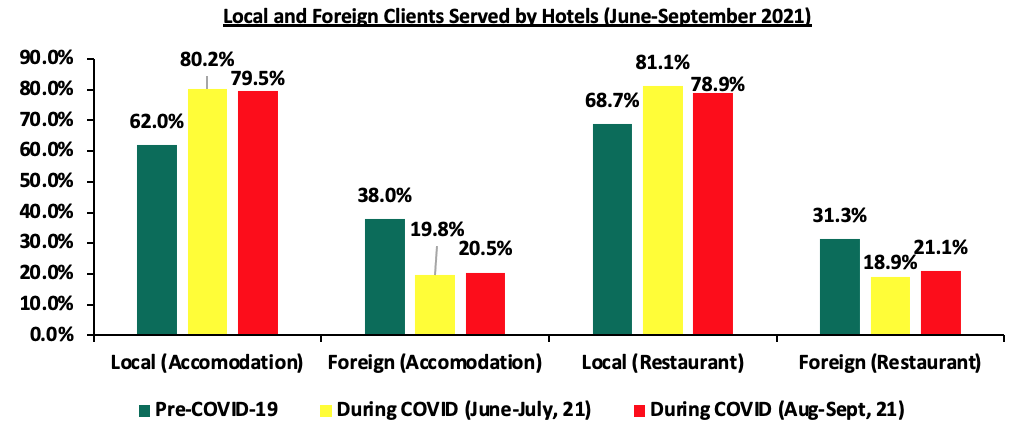
Source: Central Bank of Kenya
- The average bed occupancy in September 2021 survey was at 38.0%, a 8.0% points increase from 30.0% in July mainly attributed to the lifting of travel restrictions and continued vaccination activities boosting both local and international visits. However, this is a slight decline by 0.1% from 39.0% realized in August due to a declined demand resulting from travel advisory alert issued by USA which is a major tourist market for Kenya. The graph below highlights the hotel bed occupancy rates in Kenya between June 2020 and September 2021, and,
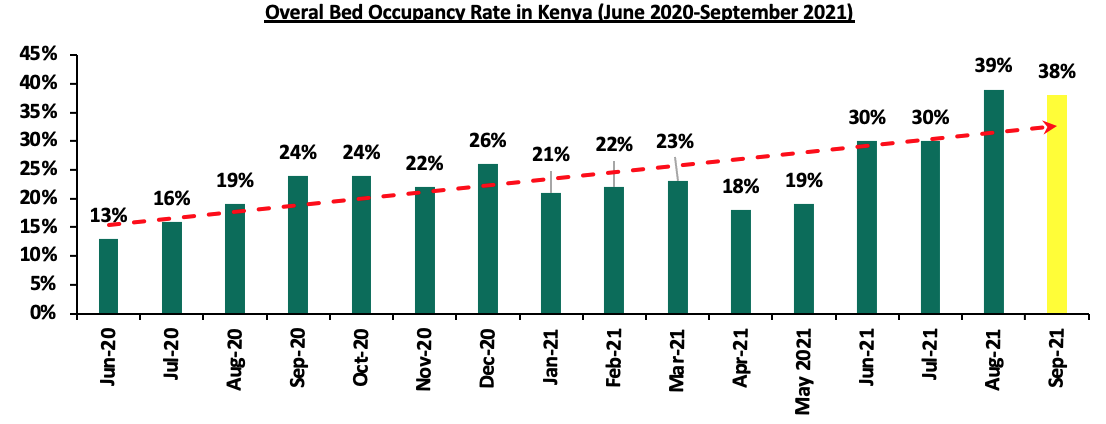
Source: Central Bank of Kenya
We expect the hospitality sector which was among the worst hit sectors in the economy to register improved performance attributed to; i) the reopening of the economy, ii) continued vaccination activities boosting travel confidence into the country, iii) Kenya having been removed from the red list by United Kingdom, and iv) the World Rally Championship expected to be hosted in Kenya annually until 2026 thereby boosting visitor arrivals and performance of the hotel industry.
- Infrastructure
During the week, the County government of Turkana and the Eastern Equatorial State of South Sudan signed a Memorandum of Understanding (MoU) that will allow the continuation of the construction of the Nadapal River Section A1 road, which is part of the Lokichar-Nadapal/Nakodok road upgrade that links Kenya to South Sudan. The 248.0 Km road project worth Kshs 24.5 bn began in March 2017 through the Kenya National Highways Authority (KeNHA), and was expected to be completed by 2020, however, construction works have been stalling due to the ongoing quarrels among the communities settled along the border. Upon its completion in February 2022, we expect the road to boost trade activities along the neighbouring areas, ease transport of goods, as well as boost real estate investment opportunities and prices along the surrounding regions.
The Cabinet Secretary for Ministry of Transport, Infrastructure, Housing and Urban Development, Hon. James Macharia, announced that the construction of the 233.0 Km Rironi-Nakuru-Mau Summit Road toll highway from Nairobi to Mau Summit will begin by December 2021. The Kshs 160.0 bn road project is a Public Private Partnership (PPP) initiated project between the national government through KeNHA and a consortium made up of Vinci Highways SAS, Meridian Infrastructure Africa Fund, and Vinci Concessions SAS, and is expected to be completed by December 2022. Upon its completion, it will be the second PPP project in Kenya to be tolled under the PPP strategy after the Nairobi Expressway project. upon completion, the highway will; i) ease transport of goods and people in the neighbouring areas, ii) boost property prices and investment opportunities, iii) initiate increased trade activities along the surrounding areas, and iv) boost tourism activities in destinations such as the Nakuru National Park.
The government continues to initiate and implement infrastructure projects through various ways such as the PPP strategy that has proven to be efficient and a cost effective method of delivering projects, with some of the projects underway being the; i) Standard Gauge Railway, ii) Nairobi Western Bypass, and iii) Nairobi Commuter Rail Project among others. We therefore expect the sector to continue registering more developments as a result of the government’s aggressiveness in implementing projects on the same. Moreover, there is continued focus on developing quality and adequate roads to make Kenya an intra-regional hub for trade in East Africa which saw an improvement in the budget allocation by 0.6% to Kshs 182.5 bn for the FY’2021/2022, from Kshs 181.4 bn allocation for FY’2020/2021.
The graph below shows the budget allocation to the infrastructure sector over the last nine financial years:
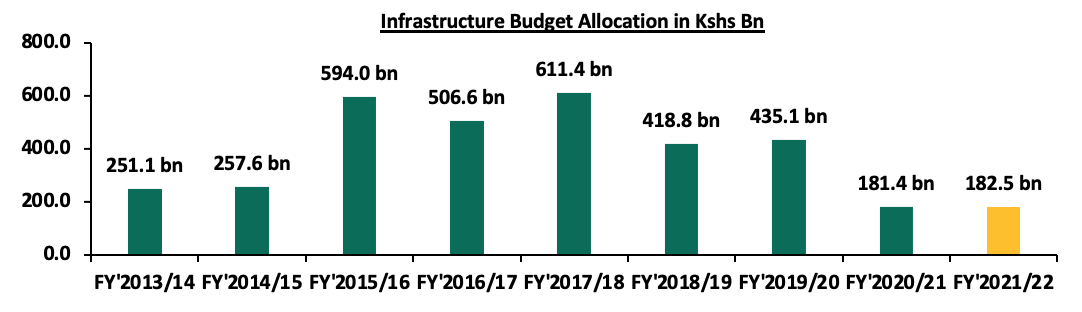
Source: National Treasury
Kenya’s real estate sector is expected to be on an upwards trajectory attributed to the expected improvement in performance of the hospitality sector which is as a result of the slow but rising number of tourist arrivals, coupled with the numerous ongoing infrastructure projects opening up areas for accessibility and investment opportunities.
Kenya’s Public Debt has been on the rise, increasing at a 10-year CAGR of 18.5% to Kshs 7.7 tn in June 2021, from Kshs 1.5 tn in June 2011. The rising debt has been brought about by the government’s significant borrowing to fund infrastructural projects and bridge the fiscal deficit that has averaged 7.4% of GDP over the 10 years. The borrowing is both direct by government and also by guaranteeing state corporations. The debt mix, as at June 2021 stood at 52:48 external to domestic debt, respectively, compared to 49:51 external to domestic debt in June 2011. Kenya’s debt stock has increased significantly due to advances from Multilateral lenders such as the International Monetary Fund (IMF) of USD 2.3 bn ( Kshs 256.0 bn) and from the World Bank of USD 750.0 mn (Kshs 82.0 bn), which were used to boost the country’s COVID-19 recovery efforts. The rise in public debt to new highs has been driven by several factors which include but not limited to;
- The fiscal deficit which has averaged 7.4% in the last 10 years and is projected to be at 7.5% of GDP in FY’2021/22 leading to a continuous growth in borrowing and the average borrowing over the 10 years has been Kshs 622.5 bn per annum,
- The lower tax collections than projected in the budget. The overall tax collection rate has averaged 96.7% over the last 10 years leading to the government borrowing more to bridge the gap,
- The guaranteeing of state corporations which have been underperforming leading to the burdening of the government to support them, and,
- Increased debt servicing costs especially the commercial loans and Eurobonds, since they are denominated in US dollars and with the weakening currency the cost rises.
We have been tracking the evolution of the public debt and below are the previous topicals we have done on Kenya’s debt:
- Kenya’s Debt Levels: Are we on a Sustainable Path?– In May 2016, we wrote about the rising debt levels in the country and concluded that they were within the safer bounds in terms of debt levels but needed to look into risks associated with the changing funding patterns that could see the debt levels rise,
- Kenyan Debt Sustainability– In December 2016, we wrote about Kenya’s debt level, questioning its sustainability, and concluded that the government needed to reduce the amount of public debt, giving suggestions as to how this could be achieved,
- Kenya’s Public Debt, Should We be concerned? – In February 2018, we wrote about the concerns surrounding the debt level of the country and concluded that we should be concerned about the country’s debt levels unless decisive policies were implemented,
- Kenya’s Public Debt – In July 2020, we wrote about the high debt levels in the country, which have exceeded the recommended threshold, and the downgrading of Kenya’s creditworthiness on the back of an economic downturn following the global pandemic and we gave suggestions on measures that could be taken towards debt sustainability, and,
- Kenya Public Debt 2020 – In December 2020, we took a look at Kenya’s Public debt as at December 2020, with a keen focus on how the country’s debt increased during the COVID-19 pandemic and the debt management strategies at play,
In this week’s topical, we focus on the current state of affairs regarding the country’s public debt profile and levels and discuss whether it is sustainable. Under this, we shall cover:
- Kenya’s Current Debt Levels and Evolution of Debt ,
- Analysis of debt metrics,
- Kenya’s risk of debt distress, and,
- Conclusion
Section I: Current Debt Levels and Evolution of Debt
The country’s total public debt as at 30th June 2021 stood at Kshs 7.7 tn (equivalent to 67.7% of GDP), which is a 14.9% increase from the Kshs 6.7 tn debt recorded in June 2020 (equivalent to 62.2% of GDP). Parliament approved to increase the debt ceiling to the absolute figure of Kshs 9.0 tn from the initial 50.0% of GDP in October 2019, meaning that the government has headroom to borrow an additional Kshs 1.3 tn before the current debt ceiling is exceeded. Since the first reported case of COVID-19 on 13th March 2020 in Kenya, the total public debt has grown by 22.8% to Kshs 7.7 tn from Kshs 6.3 tn. The debt mix as at June 2021 stood at 52:48 external to domestic debt, respectively, with foreign borrowing at Kshs 4.0 tn while domestic borrowing stands at Kshs 3.7 tn.
Banking institutions account for the highest percentage of domestic debt in terms of government securities holdings at 50.8%, but this has been reducing as the exposure by pensions schemes have been on the rise.
Below is a table of the composition of government domestic debt by holder:
|
Composition of Government Domestic Debt by Holder |
|||||||||||
|
|
Sep-11 |
Sep-12 |
Sep-13 |
Sep-14 |
Sep-15 |
Sep-16 |
Sep-17 |
Sep-18 |
Sep-19 |
Sep-20 |
Sep-21 |
|
Banking Institutions |
48.7% |
50.8% |
49.7% |
51.9% |
56.5% |
54.9% |
55.9% |
55.0% |
53.3% |
55.2% |
50.8% |
|
Insurance Companies |
11.6% |
10.7% |
10.5% |
10.3% |
8.7% |
7.4% |
6.2% |
6.1% |
6.4% |
6.1% |
6.6% |
|
Parastatals |
6.9% |
5.0% |
3.8% |
2.9% |
4.7% |
5.6% |
6.3% |
7.3% |
7.3% |
5.4% |
5.4% |
|
Pension Funds |
29.3% |
22.5% |
25.8% |
25.9% |
25.3% |
26.5% |
27.3% |
27.1% |
28.7% |
28.8% |
31.2% |
|
Other Investors |
3.4% |
11.0% |
10.2% |
9.0% |
4.8% |
5.6% |
4.3% |
4.5% |
4.3% |
4.7% |
6.0% |
|
Total |
100.0% |
100.0% |
100.0% |
100.0% |
100.0% |
100.0% |
100.0% |
100.0% |
100.0% |
100.0% |
100.0% |
Source: Central Bank of Kenya
Below is a table highlighting the trend in the external and domestic debt composition over the last 10 years;
Source: Central Bank of Kenya
Debt composition and Evolution:
The country’s debt composition has evolved, with foreign debt increasing at a 10-year CAGR of 18.7% to Kshs 4.0 tn as at June 2021, compared to Kshs 0.7 tn in June 2011. Domestic debt has increased to Kshs 3.7 tn as at June 2021 compared to 0.7 tn in June 2011, a 10-year CAGR of 17.1%. Foreign debt has therefore increased at a faster rate than domestic debt, indicating that the government is turning more to external lenders. Foreign debt comprises of multilateral loans, bilateral loans and commercial loans. Multilateral loans are debts issued by international institutions such as the World Bank and the IMF to member nations to promote social and economic development while bilateral loans are loan agreements between individual nations. Multilateral and bilateral loans are categorized as concessional loans due to the favorable terms offered in terms of either below-market interest rates, long grace periods or a combination of both. Commercial loans, on the other hand, are loans agreed between a country and an external commercial bank or an external financial debt instrument. Commercial loans typically have higher rates and shorter grace periods.
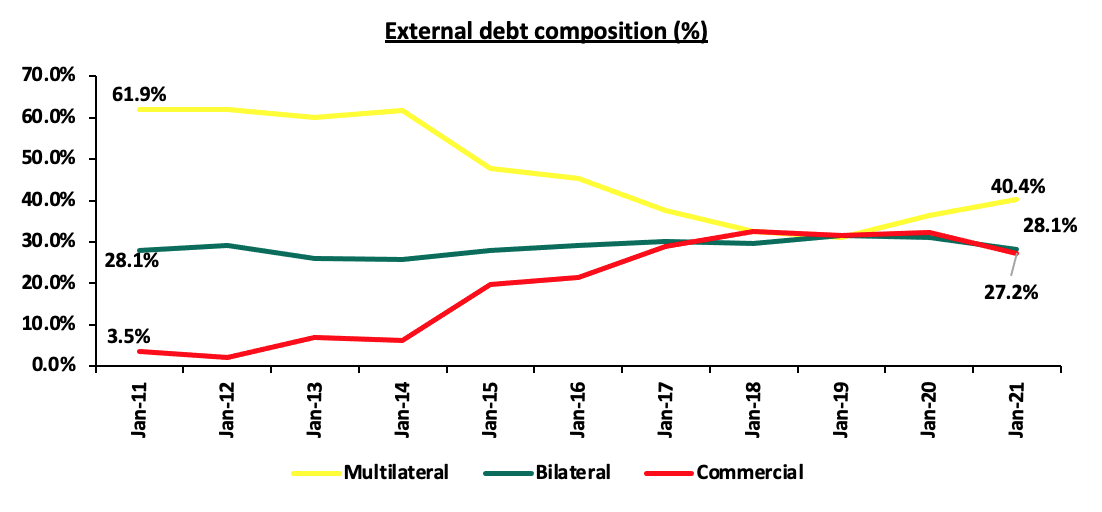
Kenya’s exposure to bilateral and multilateral loans has been declining in favor of a much more commercial funding structure comprising of Eurobonds and syndicated loans (loans provided by a group of lenders who work together to provide funds for a single borrower). This has seen the proportion of concessional loans (Bilateral and Multilateral debt) which stood at 90.0% of total external debt as at May 2011, decline by 21.5% points to approximately 68.5% of total external debt as at May 2021. Commercial loans, deemed more expensive because of their high-interest costs, have grown at a 10-year CAGR of 45.3% from a low of Kshs 23.8 bn (equivalent to 3.5% of total external debt) as at May 2011, to Kshs 1.0 tn (equivalent to 27.2% of total external debt) as at May 2021; on the other hand multilateral loans have grown at a 10-year CAGR of 13.9% in the same period.
It is key to note that:
- Multilateral debt increased to 40.2%, from 33.0% of total external debt in March 2020 due to loans received from the IMF and the World Bank during the period. In the same period, Bilateral debt decreased to 28.2% from 31.0% in March 2020, and,
- Since Kenya’s first Eurobond issue in June 2014, commercial debt has cumulatively increased by 19.4% points to 27.3% of total external debt in May 2021, from 7.9% in May 2014, mainly attributable to the issue of Eurobonds within the period.
The increasing commercial debt stock is attributable to Kenya’s change of status in 2014, from a low income country to a lower middle income country after Revising and rebasing National accounts. This resulted in the country being locked out of concessional borrowing for low income countries, and pushed it to commercial borrowing. The government has also preferred commercial borrowing as it gets complete control of funds as compared to multi/bilateral borrowing which is sometimes released in tranches over a period of time. Commercial debt, though expensive, come with fewer restrictions and conditions especially on the loan usage and allocation.
The chart below highlights the trend in External debt composition over the last 10 years;
Source: Central Bank of Kenya & National Treasury
Section II: Debt Metrics
- Debt to GDP Ratio
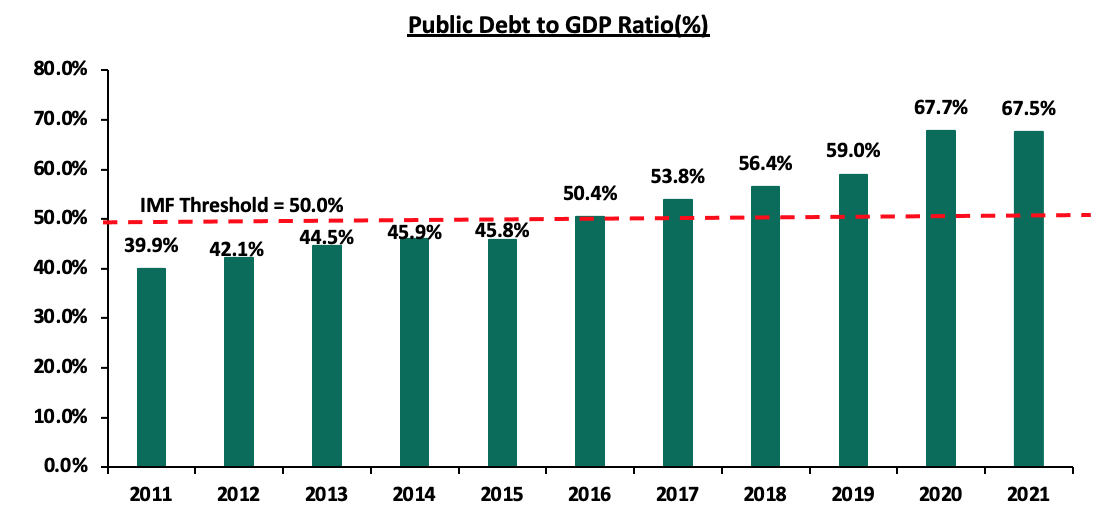
Kenya’s debt to GDP ratio came in at 67.5% in June 2021, 17.5% points above the IMF’s recommended threshold of 50.0% for developing countries. In October 2019, the treasury amended the Public Finance Management (PFM) regulations to substitute the debt ceiling which was previously set at 50.0% of GDP with an absolute figure of Kshs 9.0 tn to plug the budget shortfalls. Government debt is forecasted to reach 70.0% of GDP by end 2021 on the back of rising debt levels outpacing economic growth. Below is a graph highlighting the trend in the country’s debt to GDP ratio;
Source: Central Bank of Kenya, Kenya National Bureau of Statistics
- Debt Service to revenue
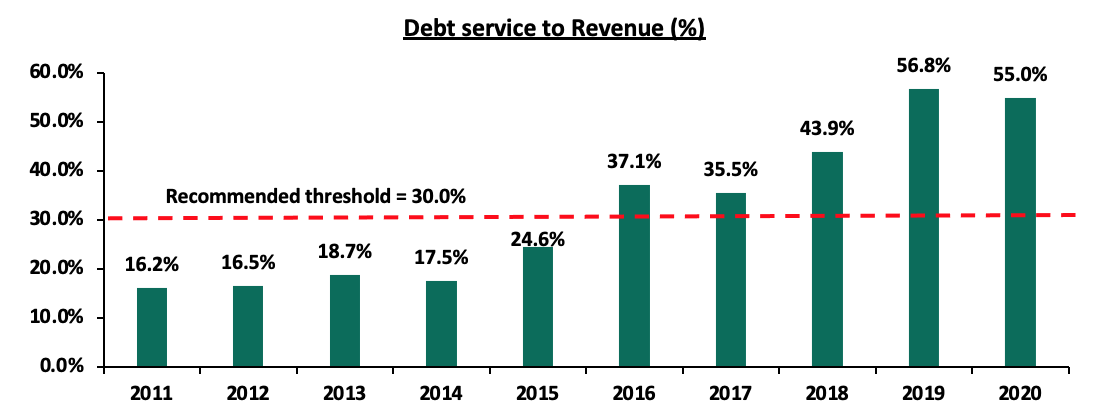
This is a measure of how much of the government’s revenue is used to service debt. According to the Controller of Budget, the debt service to revenue ratio was estimated at 55.0% at the end of 2020, 25.0% points higher than the recommended threshold of 30.0%, but 1.8% points lower than FY’2019’s debt service ratio of 56.8%. This is attributable to reduced debt service obligations during the year. The reduction in service obligations in 2020 compared to 2019 is attributed to the country retiring the Kshs 75.0 bn Eurobond floated in 2014 during the period. This payment was however serviced using funds from the Kshs 210.0 bn dual-tranche 7-year and 12-year Eurobond, both issued in 2019. The sustained level of debt service to revenue ratio above the recommended threshold is concerning given the elevated refinancing risk following shocks arising from the COVID-19 pandemic. For the FY’2021/22 fiscal year, a total of Kshs 1.2 tn has been set aside for debt servicing against a targeted Kshs 1.8 tn revenue collection, bringing the debt service to revenue ratio to 65.8%. In the August 2021 Budget Outturn, the National treasury spent Kshs 162.4 bn on debt servicing, against collected revenue of 247.2 bn, amounting to a 64.7% debt service to revenue. Below is a chart showing the debt service to revenue ratio;
Source: Public Debt Management Office Annual reports, Controller of Budgets FY2020/21 Budget Implementation report
Further to the above, we expect the country’s cost of debt servicing to rise driven by the depreciation of the shilling against the USD, which accounts for 65.2% of Kenya’s external debt. On a YTD basis, the shilling has depreciated by 1.4% to close the week at Kshs/USD 110.7. This means that as the shilling depreciates, the government will have to pay more to service its foreign-denominated external debt. The cost of debt servicing is also expected to increase in 2022 upon expiry of the G-20’s Debt Servicing Suspension Initiative (DSSI) in December 2021. The table below shows the currency composition of foreign debt in May-2021 compared to May-2011;
|
Currency composition of External Debt |
||
|
|
May-11 |
May-21 |
|
USD |
30.1% |
65.2% |
|
Euro |
33.3% |
19.0% |
|
Japanese Yen |
23.4% |
7.7% |
|
Chinese Yuan |
1.8% |
5.4% |
|
GBP |
5.4% |
2.4% |
|
Others |
6.0% |
0.2% |
|
Total |
100.0% |
100.0% |
Source: Public debt management office, National treasury
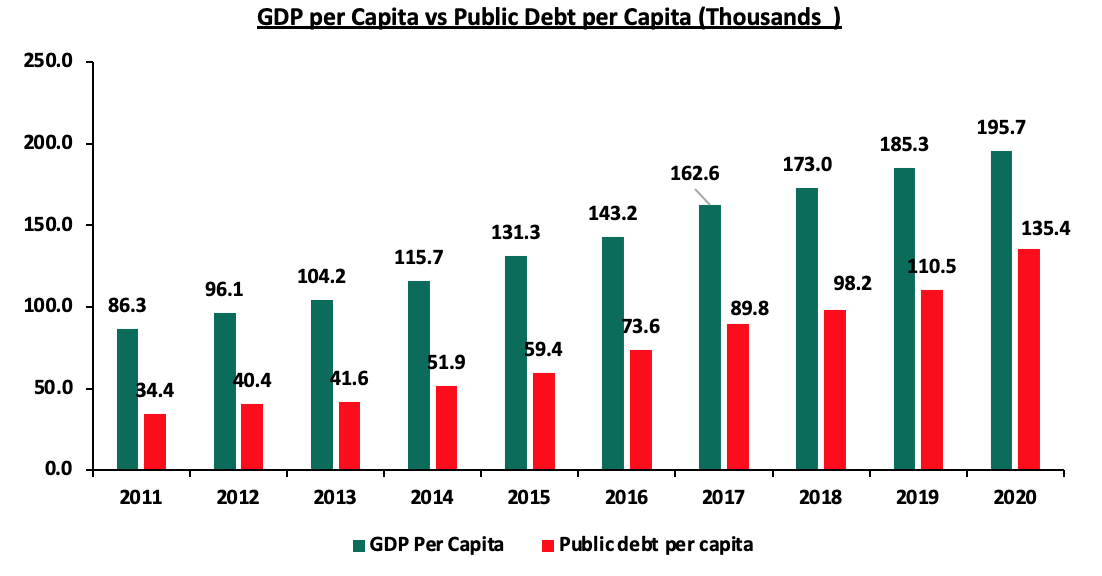
- GDP per Capita vs Debt per Capita
Kenya’s Public Debt per Capita has grown at a 10-year CAGR of 14.7% from 2011 to 2021, compared to GDP per Capita which has grown at a CAGR of 8.5% in the same period. This is an indication that public debt is rising at a faster rate than the GDP, further elevating the risk of debt distress and may also be an indication that the debt being incurred is not translating into economic growth. The Debt per Capita, which can be viewed as an indicator of the average debt burden on an individual citizen, currently stands at Kshs 135,422.2, with the GDP per Capita currently at Kshs 195,678.9, according to World Bank data. Below is a graph highlighting GDP per Capita against Debt per Capita.
Source: World Bank
Section III: Kenya’s risk of Debt Distress
As seen in the above section, the country’s risk of debt distress is extremely high as evidenced by the high debt service to revenue ratio of 55.0%, which is 25.0% points above IMF’s recommended threshold of 30.0%. Additionally, Kenya’s debt to GDP ratio stood at 67.7% in 2020, 17.7% points above IMF’s recommended threshold of 50.0% for developing countries. We note that the growth of Public Debt at a 10-year CAGR of 14.7% has outpaced economic growth at a 10-year CAGR of 8.5% pointing to a high risk of debt distress as revenue alone might not be sufficient to service debt. The fiscal deficits resulting from the revenue-expenditure mismatch have also presented an ever present challenge in fiscal consolidation as revenue continues to lag behind expenditure.
The ongoing COVID-19 pandemic which has constrained economic growth may see the government’s fiscal consolidation efforts delay. The Debt Servicing Suspension Initiative whose aim was to reduce the debt servicing burden in the medium term is likely to lead to a pile up in debt servicing expenses in the long term as Kenya might be required to pay approximately Kshs 25.0 bn annually. Additionally, given that most of Kenya’s foreign debt is denominated in USD, we believe that the shillings depreciation against the dollar will mean that Kenya will continue to incur a relatively higher cost to purchase foreign currency used to settle the outstanding debt obligations. On a YTD basis, the shilling has continued to depreciate against the USD, depreciating by 1.4% to close at Kshs 110.7 in October 2021, from Kshs 109.2 at the start of the year.
In the current year, we have seen a couple of Global rating agencies relook the country’s Sovereign Credit Outlook and affirm the negative outlook on the Country’s debt sustainability. Below is a summary of the key rating agencies and their outlook;
|
Rating Agency |
Rating as at June 2020 |
Outlook as at June 2021 |
Current Rating |
Current Outlook |
|
Moody’s |
B2 |
Negative |
B2 |
Negative |
|
S&P Global |
B+ ‘short term’, B ‘Long term’ |
Negative |
B ‘short term’, B ‘Long term’ |
Negative |
|
Fitch Ratings |
B+ |
Negative |
B+ |
Negative |
The three credit rating agencies have maintained the same ratings and outlook as at the same period last year, with Moody’s citing that their decision to maintain a negative outlook being informed by the Government’s inability to deliver on planned fiscal consolidation which would leave Kenya vulnerable to tightening financing conditions and increase liquidity risk, sentiments shared by the other credit rating agencies. The IMF also conducted a debt sustainability analysis on the country, highlighting that both the risk of external debt distress and overall risk of debt distress are high but Kenya’s debt is sustainable, provided the country sticks to the IMF framework envisaged under the Extended Credit Facility/Extended Fund Facility.
Concerns raised by the Debt rating agencies and the IMF are valid as the high debt levels are detrimental to the country in the medium and long term. Below are some of the risks associated with precariously high debt levels;
- The higher cost of debt servicing due to debt obligations in foreign currencies despite a weakening shilling, which may lead to higher taxation as the government tries to keep up with its debt obligations,
- The increased cost of further borrowing since lenders will price the new debt at higher rates considering the heightened risk which stifles the private sector and economic growth,
- Narrowing of the fiscal space and as a result, limited resources for infrastructure and capital expenditure,
- Crowding out of the private sector by the government which largely leads to lower projected economic growth, subsequently impacting collections further, and,
- Fiscal consolidation and austerity measures which undermine economic activity, development objectives and decrease the government’s ability to effectively respond to emergencies since governments often borrow to address unexpected events.
Recommendations
Given the high debt levels and the fiscal challenges the country continues to face from the COVID-19 pandemic, we believe that the National Treasury should work on reducing the risk of debt distress and extreme unsustainability of the country’s Public Debt. We commend the government on the measures put in place to boost revenue collection, however, we believe that a lot needs to be done to take Kenya towards debt Sustainability. Below are some actionable steps the government can take;
- Revenue Collection – The Kenyan Government should aim to enhance revenue collection as it forms a huge part in reducing the debt burden. This can be done by streamlining the revenue collection process and conducting frequent tax audits to help seal loopholes that lead to loss of revenue,
- Robust fiscal consolidation – The main driver of the growing public debt is the fiscal deficit occasioned by the lower revenues as compared to expenditure. Implementing robust fiscal consolidation would help the government bridge the deficit gap. This can be achieved by reducing expenditure by introducing austerity measures and reducing amounts extended to recurrent expenditure. Fiscal consolidation would also enable the Government to refinance other crucial sectors such as agriculture which would contribute to higher revenue. Capital expenditure should also be limited to projects with either high social impact or have a high Economic Rate of Return (ERR), whose economic benefits outweigh costs,
- Reducing the share of commercial borrowing – The Kenyan government should move towards reducing the share of commercial borrowing as compared to concessional borrowing so as to reduce amounts paid in debt service. Concessional loans also have longer repayment periods and lower interest rates,
- Build an export driven economy – This can be achieved by promoting export oriented policies and manufacturing to increase exports, thus improve the current account while at the same time reduce imports to preserve our foreign exchange reserves. This would stabilize the exchange rate and stop our foreign denominated debt from increasing as the shilling depreciates,
- Fully operationalize and streamline alternative means of funding development projects – The ballooning of public debt has partially been driven by the government’s over-reliance on borrowing to fund its ambitious development agenda. As a substitute to this, the government should fully operationalize and remove bottlenecks to Private Public Partnerships (PPPs) and joint ventures to attract more private sector involvement.
- Promote Capital Markets: Our capital markets remain dormant with banking markets having mobilized Kshs 4.0 tn in deposits compared to Collective Investment Schemes at only Kshs 0.1 tn. Efforts should be made to strengthen the Capital Markets structure to ease the pooling of funds by investors to undertake development projects,
- Aggressive Privatization: The government should aggressively privatize parastatals to release capital, reduce debt and also to prevent the widening of debt from parastatal losses and inefficiencies, and,
- Strengthening Parliament’s oversight role – This would ensure that Parliament plays a sufficient and independent oversight role over the National treasury to ensure that future debt uptake is well interrogated, is feasible and will bring economic benefit to the country. Parliament should also play a bigger vigilance role to ensure that fiscal deficits are sustainable at the budget approval stage to lessen the need for borrowing to bridge them.
Section IV: Conclusion
As a result of the COVID-19 pandemic that led to the global economy contracting by 3.6% in 2020, Governments globally have turned to debt to bridge fiscal deficits resulting from reduced revenues and economic shocks from the pandemic. In the Fiscal monitor 2021 by the IMF, public debt as a percentage of GDP reached 97.0% in 2020 and is expected to reach 99.0% in 2021, underlining the difficult situation that governments not only in Kenya, but around the world are in.
According to the IMF and the World Bank, Kenya’s debt remains sustainable driven by the fact that most of Kenya’s public debt remains concessional and the fact that historically, the country has had a smooth debt service profile. However, the risk of debt distress remains high given the ongoing COVID-19 pandemic. We believe that Kenya is on a path towards debt distress if fundamental concerns like fiscal consolidation are not well addressed. With the local economy expected to gradually bounce back upon gradual resumption of key economic activities, we expect a tough balancing act for the government as an increase in revenue collections is expected to be followed by higher debt servicing requirements upon expiry of the Debt Servicing Suspension Initiative. In our view, we expect that the government will fully explore alternative means of funding the ambitious development agenda such as Private Public Partnerships (PPPs) which do not occasion uptake of more debt.
Disclaimer: The views expressed in this publication are those of the writers where particulars are not warranted. This publication, which is in compliance with Section 2 of the Capital Markets Authority Act Cap 485A, is meant for general information only and is not a warranty, representation, advice or solicitation of any nature. Readers are advised in all circumstances to seek the advice of a registered investment advisor.

- Talk to us
- Kenya
- P.O Box 20695 - 00200, Nairobi, Kenya
- Cell +254709101200
- Tel +254709101200
- WhatsApp +254741676635
- United States
- +254709101200
- DOWNLOAD OUR APP
-


- Kenya
- 8th Floor, Pinetree Plaza, Kaburu Drive, Ngong Road, Nairobi, Kenya
- USA
- Suite 1150, 1775 Eye Street NW, USA, Washington DC 20006, USA
- Investments
- High Yield
- Private Equity
- Real Estate
- Real Estate
- RiverRun Estates
- Cytonn Towers
- The Ridge
- Taraji Heights
- The Alma