Kenya’s Public Debt Review 2023, & Cytonn Weekly #15/2023
By Research, Apr 16, 2023
Executive Summary
Fixed Income
During the week, T-bills were oversubscribed for the second consecutive week, with the overall subscription rate coming in at 122.6%, down from an oversubscription of 134.8% recorded the previous week. Investor’s preference for the shorter 91-day paper persisted as they sought to avoid duration risk, with the paper receiving bids worth Kshs 24.9 bn against the offered Kshs 4.0 bn, translating to an oversubscription rate of 621.9%, lower than the 643.3% recorded the previous week. Notably, the 182-day and 364-day papers recorded continued under subscriptions of 24.7% and 20.7%, from under subscription rates of 5.8% and 60.3%, respectively, recorded the previous week. The government accepted bids worth Kshs 27.4 bn and rejected Kshs 2.0 bn out of the total Kshs 29.4 bn bids received, translating to an acceptance rate of 93.0%. The yields on the government papers were on upward trajectory, with the yields on the 364-day, 182-day and 91-day papers increasing by 7.5 bps, 6.0 bps and 6.8 bps to 10.9%, 10.4% and 10.1%, respectively;
In the Primary Bond Market, the government sought to raise additional Kshs 10.0 bn to fund infrastructural projects by offering a tap sale of an infrastructure bond IFB1/2023/17 with tenor to maturity of 17 years. The bond received bids worth Kshs 5.1 bn, translating to an undersubscription rate of 51.2%, partly attributable to continued tightened liquidity in the money market with the average interbank rate increasing by 0.3% points to 8.4%, from 8.1% recorded last week;
Additionally, during the week, the National Treasury gazetted the revenue and net expenditures for the nine months of FY’2022/2023, ending 31 March 2023;
During the week, the Energy and Petroleum Regulatory Authority (EPRA) released their monthly statement on the maximum retail fuel prices in Kenya effective 15 April 2023 to 14 May 2023. Notably, fuel prices remained unchanged at Kshs 179.3, Kshs 162.0 and Kshs 145.9 per litres of Super Petrol, Diesel and Kerosene, respectively;
Equities
During the week, the equities market was on a downward trajectory with NASI, NSE 20 and NSE 25 declining by 2.4%, 1.9% and 2.1%, respectively, taking the YTD performance to losses of 12.4%, 3.7% and 6.9% for NASI, NSE 20 and NSE 25, respectively. The equities market performance was mainly driven by losses recorded by large cap stocks such as Bamburi, KCB Group, Safaricom, and Equity Group of 6.0%, 5.6%, 4.3% and 2.2%, respectively. The losses were however mitigated by gains recorded by stocks such as BAT and NCBA Group of 4.8% and 1.2%, respectively;
Real Estate
During the week, the Kenya National Bureau of Statistics (KNBS) released the Leading Economic Indicators (LEI) November 2022, December 2022 and January 2023 reports highlighting that the number of international arrivals through Jomo Kenyatta International Airport (JKIA) and Moi International Airport (MIA) increased by 35.3% to 324,719 in Q4’2022, from the 240,019 recorded in Q4’2021. In the industrial sector, Improvon, a South African based logistics and industrial developer, announced ongoing expansion efforts to set up mini-warehouse units at Nairobi Gate Industrial Park in Northlands City, Ruiru. In Regulated Real Estate Funds, under the Real Estate Investment Trusts (REITs) segment, Fahari I-REIT closed the week trading at an average price of Kshs 6.0 per share in the Nairobi Securities Exchange, a 12.0% decline from Kshs 6.8 per share recorded the previous week. On the Unquoted Securities Platform as at 14 April 2023, Acorn D-REIT and I-REIT closed the week trading at Kshs 23.9 and Kshs 20.9 per unit, respectively, a 19.4% and 4.4% gain for the D-REIT and I-REIT, respectively, from the Kshs 20.0 inception price. In addition, Cytonn High Yield Fund (CHYF) closed the week with an annualized yield of 13.7%, remaining relatively unchanged from the performance recorded the previous week;
Focus of the Week
Debt sustainability has been a critical issue in the Sub-Saharan region as several countries are facing high risk of debt distress with countries such as Zambia and Ghana having had to structure their public to avoid a complete default on their loans. Similar, concerns remain high on Kenya’s debt sustainability as a result of the continued rise in country’s debt levels with institutions such as World Bank and the International Monetary Fund (IMF) stressing on the need for Kenya to focus on fiscal consolidation on the back of the high risk of debt distress. Notably, as of December 2022, total public debt stood at Kshs 9.1 tn with the Kenya’s debt to GDP ratio coming in at 63.0%, 13.0% points above IMF’s recommended threshold of 50.0% for developing countries. Additionally, debt service to revenue ratio stood at 47.9%, 17.9% points above IMF’s recommended threshold of 30.0%, highlighting how much public debt servicing weighs on the country’s expenditure. The debt servicing cost has been on the rise given the continued aggressive depreciation of the Kenya shilling, with the shilling having depreciated by 8.9% year to date in 2023, as at 14 April 2023, adding to the 9.0% depreciation recorded in 2022. Further, it is good to note that as of December 2022, 68.1% of external debt was US Dollar denominated. This week, we shall focus on highlighting the current status of Kenya’s public debt as we approach the end of the FY’2022/2023, discuss the economic consequences of high debt levels as well as give our outlook on the country’s debt sustainability;
Company Updates
Investment Updates:
- Weekly Rates:
- Cytonn Money Market Fund closed the week at a yield of 11.02%. To invest, dial *809# or download the Cytonn App from Google Playstore here or from the Appstore here;
- Cytonn High Yield Fund closed the week at a yield of 13.74% p.a. To invest, email us at sales@cytonn.com and to withdraw the interest, dial *809# or download the Cytonn App from Google Playstore here or from the Appstore here;
- We continue to offer Wealth Management Training every Wednesday and every third Saturday of the month, from 9:00 am to 11:00 am, through our Cytonn Foundation. The training aims to grow financial literacy among the general public. To register for any of our Wealth Management Trainings, click here;
- If interested in our Private Wealth Management Training for your employees or investment group, please get in touch with us through wmt@cytonn.com;
- Cytonn Insurance Agency acts as an intermediary for those looking to secure their assets and loved ones’ future through insurance namely; Motor, Medical, Life, Property, WIBA, Credit and Fire and Burglary insurance covers. For assistance, get in touch with us through insuranceagency@cytonn.com;
- Cytonn Asset Managers Limited (CAML) continues to offer pension products to meet the needs of both individual clients who want to save for their retirement during their working years and Institutional clients that want to contribute on behalf of their employees to help them build their retirement pot. To more about our pension schemes, kindly get in touch with us through pensions@cytonn.com;
Real Estate Updates:
- For an exclusive tour of Cytonn’s Real Estate developments, visit: Sharp Investor's Tour, and for more information, email us at sales@cytonn.com;
- Phase 3 of The Alma is now ready for occupation and the show house is open daily. To join the waiting list to rent, please email properties@cytonn.com;
- For Third Party Real Estate Consultancy Services, email us at rdo@cytonn.com;
- For recent news about the group, see our news section here;
Hospitality Updates:
- We currently have promotions for Staycations. Visit cysuites.com/offers for details or email us at sales@cysuites.com;
Money Markets, T-Bills Primary Auction:
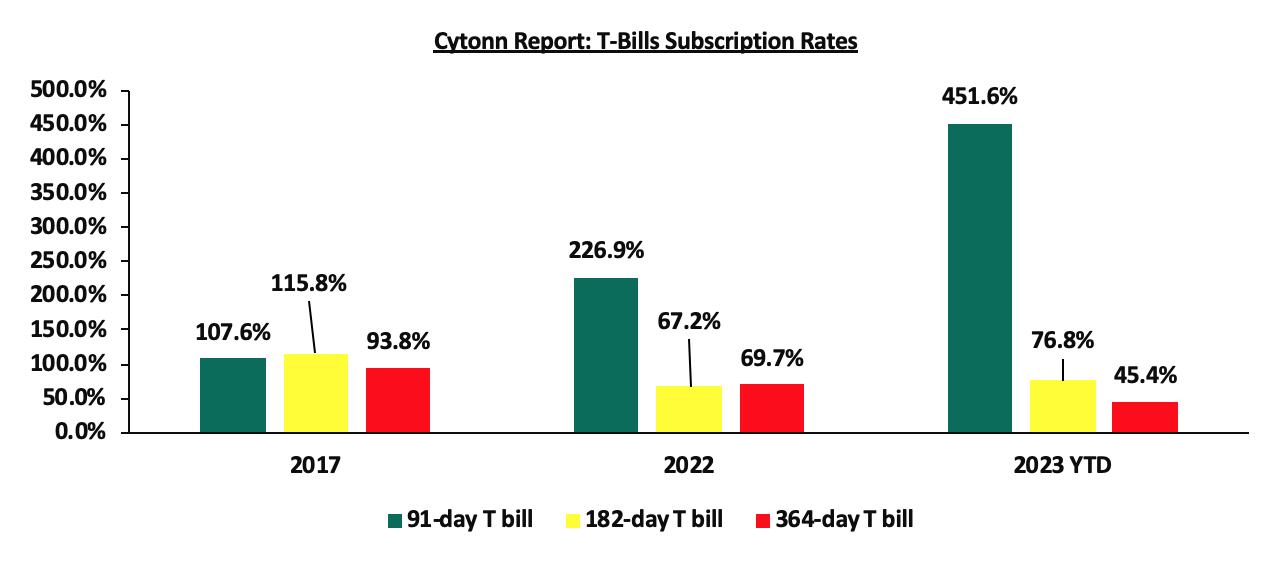
During the week, T-bills were oversubscribed for the second consecutive week, with the overall subscription rate coming in at 122.6%, down from an oversubscription of 134.8% recorded the previous week. Investor’s preference for the shorter 91-day paper persisted as they sought to avoid duration risk, with the paper receiving bids worth Kshs 24.9 bn against the offered Kshs 4.0 bn, translating to an oversubscription rate of 621.9%, lower than the 643.3% recorded the previous week. Notably, the 182-day and 364-day papers recorded continued undersubscriptions of 24.7% and 20.7%, from undersubscription rates of 5.8% and 60.3%, respectively, recorded the previous week. The government accepted bids worth Kshs 27.4 bn and rejected Kshs 2.0 bn out of the total Kshs 29.4 bn bids received, translating to an acceptance rate of 93.0%. The yields on the government papers were on upward trajectory, with the yields on the 364-day, 182-day and 91-day papers increasing by 7.5 bps, 6.0 bps and 6.8 bps to 10.9%, 10.4% and 10.1%, respectively. The chart below compares the overall average T- bills subscription rates obtained in 2017, 2022 and 2023 Year to Date (YTD):
In the Primary Bond Market, the government sought to raise additional Kshs 10.0 bn to fund infrastructural projects by offering a tap sale of an infrastructure bond IFB1/2023/17 with tenor to maturity of 17 years. The bond received bids worth Kshs 5.1 bn, translating to an undersubscription rate of 51.2%, partly attributable to continued tightened liquidity in the money market with the average interbank rate increasing by 0.3% points to 8.4%, from 8.1% recorded last week. The acceptance rate for the tap sale was 100.0% and both the weighted average yield and the coupon rate were at 14.4%. Key to note, this is the second Tap Sale for the infrastructure bond offered in the market after the first one was offered on 8 March 2023 which was also undersubscribed at 63.6%, mainly attributable to tightened liquidity.
Money Market Performance:
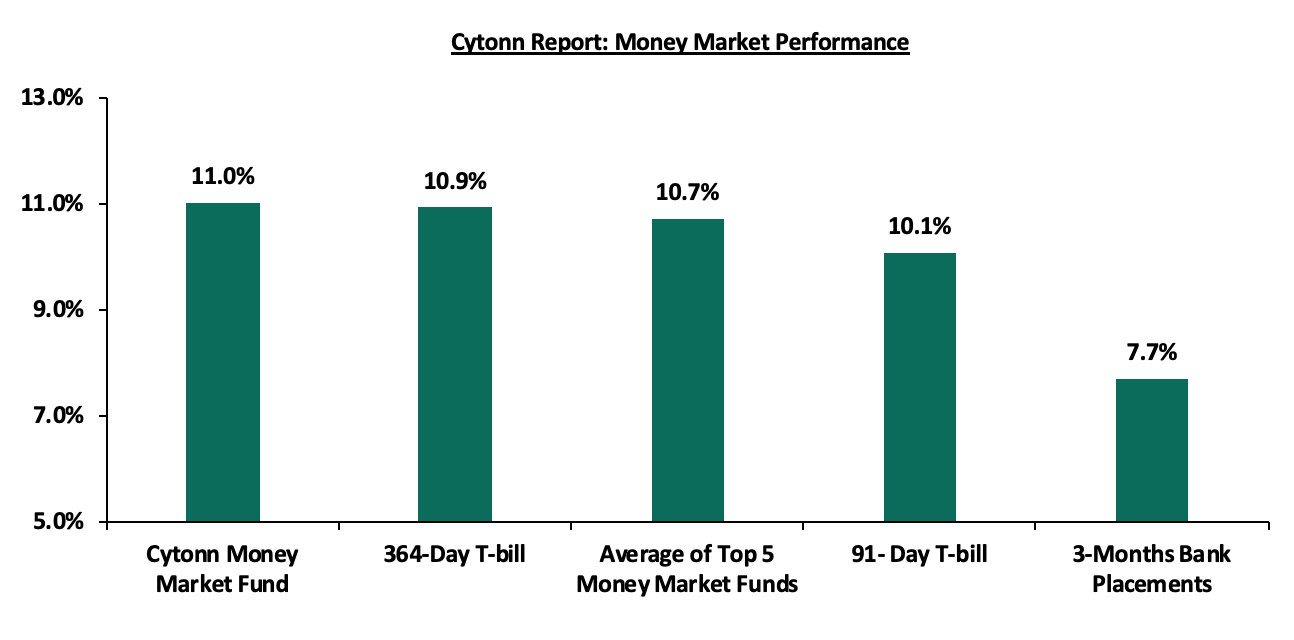
In the money market, the 3-month bank placements closed the week at 7.7%, similar to what was recorded the previous week (based on what we have been offered by various banks). The average yield on the 91-day T-bill increased by 0.1% points to 10.1%, from 10.0% recorded the previous week while the 364-day T-bill remained relatively unchanged at 10.9%, as was recorded last week. On the other hand, yields on the average Top 5 Money Market Funds declined by 0.1% points to 10.7%, from 10.6% recorded the previous week while Cytonn Money Market Fund (CMMF) remained relatively unchanged at 11.0%, from what was recorded the previous week.
The table below shows the Money Market Fund Yields for Kenyan Fund Managers as published on 14th April 2023:
|
Cytonn Report: Money Market Fund Yield for Fund Managers as published on 14th April 2023 |
||
|
Rank |
Fund Manager |
Effective Annual Rate |
|
1 |
Cytonn Money Market Fund (dial *809# or download Cytonn App) |
11.0% |
|
2 |
Madison Money Market Fund |
10.8% |
|
3 |
Etica Money Market Fund |
10.8% |
|
4 |
Dry Associates Money Market Fund |
10.5% |
|
5 |
Apollo Money Market Fund |
10.5% |
|
6 |
Jubilee Money Market Fund |
10.4% |
|
7 |
Nabo Africa Money Market Fund |
10.1% |
|
8 |
NCBA Money Market Fund |
10.1% |
|
9 |
Kuza Money Market fund |
10.0% |
|
10 |
AA Kenya Shillings Fund |
10.0% |
|
11 |
Zimele Money Market Fund |
9.9% |
|
12 |
Sanlam Money Market Fund |
9.8% |
|
13 |
Old Mutual Money Market Fund |
9.8% |
|
14 |
Enwealth Money Market Fund |
9.6% |
|
15 |
GenCap Hela Imara Money Market Fund |
9.4% |
|
16 |
CIC Money Market Fund |
9.4% |
|
17 |
KCB Money Market Fund |
9.4% |
|
18 |
Co-op Money Market Fund |
9.4% |
|
19 |
British-American Money Market Fund |
9.3% |
|
20 |
GenAfrica Money Market Fund |
9.3% |
|
21 |
Orient Kasha Money Market Fund |
9.1% |
|
22 |
ICEA Lion Money Market Fund |
9.0% |
|
23 |
Absa Shilling Money Market Fund |
8.6% |
|
24 |
Mali Money Market Fund |
8.2% |
|
25 |
Equity Money Market Fund |
6.7% |
Source: Business Daily, M-PESA App
Liquidity:
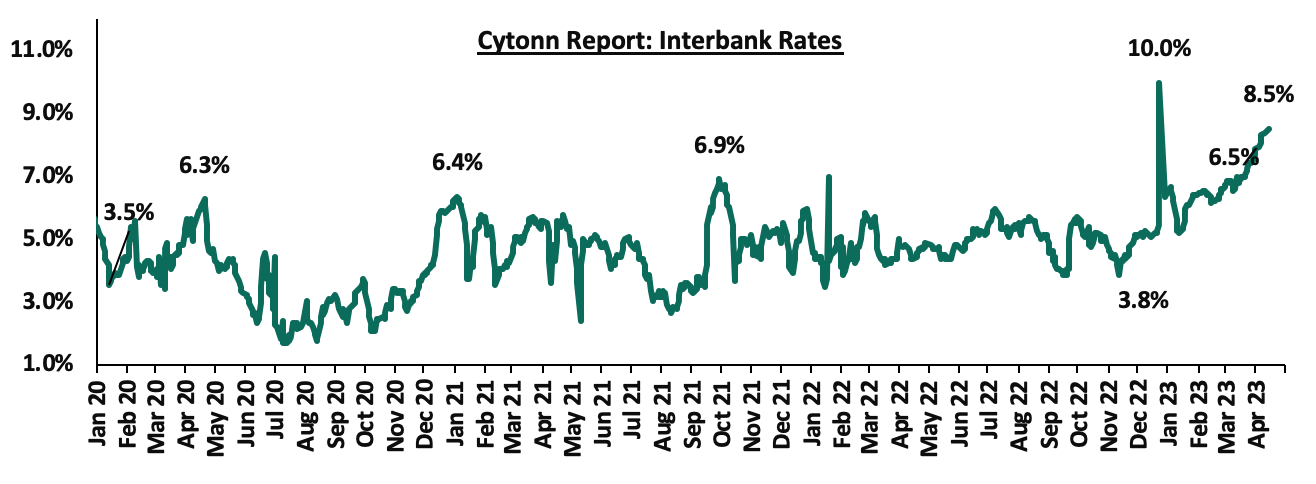
During the week, liquidity in the money markets continued to tighten, with the average interbank rate increasing to 8.4%, from 8.1% recorded the previous week, partly attributable to tax remittances that offset government payments. The average interbank volume traded consequently declined by 19.0% to Kshs 24.0 bn, from Kshs 29.6 bn recorded the previous week. The chart below shows the interbank rates in the market over the years:
Source: CBK
Kenya Eurobonds:
During the week, the yields on Eurobonds were on an upward trajectory with the yield on the 10-year Eurobond issued in 2018, increasing the most, having increased by 0.5% points to 14.7%, from 14.2% recorded the previous week. The rise in the country’s Eurobond yields is mainly on the back of increased concerns about the continued depreciation of the Kenyan shilling, United States dollar shortages currently experienced in the economy and increased debt servicing concerns with debt service to revenue coming in at 56.4% as of March 2023, compared to 54.2% recorded in February 2023. The table below shows the summary of the performance of the Kenyan Eurobonds as of 13 April 2023;
|
Cytonn Report: Kenya Eurobonds Performance |
||||||
|
2014 |
2018 |
2019 |
2021 |
|||
|
Date |
10-year issue |
10-year issue |
30-year issue |
7-year issue |
12-year issue |
12-year issue |
|
Amount Issued (USD bn) |
2.0 |
1.0 |
1.0 |
0.9 |
1.2 |
1.0 |
|
Years to Maturity |
1.3 |
5.0 |
25.0 |
4.2 |
9.2 |
11.3 |
|
Yields at Issue |
6.6% |
7.3% |
8.3% |
7.0% |
7.9% |
6.2% |
|
2-Jan-23 |
12.9% |
10.5% |
10.9% |
10.9% |
10.8% |
9.9% |
|
3-Apr-23 |
13.7% |
12.2% |
11.4% |
13.2% |
11.6% |
11.2% |
|
6-Apr-23 |
14.2% |
12.5% |
11.6% |
13.3% |
12.0% |
11.4% |
|
7-Apr-23 |
14.2% |
12.5% |
11.6% |
13.3% |
12.0% |
11.4% |
|
10-Apr-23 |
14.2% |
12.5% |
11.7% |
13.3% |
12.0% |
11.4% |
|
11-Apr-23 |
14.6% |
12.7% |
11.7% |
13.6% |
12.2% |
11.5% |
|
12-Apr-23 |
14.8% |
12.7% |
11.8% |
13.6% |
12.1% |
11.6% |
|
13-Apr-23 |
14.7% |
12.7% |
11.7% |
13.6% |
12.1% |
11.6% |
|
Weekly Change |
0.5% |
0.2% |
0.1% |
0.3% |
0.1% |
0.2% |
|
MTD change |
0.9% |
0.5% |
0.3% |
0.5% |
0.5% |
0.4% |
|
YTD Change |
1.8% |
2.2% |
0.9% |
2.7% |
1.4% |
1.7% |
Source: Central Bank of Kenya (CBK) and National Treasury
Kenya Shilling:
During the week, the Kenya Shilling depreciated by 0.8% against the US dollar to close the week at Kshs 134.4, from Kshs 133.3 recorded the previous week, partly attributable to increased dollar demand from manufacturers and importers, especially oil and energy sectors against a slower supply of hard currency. On a year to date basis, the shilling has depreciated by 8.9% against the dollar, adding to the 9.0% depreciation recorded in 2022. We expect the shilling to remain under pressure in 2023 as a result of:
- High global crude oil prices on the back of persistent supply chain constraints coupled with high demand. The high crude oil prices have inflated Kenya’s import bill and as a result, petroleum products imports have continued to weigh heavily on the country’s import bill, and accounted for 27.6% of the total import bill in Q3’2022, up from 25.6% in Q2’2022 and much higher than 15.2% recorded in Q3’2021,
- An ever-present current account deficit estimated at 4.9% of GDP in the 12 months to January 2023, from 5.6% recorded in a similar period last year,
- The need for Government debt servicing which continues to put pressure on forex reserves given that 68.1% of Kenya’s External debt was US Dollar denominated as of December 2022, and,
- A continued interest rate hikes in the USA and the Euro Area with the Fed and European Central Bank increasing their benchmark rates to 4.75%-5.00% and 3.50% respectively in March 2023, which has strengthened the dollar and sterling pound against other currencies following capital outflows from other global emerging markets.
The shilling is however expected to be supported by:
- Diaspora remittances standing at a cumulative USD 658.6 mn in 2023 as of February 2023, albeit 0.3% lower than the USD 660.3 mn recorded over the same period in 2022, and,
- The tourism inflow receipts that came in at USD 268.1 bn in 2022, a significant 82.9% increase from USD 146.5 bn inflow receipts recorded in 2021.
Key to note, Kenya’s forex reserves remained relatively unchanged at USD 6.4 bn as at 13 April 2023, similar to what was recorded the previous week. As such, the country’s months of import cover also remained unchanged at 3.6 months, similar to what was recorded the previous week, and below the statutory requirement of maintaining at least 4.0-months of import cover. The chart below summarizes the evolution of Kenya months of import cover over the last 10 years:
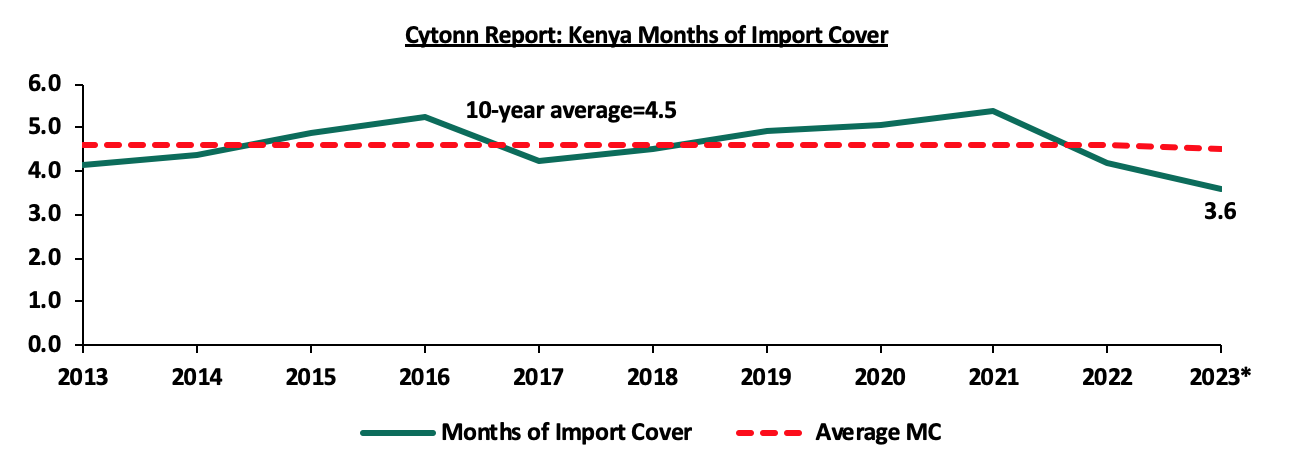
*Figure as of 13 April 2023
Weekly Highlight:
- Revenue and Net Exchequer for FY’2022/2023
The National Treasury gazetted the revenue and net expenditures for the first nine months of FY’2022/2023, ending 31 March 2023. Below is a summary of the performance:
|
FY'2022/2023 Budget Outturn - As at 31st March 2023 |
||||||
|
Amounts in Kshs billions unless stated otherwise |
||||||
|
Item |
12-months Original Estimates |
Revised Estimates |
Actual Receipts/Release |
Percentage Achieved of the Revised Estimates |
Prorated |
% achieved of the Prorated |
|
Opening Balance |
|
|
0.6 |
|
|
|
|
Tax Revenue |
2,071.9 |
2,108.3 |
1,393.4 |
66.1% |
1,581.2 |
88.1% |
|
Non-Tax Revenue |
69.7 |
83.7 |
50.7 |
60.6% |
62.7 |
80.9% |
|
Total Revenue |
2,141.6 |
2,192.0 |
1,444.7 |
65.9% |
1,644.0 |
87.9% |
|
External Loans & Grants |
349.3 |
520.6 |
235.5 |
45.2% |
390.4 |
60.3% |
|
Domestic Borrowings |
1,040.5 |
886.5 |
396.3 |
44.7% |
664.9 |
59.6% |
|
Other Domestic Financing |
13.2 |
13.2 |
15.5 |
117.4% |
9.9 |
156.5% |
|
Total Financing |
1,403.0 |
1,420.3 |
647.3 |
45.6% |
1,065.3 |
60.8% |
|
Recurrent Exchequer issues |
1,178.4 |
1,266.0 |
814.7 |
64.4% |
949.5 |
85.8% |
|
CFS Exchequer Issues |
1,571.8 |
1,552.9 |
886.5 |
57.1% |
1,164.7 |
76.1% |
|
Development Expenditure & Net Lending |
424.4 |
393.8 |
174.8 |
44.4% |
295.4 |
59.2% |
|
County Governments + Contingencies |
370.0 |
399.6 |
212.8 |
53.2% |
299.7 |
71.0% |
|
Total Expenditure |
3,544.6 |
3,612.3 |
2,088.7 |
57.8% |
2,709.2 |
77.1% |
|
Fiscal Deficit excluding Grants |
1,403.0 |
1,420.3 |
644.0 |
45.3% |
1,065.3 |
60.5% |
|
Total Borrowing |
1,389.8 |
1,407.1 |
631.8 |
44.9% |
1,055.3 |
59.9% |
The key take-outs from the report include:
- Total revenue collected as at the end of March 2023 amounted to Kshs 1,444.7 bn, equivalent to 65.9% of the revised estimates of Kshs 2,192.0 bn for FY’2022/2023 and is 87.9% of the prorated estimates of Kshs 1,644.0 bn. We note that the government has not been able to meet its prorated revenue targets nine months into the FY’2022/2023, partly attributable to the tough macroeconomic environment in the country as a result of elevated inflationary pressures with March 2023 coming in at 9.2%, above the CBK target range of 2.5%-7.5%. Despite the poor performance, the government revised the revenue target upwards indicating that the government believes its revenue collection strategies will bear fruit in the coming months. Cumulatively, tax revenues amounted to Kshs 1,393.4 bn, equivalent to 66.1% of the revised estimates of Kshs 2,108.3 bn and 88.1% of the prorated estimates of Kshs 1,581.2 bn,
- Total financing amounted to Kshs 647.3 bn, equivalent to 45.6% of the revised estimates of Kshs 1,420.3 bn and is equivalent to 60.8% of the prorated estimates of Kshs 1,065.3 bn. Additionally, domestic borrowing amounted to Kshs 396.3 bn, equivalent to 44.7% of the revised estimates of Kshs 886.5 bn and is 59.6% of the prorated estimates of Kshs 664.9 bn,
- The total expenditure amounted to Kshs 2,088.7 bn, equivalent to 57.8% of the revised estimates of Kshs 3,612.3 bn, and is 77.1% of the prorated expenditure estimates of Kshs 2,709.2 bn. Additionally, the net disbursements to recurrent expenditures came in at Kshs 814.7 bn, equivalent to 64.4% of the revised estimates of Kshs 1,266.0 bn and 85.8% of the prorated estimates of Kshs 949.5 bn, and development expenditure amounted to Kshs 174.8 bn, equivalent to 44.4% of the revised estimates of Kshs 393.8 bn and is 59.2% of the prorated estimates of Kshs 295.4 bn,
- Consolidated Fund Services (CFS) Exchequer issues (refers to the Consolidated Fund established in the Kenya’s constitution into which development partners deposit funds before disbursing to the Exchequer accounts for projects such as servicing of public debt, payment of pensions and gratuities, salaries and allowances and subscription to International Organizations) came in at Kshs 886.5 bn, equivalent to 57.1% of the revised estimates of Kshs 1,552.9 bn, and 76.1% of the prorated amount of Kshs 1,164.7 bn. The cumulative public debt servicing cost amounted to Kshs 815.4 bn which is 59.9% of the revised estimates of Kshs 1,361.0 bn, and is 79.9% of the prorated estimates of Kshs 1,020.7 bn. Notably, the Kshs 815.4 bn debt servicing cost is equivalent to 56.4% of the actual revenues collected as at the end of March 2023, further emphasizing on how much public debt servicing weighs on the country’s expenditure. Additionally, Recurrent Exchequer issues came in at Kshs 814.7 bn equivalent to 64.4% of the revised estimates of Kshs 1,266.0 bn and are 85.8% of the prorated estimates of Kshs 949.5 bn, and,
- Total Borrowings as at the end of March 2023 amounted to Kshs 631.8 bn, equivalent to 44.9% of the revised estimates of Kshs 1,407.1 bn for FY’2022/2023, and are 59.9% of the prorated estimates of Kshs 1,055.3 bn. The cumulative domestic borrowing target of Kshs 886.5 bn comprises of adjusted Net domestic borrowings of Kshs 425.1 bn and Internal Debt Redemptions (rollovers) of Kshs 461.4 bn.
The government has been unable to meet its prorated revenue targets for the nine months of the FY’2022/2023, mainly on the back of the tough economic situation exacerbated by the elevated inflationary pressures that have remained above the CBK target range of 2.5%-7.5%, with the year on year inflation rate in March 2023 coming in at 9.2%, similar to what was recorded in February. Additionally, the US dollar shortage and currency depreciation currently being experienced in the economy has resulted in high consumer prices as companies pass the high cost of import and production to consumers. Despite the March 2023 Purchasing Managers Index (PMI) coming in at 49.2, higher than 46.6 in February 2023, it remained below the 50-threshold mark indicating persistent deterioration in the country’s business environment denting revenue collection efforts. In light of this, the government is yet to fully benefit from the strategies put in place to improve revenue collection such as expanding the revenue base and sealing tax leakages, and suspension of all tax relief payments. Going forward, we assert that the government revenue targets are relatively ambitious, owing to the tough economic conditions evidenced by the deteriorating business environment with the PMI index averaging 49.3% in 2023.
- Fuel Prices
During the week, the Energy and Petroleum Regulatory Authority (EPRA) released their monthly statement on the maximum retail fuel prices in Kenya effective 15 April 2023 to 14 May 2023. Notably, fuel prices remained unchanged for the month at Kshs 179.3, Kshs 162.0 and Kshs 145.9 per liter of Super Petrol, Diesel and Kerosene, respectively. This comes after a Kshs 2.0 hike in the price of Super Petrol in the previous fuel price release, however, the prices of Kerosene and Diesel have remained unchanged for the fifth consecutive month. Other key take-outs from the performance include;
- The average landed costs for diesel and kerosene decreased by 7.1% and 7.3% to USD 705.8 per cubic metre and USD 707.5 per cubic metre in March 2023, from USD 759.9 per cubic metre and USD 763.3 per cubic metre in February 2023, respectively. However, the landed cost for Super Petrol increased by 1.1% to USD 666.5 per cubic metre in March 2023 from USD 659.5 per cubic metre in February,
- The Free On Board (FOB) price of Murban crude oil increased by 3.2% to USD 82.6 per barrel in March 2023 from USD 80.1 per barrel recorded in February 2023,
- The Kenyan Shilling depreciated against the US Dollar by 4.2% to Kshs 139.6 in March 2023 from 134.0 in February 2023, and,
- The price of diesel has been cross subsidized with that of super-petrol, while maintaining a subsidy of Kshs 17.2 per litre on Kerosene from a subsidy of Kshs 23.5 in February in order to cushion consumers from the otherwise high prices.
Key to note, EPRA maintained the Kshs 12.4 per litre margin to Oil Marketing Companies for Super Petrol and increased Diesel margins significantly by 109.3% to Kshs 6.1 per litre, from 2.9 per litre, while Kerosene margins remained withheld. This is attributable to super-petrol recording a price stabilization surplus of Kshs 5.8 per litre, diesel remaining balanced, while kerosene recorded a deficit of Kshs 3.5 per litre.
Fuel prices remained unchanged and elevated for the month of March 2023, despite the global fuel prices dropping by 25.5% to USD 87.7 per barrel as of 13 April 2023, from a peak of USD 117.7 per barrel recorded on 1 June 2022 and the average landed costs declining during the month except for Super Petrol. Notably, the maintained prices are mainly on the back of the scaling down of fuel subsidies coupled with the US dollar shortage and currency depreciation being experienced in the economy hence elevating the cost of fuel import. However, the government in a bid to alleviate the high demand of US dollar by petroleum importers which consequently leads to high cost of fuel importation, signed a government-government deal involving firms such as the Saudi Aramco (ARAMCO), Abu Dhabi National Oil Company (ADNOC) and Emirates National Oil Company (ENOC) to supply Kenya with diesel and super petrol for the next six months on credit. The first batch of fuel importation was received on 13 April 2023. However, we remain reluctant on the effectiveness of the deal to fix the current situation and the government will need long term strategies to buffer foreign reserves and resuscitate the currently frail interbank forex market. Furthermore, we still maintain the view that the government should gradually eliminate the fuel subsidies to ease the expenditure and ensure fiscal consolidation.
Rates in the Fixed Income market have remained relatively stable due to the relatively ample liquidity in the money market. The government is 11.2% ahead of its prorated borrowing target of Kshs 338.7 bn having borrowed Kshs 376.6 bn of the new domestic borrowing target of Kshs 425.1 bn as per the March 2023 revised domestic borrowing target for FY’2022/23. We believe that the projected budget deficit of 5.7% is relatively ambitious given the downside risks and deteriorating business environment occasioned by high inflationary pressures. Further, revenue collections are lagging behind, with total revenue as at March 2023 coming in at Kshs 1.4 tn in the FY’2022/2023, equivalent to 65.9% of its revised target of Kshs 2.2 tn and 87.9% of the prorated target of Kshs 1.6 tn. Therefore, we expect a continued upward readjustment of the yield curve in the short and medium term, with the government looking to bridge the fiscal deficit through the domestic market. Owing to this, our view is that investors should be biased towards short-term fixed-income securities to reduce duration risk.
Market Performance:
During the week, the equities market was on a downward trajectory with NASI, NSE 20 and NSE 25 declining by 2.4%, 1.9% and 2.1%, respectively, taking the YTD performance to losses of 12.4%, 3.7% and 6.9% for NASI, NSE 20 and NSE 25, respectively. The equities market performance was mainly driven by losses recorded by large cap stocks such as Bamburi, KCB Group, Safaricom, and Equity Group of 6.0%, 5.6%, 4.3% and 2.2%, respectively. The losses were however mitigated by gains recorded by stocks such as BAT and NCBA Group of 4.8% and 1.2%, respectively.
During the week, equities turnover decreased by 32.9% to USD 7.7 mn from USD 11.5 mn recorded the previous week, taking the YTD turnover to USD 367.5 mn. Foreign investors turned net buyers, with a net buying position of USD 1.5 mn, from a net selling position of USD 1.3 mn recorded the previous week, taking the YTD net selling position to USD 40.8 mn.
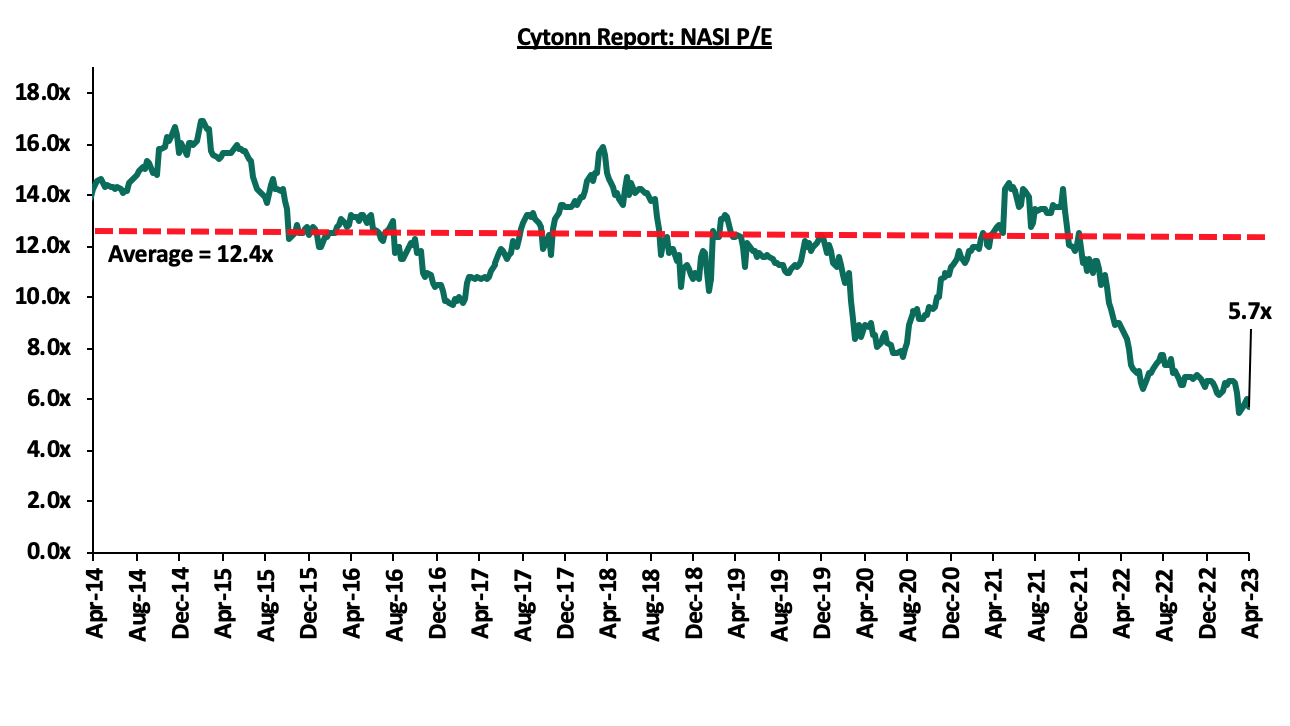
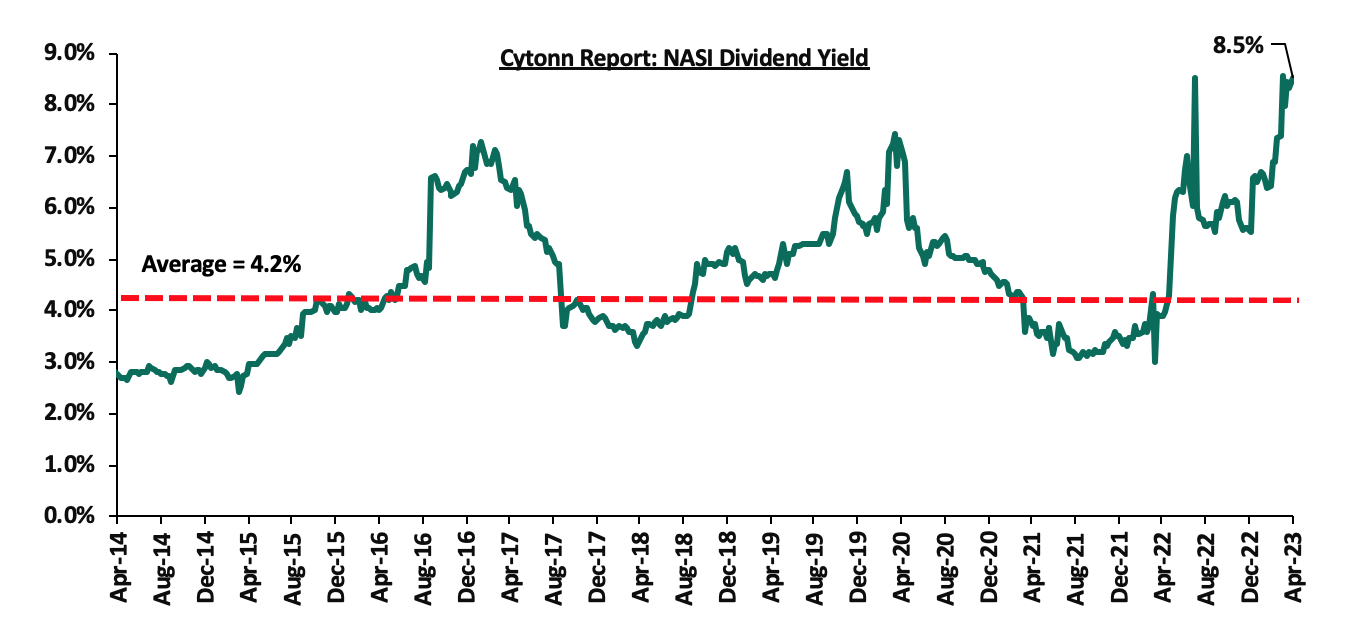
The market is currently trading at a price to earnings ratio (P/E) of 5.7x, 54.3% below the historical average of 12.4x. The dividend yield stands at 8.5%, 4.3% points above the historical average of 4.2%. Key to note, NASI’s PEG ratio currently stands at 0.7x, an indication that the market is undervalued relative to its future growth. A PEG ratio greater than 1.0x indicates the market is overvalued while a PEG ratio less than 1.0x indicates that the market is undervalued. The charts below indicate the historical P/E and dividend yields of the market;
Universe of coverage:
|
Company |
Price as at 06/04/2023 |
Price as at 14/04/2023 |
w/w change |
YTD Change |
Year Open 2023 |
Target Price* |
Dividend Yield |
Upside/ Downside** |
P/TBv Multiple |
Recommendation |
|
Jubilee Holdings |
168.8 |
158.8 |
(5.9%) |
(20.1%) |
198.8 |
305.9 |
8.8% |
101.5% |
0.3x |
Buy |
|
Liberty Holdings |
4.4 |
3.7 |
(16.4%) |
(26.4%) |
5.0 |
6.8 |
0.0% |
81.9% |
0.3x |
Buy |
|
KCB Group*** |
35.9 |
33.9 |
(5.6%) |
(11.6%) |
38.4 |
52.5 |
5.9% |
60.7% |
0.5x |
Buy |
|
Britam |
4.7 |
4.6 |
(2.8%) |
(12.1%) |
5.2 |
7.1 |
0.0% |
55.8% |
0.8x |
Buy |
|
Kenya Reinsurance |
2.0 |
1.8 |
(9.0%) |
(2.7%) |
1.9 |
2.5 |
11.0% |
48.9% |
0.1x |
Buy |
|
Sanlam |
8.6 |
8.0 |
(6.8%) |
(16.5%) |
9.6 |
11.9 |
0.0% |
48.9% |
0.8x |
Buy |
|
Equity Group*** |
45.5 |
44.5 |
(2.2%) |
(1.2%) |
45.1 |
58.4 |
9.0% |
40.1% |
1.1x |
Buy |
|
ABSA Bank*** |
12.9 |
12.7 |
(1.2%) |
4.1% |
12.2 |
15.5 |
10.6% |
32.3% |
1.1x |
Buy |
|
Co-op Bank*** |
13.1 |
13.0 |
(0.4%) |
7.4% |
12.1 |
15.5 |
11.5% |
30.5% |
0.6x |
Buy |
|
NCBA*** |
36.6 |
37.0 |
1.2% |
(5.0%) |
39.0 |
43.4 |
11.5% |
28.8% |
0.8x |
Buy |
|
CIC Group |
2.0 |
1.9 |
(4.4%) |
1.6% |
1.9 |
2.3 |
6.7% |
26.3% |
0.7x |
Buy |
|
Diamond Trust Bank*** |
53.0 |
53.0 |
0.0% |
6.3% |
49.9 |
57.1 |
9.4% |
17.2% |
0.2x |
Accumulate |
|
Stanbic Holdings |
107.0 |
110.8 |
3.5% |
8.6% |
102.0 |
112.0 |
11.4% |
12.5% |
1.0x |
Accumulate |
|
I&M Group*** |
20.9 |
20.6 |
(1.7%) |
20.5% |
17.1 |
20.8 |
10.9% |
12.3% |
0.5x |
Accumulate |
|
Standard Chartered*** |
169.0 |
170.0 |
0.6% |
17.2% |
145.0 |
166.3 |
12.9% |
10.7% |
1.2x |
Accumulate |
|
HF Group |
4.2 |
3.8 |
(8.9%) |
21.0% |
3.2 |
3.4 |
0.0% |
(10.0%) |
0.2x |
Sell |
|
*Target Price as per Cytonn Analyst estimates **Upside/ (Downside) is adjusted for Dividend Yield ***For Disclosure, these are stocks in which Cytonn and/or its affiliates are invested in |
||||||||||
We are “Neutral” on the Equities markets in the short term due to the current adverse operating environment and huge foreign investor outflows, and, “Bullish” in the long term due to current cheap valuations and expected global and local economic recovery.
With the market currently trading at a discount to its future growth (PEG Ratio at 0.7x), we believe that investors should reposition towards value stocks with strong earnings growth and that are trading at discounts to their intrinsic value. We expect the current high foreign investors sell-offs to continue weighing down the equities outlook in the short term.
- Industry Reports
The Kenya National Bureau of Statistics (KNBS) released the Leading Economic Indicators (LEI) November 2022, December 2022 and January 2023 reports which highlighted the performance of major economic indicators such as international arrivals, building plan approvals, among others. The key highlights related to the Real Estate sector include;
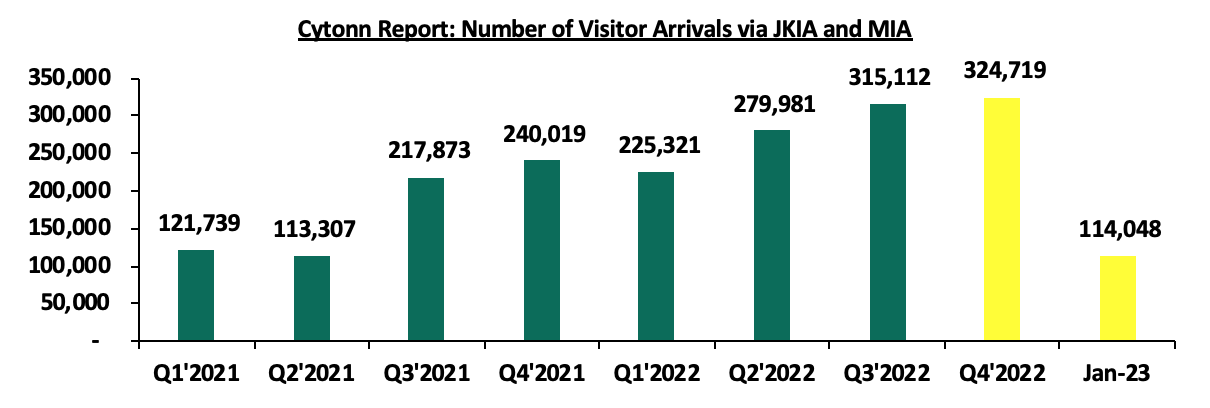
- Overall international arrivals through Jomo Kenyatta International Airport (JKIA) and Moi International Airport (MIA) increased by 35.3% to 324,719 in Q4’2022, from the 240,019 recorded in Q4’2021. On a q/q basis, the performance was a 3.0% increase, from 315,112 recorded in Q3’2022. Additionally, for the month of January 2023, the total number of arrivals increased by 63.1% to 114,048 from 69,932 recorded in January 2022. The improved performance can be attributed to; i) continued intensive marketing of Kenya’s tourism market by the Ministry of Tourism in collaboration with the Kenya Tourism Board, through platforms such as the Magical Kenya platform, ii) purposed efforts to promote local tourism highlighted under the Ministry of Tourism Strategy 2021-2025, and, iii) an upsurge in corporate and business meetings, events, and conferences from both the public and private sectors owing to the revamp of the economy during the post-COVID-19 and electioneering periods. The chart below shows the number of international arrivals in Kenya between 2017 and January 2023;
Source: Kenya National Bureau of Statistics (KNBS)
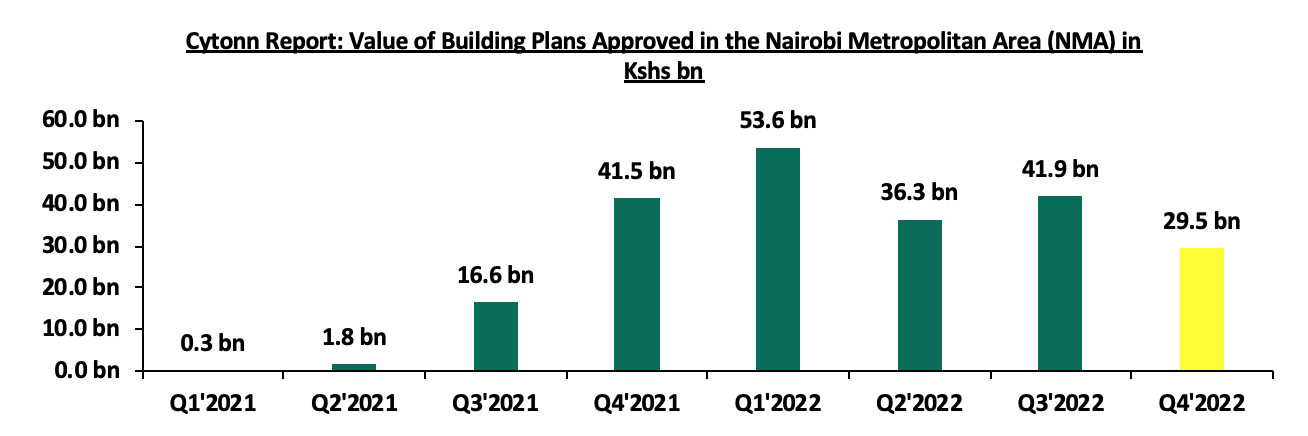
- The value of building plans approved in the Nairobi Metropolitan Area (NMA) decreased by 28.9% to Kshs 29.5 bn in Q4’2022, from Kshs 41.5 bn recorded in Q4’2021. On a q/q basis, the performance represented a 29.6% decline, from Kshs 41.9 bn recorded in Q3’2022. The decline in performance is attributable to; i) high development costs on the back of rising prices of construction materials such as cement, steel and PVC driven by inflationary pressure, and ii) pending of approvals amid delays in processing construction permits enhanced by backlogs in registry systems. The chart below shows the value of building plans approved in the Nairobi Metropolitan Area (NMA) between 2021 and 2022;
Source: Kenya National Bureau of Statistics (KNBS)
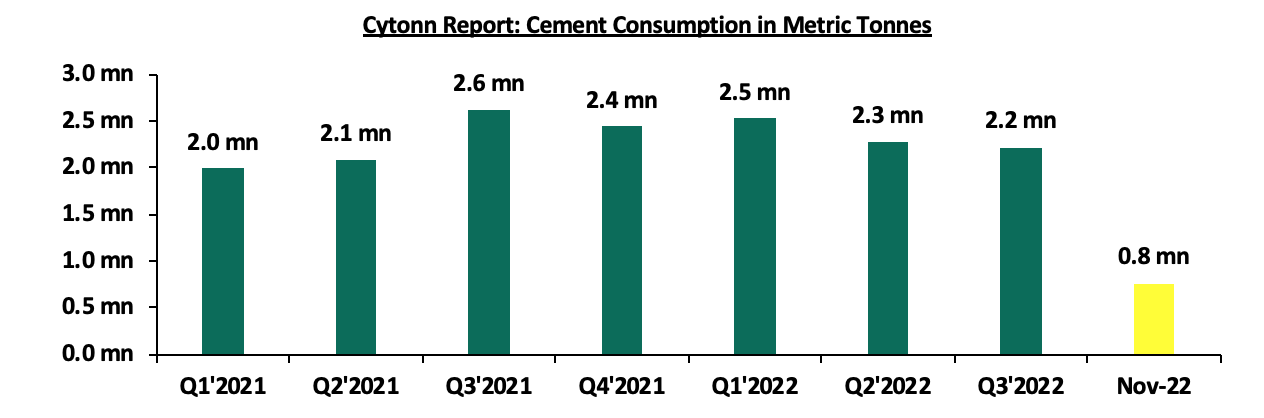
- The consumption of cement increased by 1.6% to 0.8 mn metric tonnes in November 2022, from 0.7 mn metric tonnes realized in October 2022, attributable to initiation of infrastructural developments by the government amid restructuring of the Ministries, Departments, and Agencies (MDAs) involved. On the other hand, the performance represented a 3.6% decline from 0.8 mn metric tonnes realized during November 2021. The decline in performance is attributable to increased costs of the commodity driven by prevailing inflationary pressures from local and external shocks. The chart below shows cement consumption in metric tonnes in Kenya between 2021 and November 2022;
Source: Kenya National Bureau of Statistics (KNBS)
We expect the Real Estate sector to register positive growth and increased performance mainly driven by the increasing number of visitor arrivals into the country boosting performance of serviced apartments and hotels in the country. However, the decline in construction activities with the reduction in the consumption of cement, driven by high construction costs on the back of inflationary pressures are expected to hamper the optimal performance of the sector.
- Industrial Sector
During the week, Improvon, a South African based logistics and industrial developer, announced ongoing expansion efforts to set up mini-warehouse units at Nairobi Gate Industrial Park in Northlands City, Ruiru. The facility targets medium-sized firms seeking specialized logistics solutions and already hosts two 5,000 SQM depots. In the first phase, Improvon plans to erect 40 mini units, each comprising of 550 and 600 SQM in floor space at a rental rate of USD 6.4 (Kshs 860) per SQM, with 19 units already complete. Notable tenants that have already taken mini warehouse units at the facility include Probakery and Mac Coffee Kenya. In addition to mini-units, Improvon also aims to provide bespoke facilities of up to 10,000 SQM catered to large manufacturers. The decision to set-up the warehouse units is driven by;
- The opening up of prime areas such as Ruiru and Limuru, which are easily accessible through the construction of bypasses around Nairobi city, enabling developers to quickly access Jomo Kenyatta International Airport and the standard gauge railway-linked Inland Container Depot (ICD) in Syokimau,
- The increasing demand from small and medium-sized enterprises (SMEs), agro-processors, and Fast-Moving Consumer Goods (FMCG) firms for warehousing, which has prompted developers to focus on quality industrial space with ample amenities, parking and, road infrastructure, and,
- The strong market fundamentals of the industrial sector, driven by Kenya’s positive urbanization rate at 3.7%, compared to the global average rate of 1.6% as at 2021, which is attracting investors to strategically locations that have favorable development policies such as the Northlands City in Ruiru.
We expect the industrial sector to continue recording growth, driven by the rising demand for quality industrial facilities eyeing to cater to the growing demand for prime warehousing and logistics solutions in easily accessible areas, outside the traditional hub of Nairobi's Industrial Area and along Mombasa Road. This will provide more investment opportunities in the industry, allowing further diversification of Kenya's Real Estate sector.
- Regulated Real Estate Funds
- Real Estate Investment Trusts (REITs)
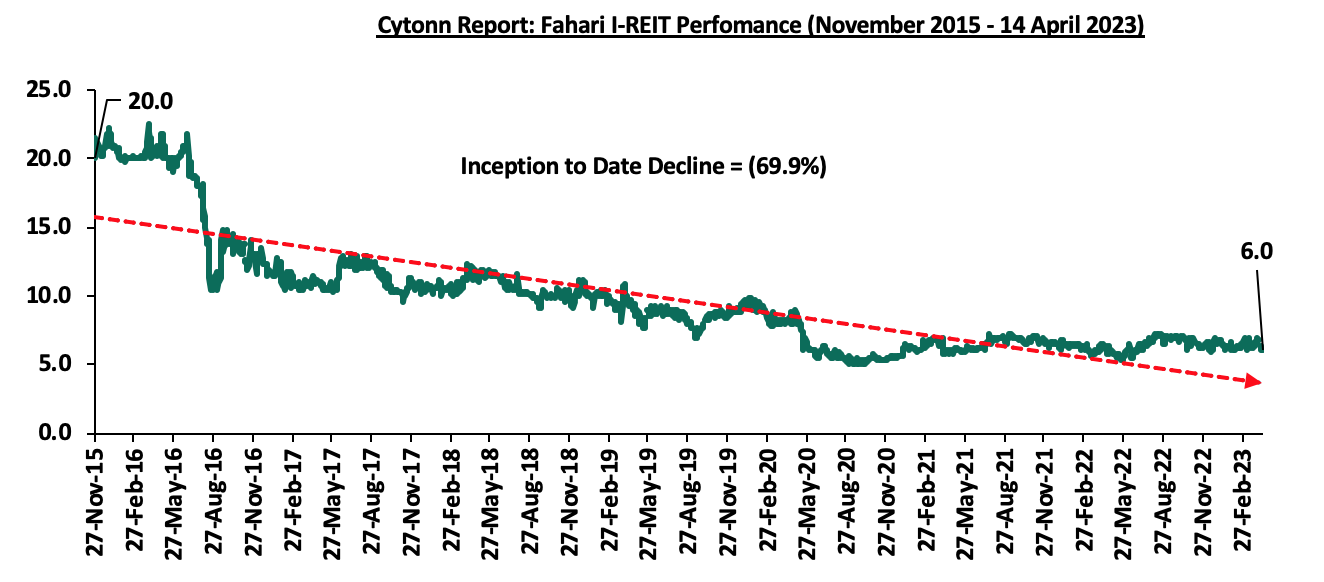
In the Nairobi Securities Exchange, ILAM Fahari I-REIT closed the week trading at an average price of Kshs 6.0 per share. The performance represented a 12.0% decline from Kshs 6.8 per share recorded the previous week, taking it to an 11.2% Year-to-Date (YTD) decline from Kshs 6.8 per share recorded on 3rd January 2023. In addition, the performance represented a 69.9% Inception-to-Date (ITD) loss from the Kshs 20.0 price. The dividend yield currently stands at 10.8%. The graph below shows Fahari I-REIT’s performance from November 2015 to 14th April 2023;
In the Unquoted Securities Platform, Acorn D-REIT and I-REIT traded at Kshs 23.9 and Kshs 20.9 per unit, respectively, as at 14 April 2023. The performance represented a 19.4% and 4.4% gain for the D-REIT and IREIT, respectively, from the Kshs 20.0 inception price. The volumes traded for the D-REIT and I-REIT came in at 12.3 mn and 29.6 mn shares, respectively, with a turnover of Kshs 257.5 mn and Kshs 603.2 mn, respectively, since inception in February 2021.
REITs provide numerous advantages, including; access to more capital pools, consistent and prolonged profits, tax exemptions, diversified portfolios, transparency, liquidity and flexibility as an asset class. Despite these benefits, the performance of the Kenyan REITs market remains limited by several factors such as; i) insufficient investor understanding of the investment instrument, ii) time-consuming approval procedures for REIT creation, iii) high minimum capital requirements of Kshs 100.0 mn for trustees, and, iv) high minimum investment amounts set at Kshs 5.0 mn discouraging investments.
- Cytonn High Yield Fund (CHYF)
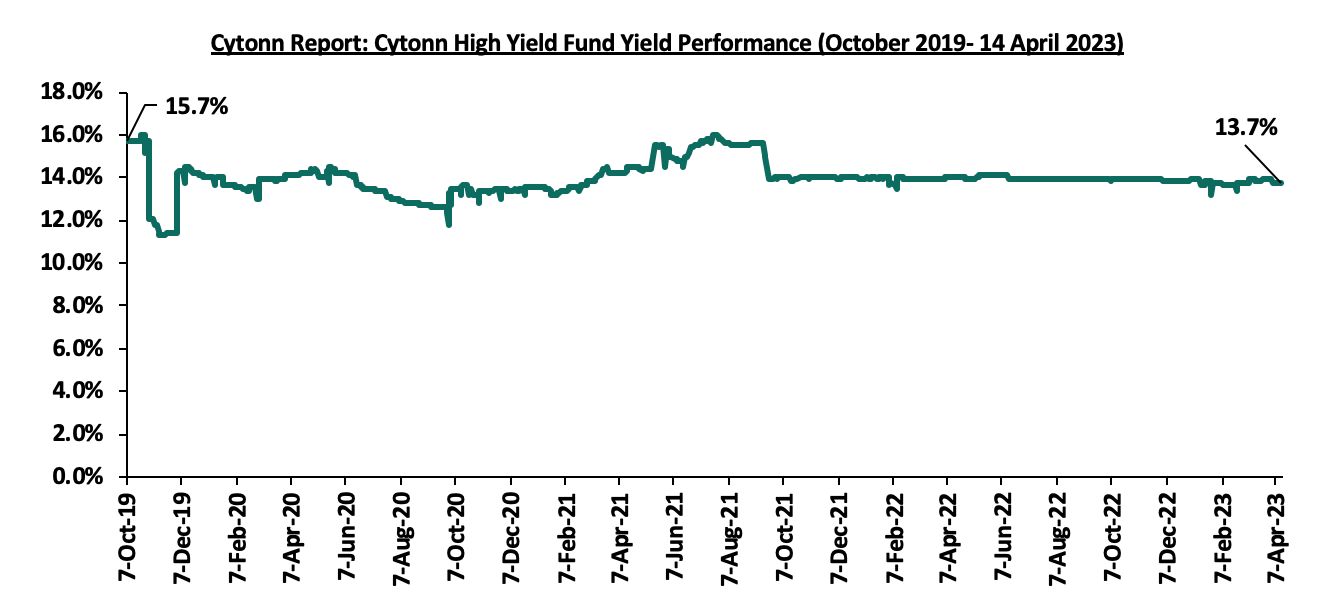
Cytonn High Yield Fund (CHYF) closed the week with an annualized yield of 13.7%, remaining relatively unchanged from the performance recorded the previous week. The performance represented a 0.2% points Year-to-Date (YTD) decline from 13.9% yield recorded on 1 January 2023 and 2.0% points Inception-to-Date (ITD) loss, from the 15.7% yield. The graph below shows Cytonn High Yield Fund’s performance from November 2015 to 14 April 2023;
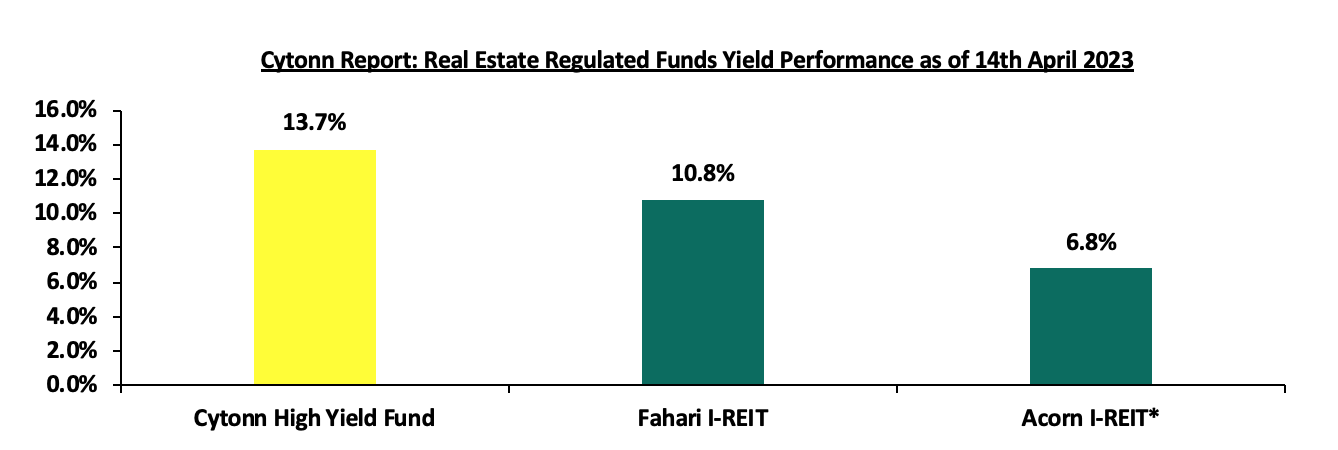
Notably, the CHYF has outperformed other regulated Real Estate funds with an annualized yield of 13.7%, as compared to Fahari I-REIT and Acorn I-REIT with yields of 10.8%, and 6.8% respectively. As such, the higher yields offered by CHYF makes the fund one of the best alternative investment resources in the Real Estate sector. The graph below shows the yield performance of the Regulated Real Estate Funds;
*FY’2022
Source: Cytonn Research
We expect the performance of Kenya’s Real Estate sector to remain on an upward trajectory, supported by factors such as; i) expansion of activity in the hospitality sector with increase in international arrivals, and growing focus into the industrial sector which will open up more areas for more opportunities in Real Estate. However, the rising costs of construction on the back of prevailing inflationary pressure that is hampering development activity, oversupply of physical space in select sectors, and low investor appetite for REITs are expected to continue subduing the optimal performance of the general Real Estate sector.
Debt sustainability has been a critical issue in the Sub-Saharan Africa region as several countries are facing high risk of debt distress. We have seen countries such as Zambia and Ghana having to restructure their debt to avoid a complete default on their loans. Similarly, concerns remain high on Kenya’s debt sustainability as a result of the continued rise in country’s debt levels with institutions such as World Bank and the International Monetary Fund (IMF) stressing on the need for Kenya to focus on fiscal consolidation. As of December 2022, total public debt stood at Kshs 9.1 tn translating to a debt to GDP ratio of 63.0%, 13.0% points above IMF’s recommended threshold of 50.0% for developing countries. Additionally, debt service to revenue ratio stood at 47.9%, 17.9% points above IMF’s recommended threshold of 30.0%, highlighting how much public debt servicing weighs on the country’s expenditure. Most of the external debt is denominated in USD at 68.1% and the high depreciation of the shilling has continued to put more pressure on the debt serving, the Kenya shilling, have depreciated by 8.9% year following a 9.0% depreciation recorded in 2022. This week, we shall focus on highlighting the current status of Kenya’s public debt as we approach the end of the FY’2022/2023, discuss the economic consequences of high debt levels as well as give our outlook on the country’s debt sustainability.
We have been tracking the evolution of Kenya’s public debt with the most recent topical being Kenya’s Public Debt 2022; Debt Service Coverage, which was done in July 2022. Here we highlighted the state of affairs concerning the country’s public debt and concluded by discussing strategies that the government could implement in order to reduce the economic consequences of high debt levels as well as mitigate the high risk of debt distress. In this week’s topical, we shall focus on the current status of Kenya’s public debt as we approach the end of the FY’2022/2023. We shall look at what are the economic consequences resulting from high debt levels. We shall also give our outlook on the country’s debt sustainability given upcoming USD 2.0 bn Eurobond maturing in June 2024. The main question being, “Is Kenya debt level sustainable and what can the government do today to reduce the level of debt distress?” We shall cover the following:
- The Current State of Kenya’s Public Debt,
- Kenya’s Debt Servicing Cost,
- Economic Consequences of high Debt levels
- Kenya’s Debt sustainability analysis and projection, and,
- Conclusion and Recommendations.
Section 1: The Current State of Kenya’s Public Debt
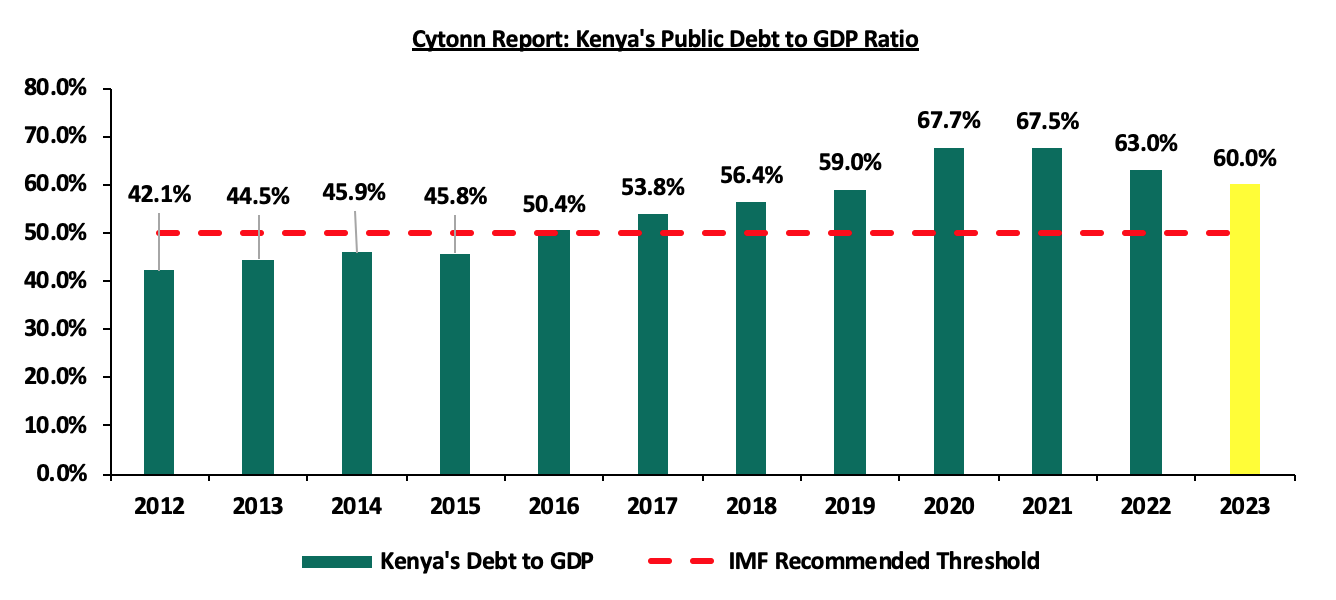
According to the National Treasury, Kenya’s Public Debt came in at Kshs 9.1 tn, (equivalent to 63.0% of GDP) as of December 2022, an 11.2% increase from the Kshs 8.2 tn (66.2% of GDP) recorded in December 2021. Additionally, the public debt to GDP is expected to slightly decline to 60.0% in 2023, on the back of the government’s continued focus on prioritizing the payment of debt obligations. However, we expect the government effort to be impeded by the deteriorated macroeconomic environment occasioned by the high inflationary pressures, aggressive currency depreciation, and slower economic growth which is expected to stifle revenue collection. Below is a graph highlighting the trend in the Kenya’s debt to GDP ratio:
Source: National Treasury
The debt levels have continued to grow due to the government continuously running budget deficits. The fiscal deficit has averaged 8.1% over the last ten years due to the focus on both development and recurrent expenditure. Both the revenue and expenditure has grown over the last ten years , however, the government expenditure has grown at a 10-year CAGR of 12.7% to Kshs 3.0 tn as at the end of FY’2021/2022, from Kshs 0.9 tn at the end of FY’2011/2012, while revenue has grown a slower pace of 10-year CAGR of 12.3% to Kshs 2.2 tn at the end of FY’2021/2022, from Kshs 0.7 tn at the end of FY’2011/2012. The chart below shows the growth in Kenya’s total revenue and expenditure in the last 10 financial years:
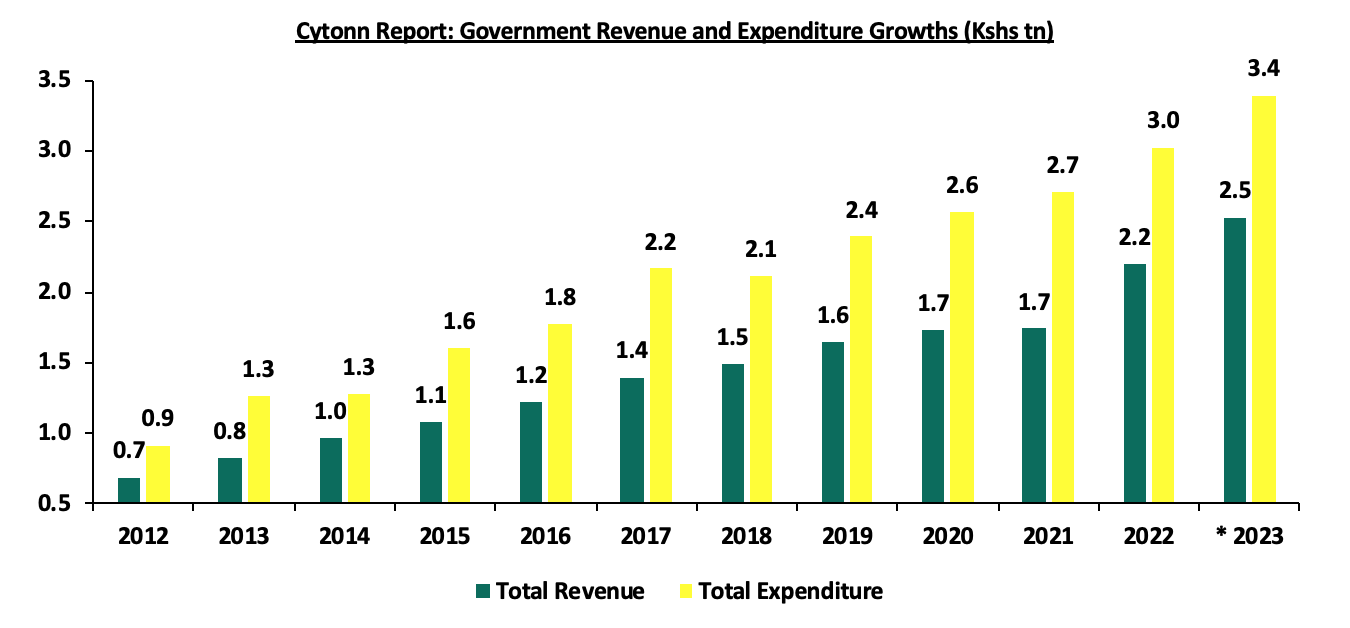
* Annualized for FY’2022/2023
Source: Central Bank of Kenya
- The Nature of Kenya’s Debt Composition (Domestic vs External)
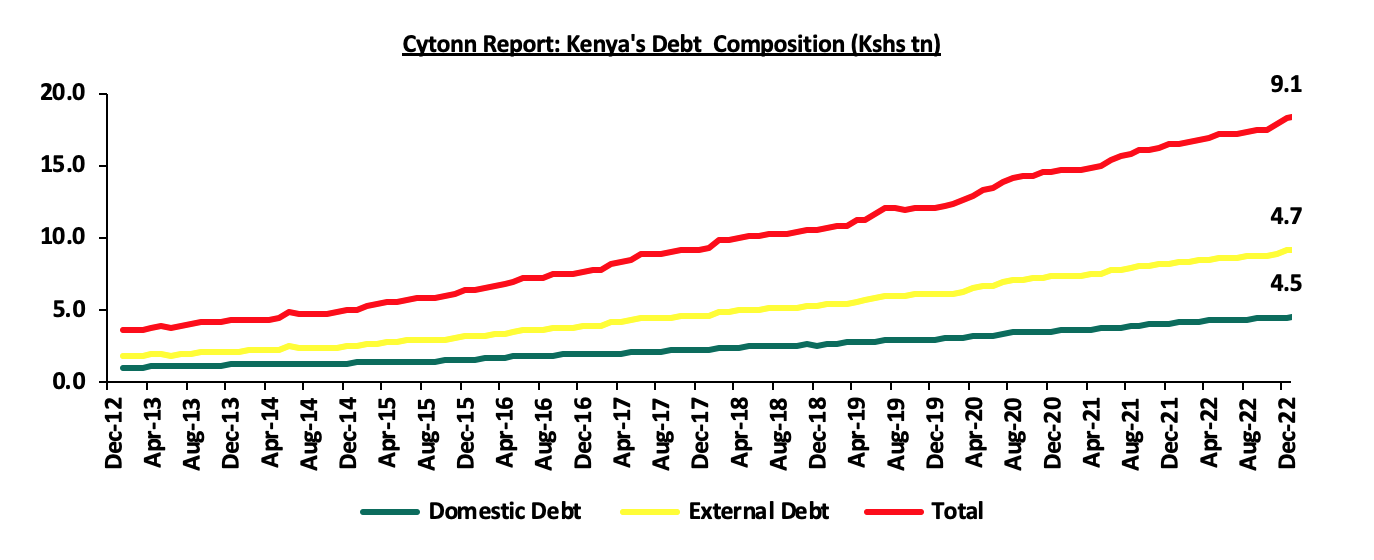
The country’s debt composition has averaged about 50.0% for both domestic to foreign debt. As at December 2022 the proportion of domestic to foreign debt stood at 48.9% to 51.1% compared to 54.2% to 45.8% in December 2012. The above has been necessitated by the need to balance against suffocating the private sector locally while not getting to much foreign exchange exposure. The external debt has increased at a higher of 10-year CAGR of 19.0% to Kshs 4.7 tn as at December 2022, from Kshs 0.8 tn in December 2012 while the domestic debt has increased at a lower 10-year CAGR of 16.5% to Kshs 4.5 tn as at December 2022 from Kshs 1.0 tn over the same period. Below is a graph highlighting the trend in the external and domestic debt composition over the last 10 years;
Source: National Treasury and Central Bank of Kenya
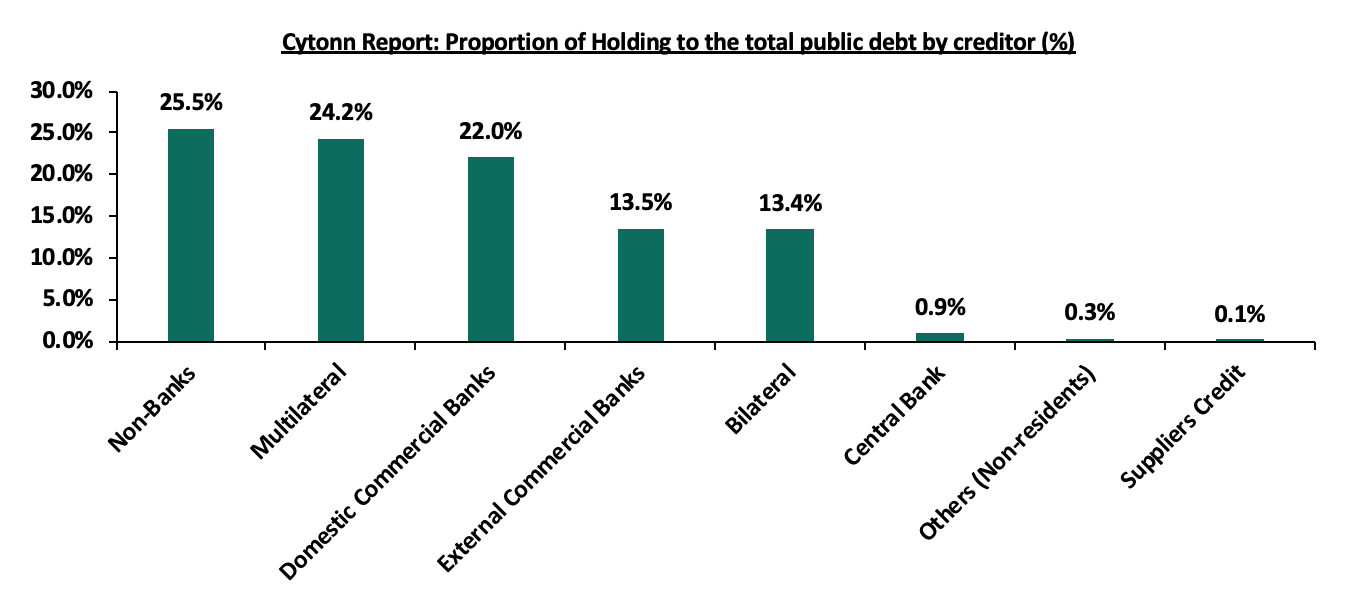
The holders of the Kenya’s public debt cut across various institutions banks and Non-Bank institutions (Pension funds, parastatals and insurance companies). The Non-Banks constituted the largest holding of 25.5%, while external supplier’s credit had the least holdings at 0.1%. Below is a graph showing the holders of the country’s cumulative public debt:
Source: Office of Controller of Budget
- Public Debt Mix by Holders
- External Debt Composition by Holders (Bilateral, Multilateral, and Commercial Banks)
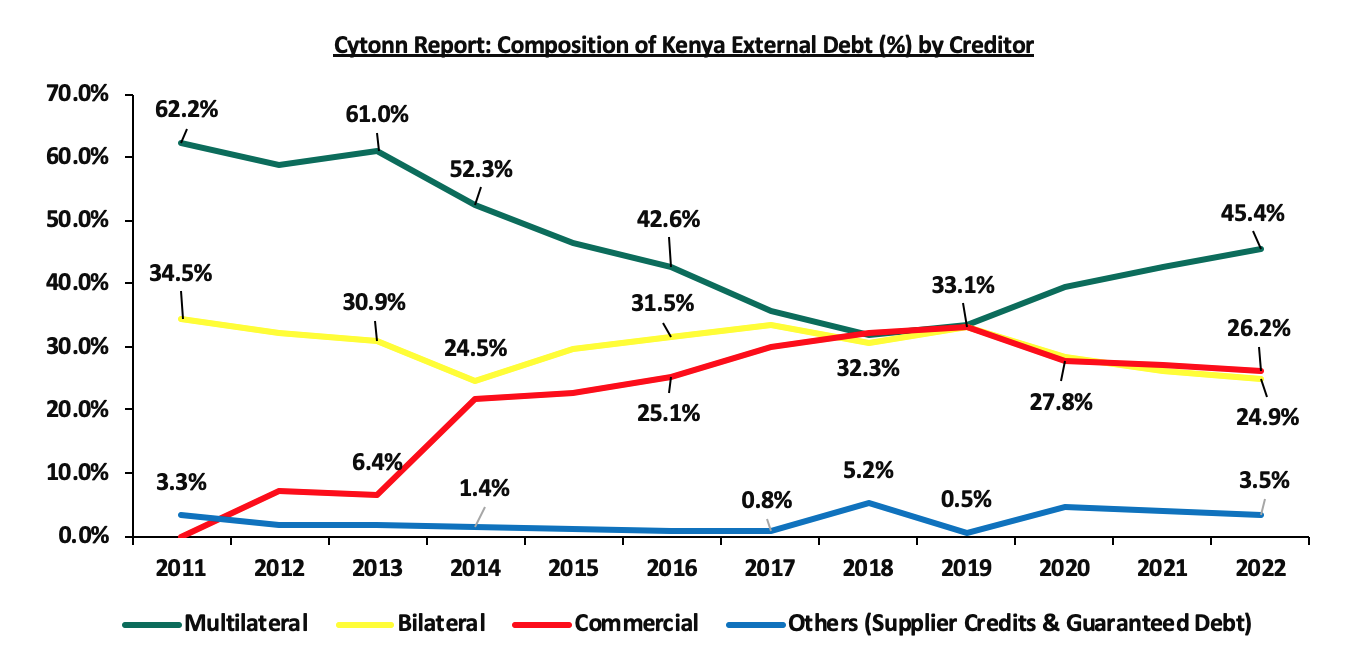
External debt comprises majorly of multilateral loans, bilateral loans and commercial loans. In FY’2021/2022, Kenya’s exposure to bilateral and multilateral loans was on the rise, attributable to favourable terms offered in terms of low interest rates and longer repayment periods. Notably, increased interest rates in the international finance market during the FY’2021/2022 made Eurobond (commercial borrowing) expensive. This was attributable to the heightened perceived risk stemming from economic uncertainties, due to the elevated global inflationary pressures as well as heightened debt sustainability concerns in most developing countries. As a result, (Bilateral and Multilateral) increased by 24.2% to Kshs 2.2 tn in December 2022, from Kshs 1.8 tn in December 2021, while commercial loans grew by 3.4% to Kshs 1.2 tn as at December 2022, from Kshs 1.1 tn as at December 2021. The chart below shows external debt composition by Creditors:
Source: National Treasury
It is key to note that:
- The portion of multilateral debt increased by 4.7% points to 47.4% in December 2022, from 42.7% in December 2021, due to loans worth USD 750 mn (Kshs 80.9 bn) under the Development Policy Operation (DPO) from the World Bank and a total of USD 683.0 (Kshs 83.8 bn) from the IMF under the Extended Credit Facility arrangement (EFF/ECF) for budgetary support, during the period. On the other hand, Bilateral debt decreased by 1.9% points to 24.3% in December 2022, from 26.2% in December 2021,
- Commercial debt as a percentage of external debt reduced by 2.4% points to 24.8% of total external debt in December 2022 from 27.2% in December 2021, mainly attributable to Kenya’s government shunning away from the more expensive debt due to the prevailing market conditions and,
- As of December 2022, 68.1% of the external debt was US Dollar denominated which is likely to continue contributing to the increasing debt servicing cost given the shilling’s continuous depreciation. The table below shows currency composition of the external debt stock:
|
Cytonn Report: Currency composition of the External Debt Stock (%) |
||
|
Currency |
December 2021 |
December 2022 |
|
USD |
67.0% |
68.1% |
|
EUR |
19.0% |
19.8% |
|
Yen |
6.0% |
4.2% |
|
Yuan |
6.0% |
5.4% |
|
GBP |
2.0% |
2.4% |
|
Other Currencies |
0.0% |
0.2% |
Source: National Treasury
- Domestic Debt Composition by Holders
Banking institutions account for the highest percentage of domestic debt in terms of government securities holdings at 47.1%, but this has been reducing as the exposure by pensions schemes have been on the rise. The percentage holding by banking institutions declined by 3.1% points to 47.1% in December 2022, from 50.2% in December 2021 due to increased lending by majority of the banks in Q4’2022, on the back of reduced credit risk as well as increased economic activities in the country as a result of improvement in the country’s business environment. Pension funds holdings on the other hand increased by 1.9% points to 33.3% in December 2022, from 31.4% in December 2021. Below is a table of the composition of government domestic debt by holders:
|
Cytonn Report: Composition of Government Domestic Debt by Holder |
|||||||||||
|
Domestic debt |
Dec-12 |
Dec-13 |
Dec-14 |
Dec-15 |
Dec-16 |
Dec-17 |
Dec-18 |
Dec-19 |
Dec-20 |
Dec-21 |
Dec-22 |
|
Banking institutions |
52.1% |
49.2% |
54.3% |
55.4% |
52.2% |
54.6% |
54.5% |
54.3% |
53.3% |
50.2% |
47.1% |
|
Insurance Companies |
10.5% |
10.2% |
9.9% |
8.4% |
7.3% |
6.4% |
6.1% |
6.4% |
6.4% |
6.8% |
7.4% |
|
Parastatals |
4.8% |
3.5% |
2.8% |
4.6% |
5.8% |
6.9% |
7.3% |
6.5% |
5.7% |
5.6% |
6.0% |
|
Pension Funds |
20.7% |
26.1% |
23.9% |
25.4% |
28.2% |
27.5% |
27.6% |
28.6% |
30.3% |
31.3% |
33.1% |
|
Other domestic investors |
11.9% |
11.0% |
9.0% |
6.2% |
6.5% |
4.6% |
4.6% |
4.2% |
4.3% |
6.1% |
6.4% |
|
TOTAL |
100.0% |
100.0% |
100.0% |
100.0% |
100.0% |
100.0% |
100.0% |
100.0% |
100.0% |
100.0% |
100.0% |
Source: Central Bank of Kenya
- GDP per Capita vs Debt per Capita
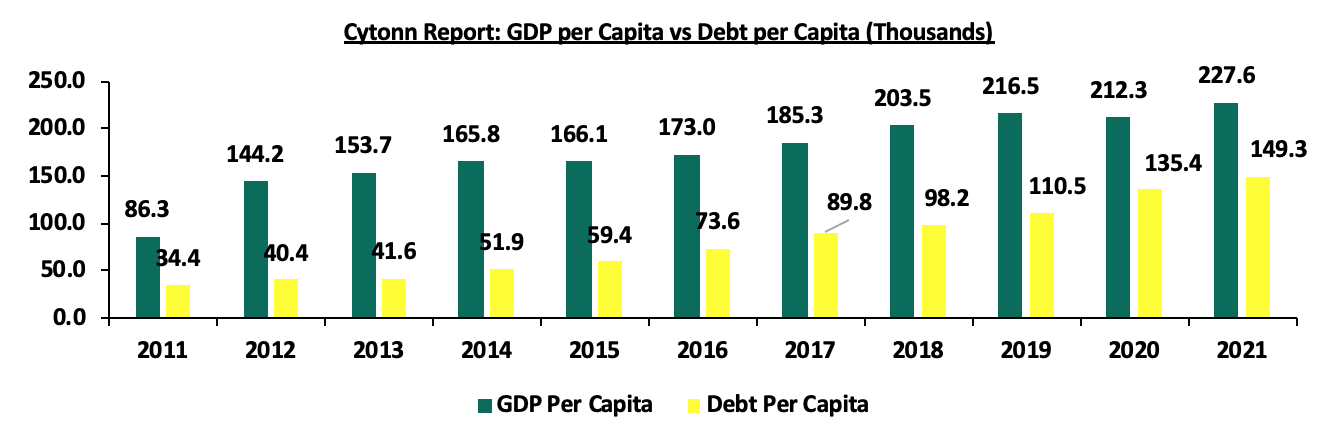
According to the World Bank, Kenya’s Public Debt per Capita has increased at a 10-year CAGR of 15.8% to Kshs 149,252.3 in 2021, from Kshs 34,400.0 in 2011. On the other hand, GDP per Capita has grown at a slower 10-year CAGR of 10.2% to Kshs 227,597.0 in 2021, from Kshs 86,300.0 in 2011, an indication that the debt being incurred is not translating into economic growth. The chart below compares Kenya’s GDP per capita to the debt per capita:
Source: World Bank and CBK
Factors that have accelerated the growth in Kenya’s Public debt;
- Fiscal Deficit – Kenya has witnessed a persistent fiscal deficit averaging at 8.1% of the GDP for the last 10 financial years and is projected to come down to 6.1% of the GDP at the end of FY’2022/2023. The controller of budget highlights in the Budget Implementation Review Report for H1’2022/2023 that the current approved budget stands at Kshs 4.2 tn against a targeted revenue collection of Kshs 2.1 tn, hence the need to borrow an additional Kshs 1.0 tn domestically as well as Kshs 349.3 bn of externally,
- Debt Servicing Costs – Debt servicing cost has increased over the years mainly due to the continuous accumulation of external debt and the depreciation of the currency. Consequently, the higher cost of debt servicing has continued to put further pressure on debt sustainability and the Kenyan shilling. To keep with the payments and to maintain some of the borrowing covenants we have seen the government continue to increase taxation as it tries to keep up with its debt obligation,
- Short falls of Revenue collections – Though there has been a significant growth in tax revenues, the Kenya Revenue Authority (KRA) has consistently fallen short on its tax revenue targets, which has been complemented by increased borrowing both locally and from externally to plug the budget deficits increasing the country’s debt profile over time, and,
- Guaranteed loans by the Government of Kenya – The total state corporations guaranteed loans by the government as at December 2022 was Kshs 164.6 bn. Such guaranteed loans put pressure on the need for excessive spending, despite poor performances by the state corporation, resulting in borrowing to finance the loans.
Section 2: Kenya’s Debt Servicing Cost
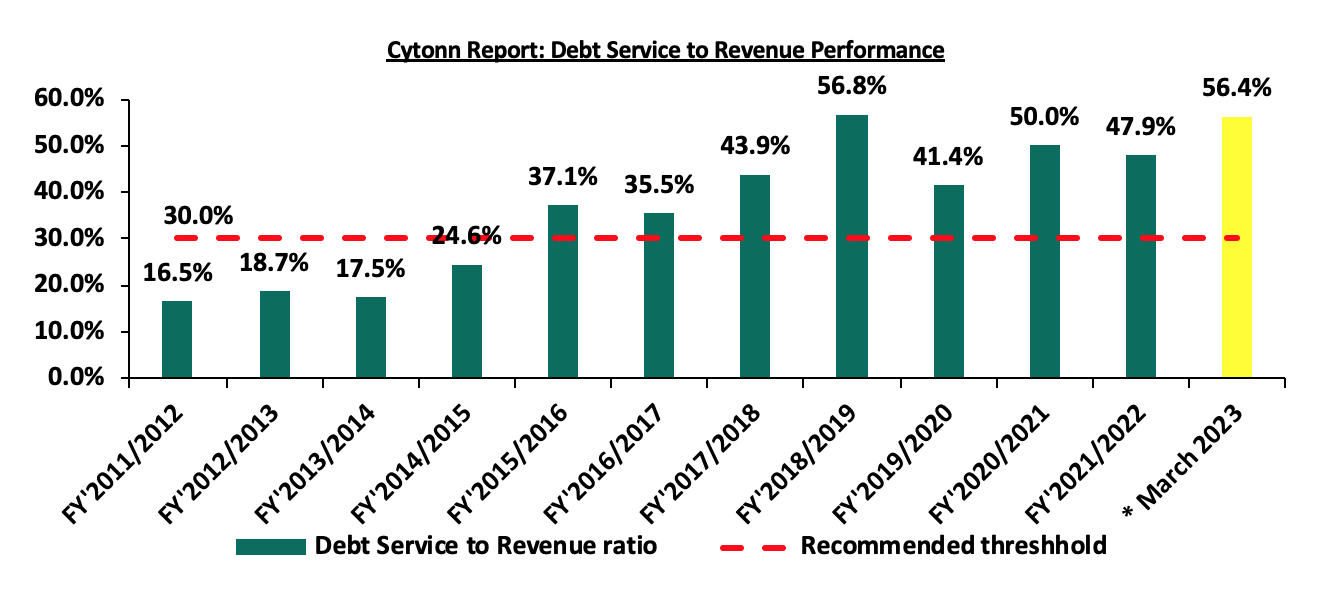
According to the National Treasury’s Annual Public Debt Management Report 2022, in FY’2021/2022, the total public debt service increased by 17.6% to Kshs 917.8 bn, from Kshs 780.6 bn in FY’2020/2021. Additionally, the debt service to revenue ratio was estimated at 47.9%, 17.9% points higher than IMF’s recommended threshold of 30.0%, but 2.1% points lower than 50.0% debt service to revenue ratio recorded in FY’2020/2021. The sustained high debt service to revenue ratio above the recommended threshold is a worrying sign. The debt servicing cost has continued to rise with the latest revenue and net expenditures for the nine months of FY’2022/2023, ending 31 March 2023, highlighting that debt servicing to total revenue stood at 56.4%. Below is a chart showing the debt service to revenue ratio for the last ten fiscal years:
Source: National Treasury
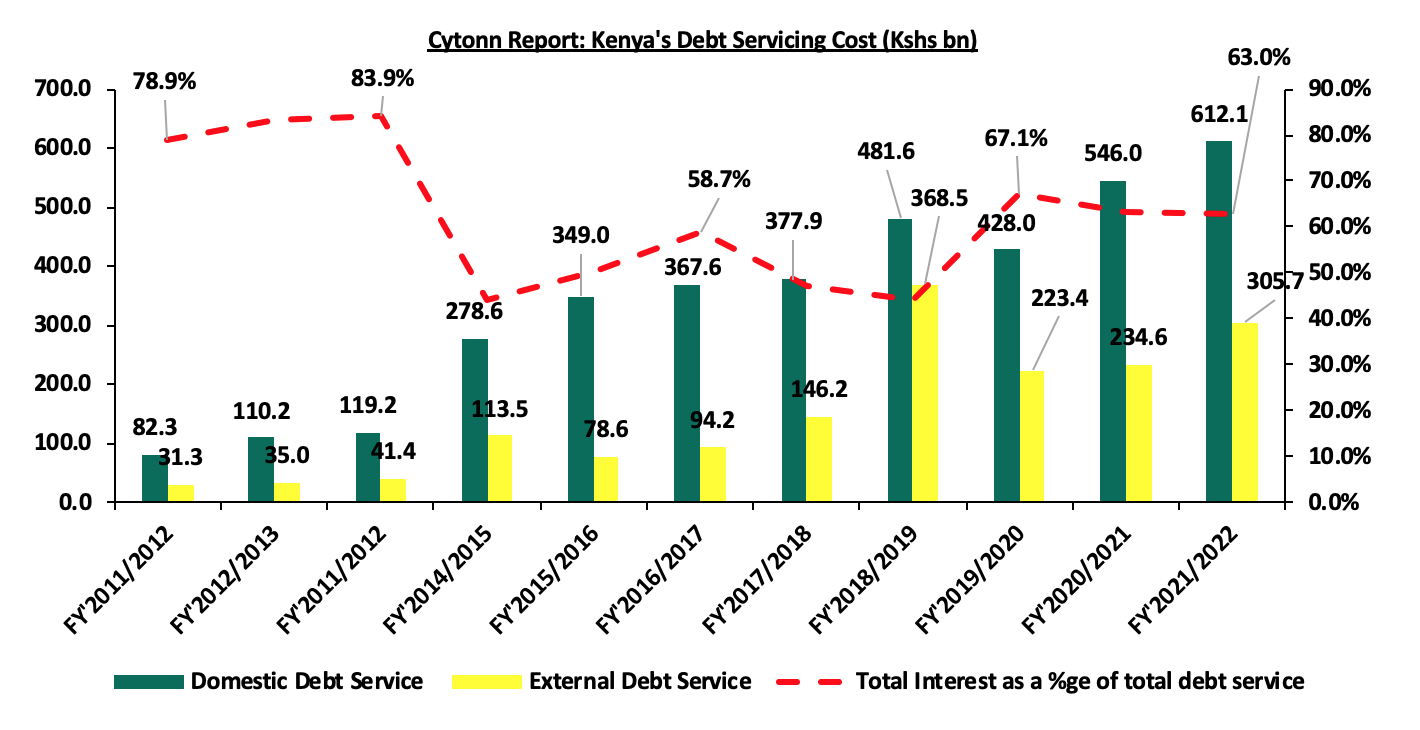
Kenya’s debt servicing costs have continued to increase over time growing at a 10-year CAGR of 23.2% to Kshs 917.8 bn in FY’2021/2022, from Kshs 113.6 bn in FY’2011/2012. The graph below compares the domestic debt servicing cost to the external debt servicing cost over the last ten fiscal years:
Source: National Treasury
The key take-outs from the chart include:
- Total debt service for the FY’2021/2022 stood at Kshs 917.8 bn, a 17.6% increase from Kshs 780.6 bn in FY’2020/2021. Domestic debt service remains the highest representing 66.7% of the total debt service while external debt service represented 33.3% in FY’2021/2022, and,
- Interest payments carry the bulk of Kenya’s debt servicing cost coming in at 63.0% in FY’2021/2022. Notably, for the domestic interest payments came in at Kshs 612.1 bn, while the external interest payment was Kshs 305.7 bn.
Section 3: Economic Consequences of High Debt Levels
The slowdown in economic growth on the back of geopolitical tensions, supply chain constraints, subdued business environment and elevated inflationary pressures have forced majority of the developing countries including Kenya to borrow more in order to cushion their economies. However, continued increase in borrowing has led to high accumulated debt level, with the following being some of the consequences on the Kenyan economy;
- High Cost of Debt Servicing - Elevated cost of debt servicing due to debt obligations in foreign currencies given the weakening local Currency, resulting to increased taxation as the government tries to meet its debt obligations,
- Elevated Cost of New Borrowings – High debt levels are likely to lead to increased cost of additional borrowing as lenders demand higher rates for new debts considering the heightened risk of debt distress which stifles the private sector and economic growth,
- Limited Fiscal Space –High debt levels in most cases lead to a narrow fiscal space hence reduced resources for undertaking further infrastructure and capital expenditure, and,
- Crowding Out of the Private Sector - Because of the increased domestic borrowing, the government crowds out the private sector which leads to a subdued private sector, subsequently impacting revenue collections.
Section 4: Kenya’s Debt sustainability analysis and outlook
As seen in the above section, the country’s risk of debt distress is extremely high as evidenced by the high debt service to revenue ratio of 47.9%. Additionally, Kenya’s debt to GDP ratio stood at 63.0% in 2022, 13.0% points above IMF’s recommended threshold of 50.0% for developing countries. We note that the growth of Public Debt at a 10-year CAGR of 17.7% to Kshs 9.1 tn in December 2022, has outpaced economic growth that has averaged at 4.5% for the last 10 years, with the International Monetary Fund (IMF) expecting Kenya’s 2022 GDP growth to come in at 5.4%. This points towards a high risk of debt distress as revenue alone might not be sufficient to service the accumulated public debt. The fiscal deficits resulting from the revenue-expenditure mismatch have also presented an ever present challenge in fiscal consolidation as revenue continues to lag behind expenditure.
Further, the recent downgrades by both Fitch and S&P credit agencies on the back of tightened liquidity and surging debt profiles affirms concerns that the level of borrowing needs a fresh relook. The downgrades of Kenya’s credit score by both Fitch and S&P Global have dimmed the country’s ability to access cheaper loans in the international financial markets despite upcoming debt maturities especially for the 2014 Eurobond issue. On 24 February 2023, S&P Global downgraded Kenya’s credit outlook to negative from stable, while Fitch Ratings on 14 December 2022, downgraded the country’s Long Term Foreign Currency issuer default ratings. Below is a summary of the credit rating on Kenya by various rating agencies:
|
Cytonn Report: Kenya Credit Rating Agencies Ratings |
||||
|
Rating Agency |
Previous Rating |
Current Rating |
Current Outlook |
Date Released |
|
Fitch Ratings |
B+ |
B |
Stable |
14th December 2022 |
|
S&P Global |
B |
B |
Negative |
24th February 2023 |
Source: Fitch Ratings, S&P Global
With the current macro-economic environment, the government’s ambition of projecting an increase in the revenue collection may not bear fruits hence the need for continuous borrowing is inevitable. The table below gives the trend of both expenditure and revenue growths in the last five financial years and projections in the medium term;
|
Cytonn Report: Public Debt (Kshs tn) |
|||||||
|
FY'2017/18 |
FY'2018/19 |
FY'2019/20 |
FY'2020/21 |
FY'2021/22 |
FY2022/23 |
FY2023/2024 |
|
|
Cumulative Domestic Debt |
2.5 |
2.8 |
3.2 |
3.7 |
4.3 |
4.7 |
5.2 |
|
Cumulative External Debt |
2.6 |
3.0 |
3.5 |
4.0 |
4.3 |
4.7 |
4.9 |
|
Total |
5.0 |
5.8 |
6.7 |
7.7 |
8.6 |
9.4 |
10.1 |
|
Expenditure |
2.1 |
2.4 |
2.6 |
2.8 |
3.0 |
3.4 |
3.7 |
|
Revenue Collected |
1.5 |
1.7 |
1.7 |
1.8 |
2.2 |
2.5 |
2.9 |
|
Budget Deficit |
0.6 |
0.7 |
0.8 |
1.0 |
0.8 |
0.9 |
0.8 |
|
Domestic Borrowings |
0.3 |
0.3 |
0.5 |
0.6 |
0.6 |
0.4 |
0.5 |
|
External Borrowings |
0.4 |
0.4 |
0.3 |
0.3 |
0.1 |
0.4 |
0.2 |
|
Total |
0.6 |
0.7 |
0.8 |
1.0 |
0.7 |
0.8 |
0.7 |
|
Domestic debt service |
0.4 |
0.5 |
0.4 |
0.5 |
0.6 |
0.8 |
0.8 |
|
External debt Service |
0.2 |
0.4 |
0.2 |
0.2 |
0.3 |
0.4 |
0.6 |
|
Total Debt Service |
0.6 |
0.9 |
0.7 |
0.8 |
0.9 |
1.2 |
1.5 |
|
Debt service to Revenue |
39.2% |
50.0% |
37.5% |
43.3% |
41.7% |
47.1% |
50.8% |
Source: National Treasury (Annual Public Debt Management Report and Budget Policy Statement)
Key take outs;
- Debt servicing costs is expected to remain high in the FY’2023/2024 due to the need for more borrowings at high cost. The high borrowings are to go towards, debt repayment, financing the increasing fiscal deficit as KRA lags behind target and increased debt repayment due to a depreciating currency
Our View: Despite debt service projected to grow albeit at a slower rate in FY’2022/2023 and FY’2023/2024, we expect the debt servicing cost will remain high due to upcoming Eurobond maturity worth USD 2.0 bn and continued local debt maturities,
- Revenue is expected to grow at a 5-year CAGR of 11.2% to Kshs 2.9 tn by the end of FY’2023/2024, from Kshs 1.7 tn in FY’2018/2019, attributable to the governments focus to increased tax revenues. However, given the subdued business environment, coupled with elevated inflationary pressures and tightened liquidity in the country, revenue collections are expected to fall short of the projection. As a result, revenue collection is largely pegged on economic performance of the country as well as how soon the general business environment will improve,
- Expenditure is expected to grow at a relatively slower 5-year CAGR of 8.5% to Kshs 3.7 tn by the end of FY’2023/2024, from 2.4 tn recorded in FY’2018/2019, on the back of increased recurrent expenditure, accelerated currency depreciation and persistent current account deficit, and,
- The budget deficit is expected to widen in the projected years due to a mismatch in revenue against expenditure growths despite revenue projected to increase at a faster rate compared to expenditure. The persistent budget deficit in the projected financial years, is an indication of the need for further borrowing. This will impede the government’s effort to try and sustain the current debt level.
It is clear that the government faces challenges on how they shall finance their operations in the next couple of months as the debt servicing is high and the economic activity is much slower. The KRA collection in the first nine months of the FY’2022/2023, lagged behind with the government having collected Kshs 1.4 tn (equivalent to 88.1% prorated revenue target of Kshs 1.6 tn) as the end of March 2023, mainly on the back of the tough macroeconomic situation in the country. The situation is exacerbated by the tightened liquidity that currently stands at 8.5% in the local market as of 14th April 2023 amidst the deteriorated business environment. Additionally, despite the government’s announcement to cut down expenditure by Kshs 300.0 bn in FY’2022/2023, currently, a total of Kshs 2.1 tn had been spent as at March 2023, surpassing the Kshs 1.4 revenue collected. Further, the weakening of the Kenyan shilling has increased the cost of repaying foreign loans. As a result, concerns remain high on the government’s ability to repay its upcoming maturities as well as to sufficiently pay its debt obligations.
Section 5: Conclusions and Recommendations
Despite the heightened debt sustainability concerns, we commend the government on the continuous efforts to boost revenue collection but we believe a lot needs to be done. Below are some actionable steps that the government can take to reduce the debt overhang as well as mitigate the risk of debt distress;
- Enhance Fiscal Consolidation – High fiscal deficit is attributable to higher growth in expenditure volumes relative to revenue collections, creating the need for excessive borrowing levels. The government needs to implement robust fiscal consolidation through expenditure reduction by introducing austerity measures and limit capital expenditure to projects with either high social impact or have a high Economic Rate of Return (ERR), and high economic benefits outweighing costs,
- Promote Capital Markets - The government should channel efforts towards strengthening the Capital Markets structure to ease the pooling of funds by investors to undertake development projects. Key to note, Kenya’s capital market remains underfunded and overshadowed with banking markets having mobilized Kshs 4.4 tn in deposits compared to Collective Investment Schemes at only Kshs 0.2 tn as at September 2022, hence the need to increase support to the sector,
- Reduce the recurrent expenditure - Currently, the mix of recurrent to development expenditure in Kenya is 76:24 as at December 2022. There is need to reduce the portion of recurrent expenditure, which majorly encompasses public wages. This will in effect reduce the overall expenditure basket, freeing up the debt level.
- Improving the Country’s Exports – The government should formulate export and manufacturing favorable policies to improve the current account. This would stabilize the exchange rate and stop our foreign denominated debt from increasing as the shilling depreciates,
- Implementation of Private Public Partnerships (PPPs) – The government should fully implement Private Public Partnerships (PPPs) and joint ventures to attract more private sector involvement in funding development projects such as infrastructure, and thus reduce the need for borrowing
- Better governance and accountability – Better governance will help to reduce wastage and corruption levels that had impeded proper allocation of funds towards designated projects, resulting in misappropriation of funds, and,
- Privatization of State Parastatals - The government should privatize poorly performing parastatals as discussed in our Cytonn Weekly #12/2023 to release capital, lower debt and also to prevent the widening of debt from losses and inefficiencies.
Disclaimer: The views expressed in this publication are those of the writers where particulars are not warranted. This publication, which is in compliance with Section 2 of the Capital Markets Authority Act Cap 485A, is meant for general information only and is not a warranty, representation, advice or solicitation of any nature. Readers are advised in all circumstances to seek the advice of a registered investment advisor.

- Talk to us
- Kenya
- P.O Box 20695 - 00200, Nairobi, Kenya
- Cell +254709101200
- Tel +254709101200
- WhatsApp +254741676635
- United States
- +254709101200
- DOWNLOAD OUR APP
-


- Kenya
- 8th Floor, Pinetree Plaza, Kaburu Drive, Ngong Road, Nairobi, Kenya
- USA
- Suite 1150, 1775 Eye Street NW, USA, Washington DC 20006, USA
- Investments
- High Yield
- Private Equity
- Real Estate
- Real Estate
- RiverRun Estates
- Cytonn Towers
- The Ridge
- Taraji Heights
- The Alma