Mombasa Real Estate Investment Opportunity August 2018, & Cytonn Weekly #34/2018
By Cytonn Research Team, Sep 9, 2018
Executive Summary
Fixed Income
T-bills were oversubscribed during the week, with the overall subscription rate coming in at 148.7%, down from 176.1% recorded the previous week. Yields on the 91-day, 182-day and 364-day papers declined by 0.1% points to 7.6%, 8.9% and 9.8%, respectively, from 7.7%, 9.0% and 9.9% recorded the previous week. According to the Stanbic Bank’s Monthly Purchasing Manager’s Index (PMI), the business environment in the country expanded at a marked pace in August 2018. The seasonally adjusted PMI recovered to record an improvement to 54.6 in August, from a 6-month low of 53.6 in July. A PMI reading of above 50 indicates improvements in the business environment, while a reading below 50 indicates a worsening outlook;
Equities
During the week, the equities market was on a downward trend with NASI, NSE 20 and NSE 25 declining by 2.3%, 3.2% and 2.7%, respectively. For the last twelve months (LTM), NASI, NSE 20 and NSE 25 have declined by 3.0%, 23.5% and 7.2%, respectively. Equity Group plans to roll out an e-commerce money transfer and payments platform that will serve its customers across the region, through its subsidiary, Finserve;
Private Equity
In the Financial Technology (FinTech) sector, Paystack Payments Limited, a Nigeria-based FinTech company that processes payments for businesses in Africa, has raised USD 8.0 mn (Kshs 806.3 mn) in Series A funding. The round of funding was led by Stripe, an American online payment processing company, and also included funding from Visa Incorporated, a global payments technology company. The investment is expected to facilitate the expansion of Paystack across Africa and the scaling up of its engineering team. In the education sector, half-year financial results released by Advtech Group, a private education provider listed on the Johannesburg Stock Exchange, indicate that the company acquired 71.0% of Makini School Limited for a consideration of ZAR 130.8 mn (Kshs 1.0 bn). Makini School Limited was acquired through a Joint Venture between Schole (Mauritius) Limited, a subsidiary of Schole Limited which is a London-based education provider, Caerus Capital, a leading international education consultancy group, and Advtech Group in May 2018;
Real Estate
During the week, Kiloran Development Group, a UK based developer and ALL Design, a British architectural firm, announced plans to build a Mixed-Use Development (MUD) named ‘’The Beacon’’, which consists of retail and Grade A office space in Nairobi, off Uhuru Highway towards Bunyala Road roundabout. Elsewhere, Emperor Plaza, a family-owned commercial building located in Nairobi CBD, is set for sale at Kshs 750 mn, exclusive of purchase costs and VAT;
Focus of the Week
In line with our regional expansion strategy, we continue to assess investment opportunities in various Kenyan Counties. In 2018, we have released the Kisumu Real Estate Investment Opportunity and the Nakuru Real Estate Investment Opportunity topicals in July and August, respectively. This week, we turn our focus to the real estate investment opportunity in Mombasa County, where the real estate market recorded average rental yields of 6.2% in 2018, with the residential sector recording total returns of 7.2% (rental yields of 5.1% and capital appreciation of 2.1%), whereas the retail and office sectors attained yields of 8.3% and 5.1%, respectively. The land sector registered an annualized capital appreciation of 12.6%. From our research, the investment opportunity in Mombasa County is in the retail sector in select undersupplied areas such as Tudor and Kizingo, as well as in site and service land schemes supported by the ongoing infrastructural improvements.
- Elizabeth N. Nkukuu, CFA, Chief Investments Officer, was on Citizen. T.V to discuss the new fuel tax in Kenya. Watch Elizabeth here
- Maurice Oduor, the Principal Officer of Cytonn Asset Managers Ltd, was on Citizen T.V to discuss the 16.0% VAT on petroleum products. Watch Maurice here
- Daniel Mainye, Technology Business Manager, was on KBC Channel 1 to discuss the hike in fuel charges. See Daniel here
- Derrick Keiya, Assistant Investments Analyst was on Njata T.V to discuss the impact of the hike in fuel prices on the economy. Watch Derrick here
- Nancy Murule, Senior Research Analyst was on Ebru T.V to discuss the Cytonn Retail Report 2018. Watch Nancy here
- We continue to hold weekly workshops and site visits on how to build wealth through real estate investments. The weekly workshops and site visits target both investors looking to invest in real estate directly and those interested in high yield investment products to familiarize themselves with how we support our high yields. Watch progress videos and pictures of The Alma, Amara Ridge, The Ridge, and Taraji Heights. Key to note is that our cost of capital is priced off the loan markets, where all-in pricing ranges from 16.0% to 20.0%, and our yield on real estate developments ranges from 23.0% to 25.0%, hence our top-line gross spread is about 6.0%. If interested in attending the site visits, kindly register here
- We continue to see very strong interest in our weekly Private Wealth Management Training (largely covering financial planning and structured products). The training is at no cost and is open only to pre-screened participants. We also continue to see institutions and investment groups interested in the training for their teams. The Wealth Management Training is run by the Cytonn Foundation under its financial literacy pillar. If interested in our Private Wealth Management Training for your employees or investment group please get in touch with us through wmt@cytonn.com. To view the Wealth Management Training topics, click here
- For recent news about the company, see our news section here
- We have 10 investment-ready projects, offering attractive development and buyer targeted returns of around 23.0% to 25.0% p.a. See further details here: Summary of Investment-Ready Projects
- We continue to beef up the team with ongoing hires for IT Network Engineer and Unit Managers- Mt. Kenya Region. Visit the Careers section on our website to apply
- Cytonn Real Estate is looking for a 0.75-acre land parcel for a joint venture in any of the following areas, Lavington, Loresho (near Loresho Shopping Centre and its environs), Spring Valley Shopping Centre and its environs, Redhill Road (should be between Limuru Road Junction and Westlands Link Road), Lower Kabete Road (between Ngecha Road Junction and UON Campus), and Karen. The parcel should be in a good location with frontage to a tarmac road. For more information or leads, email us at rdo@cytonn.com
T-Bills & T-Bonds Primary Auction:
T-bills were oversubscribed during the week, with the overall subscription rate coming in at 148.7%, down from 176.1% recorded the previous week, due to improved liquidity in the money market. Yields on the 91-day, 182-day and 364-day papers declined by 0.1% points to 7.6%, 8.9% and 9.8%, respectively, from 7.7%, 9.0% and 9.9% recorded the previous week. The acceptance rate for T-bills declined to 76.7%, from 77.8% recorded the previous week, with the government accepting a total of Kshs 27.4 bn of the Kshs 35.7 bn worth of bids received. The subscription rate for the 182-day paper improved to 126.1% from 90.0%, the previous week while the subscription rate for the 91-day and 364-day papers declined to 64.0% and 205.1% from 289.6% and 216.9%, the previous week, respectively, with investors’ participation remaining skewed towards the longer dated paper attributed to the scarcity of newer short-term bonds in the primary market.
Liquidity:
The average interbank rate declined to 5.5%, from 5.8% the previous week, while the average volumes traded in the interbank market declined by 41.7% to Kshs 13.1 bn, from Kshs 22.5 bn the previous week. The decline in the average interbank rate points to improved liquidity, which the Central Bank of Kenya attributed to increased government payments extending from the end of August.
Kenya Eurobonds:
According to Bloomberg, the yield on the 10-Year Eurobond issued in 2014 increased by 0.2% points to 7.4% from 7.2% the previous week, while the yield on the 5-year Eurobond declined by 0.1% points to 4.8%, from 4.9% the previous week. Since the mid-January 2016 peak, yields on the Kenya Eurobonds have declined by 4.0% points and 2.3% points for the 5-year and 10-year Eurobonds, respectively, an indication of the relatively stable macroeconomic conditions in the country. Key to note is that these bonds have 0.8 years and 5.8-years to maturity for the 5-year and 10-year, respectively.
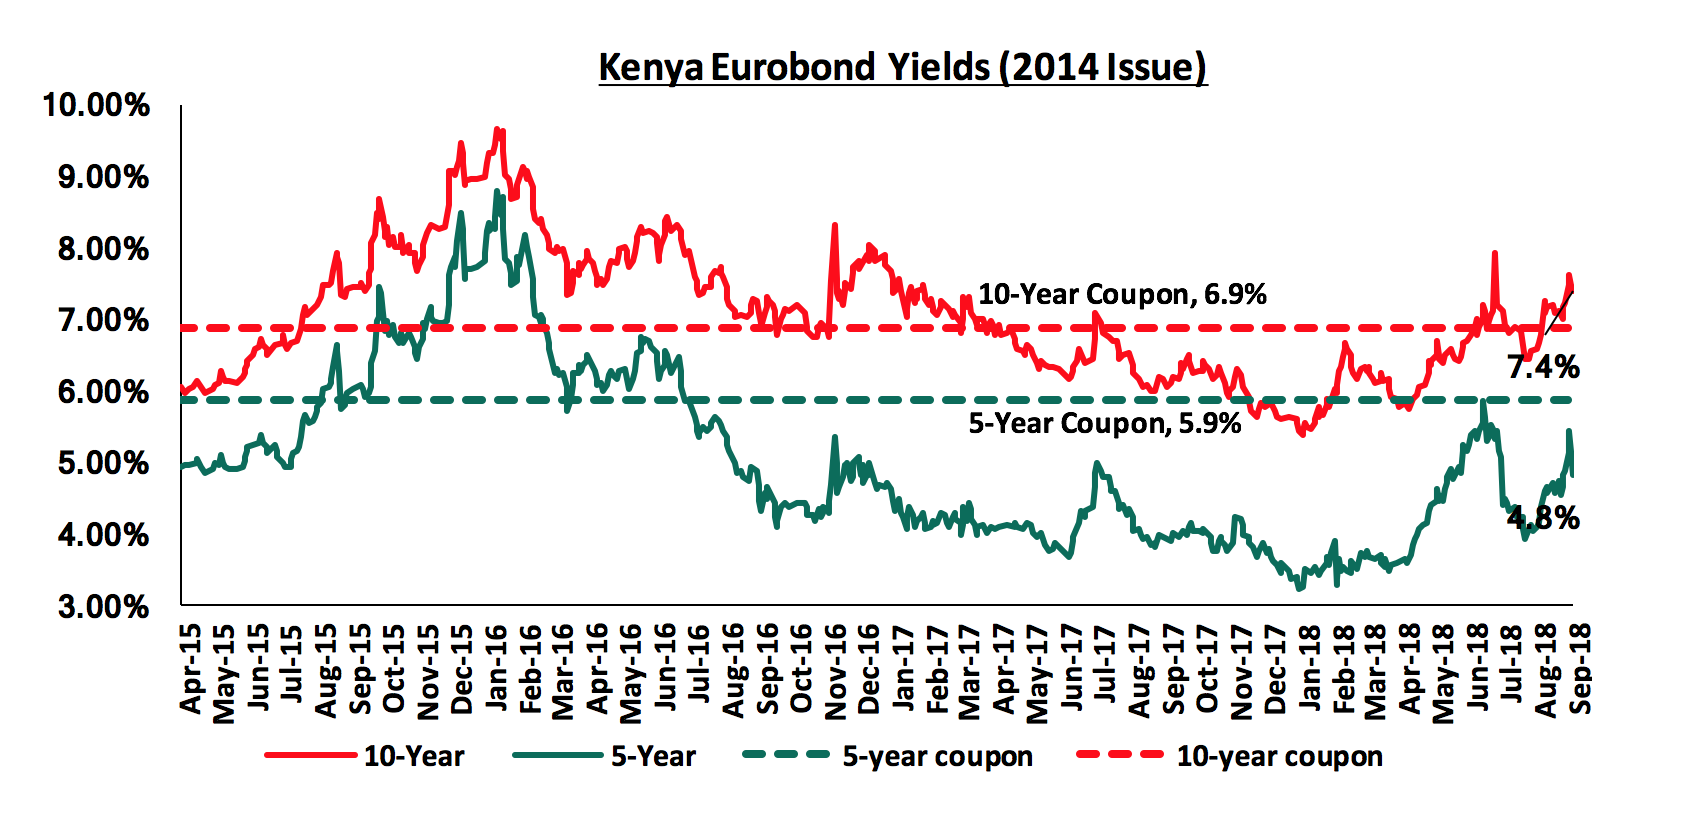
For the February 2018 Eurobond issue, during the week, the yields on the 10-year and 30-year Eurobonds increased by 0.2% points and 0.3% points to 8.1% and 9.1% from 7.9% and 8.8% the previous week, respectively. Since the issue date, the yields on the 10-year and 30-year Eurobonds have both increased by 0.8% points.

The Kenya Shilling:
During the week, the Kenya Shilling declined marginally against the US dollar to close at Kshs 100.7, from Kshs 100.6 the previous week, supported by dollar inflows from Non-Governmental Organization’s (NGO’s) and the Information Technology (IT) sector. The Kenya Shilling has appreciated by 2.4% year to date and in our view the shilling should remain relatively stable against the dollar in the short term, supported by:
- The narrowing of the current account deficit to 5.8% in the 12-months to June 2018, from 6.3% in March 2018, attributed to improved agriculture exports, and lower capital goods imports following the completion of Phase I of the Standard Gauge Railway (SGR) project,
- Stronger inflows from principal exports, which include coffee, tea, and horticulture, which increased by 10.8% during the month of May to Kshs 24.3 bn from Kshs 21.9 bn in April, with the exports from coffee, tea and horticulture improving by 11.0%, 19.1% and 2.0% m/m, respectively,
- Improving diaspora remittances, which increased by 71.9% y/y to USD 266.2 mn in June 2018 from USD 154.9 mn in June 2017 and by 4.9% m/m, from USD 253.7 mn in May 2018, with the largest contributor being North America at USD 130.1 mn attributed to; (a) recovery of the global economy, (b) increased uptake of financial products by the diaspora due to financial services firms, particularly banks, targeting the diaspora, and (c) new partnerships between international money remittance providers and local commercial banks making the process more convenient, and,
- High forex reserves, currently at USD 5.7 bn (equivalent to 8.6 months of import cover).
Highlights of the Week:
Following the reporting by all fund managers, we analyzed the performance of all unit trust funds for the first half of 2018, and the following were the key highlights:
- The Total Assets Under Management (“AUM”) held by Unit Trust Fund Managers grew very slightly, by 0.3%, to Kshs 55.2 bn in H1’2018 from Kshs 55.1 bn recorded in H1’2017; this indicates that the Unit Trust market is not growing,
- The AUM for Money Market Funds grew by 2.1% to Kshs 44.5 bn in H1’2018 from Kshs 43.6 bn recorded in H1’2017; this shows that Money Market Funds are growing faster than the overall market,
- CIC Asset Managers recorded the strongest growth in AUM of 21.4%, to Kshs 15.8 bn in H1’2018 from Kshs 13.0 bn in H1’2017,
- Sanlam Investments declined the most by 34.6% to Kshs 2.0 bn in H1’2018 from Kshs 3.0 bn in H1’2017,
- CIC Asset Managers remains the largest overall Unit Trust Fund Manager with a market share at 28.7% in H1’2018, up from 23.7% in H1’2017, and,
- Highest yielding money market fund as of September 6th was Seriani Money Market Fund, yielding 11.62%.
According to the Stanbic Bank’s Monthly Purchasing Manager’s Index (PMI), the business environment in the country expanded at a marked pace in August 2018. The seasonally adjusted PMI recovered to 54.6 in August from a 6-month low of 53.6 in July. A PMI reading of above 50 indicates improvements in the business environment, while a reading below 50 indicates a worsening outlook. Firms reported growth in value of outputs due to the continued rise in new orders, which rose for the 9th consecutive month. This was despite high input costs attributed to raw material shortages. In response to increased output requirements, firms also raised their staffing levels during the month though at a modest rate. The private sector has remained resilient as the PMI is still above 50; we however expect the private sector to experience increased input costs going forward should the 16.0% VAT on petroleum products be maintained.
The Energy Regulatory Commission (ERC) released an addendum to readjust the maximum pump prices upwards effective 1st September to 14th September. This was prompted by the imposition of the VAT on petroleum products that was enforced from 1st September despite the National Assembly voting unanimously to further postpone it for another 2-years to September 2020. The VAT on fuel was initially introduced through the VAT Act 2013, with a grace period of 3-years to be implemented in September 2016. It was further postponed for another 2-years through the Finance Bill 2016 and was supposed to take effect in September 2018. As per the letter of intent to the IMF by the National Treasury, dated 18th January 2016, the imposition of the charge was part of the commitments Kenya had made to the International Monetary Fund (IMF) aimed at reducing the country’s fiscal deficit through increased revenue collections. With the readjustments, taking into account the 16.0% VAT charge, Super Petrol, Diesel and Kerosene prices have gone up by 12.4%, 12.0% and 14.7%, respectively to Kshs 127.8, Kshs 115.1 and Kshs 97.4 from the earlier published prices on 14th August where Super Petrol, Diesel and Kerosene prices were retailing at a maximum price of Kshs 113.7, Kshs 102.7 and Kshs 85.0, respectively. The President is yet to assent to the National’s Assembly’s proposal of postponing the charge. With the VAT charge in place, we expect inflation to rise in H2’2018, as increased fuel prices will have a ripple effect on all the sectors of the economy, with the transport index, which has a CPI weighting of 8.7%, housing, water, electricity, gas and other fuels with a CPI weighting of 18.3% being affected directly as evidenced by public transport costs, which have already gone up by up to 25.0% since the fuel prices readjustment.
Rates in the fixed income market have been on a declining trend, as the government continues to reject expensive bids as it is currently 38.3% ahead of its pro-rated borrowing target for the current financial year, having borrowed Kshs 79.6 bn against a prorated target of Kshs 57.5 bn. The 2018/19 budget had given a domestic borrowing target of Kshs 271.9 bn, 8.6% lower than the 2017/2018 fiscal year’s target of Kshs 297.6 bn, which may result in reduced pressure on domestic borrowing. With the rate cap still in place, and the national assembly having voted to retain it, now awaiting presidential assent to become law, we maintain our expectation of stability in the interest rate environment. With the expectation of a relatively stable interest rate environment, our view is that investors should be biased towards medium-term fixed-income instruments.
Market Performance:
During the week, the equities market was on a downward trend with NASI, NSE 20 and NSE 25 declining by 2.3%, 3.2% and 2.7%, respectively, taking their YTD performance to (4.4%), (16.5%) and (2.7%) for NASI, NSE 20 and NSE 25, respectively. This week’s performance was driven by declines in large cap stocks such as Safaricom and KCB Group, which declined by 5.2% and 5.0%, respectively. Banking sector counters also posted declines, with NIC Group and Equity Group both declining by 1.7%, while Diamond Trust Bank and Standard Chartered declined by 1.1% and 1.0%, respectively. For the last twelve months (LTM), NASI, NSE 20 and NSE 25 have declined by 3.0%, 23.5% and 7.2%, respectively.
Equities turnover decreased by 8.6% to USD 24.5 mn, from USD 26.8 mn the previous week, taking the YTD turnover to USD 1.3 bn. Foreign investors remained net sellers during the week, with a net selling position of USD 5.4 mn. We expect the market to remain supported by positive investor sentiment this year, as investors take advantage of the attractive stock valuations in select counters.
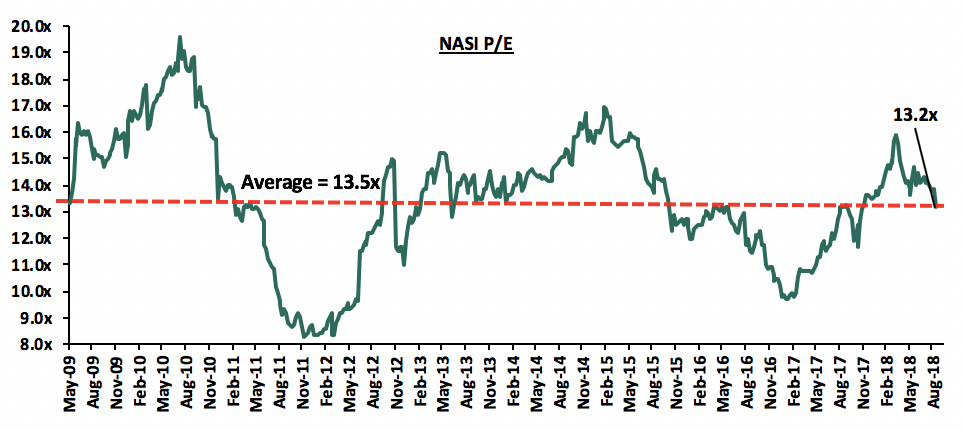
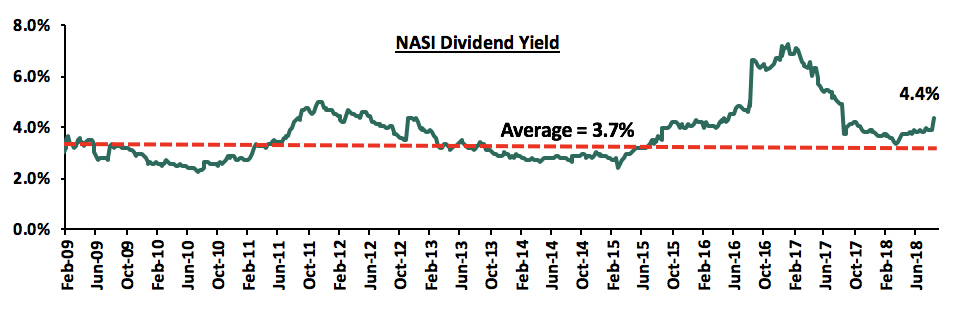
The market is currently trading at a price to earnings ratio (P/E) of 13.2x, which is 2.5% below the historical average of 13.5x, and a dividend yield of 4.4%, higher than the historical average of 3.7%. The current P/E valuation of 13.2x is 34.3% above the most recent trough valuation of 9.8x experienced in the first week of February 2017, and 58.6% above the previous trough valuation of 8.3x experienced in December 2011. The charts below indicate the historical P/E and dividend yields of the market.
Highlights of the Week:
Legislators have rejected amendments to the Finance Bill (2018) that would have required commercial banks to increase their minimum core capital to Kshs 5.0 bn, from Kshs 1.0 bn, over the next 4-years. The Bill would have required banks to increase core capital in three phases over the 4-years: (i) to a minimum of Kshs 2.0 bn by December 2019, (ii) to Kshs 3.5 bn by December 2020, and (iii) to Kshs 5.0 bn by December 2021. This is the second time in 3-years that Parliament has rejected the proposal, having rejected a similar move in August 2015. According to Mr Jude Njomo, the legislator who proposed the Bill, the changes were necessary to create financial stability following the collapse of Imperial Bank and Chase Bank. The MPs based their arguments on the premise that the amendment would likely force mergers and acquisitions, as small lenders struggle to survive as they faced difficulties in raising the minimum statutory capital of Kshs 1.0 bn. Data from the Central Bank of Kenya shows that 23 of the 43 local banks had less than Kshs 5.0 bn core capital by December 2017. The Treasury has supported consolidation among lenders in the past by suggesting increments in core capital, arguing that it would lead to stronger and better-capitalised lenders to support more investment. We are of the view that the minimum core capital should be increased in order to promote stability in the banking sector as well as create room for cost reduction from economies of scale, which may translate to lower lending rates.
Equity Group plans to roll out an e-commerce money transfer and payments platform that will serve its customers across the region, through its subsidiary, Finserve, in November 2018. The platform, dubbed ‘mKey’, will ride on the bank’s regional network in Rwanda, Tanzania, DR Congo, Uganda and South Sudan. The move will help the bank offer more products and services, reduce operational costs as well as attract tech-savvy young population segments to use mobile internet for a range of services including paying for utilities, transfer of cash, buying goods and paying for services, in addition to borrowing of loans ranging from Kshs 300 to Kshs 1.0 mn. Finserve, a wholly owned mobile virtual network operator, employs 18 people that support Equity’s 13 mn clients. The subsidiary will also be deployed in Nigeria and Ethiopia by December 2019, and will be used to push products to a global audience in order to enhance the uptake of loans, savings, sale and buying of securities and forex trading. Upon full deployment, the platform is expected to increase the bank’s Non-Funded Income (NFI) streams by enabling users perform end-to-end transactions on the mKey platform, hence increasing transactional volumes and fee income for Equity Group. In our view, the mKey platform will boost Equity Group’s earnings going forward as the bank leverages on technology to reduce operational redundancies and increase efficiency, in addition to increasing revenue earned from the fee income streams.
Equities Universe of Coverage:
Below is our Equities Universe of Coverage:
|
Banks |
Price as at 31/08/2018 |
Price as at 7/09/2018 |
w/w change |
YTD Change |
LTM Change |
Target Price* |
Dividend Yield |
Upside/Downside** |
P/TBv Multiple |
|
NIC Bank*** |
30.0 |
29.5 |
(1.7%) |
(12.6%) |
(20.4%) |
54.1 |
3.4% |
83.7% |
0.7x |
|
I&M Holdings*** |
100.0 |
102.0 |
2.0% |
2.0% |
(17.1%) |
169.5 |
3.4% |
72.9% |
1.0x |
|
Zenith Bank*** |
21.2 |
20.9 |
(1.2%) |
(18.5%) |
(12.0%) |
33.3 |
12.9% |
70.5% |
0.9x |
|
Ghana Commercial Bank*** |
5.4 |
5.4 |
0.0% |
5.9% |
7.0% |
7.7 |
7.1% |
51.4% |
1.3x |
|
Diamond Trust Bank*** |
190.0 |
188.0 |
(1.1%) |
(2.1%) |
6.2% |
280.1 |
1.4% |
48.8% |
1.1x |
|
UBA Bank |
8.1 |
7.9 |
(2.5%) |
(23.3%) |
(10.4%) |
10.7 |
10.8% |
42.9% |
0.5x |
|
KCB Group*** |
45.0 |
42.8 |
(5.0%) |
0.0% |
1.2% |
60.9 |
7.0% |
42.4% |
1.4x |
|
Union Bank Plc |
5.9 |
5.3 |
(9.4%) |
(32.1%) |
(13.1%) |
8.2 |
0.0% |
39.3% |
0.6x |
|
HF Group*** |
7.8 |
6.5 |
(16.1%) |
(37.5%) |
(38.6%) |
10.2 |
4.9% |
36.5% |
0.3x |
|
Barclays |
11.0 |
11.0 |
0.0% |
14.6% |
6.3% |
14.0 |
9.1% |
36.4% |
1.5x |
|
CRDB |
160.0 |
160.0 |
0.0% |
0.0% |
(20.0%) |
207.7 |
0.0% |
29.8% |
0.5x |
|
Equity Group |
45.0 |
44.3 |
(1.7%) |
11.3% |
12.7% |
55.5 |
4.5% |
27.9% |
2.1x |
|
CAL Bank |
1.1 |
1.3 |
18.2% |
20.4% |
48.6% |
1.4 |
0.0% |
27.3% |
0.9x |
|
Co-operative Bank |
16.5 |
16.7 |
0.9% |
4.1% |
1.8% |
19.7 |
4.8% |
24.2% |
1.5x |
|
Ecobank |
9.0 |
9.0 |
0.2% |
18.3% |
41.3% |
10.7 |
0.0% |
19.6% |
2.0x |
|
Stanbic Bank Uganda |
33.0 |
33.0 |
0.0% |
21.1% |
21.1% |
36.3 |
3.5% |
13.5% |
2.3x |
|
Bank of Kigali |
290.0 |
290.0 |
0.0% |
(3.3%) |
3.6% |
299.9 |
4.8% |
8.2% |
1.6x |
|
Guaranty Trust Bank |
37.0 |
35.0 |
(5.4%) |
(14.1%) |
(9.2%) |
37.1 |
6.9% |
7.1% |
2.3x |
|
Access Bank |
9.4 |
9.1 |
(3.2%) |
(13.4%) |
(5.7%) |
9.5 |
4.4% |
6.0% |
0.6x |
|
SBM Holdings |
6.6 |
6.6 |
0.0% |
(12.0%) |
(14.7%) |
6.6 |
4.5% |
3.9% |
0.9x |
|
Standard Chartered |
205.0 |
203.0 |
(1.0%) |
(2.4%) |
(13.2%) |
184.3 |
6.2% |
(3.9%) |
1.7x |
|
Bank of Baroda |
144.0 |
144.0 |
0.0% |
27.4% |
30.9% |
130.6 |
1.7% |
(7.6%) |
1.3x |
|
Stanbic Holdings |
100.0 |
96.0 |
(4.0%) |
18.5% |
20.0% |
85.9 |
2.3% |
(11.8%) |
1.0x |
|
Stanbic IBTC Holdings |
48.0 |
45.0 |
(6.3%) |
8.4% |
12.8% |
37.0 |
1.3% |
(21.6%) |
2.5x |
|
FBN Holdings |
9.0 |
9.0 |
0.6% |
2.3% |
56.3% |
6.6 |
2.8% |
(23.1%) |
0.5x |
|
Standard Chartered |
26.0 |
26.0 |
0.0% |
3.0% |
19.1% |
19.5 |
0.0% |
(25.2%) |
3.3x |
|
National Bank |
5.8 |
5.5 |
(5.2%) |
(41.2%) |
(49.5%) |
2.8 |
0.0% |
(51.7%) |
0.4x |
|
Ecobank Transnational |
19.6 |
19.5 |
(0.3%) |
14.7% |
8.3% |
9.3 |
0.0% |
(52.5%) |
0.7x |
*Target Price as per Cytonn Analyst estimates
**Upside / (Downside) is adjusted for Dividend Yield
***Banks in which Cytonn and/or its affiliates holds a stake. For full disclosure, Cytonn and/or its affiliates holds a significant stake in NIC Bank, ranking as the 5th largest shareholder
**** Stock prices are in respective country currency
We are “NEUTRAL” on equities for investors with a short-term investment horizon since the market has rallied and brought the market P/E slightly above its’ historical average. However, pockets of value exist, with a number of undervalued sectors like Financial Services, which provide an attractive entry point for long-term investors, and with expectations of higher corporate earnings this year, we are “POSITIVE” for investors with a long-term investment horizon.
Paystack Payments Limited, a Nigeria-based FinTech company that processes payments for businesses in Africa, has raised USD 8.0 mn (Kshs 806.3 mn) in Series A funding, the first round of financing given to a new business after the initial capital used to start the business. Founded in 2015, Paystack Payment Limited is a Nigeria-based company that enables businesses to accept payments from around the world via credit card, debit card and direct bank transfer on web and mobile. The platform was officially launched for use in 2016 and currently processes over 15% of all online transactions in Nigeria, powering payments for over 17,000 organizations in Nigeria, which include telcos, government agencies and airlines. It processes an average of USD 20.0 mn (Kshs 2.0 bn) worth of payments per month on behalf of its clients.
The round of funding was led by Stripe, an American online payment processing company, and also included funding from Visa Incorporated, a global payments technology company. Additionally, the company received follow-on funding from Y Combinator, Tencent and angel investors Tom Stafford (Managing Partner at Digital Sky Technologies Global), Gbenga Oyebode (Founding Partner of Aluko & Oyebode and Board Member of MTN Nigeria), and Dale Mathias (Co-founder of Innovation Partners Africa). The investment is expected to facilitate the expansion of Paystack across Africa and scaling up of its engineering team. This is the second time the company is receiving funding after it received seed capital of USD 1.3 mn (Kshs 131.0 mn) in 2016 from international investors Tencent, Comcast Ventures and Singularity Investments. The capital investment was used to build out its engineering team in Lagos, as well as grow its sales and marketing operations, to accelerate product development and customer on-boarding.
The investment in Paystack Payments Limited comes at the wake of accelerated investment in the tech-startup ecosystem in Sub Saharan Africa. According to The Mobile Economy: Sub-Saharan Africa 2018 Report, 124 tech startups across Africa raised a total of USD 560.0 mn (Kshs 56.4 bn) in 2017, a 53.0% increase from 2016. Sub Saharan Africa accounted for USD 515.0 mn (Kshs 51.9 bn) in more than 100 deals. Of this amount, FinTech accounted for 21.0%, solar for 21.0%, e-commerce for 19.0% and Educational Technology (Ed-Tech) for 12.0%. This endorses the increasing investor interest in solutions that work towards solving social challenges, such as limited access to financial services, education and energy. Kenya, Nigeria and South Africa remain the most popular investment destinations, accounting for 76.0% of total funds raised by tech start-ups in the region.
In the education sector, half year financial results released by Advtech Group, a private education provider listed on the Johannesburg Stock Exchange, indicate that the company acquired 71.0% of Makini School Limited for a consideration of ZAR 130.8 mn (Kshs 1.0 bn). Makini School Limited was acquired through a Joint Venture between Schole (Mauritius) Limited, a subsidiary of Schole Limited, which is a London-based education provider, Caerus Capital, a leading international education consultancy group, and Advtech Group in May 2018. The total value of the Makini School Limited buyout amounted to ZAR 184.2 mn (Kshs 1.5 bn) of which ZAR 157.7 mn (Kshs 1.3 bn) was goodwill accounting for 85.6% of the value. Property, plant and equipment was valued at ZAR 15.6 mn (Kshs 124.0 mn) accounting for 8.5% of the transaction value. Given that Makini Schools has 8 schools spanning across its 4 campuses along State House Avenue and Ngong Road in Nairobi, as well as Migosi and Kibos in Kisumu, it is unlikely that the ZAR 15.6 mn (Kshs 124.0 mn) included the land and buildings. This could be an indicator that Advtech Group, Schole (Mauritius) Limited and Caerus Capital do not own the land and the buildings but only operate the school.
This acquisition adds 8 schools and an estimated 3,200 students to Advtech Group’s portfolio.
The investment is the latest evidence of the increase in investor interest in the education sector in Kenya. Other investors who are setting up institutions in Kenya include:
- Advtech Group, who is set to open a school in Tatu City under its Crawford Schools brand, offering the THRASS (Teaching, Handwriting, Reading, and Spelling Skills) education system, which focuses on pre-primary education,
- South Africa based Nova Pioneer, who have set up a Primary and Secondary School in Tatu City offering the 8-4-4 curriculum,
- Investment firm Centum Limited who have established Sabis International School in Runda Estate in partnership with Sabis Education Network, and,
- Cytonn Investments, through its education affiliate Cytonn Education Services (CES), who provide education for all levels, from the Early Childhood Development Education (ECDE) to Tertiary Education, beginning with a Technical College branded, Cytonn College of Innovation and Entrepreneurship.
The investments are an indication of investors’ interest in the education sector in Sub-Saharan Africa and are motivated by (i) increasing demand for quality and affordable education, with the Gross Enrolment Ratio (GER) having doubled in the last 10-years to 8.5% in 2016 from 4.5% in 2006 according to a report, “The Business of Education in Africa” by Caerus Capital, and (ii) support, such as ease of approvals, offered to investors in the education sector by governments looking to meet Sustainable Development Goals (SDGs) targets of universal access to tertiary education.
Private equity investments in Africa remains robust as evidenced by the increasing investor interest, which is attributed to; (i) rapid urbanization, a resilient and adapting middle class and increased consumerism, (ii) the attractive valuations in Sub Saharan Africa’s private markets compared to its public markets, (iii) the attractive valuations in Sub Saharan Africa’s markets compared to global markets, and (iv) better economic projections in Sub Sahara Africa compared to global markets. We remain bullish on PE as an asset class in Sub-Sahara Africa. Going forward, the increasing investor interest and stable macro-economic environment will continue to boost deal flow into African markets.
Retail Sector
During the week, Kiloran Development Group, a UK-based developer with an operational office in Nairobi, and ALL Design, a British architectural firm, announced plans of putting up a Mixed-Use Development (MUD) named, “The Beacon”, to be located off Uhuru Highway towards Bunyala Road roundabout. The mall consisting of 261,563 SQFT of retail space and 45,208 SQFT of Grade A office space, is set for completion in 2020, which in our opinion may be unachievable given that the project has not broken ground yet. The project will be the developer’s second in Kenya, with the first one being Cedar Mall in Nanyuki. This underlines Kenya’s attractiveness to the foreign investors and multinational corporations, especially in the office and retail sectors. This has been as a result of: (i) the ever-widening middle class, evidenced by the growth in GDP per capita at a rate of 7.9% p.a. over the last 5-years from Kshs 113,539 in 2013 to Kshs 166,134 in 2017, hence increased purchasing power, (ii) Nairobi’s status as a regional hub boosted by infrastructural growth, and (iii) attractive returns in the retail and office sectors, with average rental yields of 9.4% and 9.2%, respectively, compared to an average of 5.4% and 6.1% for the residential and industrial sectors, respectively. The supply has increased in the retail sector with an 8-year CAGR of 15.9%, from 2.0 mn SQFT in 2010 to 6.5 mn SQFT in 2017 and in the office sector, with a 5-year CAGR of 23.6% from 1.2 mn SQFT in 2012 to 3.5 mn SQFT in 2017. The developer intends to differentiate the mall with provision of amenities, and in addition the mall will be open air and adopt a playful theme. The combination of office and retail spaces and the differentiation is likely to boost the performance of the development, as Mixed-Use Developments outperform purely office and purely retail buildings. In Kilimani for instance, MUD’s have average rental yields of 11.0%, compared to 9.2% for commercial office and 9.4% for purely retail buildings. Despite this, the development’s performance may be constrained by:
- The estimated 5.3 mn SQFT and 2.0 mn SQFT oversupply of both the commercial office and retail space, respectively, in Nairobi, which has constrained performance, with average rental yields for retail decreasing by 0.6% points over the last two-years from 10.0% in 2016 to 9.4% in 2018, and commercial office decreasing by 0.1% points from 9.3% in 2017 to 9.2% in 2018,
- The location is also just approximately 0.5 km from Nyayo Stadium roundabout, an area affected by traffic snarl ups, which is un-favorable for real estate developments, with Mombasa Road, which is commonly affected by traffic snarl ups, underperforming the market for both commercial office and retail developments, recording rental yields 0.7% points, and 1.6% points lower than market for retail and office space, respectively,
- The mall is less than 2 km from The Pinnacle, and approximately 1.2 km from Montave Mall, which are on Upper Hill and Lower Hill roads, respectively, approximately 300 metres from Highway Mall and approximately 2.2 km from Capital Center along Mombasa Road, and thus faces stiff competition.
This continued investment in the commercial sector is mainly driven by; i) the rising middle-class resulting in increased purchasing power as well as varying tastes and preferences for different goods and services which has created demand for international brands hence attracting multinational brands, ii) the current growth of the Kenyan economy, that has averaged at over 5.0% GDP growth for the past 5-years, iii) rapid improvement of infrastructure making it possible for investors to venture into otherwise inaccessible areas, iv) Kenya’s high population growth of 2.6% p.a against the worlds at 1.2% p.a, which has created demand for retail goods and services, and v) Kenya’s urbanization rate at 4.3%, which is relatively high compared to the world’s 2.1%, has resulted in a need for retail stores and entertainment spots.
The table below shows the rental yields changes between 2017 and 2018, and the existing oversupply of space in the office and retail sector;
|
Nairobi Office and Retail Performance Summary 2017-2018 |
||||
|
Theme |
Rental Yield 2017 |
Rental Yield 2018 |
y/y change |
Oversupply |
|
Office |
9.2% |
9.3% |
0.1% points |
5.3 mn SQFT |
|
Retail |
9.6% |
9.4% |
(0.2%) points |
2.0 mn SQFT |
|
||||
Source: Cytonn Research
Commercial Office Sector
Emperor Plaza, a family-owned commercial building located in Nairobi CBD, is set for sale at Kshs 750 mn, exclusive of purchase costs and VAT. The 5-floor building is located at the Junction of Kenyatta Avenue and Koinange Street, and currently hosts the Kenya Institute of Management (KIM) and other tenants. According to local dailies, the vendors value the building at Kshs 750 mn, that is a sale price of Kshs 17,847 per SQFT, with a resultant rental yield of 8.4%. This is 0.3% points lower than the average rental yields of 8.7%, at 84.1% occupancy recorded in the CBD, despite the fact that the building is 100% occupied. Working backwards, from the yields and prices, the annual income is Kshs 525.0 mn and to achieve a market yield of 8.7%, the value of the building is Kshs 724.1 mn. The yield on offer is 0.3% points lower than the 8.7% yield at which Stanlib Fahari I-REIT acquired 67 Gitanga Place, a 40,673 SQFT Grade A office building with an annual income of Kshs 73.8 mn. Stanlib Fahari I-REIT acquired 67 Gitanga Place at Kshs 850 mn in April this year as analysed in the Cytonn Stanlib Fahari I-REIT Earnings Update - H1’2018. The Emperor Plaza building is a good buy, given that; it is in an ideal location, since it is located at the Junction of Kenyatta Avenue and Koinange Street. It is also fully occupied, despite the CBD recording decreased occupancy rates, which have dropped by 8.6% points from 92.7% in 2017, to 84.1% in 2018.
The main risk factors for investors in the building are; i) companies moving out of the CBD to other prime business nodes such as Upperhill and Kilimani, due to lack of good quality offices in the CBD, and ii) insufficient parking in the Nairobi CBD area. Below is a summary of the performance of the performance commercial office buildings in the Nairobi by nodes:
(All values in Kshs unless stated otherwise)
|
Nairobi’s Commercial Office Performance 2016-2017 |
|||||||||
|
Area |
Price Kshs/ SQFT |
Rent 2017 (Kshs/SQFT) |
Occupancy 2017 (%) |
Yield 2017(%) |
Price 2016 (Kshs/SQFT) |
Rent 2016 (Kshs/SQFT) |
Occupancy 2016(%) |
Yield 2016 (%) |
% Change in Rents Y/Y |
|
Parklands |
12,729 |
103 |
85.7% |
9.7% |
11,771 |
102 |
80.0% |
10.0% |
1.3% |
|
Karen |
13,167 |
113 |
89.2% |
9.5% |
13,500 |
107 |
90.0% |
9.7% |
5.8% |
|
Kilimani |
12,901 |
101 |
84.5% |
9.5% |
12,667 |
99 |
90.5% |
9.3% |
2.2% |
|
Westlands |
12,872 |
103 |
88.5% |
9.4% |
12,482 |
102 |
92.1% |
9.2% |
1.1% |
|
UpperHill |
12,995 |
99 |
82.0% |
9.0% |
12,529 |
102 |
89.8% |
9.0% |
(3.0%) |
|
Nairobi CBD |
12,286 |
88 |
84.1% |
8.7% |
11,750 |
92 |
92.7% |
9.0% |
(4.2%) |
|
Thika Road |
11,500 |
82 |
73.6% |
8.5% |
11,700 |
91 |
80.3% |
8.8% |
(10.3%) |
|
Mombasa Road |
11,641 |
82 |
74.2% |
8.5% |
10,720 |
80 |
86.1% |
8.5% |
2.1% |
|
Average |
12,679 |
99 |
83.9% |
9.2% |
12,053 |
100 |
88.9% |
9.2% |
(0.6%) |
|
|||||||||
Source: Cytonn Research
Other highlights of the week include;
- In infrastructure, Marubeni Corporation, a Japanese firm involved in power generation projects through wind, solar, hydropower and biomass was awarded a tender by Kenya Electricity Generating Company Limited (KenGen), to construct a new 83 MW geothermal power plant in Naivasha for an undisclosed fee. According to the Managing Director, Rebecca Miano, the project is an extension of the existing Olkaria 1 units 4 & 5 geothermal power. The project will be financed through a Kshs 26.5 bn balance of funds saved from the completed Olkaria 280 MW geothermal project, a loan of Kshs 40 bn from Japan International Co-operation Agency (JICA) and European Investment Bank (EIA). The project is expected to result in increased electric power supply in the country and thus boost; the growth of the country’s macro-economic variables such as the Gross Domestic Product (GDP) through revenue generation, creation of employment, and ease doing business;
- Struggling retailer, Nakumatt Holdings, closed down its Likoni Mall branch, following a court order to exit the premises due to failure to pay rent. The outlet was the only remaining branch in Mombasa, following the closure of its Nyali City Mall branch in March this year. The retailer currently has six operational branches in the country, out of a total of 62 in 2017. The operational branches are; Nakumatt Mega along Uhuru Highway, Nakumatt Prestige, Lavington, Embakasi, Mega City (Kisumu) and Nakumatt Nakuru.
Listed Real Estate
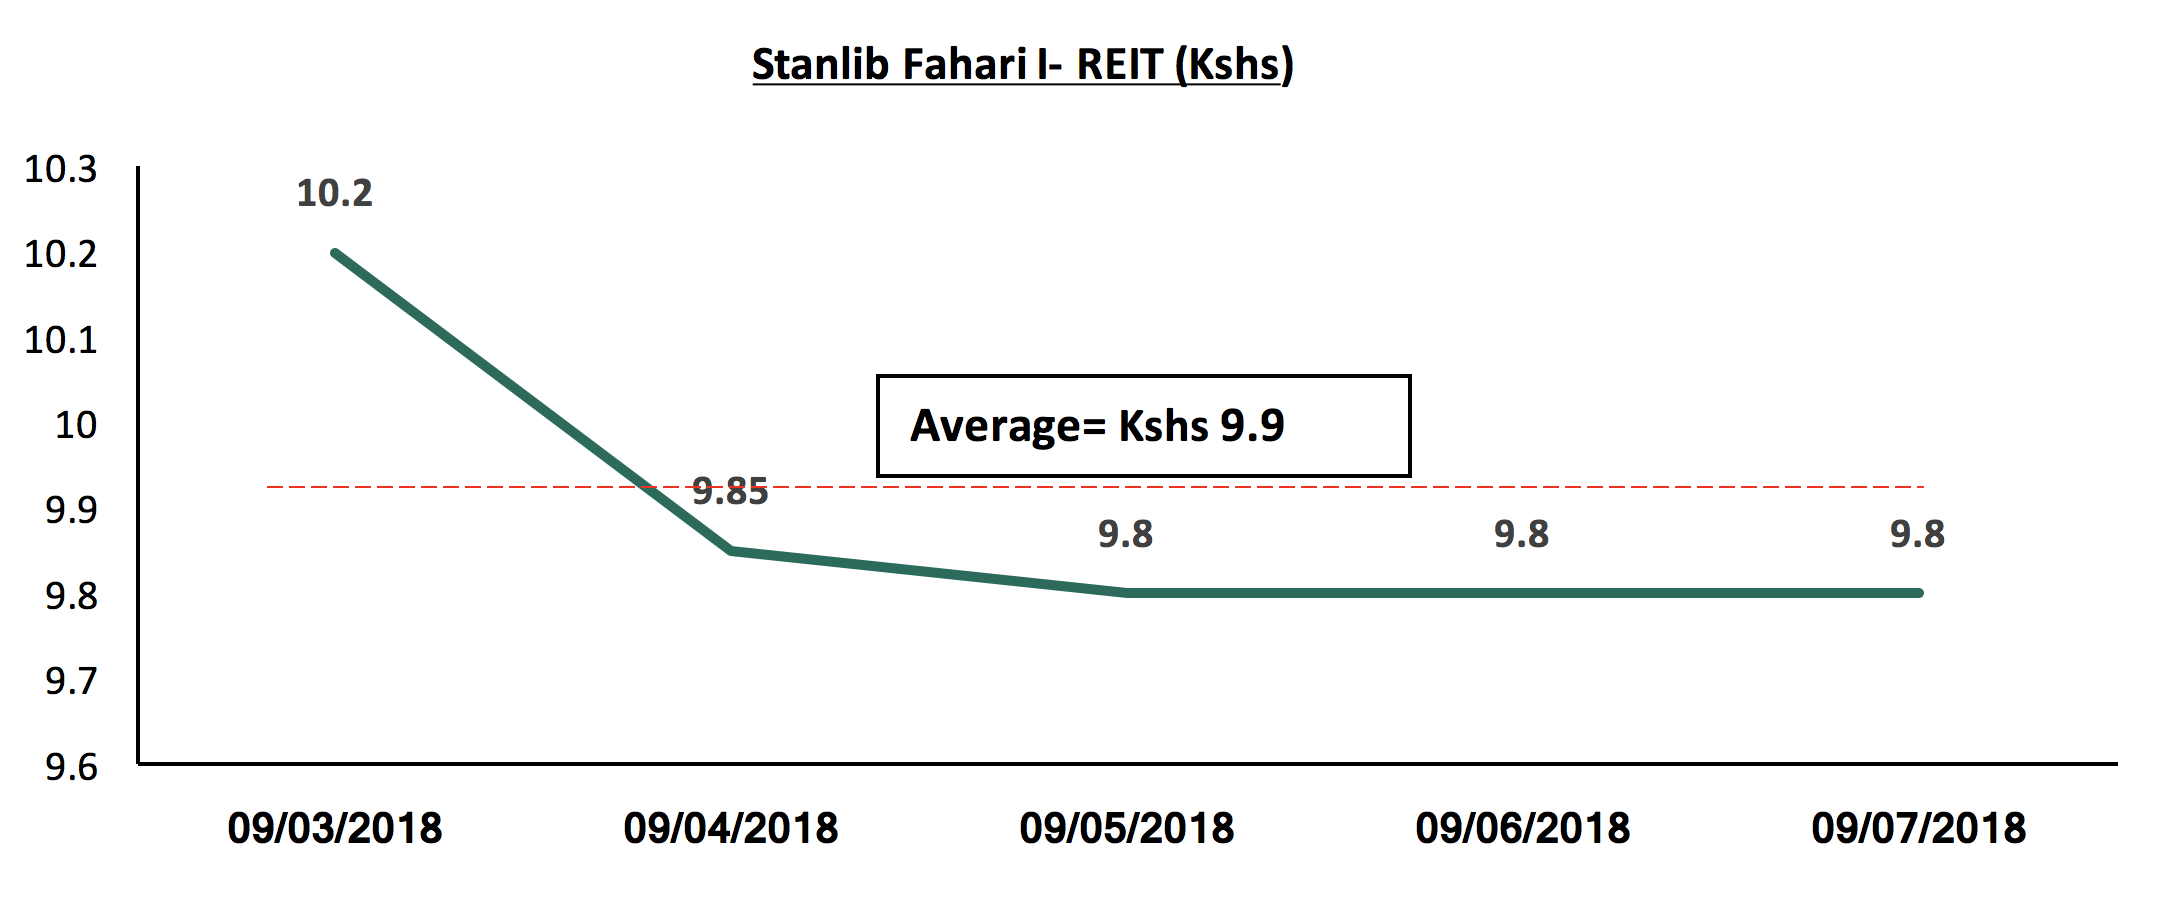
The Fahari I-REIT closed the week at Kshs 9.8, 3.9% lower than last week’s average price of Kshs 10.2, and a marginal decline from the week’s opening price of Kshs 10.0. During the week, it recorded an average price of Kshs 9.9, which is a decline of 25.1% from last year’s trade price of Kshs 12.6 during the same period. The continued poor performance is attributed to a temporary increase in vacancies, coupled with some tenants bargaining for reduced rentals upon the renewal of leases, leading to a reduction in rental income, noted during the release of the H1’2018 results, thus resulting to low trade volumes, an indication of low investor appetite.
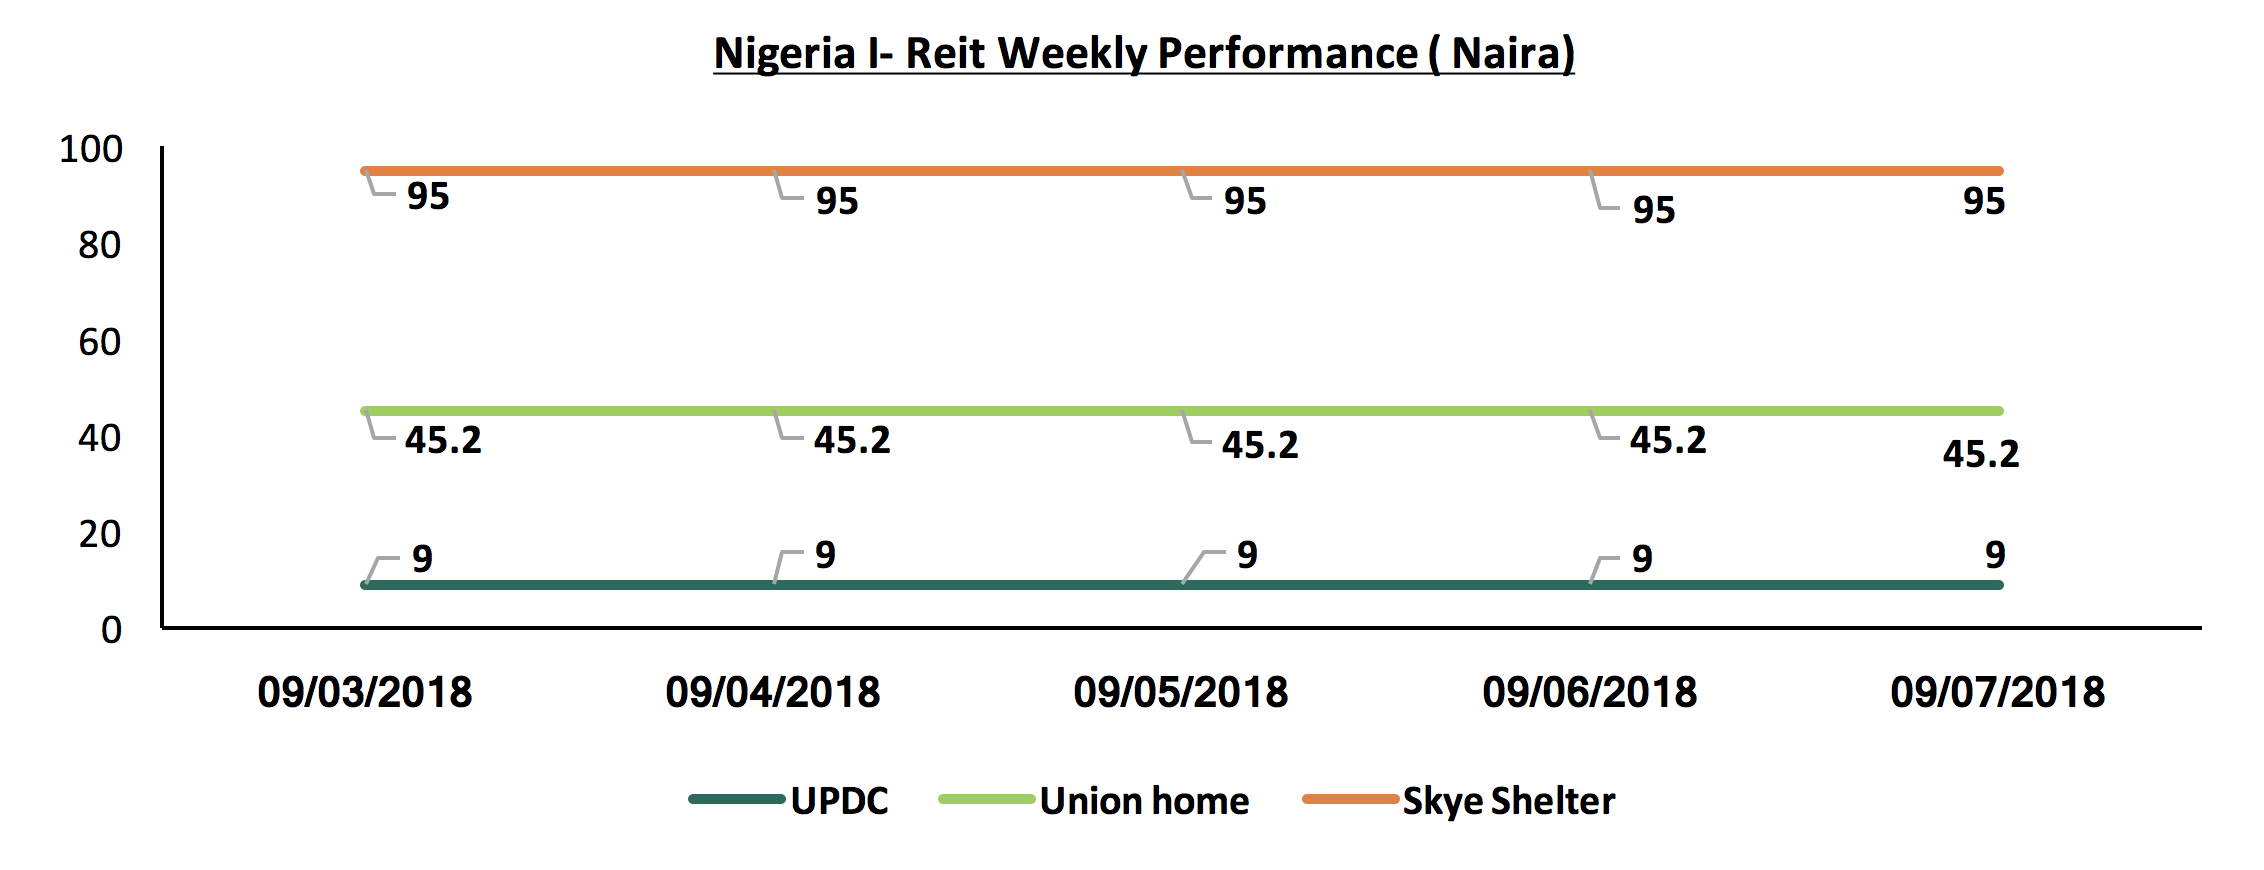
The Nigerian I-REIT market remained unchanged, with Union Homes, Skye Shelter, and UPDC, retaining a price per share of N45.2, N95 and N9, respectively, throughout the week. We attribute to the inadequate investor knowledge about the market hence low investor interest in the instrument, and poor valuation of the market, which leads to lower levels of demand by potential investors.
We expect continued increase in activities in the real estate sector driven by; i) continued demand for quality office spaces (Grade A and B), ii) continued infrastructural development, iii) the housing deficit that currently stands at 2.0 mn units according to the National Housing Corporation (NHC), iv) positive demographics such as a high population growth rate of 2.6%, 1.4% point higher than global averages of 1.2%, and v) the relatively high urbanization rate in Kenya at 4.4% compared to the global average of 2.1%, necessitating the need for adequate housing in the urban areas.
In line with Cytonn’s expansion strategy, we continue to carry out market analysis for various regions in Kenya and Sub Saharan Africa in order to identify lucrative investment opportunities for our investors.
- In 2018, we have released the Nyeri Real Estate Investment Opportunity 2017, Kisumu Real Estate Investment Opportunity , and the Nakuru Real Estate Investment Opportunity topicals in January, July and August, respectively,
- In 2017, we released the Kampala Real Estate Investment Opportunity and the Accra Real Estate Investment Opportunity, in September and November 2017, respectively,
- In 2016, we published the Kisumu Real Estate Investment Opportunity 2016.
This week, we turn our focus to the real estate investment opportunity in Mombasa County, which is an update on research conducted in 2016. As per the 2016 analysis, the market had an average rental yield of 7.0% with the residential sector recording average total returns of 7.9% p.a. (an average capital appreciation of 1.6% per annum and rental yield at 6.3%), whereas the office and retail sectors recorded average rental yields of 5.9% and 8.9%, respectively. This week, we update those findings in light of the recent developments within the county where this year, the real estate market recorded average rental yields of 6.2%, with the residential sector recording average total returns to investors of 7.2% (rental yields of 5.1% and capital appreciation of 2.1%), whereas the retail and office sectors attained yields of 8.3% and 5.1%, respectively.
In this topical, we shall look at the following:
- Overview of Mombasa,
- Factors Driving Real Estate in Mombasa,
- Challenges Facing Real Estate in Mombasa,
- Mombasa Real Estate Market Performance,
- Regional Comparative Analysis, and,
- Investment Opportunity and Outlook.
- Overview of Mombasa:
Mombasa, the 2nd largest city in Kenya after the capital city of Nairobi, is situated on the South- Eastern side of Kenya and is the smallest county in Kenya, measuring 229.9 SQKM. It is bordered by Kwale County to the West, Kilifi County to the East, and the Indian Ocean to the South. The county consists of 6 constituencies: Jomvu, Changamwe, Likoni, Nyali, Kisauni, and Mvita, but is broadly divided into Mombasa Island and the Mainland by the Indian Ocean. The county has a relatively high population growth with the County Government of Mombasa estimating the 2017 population to be 1.3 mn persons, an 8-year CAGR of 3.9% from the 0.9 mn recorded in 2009. Thus, the county currently has a relatively high population density of approximately 5,532 persons per SQKM in comparison to the national population density of 83 persons per SQKM. Economically, the county is poised as one of the regional leaders in terms of maritime trade within the continent where Mombasa Port is the largest seaport in East and Central Africa. Moreover, Mombasa is one of the leading tourist destinations in East Africa due to its location adjacent to the Indian Ocean.
- Factors Driving Real Estate in Mombasa:
The real estate sector in Mombasa has been on an upward growth trajectory in terms of supply, attracting both local and international investors in the residential, commercial office, retail and hotel sectors. The key factors that have contributed to the growth include:
- Positive Demographic Dividend: The county has a relatively high population growth with the County Government of Mombasa estimating the 2017 population to be at 1.3 mn persons, an 8-year CAGR of 3.9% from the 0.9 mn recorded in 2009. Thus, the county currently has a relatively high population density of approximately 5,532 persons per SQKM in comparison to the national population density of 83 persons per SQKM. The county also reaps from the prevalent mixture of international cultures that have boosted its middle class population portfolio,
- Housing Deficit: The rapid population growth coupled with a continuous inflow of tourists as well as rural to urban migrators in search of employment has largely contributed to demand for dwellings with the Ministry of Land, Housing, and Physical Planning estimating the housing deficit to be at 380,000 as of 2018. The rapid demographic growth has also boosted the demand for other facilities such as land and retail properties to serve the needs of the residents,
- Infrastructural Improvements: Mombasa has seen several infrastructural projects in the last few years, which has improved the ease of doing business and thus attracted investment. For example, the start of operation of the Standard Gauge Railway in June last year resulted in an increase in local tourism thus, pushing up demand for accommodation services. According to KNBS Economic Survey 2018, bed-occupancy by local tourists increased by 15.6% to 3.6 mn in 2017 from 3.1 mn in 2015. Plans are also underway to upgrade the Moi International Airport’s capacity and efficiency at a cost of Kshs 7.0 bn, alongside the Likoni Channel through construction of the Kshs 82.0 bn Mombasa Gate Bridge Project. Such developments, while also supported by the ongoing Mombasa West Integrated Urban Roads Network Project, which consists of projects such as the Port Reitz Road and the Dongo Kundu Bypass, are bound to open up new areas for investment in Mombasa County, thereby pushing property prices up, as they boost accessibility and reduce traffic snarl-ups, thus setting up the region to attract more investments, including real estate,
- Tourism Sector: Mombasa is recognized as one of the major tourist attraction areas in Kenya, partly due to its rich cultural heritage and also its proximity to the Indian Ocean. The tourist activities have resulted in a vibrant economy boosting the retail sector and the hotel industry, as well as the demand for luxury residential homes especially by long-stay visitors, and,
- Strong Economic Growth: According to a 2015 World Bank study, Mombasa ranked the 9th in Kenya in terms of GDP Per Capita among all counties, recording an average GDP Per Capita of USD 935, 34.7% higher than the national average of USD 694. This is expected to grow further given the rebound in tourism sector and the infrastructural developments that are aimed at enhancing trade in the county’s sea and airports.
Below is a table highlighting the GDP per Capita for the top 10 Kenyan Counties;
|
|
Top 10 Kenyan Counties in GDP Per Capita |
|
|
Rank |
Counties |
GDP Per Capita (USD) |
|
1 |
Kiambu |
1,785 |
|
2 |
Nyeri |
1,503 |
|
3 |
Kajiado |
1,466 |
|
4 |
Nakuru |
1,413 |
|
5 |
Kwale |
1,406 |
|
6 |
Laikipia |
1,226 |
|
7 |
Murang’a |
1,090 |
|
8 |
Nairobi |
1,081 |
|
9 |
Mombasa |
935 |
|
10 |
Machakos |
913 |
Source: World Bank (2015)
3. Challenges Facing Real Estate in Mombasa:
Mombasa County has had its fair share of challenges that have hampered the full maturity of its real estate sector, key among them being:
- Insecurity: The county has been prone to terrorist-related threats, stemming from the 2015 attacks by international terrorist groups such as Al Shabaab, which led to the number of international arrivals declining by a 6-year CAGR of 10.0% to 1.2 mn in 2015 from 1.8mn in 2011. This has resulted in potential investors holding off investment in the county - despite the rebound in the number of arrivals in 2016 and H1’2017, which should be an indicator of return to calm - and this has generally had a negative impact on the business environment. As a result, the performance of the office sector, for example, has been poor with the average occupancy as at August 2018 coming in at an average of 65.8%, compared to counties such as Nairobi with 84.6%,
- Insufficient Infrastructure: Despite the new infrastructural developments, Mombasa County still struggles with inadequate infrastructure, which inhibits the growth of the business environment. For instance, the narrow Nyali Bridge and roads have rendered the city center and its environs unattractive for commercial real estate due to the perennial traffic snarl-ups, whereas the insufficient capacity of the Likoni Ferries affects Mombasa South’s tourism industry due to the long delays caused at the crossing channel. In addition, insufficient access to water services and sewerage systems in majority of the residential estates impedes real estate investments in certain areas such as Likoni and Tudor,
- Inadequate Supply of Affordable Development Land: The county, which is the smallest county in Kenya, lacks sufficient development land to cater for the huge demand, with a population density of 5,532 persons per SQKM, in comparison to the national 83 persons per SQKM. This has resulted in the proliferation of squatter settlements in areas such as Bamburi, Kisauni, Likoni, and Jomvu. According to our research, average land prices in areas such as Nyali, Kizingo, Port Reitz, and Shanzu areas, have grown by a 2-year CAGR of 12.6% to an average of Kshs 115.4 mn as at 2018, from an average of Kshs 109.4 mn in 2016 making it more difficult to provide affordable housing for the low-income population,
- Outdated County Spatial Planning: Mombasa lacks an updated and proper spatial plan to meet the needs of the fast-growing population with the last planning policy having been drawn in 1971, and having expired in in the year 2000. This has resulted in unplanned development, transport challenges, especially within Mombasa town, with constant traffic jams, drainage issues resulting in flooding in areas such as Mzizima and Kaloleni, poor waste management practices and consequently poor living conditions especially for low income households. This has led to decline in development land available at the city centre, improper land use practices and proliferation of informal settlements, rendering such areas unattractive for investment grade commercial developments.
4. Mombasa Real Estate Market Performance:
We conducted research in Mombasa in August 2018 covering the residential, commercial office, retail and land sectors. Below is the sectoral review of performance:
- Residential Sector
The residential sector in Mombasa recorded a marginal decline in average total returns to investors to 7.2% from 7.9% recorded in 2016. This is majorly attributable to a decline in average rental yields which came in at 5.1% in 2018, 0.6% annualized drop since 2016 when the market had an average rental yield of 6.3%. This is attributable to increased vacancies as more developments are delivered to the market which are out of reach for majority of the Mombasa residents, majority of whom are low income earners, that is, below Kshs 50,000 per month (JICA 2016). Notably, capital appreciation recorded a marginal improvement of 0.3% annualized growth to a market average of 2.1% this year, from the 1.6% recorded in 2016. The best performing segment was the upper mid-end sector, which recorded the highest returns to investors of 7.9% on average, that is, average rental yields of 5.6% and a capital appreciation of 2.3%. This is on account of investors in the region purchasing apartments in order to rent them to the growing middle class as well as long-stay international visitors in the county.
The sector’s performance is detailed below:
- Lower Mid-End
The lower mid-end sector mainly comprises of developments in areas such as Tudor, Bamburi, and select parts of Nyali. The segment recorded relatively high occupancy rates with an average of 89.2%, indicating demand from the region’s lower-middle working population. Average total returns came in at 6.7%, with 2-bedroom units offering relatively higher returns of 7.4%, attributable to demand from young families and investors seeking to convert them to short and mid-term stay facilities as they are relatively affordable.
|
(all values in Kenya Shillings unless stated otherwise) |
||||||||||
|
Mombasa Residential Performance Summary August 2018 - Lower Mid-End |
||||||||||
|
Typology |
Size (SQM) |
Price (2018) |
Average Price Per SQM |
Average Rent Per SQM |
Average Occupancy Rate |
Average Annualized Uptake |
Average Rental Yield |
Average Price Appreciation |
Average Total Returns |
|
|
Studio |
42 |
2.4 mn |
57,416 |
355 |
|
8.3% |
6.2% |
0.3% |
6.5% |
|
|
1 BR |
68 |
3.6 mn |
54,312 |
279 |
|
14.6% |
4.9% |
1.4% |
6.3% |
|
|
2 BR |
88 |
7.1 mn |
89,220 |
379 |
89.6% |
26.4% |
4.8% |
2.6% |
7.4% |
|
|
3 BR |
114 |
9.7 mn |
90,348 |
409 |
92.8% |
29.5% |
5.3% |
1.9% |
7.2% |
|
|
Average |
78 |
5.7 mn |
72,824 |
355 |
91.2% |
19.7% |
5.2% |
1.5% |
6.7% |
|
|
· 2-bedroom units recorded the highest average total returns of 7.4%, compared to the market average of 6.7%. This is attributable to a high demand especially from investors seeking rental income · In terms of uptake, 2-bedroom and 3-bedroom units also recorded high average annual uptake with 26.4% and 29.5%, respectively, compared to the entire market’s average of 19.7%. |
||||||||||
Source: Cytonn Research
B. Upper Mid-End
The upper mid-end segment mainly comprises of developments in Nyali, Kizingo, and Shanzu. The upper mid-end segment registered the highest performance with average total returns of 7.9%, in comparison to the overall market’s average of 7.1%, attributable to a relatively high capital appreciation, which came in at 2.3% compared to the overall market’s average of 1.8%. This is attributable to demand for quality housing from the middle class in the region especially in areas such as Nyali and Kizingo; 3-bedroom apartments recorded the highest average annual uptake of 23.8%, indicating demand from investors.
|
(all values in Kenya Shillings unless stated otherwise) |
|||||||||
|
Mombasa Residential Performance Summary August 2018 : Upper Mid-End |
|||||||||
|
Typology |
Size (SQM) |
Price (2018) |
Average Price Per SQM |
Average Rent Per SQM |
Average Occupancy Rates |
Average Annualized Uptake |
Average Rental Yield |
Average Price Appreciation |
Total Returns |
|
1 BR |
74 |
8.1 mn |
111,310 |
658 |
76.8% |
16.0% |
5.4% |
1.3% |
6.7% |
|
2 BR |
92 |
14.3 mn |
136,324 |
679 |
92.9% |
17.8% |
5.0% |
2.3% |
7.1% |
|
3 BR |
177 |
18.8 mn |
116,071 |
598 |
77.5% |
23.8% |
5.2% |
2.6% |
7.8% |
|
4 BR |
261 |
24.3 mn |
95,232 |
547 |
83.3% |
23.3% |
6.3% |
3.5% |
9.8% |
|
Average |
151 |
16.4 mn |
114,734 |
621 |
82.6% |
19.6% |
5.6% |
2.3% |
7.9% |
|
· 4-bedroom units in the upper mid-end sector recorded the highest returns to investors with an average of 9.8%, 1.9% points higher than the market average of 7.9%. This is attributable to demand from middle-income class especially from the prevalent Asian communities who tend to live in larger groups, · 2-bedroom and 4-bedroom units registered the highest average rental yields attributable to their relatively high occupancy rates of 92.9% and 83.3%, respectively, in comparison to the market average of 82.6% · 3-Bedroom units recorded the highest annual uptake of 23.8% on average followed by 4-bedroom units as they offer better returns to investors with average capital appreciation of 2.6% and 3.5%, respectively, compared to 1-bedroom and 2-bedroom units with 1.3% and 2.3%, respectively |
|||||||||
Source: Cytonn Research
C. High-End
The high-end market comprises of developments in Nyali and Kizingo. The segment recorded the lowest returns to investors with average total returns of 4.1%, attributable to low rental yields at 2.7% as a result of relatively low occupancy rates of 62.2%, compared to lower-middle and upper-middle segments, which recorded average occupancies of 89.2% and 82.6%, respectively. This indicates that the high-end units may be out of the affordability range for majority of the Mombasa population with an average absolute price of Kshs 56.1 mn, and thus they only attract the few wealthy individuals. Generally, 4-bedroom units performed better with average total returns of 4.4%, with occupancy rates being highest in Kizingo which recorded an average of 92.9%. This is attributable to demand from wealthy investors seeking spacious beach homes
|
(All Values in Kshs Unless Stated Otherwise) |
||||||||||
|
Mombasa Residential Performance Summary August 2018: High-End |
||||||||||
|
Typology |
Size(SQM) |
Price (2018) |
Average Price Per SQM |
Average Rent Per SQM |
Average Occupancy Rates |
Average Annualized Uptake |
Average Rental Yield |
Average Price Appreciation |
Total Returns |
|
|
3 BR |
345 |
54.7 mn |
188,602 |
645 |
43.9% |
10.8% |
1.8% |
1.7% |
3.5% |
|
|
4 BR (Kizingo) |
273 |
45.7 mn |
173,504 |
757 |
92.9% |
22.8% |
4.9% |
2.4% |
7.3% |
|
|
4 BR (Nyali) |
460 |
70.0 mn |
152,952 |
371 |
50.0% |
6.3% |
1.5% |
0.0% |
1.5% |
|
|
Average |
340 |
55.1 mn |
171,686 |
591 |
62.2% |
13.3% |
2.7% |
1.4% |
4.1% |
|
|
· The high–end market recorded average total returns of 4.1%; with the average rental yields coming in at 2.7% which is relatively low compared to the overall market average of 5.3%, attributable to the high-end market’s high rental rates that dissuade occupancy · 3-bedroom units recorded returns of 3.5% with rental yield and price appreciation of 1.8% and 1.7%, respectively · 4-bedroom units in Kizingo performed better than 4-bedroom units in Nyali with average returns of 7.3% thus drawing investor demand due to their relatively low average absolute price of Kshs 45.7 mn in comparison to Nyali’s average of Kshs 70.0 mn |
||||||||||
Source: Cytonn Research
D. Mombasa Residential Performance Summary
Overall, the residential sector recorded a downward growth in returns with average total returns to investors declining by 0.7% points to an average of 7.2% in 2018 from 7.9% recorded in 2016. In terms of performance, the 4-bedroom typology recorded the highest returns to investors with an average of 8.0% and the highest price appreciation of 2.4%, indicated by the relatively high annual uptake rates of 21.3% in comparison to the market average of 18.3%. This is attributable to the low supply of 4-bedroom units, against high demand especially from upper middle income and high-income individuals. However, 2-bedroom units recorded the biggest gain with capital appreciation improving by 6.5% points to 2.4% in 2018, from a depreciation of 4.1% in 2016.
|
Mombasa Residential Performance Summary August 2018 |
|||||||||
|
Typology |
Average Rental Yields 2018 |
Average Price Appreciation 2018 |
Average Total Returns 2018 |
Average Rental Yield 2016 |
Average Price Appreciation 2016 |
Average Total Returns 2016 |
Annualized Changes Rental Yield (% Points) |
Annualized Changes Price Appreciation (% Points) |
Annualized Changes Total Returns (% Points) |
|
1 BR |
5.1% |
1.3% |
6.4% |
8.0% |
2.3% |
10.3% |
(1.5%) |
(0.5%) |
(2.0%) |
|
2 BR |
4.9% |
2.4% |
7.3% |
6.0% |
(4.1%) |
1.9% |
(0.6%) |
3.3% |
2.7% |
|
3 BR |
4.8% |
2.3% |
7.1% |
6.0% |
3.5% |
9.5% |
(0.6%) |
(0.6%) |
(1.2%) |
|
4 BR |
5.6% |
2.4% |
8.0% |
5.2% |
4.5% |
9.7% |
0.2% |
(1.1%) |
(0.8%) |
|
Average |
5.1% |
2.1% |
7.2% |
6.3% |
1.6% |
7.9% |
(0.6%) |
0.3% |
(0.3%) |
|
· The residential sector’s performance softened between 2016 and 2018, with total returns to investors declining annually by 0.3% points on average, to 7.2% in 2018 from 7.8% in 2016 · Average rental yields declined by 0.6% points, annually over the period with 2018 recording an average of 5.1%, 1.2% points lower than the 6.3% recorded in 2016, · However, capital appreciation gained marginally by 0.3% points on average annually. This was mainly due to the 2-bedroom units which recorded average capital appreciation of 2.4% in 2018, a notable gain of 6.5% points from the depreciation recorded in 2016 of 4.1% |
|||||||||
Source: Cytonn Research
II. Commercial Real Estate
A. Office Sector
The office sector in Mombasa recorded a relatively low performance with average rental yields of 5.1% in 2018, a 0.5% points decline from 5.6% recorded in 2016. This is attributable to a decline in rental rates which came in at Kshs 75.7 per SQFT in 2018, a compounded annual drop of 12.6% from the Kshs 99.0 per SQFT recorded in 2016. This is as demand increased at a slow rate by a 2-year CAGR of 0.6% - an indicator of minimal business expansion in the region, which could be attributed to insufficient infrastructure in key areas such as Mombasa Island, which has made it hard to conduct business in the region. In addition, growth in the financial services sector has been hampered due to (i) lack of legal and regulatory structures, (ii) insufficient skilled professionals in Islamic finance considering that 41.0% of Mombasa’s population is Muslim, and (iii) poor perception and lack of awareness of sharia compliant financial products.
However, the sector has a potential for growth in the future, due to the ongoing developments in the region such as infrastructural improvements, the devolved government’s emphasis on investment in sectors such as manufacturing and the maritime business, and the national economic growth which has a spill-over effect as companies expand to the nation’s largest cities such as Mombasa. This is bound to improve demand for office space.
|
(all values in Kenya Shillings unless stated otherwise) |
|||||
|
Mombasa Office Market Performance Summary August 2018 |
|||||
|
Class |
Current Price/SQFT (Kshs) |
Asking Rent Per SQFT per Month (Kshs) |
Service Charge (Kshs) |
Occupancy Rate |
Rental Yield 2018 |
|
Grade B |
15,000.0 |
79.6 |
20.0 |
71.7% |
5.9% |
|
Grade C |
|
61.3 |
19.0 |
59.1% |
3.2% |
|
MUD |
11,750.0 |
108.5 |
14.7 |
64.4% |
7.4% |
|
Average |
12,833.3 |
75.7 |
18.6 |
65.8% |
5.1% |
|
· Mixed-use developments recorded better returns with average rental yields of 7.4% compared to the market average of 5.1%, attributable to their relatively high rental rates with an average of Kshs 108 per SQFT compared to the market average of Kshs 75.7 per SQFT, as they are mostly located in exclusive high end or upper mid-end residential areas thus target high-end clientele, · Grade C offices recorded the lowest returns with average rental yields of 3.2% attributable to a low demand for such due to their tendency to lack sufficient amenities, especially parking spaces as majority of them are located within the CBD thus limiting land for parking and quality space, · Grade B offices are mostly in good locations, along major routes such as Links road, and are few in supply hence record relatively high in occupancy rates with an average of 71.7%, 5.9% points higher than the market average of 65.8%. |
|||||
Source: Cytonn Research
The average selling price for office space remained flat at Kshs 12,833 per SQFT mainly driven by the notably low uptake of 20.0% on average, as well as sluggish occupancy rates, which increased by a 2-year CAGR of 0.9% between 2016 and 2018.
(all values in Kenya Shillings unless stated otherwise)
|
Mombasa Office Sector Performance Summary 2016/2018 |
|||
|
Factor |
2018 |
2016 |
Annualized Change |
|
Average Price per SQFT (Kshs) |
12,833.3 |
12,833.3 |
0.0 Points |
|
Average Rent Per Month per SQFT (Kshs) |
75.7 |
99.0 |
(12.6%) |
|
Average Occupancy Rate |
65.8% |
64.0% |
0.9% Points |
|
Average Uptake |
20.0% |
18.0% |
1.0% Points |
|
Average Rental Yields |
5.1% |
5.9% |
(0.4%) Points |
|
· Average selling price for office space remained flat with to a slow marginal increase rate in office space uptake by 2.0% points in the last 2 years · Asking rents however declined deeply by an annualized rate of 12.6%. This is as developers sought to raise occupancy rates within the poorly performing market and also Grade C developments that are charging relatively lower rents of Kshs 61.3 per SQFT, on average |
|||
Source: Cytonn Research
B. Retail Sector
The retail sector in Mombasa recorded an improvement in performance from 2016 to 2018, in terms of occupancy rates, which increased by 7.2% points on average, annually from 82.0% to 96.3%. The demand has been spurred by a positive demographic dividend, a growing middle class, the rebound in the tourism sector, and local retailers such as Tuskys and Naivas that are keen on expanding their national footprint. Nakumatt, which was predominantly the main retailer in a majority of the malls in Mombasa has paved the way for entry of other local retail giants such as Naivas as well as international retailers such as Shoprite, through its exit from the market. Moreover, several international retailers have announced plans to expand to Mombasa including LC Waikiki, Domino’s Pizza, Coldstone, and Shoprite. Mombasa has the second largest mall space supply in Kenya with 1.4mn SQFT, after Nairobi, which has 6.5 mn SQFT. New malls in the region include the Mwembe Mall in Mwembe Tayari measuring 135,600 SQFT, which was complete in 2018, and Airport Mall in Changamwe measuring 172,000 SQFT, which is under construction and expected to be operational within 2018.
|
(all values in Kenya Shillings unless stated otherwise) |
||||
|
Mombasa Retail Sector Performance Summary August 2018 |
||||
|
Class |
Average Rent Per SQFT per Month (Kshs) |
Service Charge (Kshs) |
Occupancy Rate |
Rental Yield 2018 |
|
Community |
143.3 |
16.0 |
87.5% |
9.4% |
|
Neighborhood |
93.8 |
21.0 |
97.9% |
7.5% |
|
Average |
103.7 |
18.5 |
96.3% |
8.3% |
|
· Neighborhood malls recorded high occupancy rates of 97.9% on average, compared to the market average of 96.3%. This is attributable to their affordability with the average rents per SQFT for neighborhood malls coming at Kshs 93.8, compared to community malls’ Kshs 143.3 per SQFT while the amenities are similar. They include malls like Nyali Plaza, and City Mall · Community malls, however, recorded higher returns with average rental yields of 9.4%, 1.1% points higher than the market average of 8.3%, owing to their high rental rates which came in at an average of Kshs 143.3 per SQFT. They include malls like Nyali Centre, and the recently opened Mwembe Mall |
||||
Source: Cytonn Research
In comparison with 2016, the average asking rents for the retail sector declined by 5.5% annually between 2016 and 2018, as investors sought to attract clientele especially with the exit of various banks from the malls, and Nakumatt, which was an anchor tenant in key malls such as City Mall, Nyali Plaza and Likoni Complex. Occupancy rates increased by a cumulative of 14.3% between the 2-years from 82.0% as at 2016 to 96.3% in 2018, driven by affordable rental rates, as well as the continued expansion of local retailers such Naivas.
(all values in Kenya Shillings unless stated otherwise)
|
Mombasa 2016/2018 Retail Sector Performance Summary |
|||
|
Factor |
2018 |
2016 |
Annualized Change |
|
Average Rent Per SQFT (Kshs) |
103.7 |
116.0 |
(5.5%) |
|
Average Occupancy Rate |
96.3% |
82.0% |
7.2% points |
|
Average Rental Yields |
8.3% |
8.9% |
(0.3%) |
|
· Average asking rents for the retail sector declined by 5.5% annually between November 2016 and August 2018, as investors sought to attract clients and as various malls experienced vacancy rates with the closure of Nakumatt, as well as bank branches · As a result, average occupancy rates increased by a cumulative of 14.3% between the two years indicating a return of investor confidence. In addition, the region has attracted interest from both international retailers such as LC Waikiki and Shoprite supermarket, and local retailers seeking to expand their nationwide footprint such as Naivas and Tuskys |
|||
Source: Cytonn Research
III. Land Performance
The average price per acre in Mombasa is Kshs 115.4 mn, an average price appreciation of 12.6% from Kshs 109.4 mn per acre in 2016. Fast developing areas such as Kizingo and Nyali, recorded the highest price per acre at Kshs 244.6 mn and Kshs 134.0 mn, respectively. Areas such as Likoni Harbor and Port Reitz also exhibit high demand for land hence high prices. Ongoing infrastructural improvements such as the Mombasa West Integrated Urban Roads Network Project, the planned Mombasa Gate Bridge, and the recently launched SGR, have also contributed in boosting land prices as they open up areas for investment. Additionally, the ability to densify in areas such as Kizingo, Tudor and Nyali has led to high land prices as developers are able to maximize their investment.
(all values in Kenya Shillings unless stated otherwise)
|
Average Land Performance for Select Areas in Mombasa2016/2018 |
||||
|
Location |
Price Per SQM |
Average Price Per Acre 2016 (Kshs) |
Average Price per Acre 2018 (Kshs) |
Annualized Capital Appreciation |
|
Shanzu |
13,583 |
60.0mn |
61.3mn |
0.9% |
|
Nyali |
33,500 |
77.5mn |
134.0mn |
24.5% |
|
Bamburi |
11,475 |
|
45.9 mn |
|
|
Kizingo |
70,774 |
200.0mn |
244.6mn |
8.9% |
|
Port Reitz |
36,591 |
100.0mn |
146.4mn |
16.5% |
|
Average |
31,012 |
109.4mn |
115.4mn |
12.6% |
Source: Cytonn Research
IV. Mombasa Real Estate Performance Summary
In summary, the real estate sector in Mombasa registered average rental yields and price appreciation of 6.2% and 7.2%, respectively, with the retail sector recording the highest rental yields of 8.3% compared to other themes such residential and office, which attained yields of 5.3% and 5.1%, respectively.
|
August 2018 Mombasa Real Estate Performance |
|||
|
Sector |
Average Occupancy Rates 2018 |
Average Rental Yields 2018 |
Capital Appreciation |
|
Residential |
82.0% |
5.1% |
1.8% |
|
Office |
65.8% |
5.1% |
|
|
Retail |
96.3% |
8.3% |
|
|
Land |
|
|
12.6% |
|
Average |
81.4% |
6.2% |
7.2% |
Source: Cytonn Research
5. Regional Comparative Analysis
Comparing across the 5 counties we have tracked thus far;
- In the residential sector, Mombasa recorded average rental yields of 5.1%, higher than Nakuru’s 4.2%, Nyeri’s 4.1%, and Nairobi’s 5.4% and lower than Kisumu which recorded 5.2%
- In the office sector, Mombasa recorded the least yields of 5.1%, compared to Nakuru, Kisumu, Nyeri and Nairobi with 7.2%, 8.4%, 13.0% and 9.3%, respectively
- In the retail sector, Mombasa recorded average rental yields of 8.3%, which is higher than Nakuru’s 5.8%, albeit lower than Nairobi’s 9.6%, and Kisumu with 9.9%
Below is a graph showing the summary;
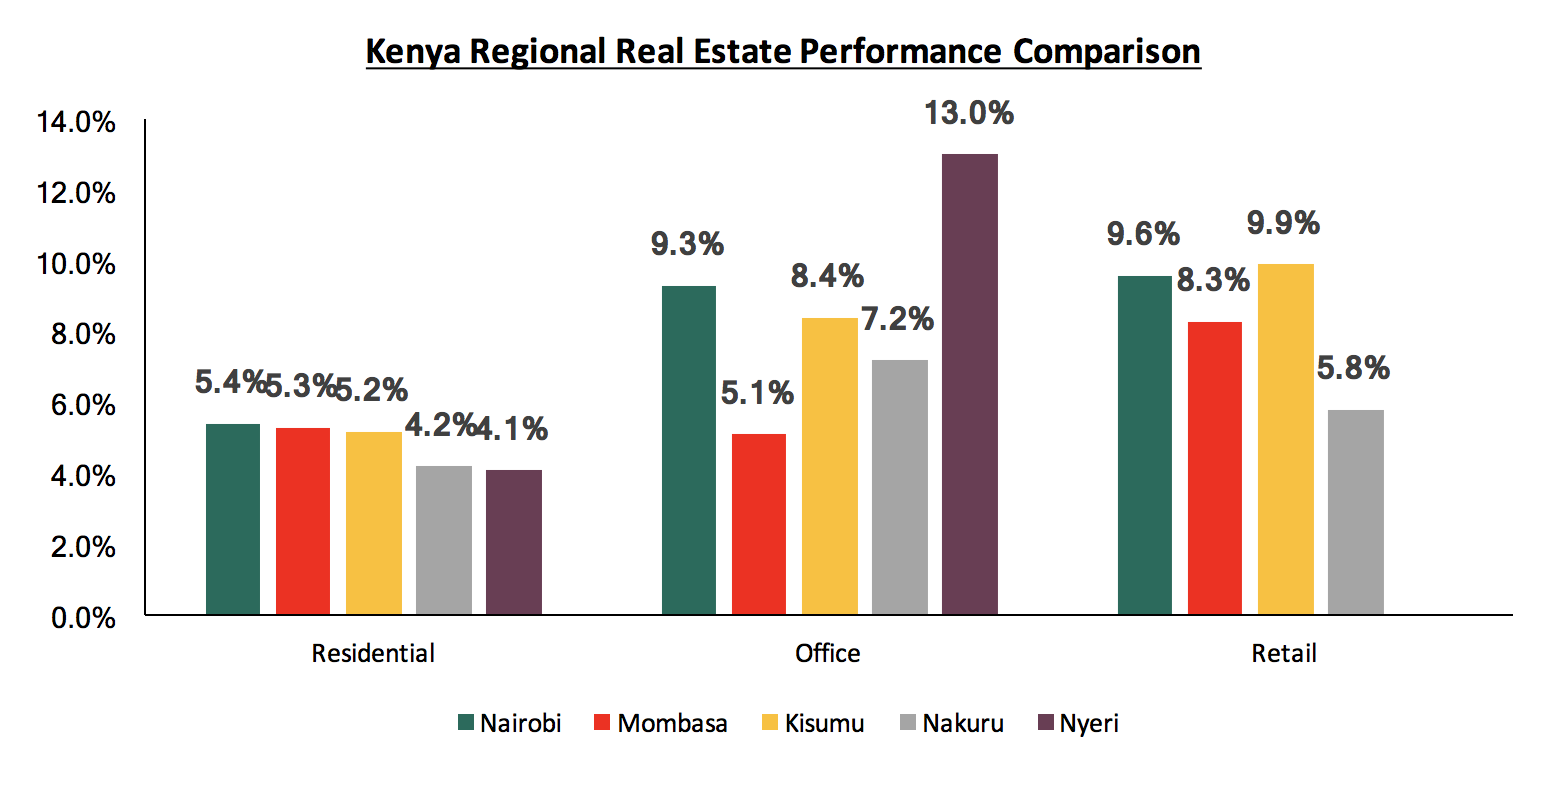
*Nyeri’s Performance is as of August 2017
Source: Cytonn Research
6. Investment Opportunity & Outlook
In conclusion, we have analyzed and identified the investment opportunity in Mombasa County based on our research then given our outlook classified as Neutral, Negative or Positive as shown below;
|
Mombasa Investment Opportunity Summary & Outlook |
||||
|
Theme |
Performance (2016) |
Performance (2018) |
Investment Opportunity |
Outlook |
|
Residential |
Average rental yields came in at 6.3%, with average capital appreciation 1.6%, thus average total returns of 7.9% |
Apartments in Mombasa attained returns of 7.2%, with average rental yields and price appreciation of 5.1% and 2.1%, respectively |
The highest returns to investors are in the upper mid-end segment especially within upcoming areas such as Kizingo and Tudor. However, investors should carry out thorough research to determine demand as some areas could be saturated
|
|
|
Commercial Office |
2016 recorded average occupancy rates of 64.0% with rental yields of 5.9% |
The occupancy rates came in at 65.8% on average, with rental yields of 5.1% |
The office sector is set to continue on a decline due to reluctance of investors to relocate business to the region, and the local population’s limited ability to occupy investment grade office developments |
|
|
Retail |
The market recorded average occupancy rates of 82.0%, with average rental yields of 8.9% |
The occupancy rates came in at 96.3% on average, with rental yields of 8.3% |
Malls in Mombasa are more concentrated in one area, i.e. Nyali and its close environs. Thus, the opportunity is in select residential areas that are have no mall space
|
|
|
Land |
Average price per acre for development land was Kshs 109.4 mn |
Average price per acre for development land is Kshs 115.4 mn, with a 2-year CAGR of 12.6%, driven by the ongoing infrastructural developments |
Site and service schemes in areas earmarked for infrastructural developments especially the Mombasa West Integrated Urban Roads Network Project
|
|


Source: Cytonn Research
Out of the four themes that we have looked at, two have a neutral outlook, i.e. residential and retail sectors, the office sector has a negative outlook, while the land sector has a positive outlook. Thus, our outlook for the region is neutral. For investors, the opportunity is in (a) retail sector in undersupplied areas such as Tudor on account of (i) increasing middle class, (ii) lack of supply to serve the upcoming middle-class residential estates such as Tudor and Kizingo, and (b) site service schemes in areas experiencing the ongoing infrastructural developments such as the Mombasa West Integrated Urban Roads Network.
For the full report, please see (link)

- Talk to us
- Kenya
- P.O Box 20695 - 00200, Nairobi, Kenya
- Cell +254709101200
- Tel +254709101200
- WhatsApp +254741676635
- United States
- +254709101200
- DOWNLOAD OUR APP
-


- Kenya
- 8th Floor, Pinetree Plaza, Kaburu Drive, Ngong Road, Nairobi, Kenya
- USA
- Suite 1150, 1775 Eye Street NW, USA, Washington DC 20006, USA
- Investments
- High Yield
- Private Equity
- Real Estate
- Real Estate
- RiverRun Estates
- Cytonn Towers
- The Ridge
- Taraji Heights
- The Alma