Nakuru Real Estate Investment Opportunity, & Cytonn Weekly #30/2018
By Cytonn Research Team, Aug 12, 2018
Executive Summary
Fixed Income
T-bills were undersubscribed during the week, with the overall subscription rate coming in at 57.4%, a decline from 60.4% recorded the previous week. Yields on the 91-day paper increased by 10 bps, to 7.7% from 7.6% the previous week, while yields on the 182-day declined by 10 bps to 9.0% from 9.1% the previous week. The yield on the 364-day paper remained unchanged at 10.0%. The International Monetary Fund (IMF) released a press statement on the recently completed review of the USD 1.5 bn stand-by credit and precautionary facility. The IMF stated that their mission to assess the Kenyan economy achieved significant progress, but it remains uncertain if Kenya’s access to the stand-by facility will be extended as talks with the government are set to continue in the coming week, with the IMF team in Kenya having to submit final comments to the IMF Board by the end of August 2018
Equities
During the week, the equities market was on an upward trend, with NASI, NSE 20 and NSE 25 gaining 1.0%, 0.1% and 2.1%, respectively. For the last twelve months (LTM), NASI, NSE 20 and NSE 25 have gained 9.1%, (15.1%), and 4.5%, respectively, with year to date (YTD) gains of 1.0%, (10.7%) and 5.6%, respectively. Stanbic Holdings released H1’2018 results, recording core earnings per share growth of 104.5%, driven primarily by a 21.9% increase in total operating income, coupled with a 14.0% decrease in total operating expenses
Private Equity
In the financial services sector, Mauritius based African Rainbow Capital, an investment holding company that invests in financial services businesses, has agreed to acquire the remaining 90% stake in the Commonwealth Bank of South Africa Limited (CBSA), which trades as TymeDigital, from the Commonwealth Bank of Australia for an undisclosed amount. African Rainbow Capital currently holds a 10% stake in TymeDigital, with the Commonwealth Bank of Australia holding the remaining 90%;
Real Estate
This week, Kenya National Bureau of Statistics (KNBS) released its June issue of Leading Economic Indicators (LEI) indicating reduced activity in building and construction during H1’2018, and growth in the tourism sector. In the residential sector, the UN-Habitat advised the Kenyan Government to intervene through policies to help Savings and Credit Co-operative Organizations (SACCO’s) accelerate home ownership among low-income earners. In the commercial sector, Prism Towers, a 33-storey office block located in Upper hill, developed by Kings Developers Ltd, opened for occupancy. In the retail sector, Burger King, an American fast food franchise, announced opening of a new outlet at the Thika Road Mall (TRM) bringing its total count to four outlets in the country; the other outlets are at Nextgen Mall in South C, The Hub in Karen, and The Two Rivers Mall in Runda;
Focus of the Week
In line with our regional expansion strategy, we continue to assess investment opportunities in various Kenyan Counties, having already done reports for Nyeri Real Estate Investment Opportunity 2017 and Kisumu Real Estate Investment Opportunity 2018. This is to enable us diversify our portfolio of real estate investments for our clients. This week we focus on Nakuru Town, the headquarters of Nakuru County. The real estate sector in the town is nascent, with the town recording average rental yields of 6.1% p.a and an average capital appreciation of 8.8% p.a, resulting in a total return of 14.9%. The investment opportunity in the town is in Mixed Use Developments (MUDs), which record average rental yields of 8.9%, 2.8% points higher than the market average yields of 6.1%.
- CNN International featured Cytonn’s developments, The Alma and Amara Ridge, watch here.
- Johnson Denge, Senior Manager – Regional Markets, was on KTN News discussing the state of housing in the country. See Johnson here.
- Caleb Mugendi, Senior Investments Analyst, spoke to CNBC about capping of interest rates and the budget deficit. Watch Caleb here.
- Moses Njuguna, Distribution Unit Manager, was on Njata TV to discuss mitigating risk in investments. See Moses here.
- Dennis Memusi, IT Support Engineer was featured in The Daily Nation in an opinion piece about Digital Disruption in the Housing Industry. Read his article here.
- The Q2’2018 issue of our quarterly Sharp Cents Magazine, themed Sustainable Finance is out. Read the issue here or email clientservices@cytonn.com to get a copy
- The weekly workshops and site visits target both investors looking to invest in real estate directly and those interested in high yield investment products to familiarize themselves with how we support our high yields. Watch progress videos and pictures of The Alma, Amara Ridge, The Ridge, and Taraji Heights. Key to note is that our cost of capital is priced off the loan markets, where all-in pricing ranges from 16.0% to 20.0%, and our yield on real estate developments ranges from 23.0% to 25.0%, hence our top-line gross spread is about 6.0%. If interested in attending the site visits, kindly register here
- We continue to see very strong interest in our weekly Private Wealth Management Training (largely covering financial planning and structured products). The training is at no cost and is open only to pre-screened participants. We also continue to see institutions and investment groups interested in the training for their teams. The Wealth Management Training is run by the Cytonn Foundation under its financial literacy pillar. If interested in our Private Wealth Management Training for your employees or investment group please get in touch with us through wmt@cytonn.com. To view the Wealth Management Training topics, click here
- For recent news about the company, see our news section here
- We have 10 investment-ready projects, offering attractive development and buyer targeted returns of around 23.0% to 25.0% p.a. See further details here: Summary of Investment-Ready Projects
- We continue to beef up the team with ongoing hires for Senior Operations Manager, Operations Associate and Operations Analyst in Cytonn Group as well as Financial Advisors in Nairobi and Kisumu. Visit the Careers section on our website to apply.
- Cytonn Real Estate is looking for a 0.75-acre land parcel for a joint venture in Lavington, Karen or Kiambu Road. The parcel should be in a good location with frontage to a tarmac road. For more information or leads, email us at rdo@cytonn.com
T-Bills & T-Bonds Primary Auction:
T-bills were undersubscribed during the week, with the overall subscription rate coming in at 57.4%, a decline from 60.4% recorded the previous week due to tight liquidity, which the Central Bank of Kenya (CBK) attributed to seasonal low government spending at the beginning of the fiscal year. Yields on the 91-day paper increased by 10 bps, to 7.7% from 7.6% the previous week, while yields on the 182-day paper declined by 10 bps to 9.0% from 9.1% the previous week. The yield on the 364-day paper remained unchanged at 10.0%. The acceptance rate for T-bills remained unchanged at 96.8%, with the government accepting Kshs 13.3 bn of the Kshs 13.8 bn worth of bids received. The subscription rate for the 91-day and 364-day papers improved to 15.1% and 111.1% from 14.2% and 87.9% the previous week, respectively, while the subscription rate for the 182-day paper declined to 20.5% from 51.5% the previous week. The 364-day paper continued to record the highest performance attributed to the scarcity of newer short-term primary bonds, as the government has been issuing longer tenor bonds in a bid to lengthen its debt maturity profile, leaving investors to settle for the 364-day paper.
For the month of August 2018, the Kenyan Government has issued a new 10-year Treasury bond (FXD 1/2018/10) with a market-determined coupon rate, in a bid to raise Kshs 40.0 bn for budgetary support. The government had been issuing longer-dated bonds in a bid to lengthen the debt maturity profile, which has been declining with the average term to maturity for all government securities hitting 4.4-years as at April 2018.The government has not achieved much in lengthening their liability profile mainly due to the poor performance of the longer dated bonds in the auction market. We attribute the low-performance rate to the relatively flat yield curve on the long-end, making it relatively unattractive to hold longer-term bonds considering the current uncertainties in the interest rate environment. The sale period for the 10-year bond ends on 21st August, and we shall give our view on a bidding range in next week’s report.
Liquidity:
The average interbank rate increased to 8.3%, from 7.2% the previous week, while the average volumes traded in the interbank market declined by 7.7% to Kshs 11.4 bn, from Kshs 12.4 bn the previous week. The increase in the average interbank rate points to the continued decline in liquidity, which the Central Bank of Kenya has attributed to seasonal low government spending at the beginning of the fiscal year.
Kenya Eurobonds:
According to Bloomberg, the yield on the 5-Year and 10-year Eurobonds issued in 2014 increased by 0.5% points and 0.3% points to 4.5% and 6.9% from 4.0% and 6.6% the previous week, respectively. Since the mid-January 2016 peak, yields on the Kenya Eurobonds have declined by 4.3% points and 2.8% points for the 5-year and 10-year Eurobonds, respectively, an indication of the relatively stable macroeconomic conditions in the country. Key to note is that these bonds have 1-year and 6-years to maturity.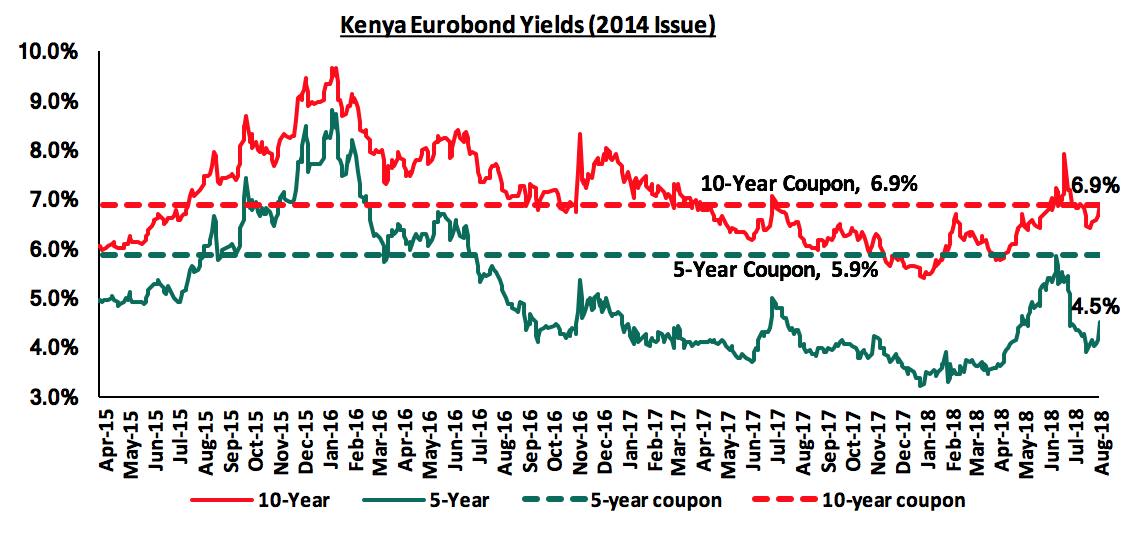
For the February 2018 Eurobond issue, during the week, the yields on both the 10-year and 30-year Eurobonds increased by 0.3% points each, to 7.5% and 8.6% from 7.2% and 8.3% the previous week, respectively. Since the issue date, the yields on the 10-year and 30-year Eurobonds have increased by 0.2% points and 0.3% points, respectively.
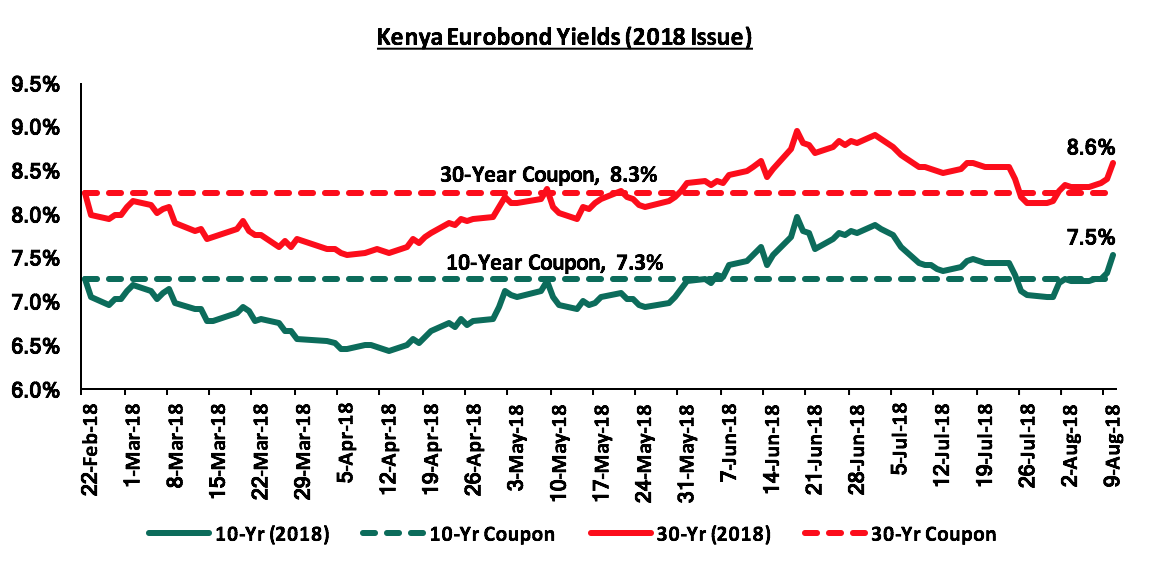
Key to note is that yields on all the Eurobond issues were on the rise this week, which the CBK attributed to the adjustments of global yields to normalisation of monetary policies in the advanced economies.
The Kenya Shilling:
During the week, the Kenya Shilling lost marginally to the US Dollar, to close at Kshs 100.4 from Kshs 100.3 the previous week, supported by inflows from offshore investors that matched the thin dollar demand by importers, amidst tightened liquidity in the money markets. The Kenyan Shilling has gained by 2.7% year to date and in our view the shilling should remain relatively stable against the dollar in the short term, supported by:
- The narrowing of the current account deficit to 5.8% in the 12-months to June 2018, from 6.3% in March 2018, attributed to improved agriculture exports, and lower capital goods imports following the completion of Phase I of the Standard Gauge Railway (SGR) project,
- Stronger inflows from principal exports, which include coffee, tea and horticulture, which increased by 10.8% during the month of May to Kshs 24.3 bn from Kshs 21.9 bn in April, with the exports from coffee, tea and horticulture improving by 11.0%, 19.1% and 2.0% m/m, respectively,
- Improving diaspora remittances, which increased by 71.9% y/y to USD 266.2 mn from USD 154.9 mn in June 2017, and 4.9% m/m, from USD 253.7 mn in May 2018, with the largest contributor being North America at USD 130.1 mn, attributed to (a) recovery of the global economy, (b) increased uptake of financial products by the diaspora due to financial services firms, particularly banks, targeting the diaspora, and (c) new partnerships between international money remittance providers and local commercial banks making the process more convenient, and,
- High forex reserves, currently at USD 8.7 bn (equivalent to 5.8-months of import cover) and the USD 1.5 bn stand-by credit and precautionary facility by the IMF, still available until September 2018.
Highlights of the Week:
The International Monetary Fund (IMF) released a press statement on the recently completed review of Kenya with regards to the USD 1.5 bn stand-by credit and precautionary facility. The IMF stated that their mission to assess the Kenyan economy achieved significant progress, but it remains uncertain if Kenya’s access to the standby facility will be extended as talks with the government are set to continue in the coming week with the IMF team expected to submit final report to the IMF Board by the end of August. This was the second review since the initial approval of the credit facilities on 14th March 2016. The reviews are normally conducted on an annual basis but the second and third review had been pending since the conclusion of the 1st review on 25th January 2017, since the fiscal balance, which is a performance criterion had not been met as at the end of December 2016 and June 2017. This was attributed to the shortfall in revenues and pressure on government spending which was partly due to the challenging operating environment. An understanding could not be reached on corrective measures the Government was to undertake to tackle the problems on account of the prolonged electioneering period thus the request for a 6-months extension, which was granted on March 12th, 2018. In their press release with regards to the second review, the IMF noted that:
- Kenya’s economy had continued to perform well with the GDP having expanded by 5.7% in Q1’2018, up from 4.9% growth experienced in Q1’2017, with the growth being driven by strengthened investor confidence following the conclusion of the prolonged electioneering period, improved weather conditions in 2018 with the country having experienced a drought in 2017 and a recovery in tourism, which can be evidenced by an increase in the total number of visitors arriving through Jomo Kenyatta International Airport and Moi International Airports, that increased by 2.1% to 76,608 in June 2018 from 75,028 in May 2018, despite a 4.4% decline y/y from 80,121 in June 2017, as per data from Kenya National Bureau of statistics (KNBS),
- Inflation has remained within the 2.5% - 7.5% government set target since July 2017. We expect inflation to remain within target in 2018 despite the expectations of upward pressure in H2’2018, partly due to the base effect, and the expected rise in fuel and transport prices with the introduction of 16.0% VAT on petroleum products as from September 2018 and other tax reforms proposed under the Finance Bill 2018,
- Kenya had managed to meet the IMF’s program fiscal target for the FY2017/2018, with the budget deficit for the 2017/2018 fiscal year coming in at Kshs 614.6 bn (equivalent to 7.0% of GDP), which is a significant narrowing from 9.0% of GDP previously,
- The current account deficit has started to adjust in 2018 after widening to 6.7% of GDP in 2017 from 5.2% in 2016, which was mainly driven by higher food imports and weaker agricultural exports due to the drought experienced during the year, coupled with higher fuel imports owing to rising global oil prices. The lower current account deficit so far in 2018, which narrowed to 5.8% in the 12 months to June 2018 from 6.3% in March 2018, has been attributed to improved agriculture exports, and lower capital goods imports following the completion of Phase I of the SGR project, and,
- The Kenyan Shilling has remained resilient against major currencies, while foreign exchange reserves have been relatively high currently standing at about USD 8.7 bn (equal to 5.8-months of projected imports for 2018).
The existing program is set to expire on September 14th 2018 and it remains uncertain if Kenya’s access to the stand-by facility will be extended. Kenya has not tapped into the facility meant to cushion the country from unforeseen negative external shocks that could put pressure on Kenya’s balance of payments since its initial approval as its external position has remained strong, supported by relatively high levels of foreign exchange reserves currently at USD 8.7 bn (equivalent to 5.8-months of import cover), coupled with improving diaspora remittances and exports.
The treasury is seeking to recruit debt management experts who will be tasked with providing guidance on determination of borrowing ceilings for national and county governments, as well as preparing proposals for debt restructuring and liaising with the Central Bank of Kenya (CBK) and other Treasury departments for effective debt management. The move is in response to the rising concerns over debt sustainability of the country as the government continues to embark on measures to improve debt management, with Kenya’s public debt to GDP having hit 55.6% by the end of 2017, 5.6% above the East African Community (EAC) Monetary Union Protocol, the World Bank Country Policy and Institutional Assessment Index, and the IMF threshold of 50.0%. Total domestic debt currently stands at Kshs 2.5 tn, while total external debt stood at Kshs 2.5 tn as at March 2018. The move is in line with the government’s effort of reducing the debt to GDP ratio to below 50.0% under its fiscal consolidation plan which it projects to narrow the fiscal deficit to 5.7% of GDP in the FY’2018/19 from 7.2% of GDP in the FY’2017/18 and further to around 3.0% of GDP by FY’2021/22 by increasing revenue collection hence reducing the reliance on debt financing.
Rates in the fixed income market have been on a declining trend, as the government continues to reject expensive bids as it is currently 54.8% ahead of its pro-rated borrowing target for the current financial year, having borrowed Kshs 56.7 bn against a prorated target of Kshs 36.6 bn. The 2018/19 budget gives a domestic borrowing target of Kshs 271.9 bn, 8.6% lower than the 2017/2018 fiscal year’s target of Kshs 297.6 bn, which may result in reduced pressure on domestic borrowing. However, the National Treasury has proposed to repeal the interest rate cap, which if repealed can result in an upward pressure on interest rates, as banks would resume pricing of loans to the private sector based on their risk profiles. With the cap still in place, we maintain our expectation of stability in the interest rate environment. With the expectation of a relatively stable interest rate environment, our view is that investors should be biased towards medium-term fixed-income instruments.
Market Performance:
During the week, the equities market was on an upward trend, with NASI, NSE 20 and NSE 25 gaining 1.0%, 0.1% and 2.1%, respectively; taking their YTD performance to 1.0%, (10.7%) and 5.6%, for NASI, NSE 20 and NSE 25, respectively. This week’s performance was driven by a rally in the banking stocks as the Q2’2018 earnings season approaches; with KCB Group, Equity Holdings, Barclays Bank and Standard Chartered gaining 6.3%, 4.6%, 3.4% and 2.5%, respectively. For the last twelve months (LTM), NASI, NSE 20 and NSE 25 have gained 9.1%, (15.1%) and 4.5%, respectively.
Equities turnover decreased by 44.0% this week to USD 17.3 mn from USD 30.9 mn the previous week, with foreign investors dominating market with a net selling position. We expect the market to remain resilient this year supported by positive investor sentiment, as investors take advantage of the attractive stock valuations in select counters.
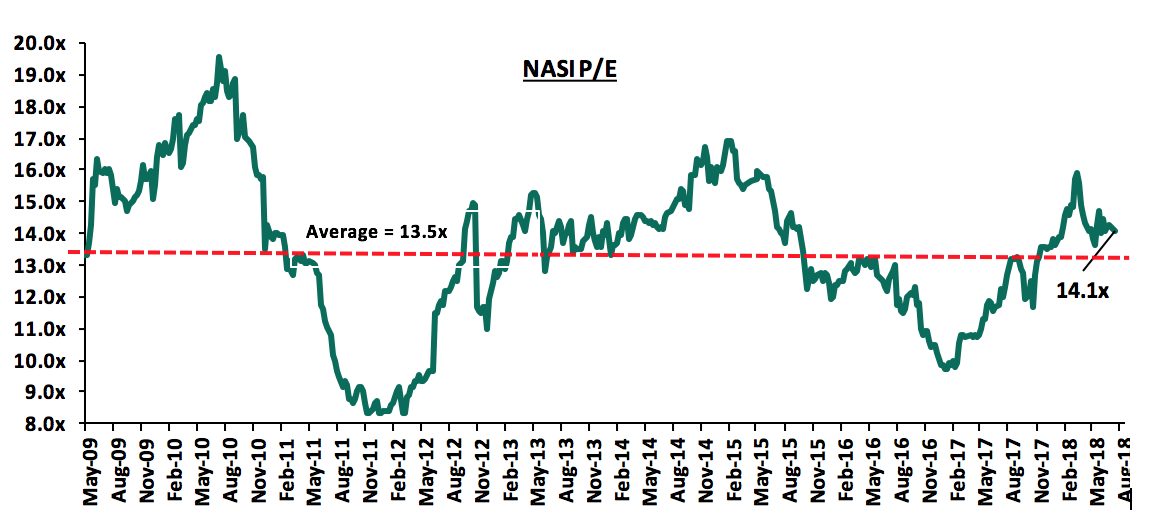
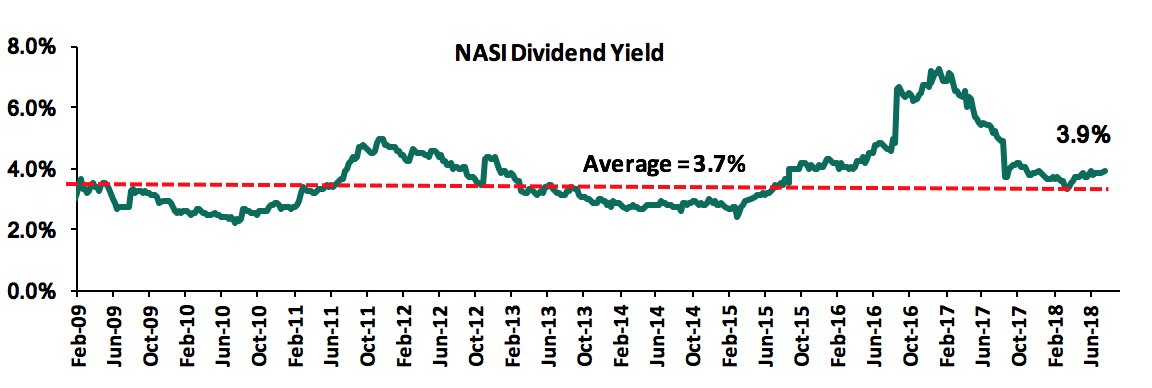
The market is currently trading at a price to earnings ratio (P/E) of 14.1x, which is 4.4% above the historical average of 13.5x, and a dividend yield of 3.9%, which is higher than the historical average of 3.7%. The current P/E valuation of 14.1x is 43.9% above the most recent trough valuation of 9.8x experienced in the first week of February 2017, and 69.9% above the previous trough valuation of 8.3x experienced in December 2011. The charts below indicate the historical P/E and dividend yields of the market.
Stanbic Holdings released H1’2018 results during the week;
Stanbic Holdings released H1’2018 results, with core earnings per share increasing by 104.5% to Kshs 9.0 from Kshs 4.4 in H1’2017, exceeding our expectation of a 14.6% growth to Kshs 5.0. The performance was driven by a 21.9% increase in total operating income, coupled with a 14.0% decrease in the total operating expenses. Growth in operating income was largely driven by a 34.0% increase in Non-Funded Income (NFI); and the decrease in operating expenses was largely driven by an 86.7% reduction in LLP.
Highlights of the performance from H1’2017 to H1’2018 include:
- Total operating income increased by 21.9% to Kshs 11.2 bn in H1’2018 from Kshs 9.2 bn in H1’2017. This was due to a 34.0% increase in Non-Funded Income (NFI) to Kshs 5.6 bn from Kshs 4.2 bn in H1’2017, coupled with an 11.9% increase in Net Interest Income (NII) to Kshs 5.6 bn from Kshs 5.0 bn in H1’2017,
- Total interest income increased by 15.4% to Kshs 9.1 bn from Kshs 7.9 bn in H1’2017. The interest income on loans and advances increased by 15.3% to Kshs 6.7 bn from Kshs 5.8 bn in H1’2017. Interest income on government securities increased by 20.2% to Kshs 2.3 bn in H1’2018 from Kshs 1.9 bn in H1’2017. The yield on interest earning assets however declined to 11.3% in H1’2018 from 11.8% in H1’2017, due to the relatively faster growth in the low-yielding government securities by 18.1% to Kshs 157.6 bn, from Kshs 133.5 bn in H1’2017,
- Interest expense increased by 21.7% to Kshs 3.5 bn from Kshs 2.9 bn in H1’2017, following a 27.7% increase in the interest expense on customer deposits to Kshs 2.2 bn from Kshs 1.7 bn in H1’2017. Other interest expenses increased by 24.1% to Kshs 0.32 bn in H1’2018 from Kshs 0.26 bn in H1’2017. The cost of funds thus increased slightly to 3.1% from 3.0% in H1’2017. Net Interest Margin declined to 4.9% from 5.3% in H1’2017,
- Non-Funded Income increased by 34.0% to Kshs 5.6 bn from Kshs 4.2 bn in H1’2017. The growth in NFI was largely driven by a 163.0% increase in other income to Kshs 1.6 bn from Kshs 0.6 bn in H1’2017, and a 12.0% increase in foreign exchange trading income to Kshs 1.7 bn from Kshs 1.5 bn in H1’2017. Fees and commissions on loans however declined by 25.7% to Kshs 0.1 bn from Kshs 0.2 bn in H1’2017. The current revenue mix stands at 50:50 funded to non-funded income as compared to 55:45 in H1’2017. The proportion of non-funded income to total revenue increased owing to the faster growth in NFI as compared to NII,
- Total operating expenses decreased by 14.0% to Kshs 6.0 bn from Kshs 7.0 bn, largely driven by an 86.7% decrease in Loan Loss Provisions (LLP) to Kshs 0.3 bn in H1’2018 from Kshs 1.9 bn in H1’2017. Staff costs increased by 16.2% to Kshs 2.8 bn in H1’2018 from Kshs 2.4 bn in H1’2017. Other operating expenses also increased by 1.3% to Kshs 1.9 bn in H1’2018 from Kshs 1.8 bn in H1’2017,
- The cost to income ratio improved to 53.5% from 75.9% in H1’2017. Without LLP, the Cost to income ratio also improved to 51.3% from 56.1% in H1’2017,
- Profit before tax increased by 135.3% to Kshs 5.2 bn, up from Kshs 2.2 bn in H1’2017. Profit after tax increased 104.5% to Kshs 3.6 bn in H1’2018 from Kshs 1.7 bn in H1’2017,
- The directors declared an interim dividend of Kshs 2.3 per share, which is 80.0% above the Kshs 1.3 per share interim dividend declared in H1’2017. We expect a final dividend per share of Kshs 4.0, taking the total dividend for 2018 to Kshs 6.3 per share, translating to a dividend yield of 6.4%,
- The balance sheet recorded an expansion as total assets increasing by 19.0% to Kshs 278.8 bn from Kshs 234.3 bn in H1’2017. This growth was largely driven by a 15.4% increase in net loans and advances to Kshs 154.0 bn from Kshs 133.5 bn in H1’2017, coupled with a 26.9% increase in government securities to Kshs 87.0 bn from Kshs 68.6 bn in H1’2017,
- Total liabilities rose by 22.3% to Kshs 236.6 bn from Kshs 193.5 bn in H1’2017, driven by a 21.3% increase in total deposits to Kshs 215.8 bn from Kshs 177.9 bn in H1’2017. Deposits per branch increased by 21.3% to Kshs 8.3 bn from Kshs 6.8 bn in H1’2017,
- The faster growth in deposits as compared to loans led to a decline in the loan to deposit ratio to 71.4% from 75.1% in H1’2017,
- Gross non-performing loans increased by 62.7% to Kshs 10.6 bn in H1’2018 from Kshs 6.5 bn in H1’2017. Consequently, the NPL ratio deteriorated to 6.7% in H1’2018 from 4.7% in H1’2017 as NPLs grew faster than the loan book,
- Shareholders’ funds increased by 3.5% to Kshs 42.2 bn in H1’2018 from Kshs 40.8 bn in H1’2017.
- Stanbic Holdings is currently sufficiently capitalized with a core capital to risk weighted assets ratio of 15.6%, 5.1% above the statutory requirement. In addition, the total capital to risk weighted assets ratio was 18.3%, exceeding the statutory requirement by 3.8%. Adjusting for IFRS 9, the core capital to risk weighted assets stood at 14.7%, while total capital to risk weighted assets came in at 17.4%, indicating that the bank’s total capital relative to its risk-weighted assets decreased by 0.9% due to implementation of IFRS 9,
- Stanbic Holdings currently has a return on average assets of 2.4% and a return on average equity of 14.8%.
We expect the bank’s growth to be further driven by:
- Stanbic Bank’s NFI, which is above the industry average, coming in at 50.0%, which is above the industry average of 33.6%. Increased adoption of alternative channels by the customers will improve operational efficiency, as well as increase the bank’s transactional income. The bank is poised to see the commission and fee income from the online platforms increase in the future, as more customers increase their usage, and,
- The bank has adopted increased measures to improve its asset quality. This include; (i) launch of a collaborative curing between businesses and the remedial department, and (ii) outsourcing of collection of loans.
For more information, see our Stanbic Holdings H1’2018 earnings note.
Highlights of the Week:
HF Group is set to lay off some employees in a downsizing move that will see it merge some staff positions. The restructuring will result in a merger of jobs, redundancy and creation of new roles for its recently launched digital banking strategy. The lay-offs will target up to 9.0% of the workforce, which translates to about 36 employees as per the closing employee register of 400 staff in December 2017. The latest lay-off plans will bring the total number of employees laid off by HF Group to 112 in the last two years, since December 2016. The lender joins the growing list of financial institutions that have undertaken downsizing measures in the past two years, including KCB Group, Barclays Bank, Family Bank, Standard Chartered, National Bank, Sidian Bank and First Community Bank. The total number of lay-offs has risen to 1,642 employees since the amendment of the Banking Act (Amendment) 2015, that capped interest rates on loans at 4.0% above the benchmark CBR rate. Below is a summary of the banking sector restructuring since the introduction of the interest rate cap:
|
Kenya Banking Sector Restructuring |
|||
|
No. |
Bank |
Staff Lay-off |
Branches Closed |
|
1 |
Bank of Africa |
0 |
12 |
|
2 |
Barclays Bank |
301 |
7 |
|
3 |
Ecobank |
0 |
9 |
|
4 |
Equity Group |
400 |
7 |
|
5 |
Family Bank |
Unspecified |
0 |
|
6 |
First Community Bank |
106 |
0 |
|
7 |
KCB Group |
223 |
Unspecified |
|
8 |
National Bank |
150 |
0 |
|
9 |
NIC Group |
32 |
Unspecified |
|
10 |
Sidian Bank |
108 |
0 |
|
11 |
I&M Holdings |
0 |
Unspecified |
|
12 |
Standard Chartered |
300 |
4 |
|
13 |
HF Group |
112 |
0 |
|
Total |
1,732 |
39 |
|
The Central Bank of Kenya has proposed to introduce a Banking Sector Charter that will guide service provision in the sector. The Charter aims to instil discipline in the banking sector in order to make it responsive to the needs of the banked population. It is expected to facilitate a market-driven transformation of the Kenyan banking sector and bring about tangible benefits for Kenyans, specifically to increase access to affordable financial services for the unbanked and under-served population. In achieving its purpose, the Banking Sector Charter will be guided by the following objectives:
- To enhance the quality of financial services to the banked population that is negatively affected by the high prevailing interest rates,
- To create a roadmap that will guide in the development of a more resilient, competitive and dynamic financial system based on the four central pillars of the banking sector’s vision,
- To ensure that institutions proactively engage their customers in financial literacy and consumer education drives, to enhance customers’ financial knowledge and skills for them to make informed financial decisions,
- To provide the basis for the sector’s engagement with other stakeholders,
- To establish targets and quantified responsibilities with respect to each objective and outline processes for implementing the Charter as well as mechanisms to monitor and report on progress towards given goals which are aligned with Kenya Vision 2030,
- To ensure institutions develop and submit a time bound plan approved by the Board in compliance with the Charter for CBK’s monitoring purposes, and
- To ensure institutions submit quarterly reports to CBK on the progress of their implementation of the Charter by timelines determined by the CBK.
The achievement of the above objectives will be hinged on transformation of financial institutions around key areas such as; fairness, transparency, financial inclusion and access to financial services. The CBK is seeking input from the public, in line with the constitutional requirement for public participation in legislative and policy development. The public participation window is set to close on Friday 24th August, 2018. We are of the view that, if adopted, the Banking Sector Charter will go a long way towards removing the existing opacity in loan prices and promote the adoption of the risk-based loan-pricing framework in the event that the interest capping legislation is repealed by Parliament. However, we are even of the stronger view, as captured in our Focus Note titled “Rate Cap Review Should Focus More on Stimulating Capital Markets”, that the best way to bring discipline in the banking sector is to reduce banking sector dominance by promoting alternative products. In a developed economy, bank funding makes about only 40% of business funding, while in Kenya, it makes up 95% of business funding, meaning businesses are over reliant on bank funding. To stimulate competing products, we recommend the following measures:
- Legislation and policies to promote competing sources of financing should be the centrepiece of the repeal legislation:A lot of legislative action has focused on the banks, yet we also need legislation to promote competing products that will diversify funding sources, which will enable borrowers to tap into alternative avenues of funding that are more flexible and pocket-friendly. This can be done through the promotion of initiatives for competing and alternative products and channels, in order to make the banking sector more competitive. In developed economies, 40% of business funding comes from the banking sector, with 60% coming from non-bank institutional funding. In Kenya, 95% of all funding is from banks, with only 5% from non-bank institutional funding, showing that the economy is highly dominated by the banking sector and should have more alternative and capital market products for funding businesses. Alternative investment managers and the capital markets regulators need to look at how to enhance non-bank funding, such as high yield investment vehicles, some of which include High Yield Solutions. The products offer investors with cash to invest at a rate of about 18% to 19% per annum, equivalent to what the fund takers, such as real estate developers, would have to pay to get funds from the banks. Instead of a saver taking money to the bank and getting negligible returns, they can invest in a funding vehicle where the business would pay them the same 18% to 19% per annum that they would pay to get the same money from the bank. For the saver, it helps improve their rate from low rates, from 7% per annum at best, to as high as 18% per annum, and for the business seeking funding, it helps them access funding much faster to grow their business. Promoting alternative funding is also essential to the affordable housing piece of the “Big Four” government agenda, which requires capital markets funding,
- Consumer protection:The implementation of a strong consumer protection, education agency and framework, to include robust disclosures on cost of credit, free and accessible consumer education, enforcement of disclosures on borrowings and interest rates, while also handling issues of contention and concerns from consumers,
- Promote capital markets infrastructure: This is necessary in both regulated and private markets. The Capital Markets Authority (CMA) could aid in enhancing the capital markets’ depth by making it easier for new and structurally unique products to be introduced in the capital and financial markets. This may then enhance returns, with the benefits of reduced risk compared to the traditional conventional investment securities. This will then enable the diversion of the funds from banks into other investment vehicles that yield returns that far eclipse those obtained from deposits in banks, thereby leading to a faster capital formation in the economy. Advocacy groups, such as the East African Forum for Alternative Investments (EAFAI) and East Africa Venture Capital Association (EAVCA), should engage policy makers on the need for alternative and structured products as viable options to bank funding, hence reducing overreliance on bank funding and thereby spurring competition in the credit market, which would eventually lead to cheaper debt costs for borrowers,
- Addressing the tax advantages that banks enjoy:Level the playing field by making tax incentives available to banks to be also available to non-bank funding entities and capital markets products such as unit trust funds and private investment funds. For example, providing alternative and capital markets funding organizations with the same withholding tax incentives that banking deposits enjoy, of a 15% final withholding tax so that depositors don’t feel that they have to go to a bank to enjoy the 15% withholding tax; alternatively, normalize the tax on interest for all players to 30% to level the playing field,
- Consumer education: Educate borrowers on how to be able to access credit, the use of collateral, and the importance of establishing a strong credit history,
- The adoption of structured and centralized credit scoring and rating methodology: This would go a long way to eliminate any biases and inconsistencies associated with accessing credit. Through a centralized Credit Reference Bureau (CRB), risk pricing is more transparent, and lenders and borrowers have more information regarding credit histories and scores, thus enabling banks price customers appropriately, spurring increased access to credit, and,
- Increased transparency: This can be achieved through a reduction of the opacity in debt pricing. This will spur competitiveness in the banking sector and bring a halt to excessive fees and costs. Recent initiatives by the CBK and Kenya Bankers Association (KBA), such as the stringent new laws and cost of credit website being commendable initiatives.
In conclusion, a free market, where interest rates are set by market participants coupled with increased competition from non-bank financial institutions for funding, will see a more self-regulated environment where the cost of credit reduces, as well as increased access to credit by borrowers that have been shunned under the current regime. Consequently, a repeal needs to be comprehensive and contain the 7 elements above for it to be effective, but the centre-piece of the legislation should be stimulating capital markets to reduce banking sector dominance.
Equities Universe of Coverage:
Below is our Equities Universe of Coverage:
|
Banks |
Price as at 10/08/2018 |
w/w change |
YTD Change |
Target Price* |
Dividend Yield |
Upside/Downside** |
P/TBv Multiple |
||
|
NIC Bank*** |
34.8 |
0.7% |
3.0% |
54.1 |
2.9% |
59.7% |
0.8x |
||
|
Ghana Commercial Bank*** |
5.2 |
1.4% |
2.4% |
7.7 |
7.5% |
58.8% |
1.2x |
||
|
Zenith Bank*** |
23.6 |
(1.0%) |
(8.0%) |
33.3 |
11.3% |
51.0% |
1.0x |
||
|
I&M Holdings*** |
115.0 |
0.0% |
10.6% |
169.5 |
3.0% |
50.4% |
1.2x |
||
|
Diamond Trust Bank*** |
197.0 |
(1.0%) |
2.6% |
280.1 |
1.3% |
42.1% |
1.1x |
||
|
Union Bank Plc |
5.9 |
0.0% |
(25.0%) |
8.2 |
0.0% |
39.3% |
0.6x |
||
|
KCB Group*** |
51.0 |
6.3% |
19.3% |
60.9 |
6.3% |
33.1% |
1.5x |
||
|
Ecobank |
8.3 |
0.6% |
9.2% |
10.7 |
0.0% |
30.1% |
2.3x |
||
|
CRDB |
160.0 |
0.0% |
0.0% |
207.7 |
0.0% |
29.8% |
0.5x |
||
|
UBA Bank |
9.5 |
0.0% |
(8.3%) |
10.7 |
15.9% |
29.1% |
0.6x |
||
|
Barclays |
12.1 |
3.4% |
26.0% |
14.0 |
8.5% |
28.2% |
1.5x |
||
|
HF Group*** |
8.0 |
(5.3%) |
(23.1%) |
10.2 |
3.8% |
24.5% |
0.3x |
||
|
Co-operative Bank |
17.2 |
1.5% |
7.5% |
19.7 |
4.7% |
20.9% |
1.5x |
||
|
Equity Group |
51.5 |
4.6% |
29.6% |
55.5 |
4.1% |
16.8% |
2.5x |
||
|
Stanbic Bank Uganda |
33.0 |
0.8% |
21.1% |
36.3 |
3.6% |
14.3% |
2.1x |
||
|
CAL Bank |
1.2 |
(3.1%) |
13.9% |
1.4 |
0.0% |
10.2% |
1.1x |
||
|
Bank of Kigali |
290.0 |
0.0% |
(3.3%) |
299.9 |
4.8% |
8.2% |
1.6x |
||
|
Access Bank |
10.0 |
0.0% |
(4.3%) |
9.5 |
4.0% |
(1.0%) |
0.7x |
||
|
Guaranty Trust Bank |
39.0 |
(2.6%) |
(4.3%) |
37.2 |
6.0% |
(1.1%) |
2.3x |
||
|
Standard Chartered |
205.0 |
2.5% |
(1.4%) |
184.3 |
6.3% |
(1.6%) |
1.6x |
||
|
Stanbic Holdings |
98.0 |
7.1% |
21.0% |
85.9 |
6.4% |
(7.2%) |
1.1x |
||
|
Bank of Baroda |
140.0 |
0.0% |
23.9% |
130.6 |
1.8% |
(4.9%) |
1.2x |
||
|
SBM Holdings |
7.0 |
(5.9%) |
(6.9%) |
6.6 |
4.0% |
(7.5%) |
1.1x |
||
|
Stanbic IBTC Holdings |
49.4 |
(0.9%) |
18.9% |
37.0 |
1.2% |
(24.5%) |
2.6x |
||
|
Standard Chartered |
26.1 |
0.2% |
3.2% |
19.5 |
0.0% |
(25.2%) |
3.3x |
||
|
FBN Holdings |
9.6 |
(4.0%) |
9.1% |
6.6 |
2.5% |
(31.2%) |
0.6x |
||
|
National Bank |
6.0 |
3.4% |
(35.8%) |
2.8 |
0.0% |
(51.7%) |
0.4x |
||
|
Ecobank Transnational |
21.2 |
0.2% |
24.4% |
9.3 |
0.0% |
(56.0%) |
0.8x |
||
|
*Target Price as per Cytonn Analyst estimates |
|||||||||
|
**Upside / (Downside) is adjusted for Dividend Yield |
|||||||||
|
***Banks in which Cytonn and/or its affiliates holds a stake. For full disclosure, Cytonn and/or its affiliates holds a significant stake in NIC Bank, ranking as the 5th largest shareholder ****Stock prices indicated in respective country currencies |
|||||||||
We are “NEUTRAL” on equities for investors with a short-term investment horizon since the market has rallied and brought the market P/E slightly above its’ historical average. However, pockets of value exist, with a number of undervalued sectors like, financial services, which provide an attractive entry point for long-term investors, and with expectations of higher corporate earnings this year, we are “POSITIVE” for investors with a long-term investment horizon.
Mauritius based African Rainbow Capital, an investment holding company that invests in financial service entities, has agreed to acquire 90% stake in the Commonwealth Bank of South Africa Limited (CBSA), which trades as TymeDigital, from the Commonwealth Bank of Australia. African Rainbow Capital currently holds a 10% stake in TymeDigital, whilst the Commonwealth Bank of Australia holds the remaining 90%.
Commonwealth Bank of Australia bought Tyme (Take Your Money Everywhere), a South African FinTech business, in 2015. TymeDigital currently uses self-service kiosks and mobile phones to enable for the authentication of an individual, verification of address details, which then allows them to transfer money, easily, and within minutes to other TymeDigital accounts, with a daily limit of a minimum transaction amount of Kshs 7.2 (Zar 1.0) and a maximum of Kshs 35,761.6 (Zar 5,000.0). TymeDigital operates the money transfer service in partnership with Pick n Pay and Boxer Stores in South Africa and has more than 200‚000 customers using the service. TymeDigital by CBSA, which received a bank operating licence from the South African Reserve Bank in 2017, aims to provide affordable and accessible banking services through a growing network of partners such as Pick n Pay and Boxer Stores, who have a distribution network of 750 stores across South Africa. Increasing awareness about financial services through financial education is an essential part of its plans to grow the market in South Africa and win customers. Their targeted client segments include; the unbanked and underserved clients as well as small and medium enterprises. Competitive technology allows the bank to on-board clients with greater ease relative to its competitors and maintain bank charges at more affordable as compared to what SA banking clients pay in general.
Sub-Saharan Africa has a fast-growing tech start-up ecosystem, which plays an increasingly important role in the development of home-grown digital content and services. Mobile is a key factor in the region’s start-ups ecosystem. Many tech start-ups now use the technology as the primary platform to create solutions that address various socioeconomic challenges such as financial inclusion.
Private equity investments in Africa remains robust as evidenced by the increasing investor interest, which is attributed to; (i) rapid urbanization, a resilient and mushrooming middle class and increased consumerism, (ii) the attractive valuations in Sub Saharan Africa’s private markets compared to its public markets, (iii) the attractive valuations in Sub Saharan Africa’s markets compared to global markets, and (iv) better economic projections in Sub-Sahara Africa compared to global markets. We remain bullish on PE as an asset class in Sub-Sahara Africa. Going forward, the increasing investor interest and stable macro-economic environment will continue to boost deal flow into African markets.
Industrial Report:
During the week, The Kenya National Bureau of Statistics (KNBS) released its June issue of Leading Economic Indicators (LEI), which showed a decline in activity in the building and construction sector in H1’2018 and slight growth in the tourism and hospitality sectors. The key take-outs were as follows:
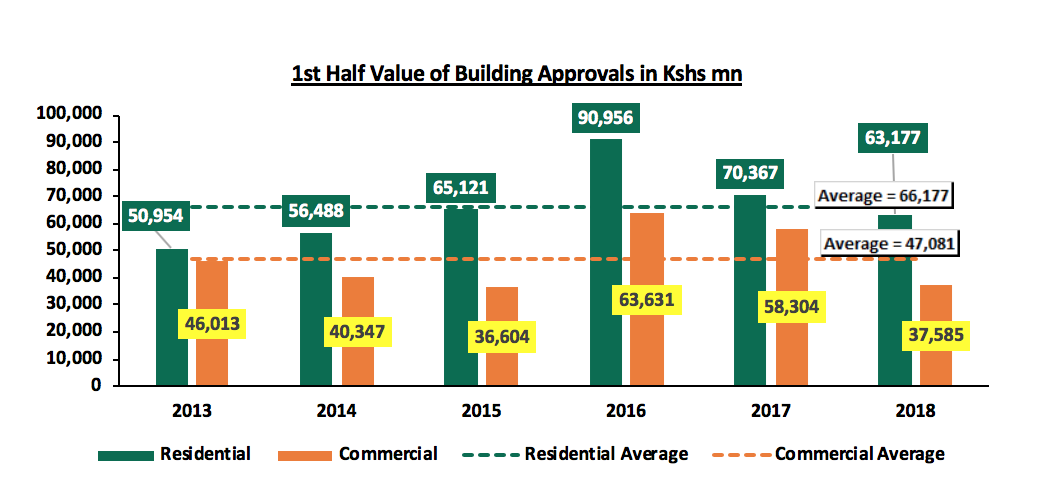
- The value of building approvals at the Nairobi City Council in H1’2018 came in at Kshs. 100.8 bn, 21.7% lower than the total value of approvals recorded in H1’2017 of Kshs 128.7 bn. The drop is primarily attributable to the generally slower issuance of approvals by the current Nairobi County Government; and in some cases like April 2018, there was non-issuance of approvals,
- The value of approvals for commercial developments declined at a significantly higher rate of 35.5% to Kshs 37.6 bn from Kshs 58.3 bn in H1’2017 in comparison to the 10.2% drop for residential developments to Kshs 63.2 bn from Kshs 70.4 bn in H1’2017, this we attribute partly to increased competition especially in the office market with an oversupply of 4.7 mn SQFT as at 2017, therefore giving buyers a bargaining power and leading to lower returns for developers; however a 35.5% drop is worrying considering the overall improvement in the economic environment in 2018. We have compared the annual change during the first half over the last 5-years and we found that the value of approvals for commercial developments has been declining y/y except in 2016 when the approvals increased by 73.8%, as indicated in the table below. It is likely that the decline is in response to the increased supply and slow uptake of the new completions especially in the office sector. On the other hand, excluding April, approvals for residential developments in H1’2018 have been higher in comparison to 2017 on account of increased focus on development of affordable housing since its inclusion among the 4 key pillars of economic growth for Kenya by the Jubilee Government during the 5-year period till 2022,
 Source: KNBS
- Cement production came in at 2.8 mn tonnes in H1’2018, a 10.0% decline from 3.2 mn tonnes in H1’2017, while consumption stood at 2.7 mn tonnes in H1’ 2018, a 7.4% decline from 2.9 mn tonnes in H1’2017. This decrease is largely attribute to the slow-down in construction activity during H1’2018 and the effects of reduced credit supply in the market, and,
- International arrivals on the other hand, recorded a 0.9% increase coming in at 443,950 in H1’2018 compared to 439,807 H1’2017, the increase in arrivals in the country has driven by; i) restoration of political calm, ii) the revision of negative travel advisories, warning international citizens, e.g. from the United States against visiting Kenya, iii) positive reviews from travel advisories such as Trip Advisor who ranked Nairobi as the 3rd best place to visit in 2018, and iv) improved hotel standards with the entry of global hotel brands like Hilton Garden Inn along Mombasa Road, DoubleTree, a brand by Global chain Hilton Group along Ngong Road, and Swiss hotelier while existing hotels refurbish their developments some including Hilton located within Nairobi CBD along Mama Ngina street and Sarova Panafric along Valley road.
We expect increased supply, primarily in the residential sector with a focus on housing for the lower-middle and low-income segments of the market, whereas the commercial sector is likely to witness a slow-down in supply as the market grapples with surplus stock and as newly completed buildings struggle to reach optimal occupancies. The growth in tourism is likely to boost the hospitality sector as increased international arrivals will create demand for accommodation and conferencing space.
Residential Sector:
In the residential sector, affordable housing continues to draw a lot of interest as various stakeholders push for policies that would make the initiative a success. This week, the UN – Habitat advised the Kenyan Government to intervene through policies to ensure that the 23,000 Savings and Credit Co-operative Organizations (SACCO’s), who have close to Kshs 1 trillion in savings, have access to serviced land, professional expertise, and reduced tax on building materials that would facilitate provision of mass affordable housing to low income earners. If implemented, these policies will create an enabling environment for SACCO’s and other players on the supply side to produce low-income housing and thus contribute towards the achievement of the Jubilee Government’s Big 4 Agenda. Policies that the government has already put in place are mainly geared towards facilitating home-ownership and offtake, they include: i) the Income Tax Act, which will allow the buyers get a 15.0% tax relief to a maximum of Kshs 108,000 p.a., or Kshs 9,000 p.m., under the newly introduced Affordable Housing Relief Section, and ii) the amendment of the Stamp Duty Act, to enable exemption of first time home buyers from paying Stamp Duty Tax, which normally is 2.0% or 4.0% of the property value. In addition, the government has initiated plans to set up a Mortgage Refinance Facility by 2019 that will create liquidity for primary lenders and thus enable them to give long-term loans at attractive rates and thus boosting the uptake of the affordable housing units by prospective homeowners. In our opinion, there’s also need for consideration of policies that will enable not only SACCO’s, but also other developers, save on development costs in order to partake in the success of the affordable housing initiative. The key areas that require attention are on i) construction costs as they contribute to approximately 50%-70% of development costs and increase year on year driven by inflation and increased reliance on imported materials, ii) provision of offsite infrastructure and serviced land so that developers save on costs that would have otherwise been incurred, and iii) access to finance through advocacy for alternative sources of development funding such as structured products and REITs.
In Nairobi, the partnership between the National Government and Nairobi County Government has led to acquisition of land parcels that will be used for the development of affordable houses. Areas in which land has been acquired include; Kibera, Mariguni, Parkroad, Starehe, Shauro Moyo and Makongeni. The acquisition of land is the first huddle to implementing the initiative of provision of affordable housing to the government and is evidence to their efforts in achieving the goal of developing 500,000 units by 2022.
Commercial Sector:
In the commercial sector, Prism Towers, a 33 –storey building of 133m in height, developed by Kings Developers Ltd officially opened for occupation. The building, situated in Upperhill, and whose construction began in 2014 will bring to the market a total of 250,000 SQFT of lettable office space. It is now one of Nairobi’s tallest buildings, only 4th to Britam Tower, UAP Old Mutual Tower and the Times Tower with 200m, 163m and 140m in height, respectively. This adds to the stock of office space in Nairobi where office completions have been increasing at a 5-year CAGR of 23.6% between 2012 and 2017 as per Cytonn Nairobi Commercial Office Report 2018. According to the report, the average rent of office space in Upperhill stood at Kshs 99 per SQFT in 2017, while the selling price stood at an average of Kshs 12,995 per SQFT. We, however, note that the market has been undergoing a price correction that saw rents reduce by 2.9% y/y from Kshs 102 per SQFT in 2016. The reduction is attributed to increased supply of office space in the node with no commensurate demand to take it up. As a result, occupancy has declined by 7.8% points from 89.8% in 2016 to 82.0% in 2017 while yields remained flat at 9.0%. The overall performance of the office market in Nairobi softened in 2017, with yields reducing by 0.1% points to 9.2% from 9.3% in 2016, and occupancy rates reducing by 4.8% points from 88.0% in 2016 to 83.2% in 2017, as per the report. We expect the performance of the office sector to continue declining given the Nairobi oversupply, which stands at 4.7 mn SQFT as at 2017 and with other new buildings such as the Tourism Fund Complex and Britam Towers in Upperhill, both completed in 2017 and One Africa Place in Westlands targeting completion in August 2018. We recommend that investments in the office market should be made in zones with low supply and high returns such as Karen by offering differentiated concepts such as serviced offices and green buildings to boost returns.
Retail Sector:
In the retail sector, Burger King, an American fast food franchise, announced opening of a new outlet at the Thika Road Mall (TRM) bringing its total count to four outlets in the country with the rest located at Nextgen Mall in South C, The Hub in Karen and The Two Rivers Mall in Runda. Expansion of international retailers within the country is largely driven by i) economic growth rate with an attractive GDP growth rate averaging at 5.3% over the last 5-years, which boosts the purchasing power in the country, ii) shifting consumer habits as Kenyans increasingly shop in formal retail centres and are increasingly appreciating international brands, and iii) Kenya’s growing position as a regional and continental hub hence witnessing an increase in multinationals operating in the country. We expect the expansion of retailers to result in increased uptake of retail space where occupancy stood at 81.2% in H1’2018 a 0.9% points increase from 80.3% in FY’2017 according to Cytonn H1’ 2018 Markets Review.
Infrastructure:
In the infrastructure sector, the government continues to increase its investments in order to boost the country’s economic growth through i) revenue generation, ii) increased employment opportunities, iii) betterment of services and facilities, and iv) improving the ease of doing business in Kenya. Some of the highlights during the week were as follows;
- Kenya Railways Managing Director, Atanas Maina, announced the construction of a 22 km Standard Gauge Railway (SGR) line costing Kshs. 200 mn set to link the Miritini passenger terminus to the Mombasa CBD that will commence at the end of this month. The aim of this railway line is to facilitate transit by individuals moving from the terminus to Mombasa CBD and back. Plans are also underway to extend the railway line past the Mombasa CBD and to the Mombasa Port with the aim of facilitating cargo transportation to Nairobi. If successfully completed, the railway will not only boost the various sectors that rely on rail for goods’ transportation, but also the tourism and hospitality sectors as it will ease the travel experience for local travellers,
- The government has set aside Kshs. 1.5 bn for the construction of 2 bypass roads in Thika Town. The construction of the two roads is expected to take 2-years and will be done in two phases. The first phase will involve a 10 km road linking Garissa Road and the Thika Superhighway passing through Kivulini, Athena and Witeithie while the second phase will involve a 15 km road linking Kenyatta Highway and Garissa Road through Munene Industries, UTI, Pilot, Umoja and Kenyatta Leather. The construction of these roads will ease traffic congestion within the town, improve the productivity and increase investments in Thika, being an industrial hub,
- The Nairobi Satellite Towns Water and Sanitation Development Programme Project, funded by KfW (Kreditanstalt für Wiederaufbau) Development Bank, based in Germany, and the National Government, is set to be completed in 18-months. The first phase of the project, which will be executed by Athi Water Services Board (AWSB) on behalf of the government, will be at a total cost of Kshs 3.6 bn for the Ruiru – Juja water project and Kiserian – Ongata Rongai Project. The project will involve creating a new distribution line system that will enable the satellite towns to enjoy uninterrupted water supply. We commend this project as it will improve living standards in the targeted areas and make them more viable for real estate investment.
Statutory Actions:
This week, sector several stakeholders in the real estate sector were affected by operations by the Nairobi River Regeneration committee, an intergovernmental agency tasked with the role of rehabilitating the Nairobi River. The committee led by the National Environment Management Authority (NEMA), a government agency responsible for environmental management and defining environmental policies, embarked on plans that seek to alleviate the encroachment on riparian land, the move, has affected developers who have set up developments that restrict flow of rivers and thus cause flooding. Buildings affected include; Sunflower Apartments and Mituntu Apartments comprising residential furnished and serviced apartments, respectively and located along Ring Road, Kileleshwa, Caribbean Park Apartments, comprising 3-bed unfurnished units along Fips Drive in Kileleshwa, South End Mall, a retail mall located along Lang’ata road, and Nakumatt Ukay in Westlands. Upon completion, the crackdown could lead to the demolition of approximately 4,000 real estate developments within Nairobi.
Furthermore, during the week, an in-house audit conducted by the National Construction Authority (NCA) that found that 16.0% of the 5,000 developments in Nairobi were unsafe. 18.3%, 146 of the 800 buildings required structural adjustments to meet required standards while, 81.7%, 654 buildings did not obtain statutory approvals and had thus been earmarked for demolition. In our view, these challenges are as a result of (i) inadequate due diligence that has thus led to losses due to demolitions, and (ii) corruption in the Lands Ministry that have led to the issuance of public land to private real estate stakeholders.
Members of Parliament (MPs) have repealed the solar water heater law, which imposed a fine of Kshs 1.0 mn or a one – year jail sentence to developers who fail to install solar water heating systems in their developments. The law was nullified because it would be an inhibitor to access to affordable housing and the fine contravenes the Statutory Instruments Act, which caps the fines payable to a maximum of Kshs. 20,000 or a prison sentence not exceeding 6 months.
Listed Real Estate Sector:
- The Fahari I- REIT, Kenya
During the week, Fahari – I REIT closed at a price of Kshs 10.3 per share, 0.9% higher than its opening price of Kshs 10.2 per share. On average, however, the REIT traded at Kshs 10.2, a 12.1% drop from an average of Kshs 11.6 last week and 2.9% below its opening price of Kshs 10.5 per share at the beginning of the year. The REIT is trading at low volumes with a relatively stable price, an indication of continued low investor appetite for the instrument. This follows the release of their H1’2018 earnings, with the REIT registering a 16.3% y/y decline in earnings to Kshs 0.36 per unit from Kshs 0.43 per unit in H1’2017. The decline in performance was attributed to a temporary increase in vacancies, coupled with some tenants bargaining for reduced rentals upon the renewal of leases, leading to reduction in rental income. However, we note that overtime the REIT is operating efficiently indicated by a better expense ratio. The REIT,s expense ratio came in at 3.0% of its total assets in H1’ 2018, which is 0.05% improvement y/y from the same period in 2017, this is attributed to a 0.9% decline in operating expenses from Kshs 112.5 mn in H1’ 2017 to Kshs 111.5 mn in H1’ 2018 and a 0.8% increase in assets from Kshs 3.69 bn to Kshs 3.72 bn between H1’ 2017 and H1’2018, respectively. For a more comprehensive analysis see our Stanlib Fahari I-REIT Earnings Note.
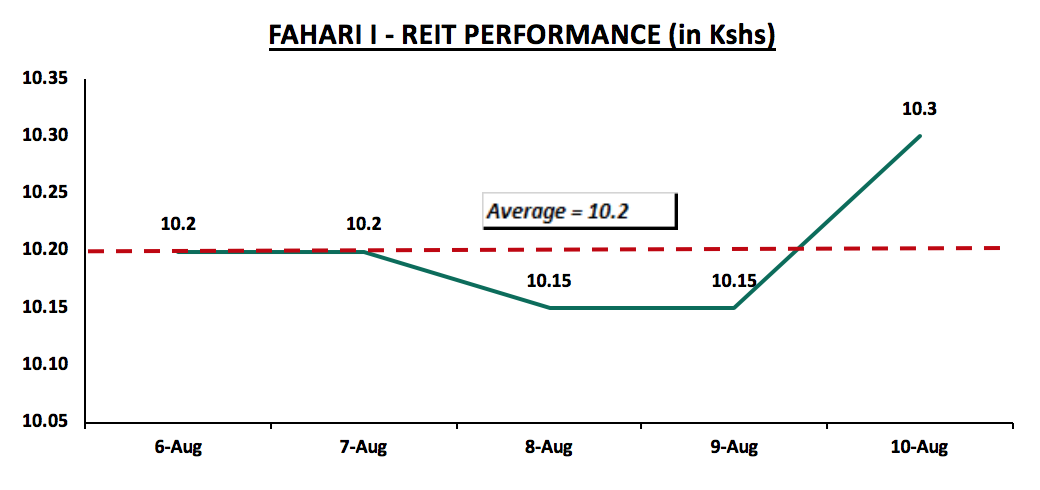
Source: Bloomberg
- West Africa
REITS in Nigeria on the other hand, continued to plateau with the three REITS i.e. Union Home, Skye Shelter and UPDC attaining a constant price per share of N45.2, N95 and N9, respectively, throughout the week. This is as a result of inadequate investor knowledge about the market hence low investor interest in the instrument, and poor valuation of the market by valuers, which leads to lower levels of demand by potential investors.
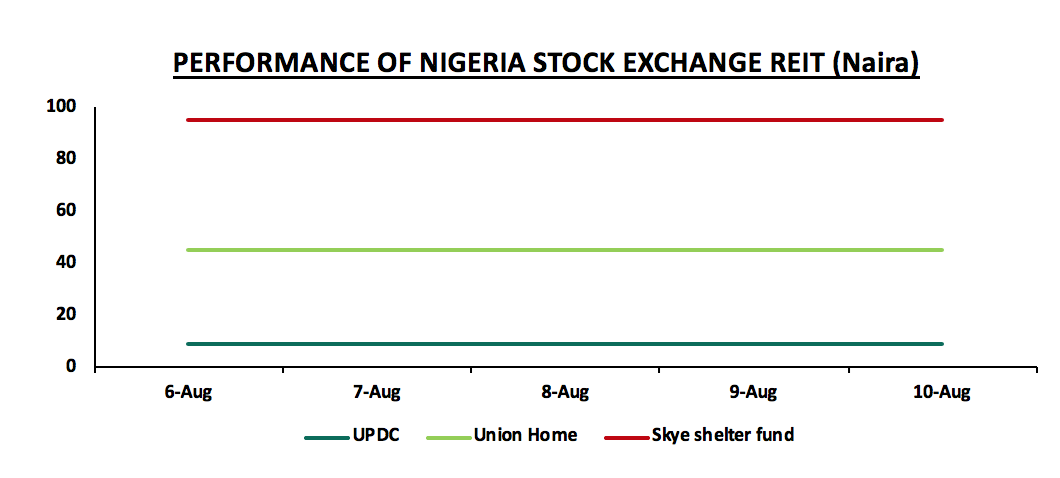
Source: Bloomberg
We expect the real estate sector in Kenya to continue on an upward trajectory given (i) government efforts in bridging the housing deficit in the country through provision of affordable housing, (ii) continued improvement in infrastructure by the central government, and (iii) expansion by global retailers into the country.
In line with our regional expansion strategy, we continue to assess investment opportunities in various Kenyan Counties, to enable us to diversify our portfolio of real estate investments for our clients. So far we have covered 13 counties, including Nyeri, Laikipia, Meru, Mombasa, Narok, Homabay, Kisii and Uasin Gishu, and have subsequently released research notes such as the: Nyeri Real Estate Investment Opportunity 2017, Kisumu Real Estate Investment Opportunity 2016 and Kisumu Real Estate Investment Opportunity 2018, released last month. This week, we shift our focus to Nakuru County, specifically, the headquarters, Nakuru Town. We analyse the real estate investment opportunity in the town in terms of rental yields, capital appreciation, total returns, occupancy and uptake. The town has an average rental yield of 6.1%, a capital appreciation of 8.8%, hence a total return of 14.9%, with MUDs being the best performing theme, recording average rental yields of 8.9% and residential, being the theme with the lowest performance levels, recording average rental yields of 4.2%.
In our analysis of the investment opportunity in Nakuru Town, we will cover the following:
- Overview of Nakuru Town,
- Nakuru Town Market Performance,
- Comparative Analysis - Selected Counties in Kenya, and,
- Market Performance and Outlook.
Section 1: Overview of Nakuru Town
Nakuru is the fourth largest town in Kenya, and it is located approximately 160.0 km North West of Kenya’s capital, Nairobi. The town serves as the headquarters of Nakuru County, the fourth largest county in Kenya in terms of GDP per capita, with a GDP per capita of USD 1,413 after Kiambu, Nyeri and Kajiado, each having a GDP per capita of USD 1,785, USD 1,501 and USD 1,466, respectively.
The table below highlights the top 10 counties with the highest GDP per Capita in Kenya:
|
County |
GDP per Capita (USD) |
|
Kiambu |
1,785 |
|
Nyeri |
1,501 |
|
Kajiado |
1,466 |
|
Nakuru |
1,413 |
|
Kwale |
1,406 |
|
Laikipia |
1,226 |
|
Muranga |
1,090 |
|
Nairobi |
1,081 |
|
Mombasa |
935 |
|
Machakos |
913 |
Source: World Bank Survey 2015
Nakuru Town covers an area of 348.6 SQKM and has an estimated population of 376,979 people as at January 2018, according to the County Government of Nakuru. The town is multicultural and profoundly diverse comprising all major tribes in Kenya. In the last 5-years, the town has witnessed an increase in infrastructural developments with roads such as the Nairobi – Nakuru Highway and Nakuru – Nyahururu Highway being expanded and constructed, respectively, linking Nakuru Town to other towns in the country. In 2018, the town is set to benefit from further infrastructural development, with the Kenya Urban Roads Authority (KURA), announcing plans to upgrade 22 km of roads within the town at a cost of Kshs 1.8 bn. In terms of real estate, the town offers a blend of both high-end and mid-end residential developments, commercial offices, Mixed-Use Developments (MUDs), and retail centres, which mainly serve the Nakuru urban population.
The main factors driving the real estate market in Nakuru Town are:
- Positive Economic Growth – According to the World Bank Survey 2015, Nakuru County GDP per Capita stands at USD 1,413, which is 4th highest in Kenya after Kiambu, Nyeri and Kajiado, which have GDP per capita of USD 1,785, USD 1,503 and USD 1,466, respectively. In addition, the county recorded a 10-year GDP growth rate of 5.1% p.a, driven by the industrial sector, tourism, trade, energy and agriculture, thus higher per capita income that increases demand for real estate in Nakuru Town,
- Devolution – Devolution has opened up Nakuru Town and has placed an onus on the County Government to improve its real estate landscape. This has attracted entrepreneurs, private investors and government institutions such as public service boards to the county headquarters and thus created demand for housing units, retail spaces and office spaces, which host investors and government officials,
- Positive Demographics – Nakuru Town has a high population growth rate of on average 3.1% per annum, compared to a Kenyan average of 2.6%, which leads to sustained demand for real estate developments. Currently, Nakuru Town has an estimated population of 376,979 that has grown from 286,411 as at the 2009 census, and Nakuru County has a population of 1,891,739, according to the County Government of Nakuru. This creates demand for real estate developments, as the population seeks to purchase residential units and demand commercial and retail facilities,
- Infrastructural Development – Nakuru Town has seen increased focus on infrastructural development in the recent years. These projects are bound to open the town up for development. For instance, in 2018, the Kenya Urban Roads Authority (KURA) announced plans to upgrade 22 km of roads within the town at a cost of Kshs 1.8 bn. The project will link suburbs in the town including Naka, Industrial Area, Bondeni, Free Area and Mwariki. Additionally, in 2017, the County Government of Nakuru announced plans to upgrade Lanet Airstrip, to a fully-fledged airport that would accommodate huge passenger and cargo planes, details of completion timelines are yet to be disclosed. These initiatives will improve accessibility to the town and thus open it up to real estate development.
However, the town faces a few challenges, which if not properly addressed would pose a challenge to real estate development. They include:
- Infrastructure Development – Despite the growth of infrastructure and having several projects in the pipeline, some areas in Nakuru Town are still faced with inadequate infrastructure characterized by earth roads and undeveloped sewer systems in areas such as; Kaptembwa, Free Area and Lanet making it expensive to develop in these areas,
- Access to Funding – As is the case in other areas in Kenya, access to funding for development is one of the constraints facing the real estate sector in Nakuru Town. The banking amendment act that led to the capping of interest rates at 13.0%, as at July 2018, has resulted in a decline in private sector credit growth rate to 2.4% as at April 2018 from a 5-year average of 14.0%. The decline, which is attributable to structural reforms and a strict adherence to prudential guidelines in terms of loan book quality and adequate provisioning has locked out private stakeholders in the real estate sector and developers, thus limited construction activities in areas across the country, including Nakuru Town,
- Inadequate Planning – Inadequate planning that has been caused by limited adherence to key policies that guide planning in Nakuru Town and if unchecked, this will lead to reduced land use maximization and urban sprawl.
Section 2: Nakuru Town Market Performance:
We conducted real estate research in Nakuru Town in February 2018. Our market research focused on:
- Plinth Area - An analysis of the size of the units found in the market allows us to assess the current market offering, and gives an indication of what the market prefers,
- Prices - An analysis on prices will help benchmark our prices to market prices,
- Rental Rates - Research on rental income allows us to inform potential investors on the current rental rates in other developments and also inform the investors on the prospective rental yield they are bound to gain from investing in Nakuru Town, and,
- Annual Uptake - This allows the investor to appreciate the rate at which available homes are sold over a specific period. This helps them assess whether it is profitable to invest in a given area.
The key themes are covered below:
- Residential
The residential sector in Nakuru is at its emerging stages, with most of the developments being less than 5-years old as the market has begun welcoming institutional developers who are coming up with investment grade housing units and the urban population is appreciating them as evidenced by high uptakes of 39.7% for mid-end apartments and 22.9% for high-end apartments, additionally, indicating that developers can exit developments in 3 years. The main drivers of the residential sector in Nakuru are devolution, urbanization and positive demographics, which have increased demand for residential units for both selling and renting in the town, as well as positive economic growth increasing the capita income, and hence the ability to purchase houses. Residential units in Nakuru Town are concentrated in suburbs within a 10-km radius from the CBD such as Naka, Milimani, Section 58, Kiamunyi, Barnabas, Freehold and Ngata. The sector recorded average rental yields of 4.2%, price appreciation of 4.6%, and hence a total return of 8.8%.
In our residential sector analysis, we classified the various suburbs in Nakuru Town into two segments:
- High-End Segment – Consisting of prime suburbs in Nakuru Town such as; Milimani, Section 58 and Naka. Houses in these suburbs have price points of between Kshs 6.1 mn and Kshs 13.0 mn,
- Middle-Income Segment – Consisting of suburbs such as; Ngata, Free Area and Kiamunyi, and are characterized by both high and low-density houses, housing the middle class. Houses in this segment have price points of between Kshs 3.6 mn and Kshs 4.9 mn.
To note:
- Detached Units refer to stand-alone houses such as townhouses, maisonettes and bungalows, and,
- Apartments refer to a self-contained housing units occupying part of a building, also called flats.
The performance of the residential theme is Nakuru Town is as summarized below:
- High-End Segment
The high-end market segment in Nakuru Town comprises suburbs such as Milimani, Section 58, and Naka. These suburbs have both detached units and apartments. Exit prices for apartments and detached units in the segment stand at Kshs 62,094 per SQM and Kshs 107,466 per SQM, respectively. In terms of performance, apartments outperform detached units recording total returns of 11.7%, 4.9% points higher than detached units at 6.8%. The lower returns for detached units is due to the fact that they are less preferred as a result of high rental rates of Kshs 384 per SQM as compared to Kshs 300 per SQM for apartments and high price points at Kshs 107,466 per SQM, 73.1% more than apartments that have exit prices of Kshs 62,094 per SQM. This is attributable to detached units, which sit on relatively larger sizes of land. The high rental rates have thus led to lower occupancy rates of 68.8%, as compared to apartments at 88.2% and thus resulted in lower yields of on average 3.8%, as compared to 5.7% for apartments.
The performance of apartments and detached units in the high-end segment is as summarized below:
- Apartments
The main apartment typologies in the high-end market segment are 2 and 3-bed units. The average prices for 2 and 3-bed apartment units are Kshs 4.9 mn and Kshs 5.5 mn, respectively. These units have average monthly rents of Kshs 20,714 for 2-bed units and Kshs 30,833 for 3-bed units and average occupancy rates of 92.3% and 84.0%, respectively, translating to average rental yields of 4.3% and 5.7%, for 2 and 3-bed apartments, respectively. In terms of total return, 3-bed apartments in the high-end segment outperform 2-bed units, recording on average total returns of 13.8%, 4.2% points higher than returns of 9.6% for 2-beds. The higher returns for the 3-bed units are as a result of higher yields of 5.7%, 1.4% points higher than 4.3% for the 2-bed typologies. It is noted that 3-bed units attract higher yields due to higher rental rates per SQM of Kshs 333 as compared to Kshs 267 for 2-bed units, as property owners charge more rent per SQM for the extra space offered.
The performance of high-end apartments is as summarized below;
|
(all values in Kshs, unless stated otherwise) |
||||||||||||
|
Nakuru Town High-End Apartments Performance Summary and Analysis – February 2018 |
||||||||||||
|
Unit |
Unit Plinth Area in SQM |
Selling Price (mn) |
Selling Price per SQM |
Initial Rent (2016) |
Current Rent |
Monthly Rent per SQM |
Uptake |
Annualized Uptake |
Occupancy |
Price Appreciation |
Yields |
Total Return |
|
2-Bed |
80 |
4.9 |
63,879 |
18,500 |
20,714 |
267 |
66.6% |
31.5% |
92.3% |
5.3% |
4.3% |
9.6% |
|
3-Bed |
93 |
5.5 |
60,308 |
32,500 |
30,833 |
333 |
47.2% |
14.3% |
84.0% |
6.1% |
5.7% |
13.8% |
|
Average |
|
|
62,094 |
|
|
300 |
56.9% |
22.9% |
88.2% |
5.7% |
5.0% |
11.7% |
|
· Apartments in the high-end residential markets recorded a total return of 11.7%, with an average rental yield of 5.0% and price appreciation at 5.7% at an annual uptake of 22.9%. The high-end residential market for apartments outperform the middle-income segment, with the total return being 11.7%, 2.0% points higher as compared to 9.7% for residential developments in the middle-income segments, due to high price appreciation of 5.7%, 0.6% points higher than the mid end segment due to high demand from the high-end segment of the market prompting developers to increase prices. |
||||||||||||
|
· 3-bed apartments outperform 2-bed apartments recording total returns of 13.8%, 4.2% points higher than 9.6% for 2-bed apartments due to high demand, as the market prefers larger spaces and offering more bedrooms. This has prompted developers to raise prices with the units recording a price appreciation of 6.1%, 0.8% points higher than 2-beds at 5.3%. Additionally, the units record higher rental rates per SQM of on average Kshs 333 as compared to Kshs 267 for 2-bed, respectively, thus 1.4% points higher yields of 5.7%, compared to 4.3% for 2-bed. |
||||||||||||
Source: Cytonn Research 2018
- Detached Units
Detached units in the High End market in Nakuru Town are few, with only 4 notable developments in areas such as Milimani and London. Detached units in the area have an average total return of 6.8% with average rental yields and price appreciation of 3.8% and 3.0%, respectively. Annualized uptakes for detached 3-bed units is 21.5%. Meaning that developers can exit from a development in 5 years. On average developments have 73 units, meaning that developers can sell 14 units a year.
The performance of detached units is as summarized below:
|
(all values in Kshs, unless stated otherwise) |
||||||||||||
|
Nakuru Town 3-Bed Detached – High-End Units Performance Summary and Analysis – February 2018 |
||||||||||||
|
|
Plinth Area (SQM) |
Current Selling Price |
Selling Price per SQM |
Monthly Rent |
Rent /SQM |
Uptake |
Annualized Uptake |
Occupancy |
Price Appreciation (%) |
Yield (%) |
Total Return |
|
|
Average |
141 |
15.1 |
107,466 |
55,000 |
384 |
53.6% |
21.5% |
68.8% |
3.8% |
3.0% |
6.8% |
|
|
High |
180 |
20.0 |
139,130 |
60,000 |
435 |
84.7% |
35.0% |
90.0% |
5.4% |
3.5% |
8.7% |
|
|
Low |
115 |
10.3 |
82,400 |
50,000 |
333 |
29.8% |
14.9% |
50.0% |
1.8% |
2.4% |
4.2% |
|
|
· Standalone units in the area have an average return of 6.8% with average price appreciation and rental yields of 3.8% and 3.0%, respectively. The total return of 6.8% for standalone units is 4.9% points lower than 11.7% for apartments in the high-end segment because of lower occupancy rates of on average 68.8% for detached units as compared to 88.2% for apartments. This is attributed to the market preferring apartments to standalone units, as they are more affordable and with an average rent of Kshs 30,833 for 3-bed apartments compared to Kshs 55,000 for 3-bed-detached units, 43.9% lower. |
||||||||||||
Source: Cytonn Research 2018
- Mid-End Market Segment
The mid-end segment consists of estates such Ngata, Kiamunyi and Free Area. The area mainly comprises of apartments. This segment recorded an annual uptake of 39.7%, 16.8% points higher than the high-end segment at 22.9%, attributable to mid-end apartments affordability as they are 18.6% cheaper than in the high-end segment, with a price per SQM of Kshs 50,530, against an average of Kshs 62,094 per SQM for high-end apartments.
The performance of mid-end apartments in Nakuru Town is as summarized below:
|
(all values in Kshs, unless stated otherwise) |
||||||||||||
|
Nakuru Town Mid-End Apartments Performance Summary and Analysis – February 2018 |
||||||||||||
|
Unit |
Unit Plinth Area (SQM) |
Selling Price (mn) |
Selling Price per SQM |
Initial Rent (2016) |
Current Rent |
Monthly Rent per SQM |
Uptake |
Annualized Uptake |
Occupancy |
Price Appreciation |
Yields |
Total Return |
|
2-Bed |
74 |
3.8 |
49,777 |
14,833 |
16,000 |
223.5 |
96.0% |
38.0% |
97.3% |
2.0% |
4.8% |
6.5% |
|
3-Bed |
89 |
4.9 |
51,282 |
24,333 |
28,333 |
299.2 |
90.4% |
41.3% |
90.4% |
8.2% |
6.2% |
12.8% |
|
Average |
|
|
50,530 |
|
22,167 |
261.3 |
93.2% |
39.7% |
93.9% |
5.1% |
5.5% |
9.7% |
|
· The mid-end residential market recorded an average total return of 9.7%, with an average rental yield of 5.5% and an average price appreciation of 5.1%. The market’s total return of 9.7% is 2.0% points lower than high-end apartment’s return of 11.7% due to a slower price appreciation of 5.1% as compared to 5.7%, but high uptakes of 39.7%, 16.8% points higher than 22.9% for the high-end segment as the units are affordable to the middle-income segment leading to higher demand. |
||||||||||||
|
· 3-bed residential units outperform the 2-bed units in the mid-end market, recording average total returns of 12.8%, 6.3% points higher than 2-beds with average total returns of 6.5%, this is due to higher rental rates per SQM at Kshs 299.2, 33.9% higher than Kshs 223.5 per SQM for 2-bed units as the market is willing to pay more rent for larger units with more bedrooms, where on average 3-beds are 89 SQM in size while 2-beds are 74 SQM in size. |
||||||||||||
Source: Cytonn Research 2018
- Nakuru Town Residential Sector Performance Summary
In terms of overall market performance, the residential sector in Nakuru recorded on average total returns of 8.8%, with apartments and detached units having total returns of on average 10.7% and 6.8%, respectively. The lower returns for detached units can be attributed to a slower price appreciation of 3.8%, 1.6% points lower than 5.4% for apartments, as developers are sceptical about raising prices in attempt to boost sales and due to slow annualized uptakes of 21.5%, 9.8% point lower than apartments at 31.3%. Additionally, standalone units record lower occupancy rates of 68.8%, 22.3% points lower than 91.0% for apartments since the market prefers apartments as they attract lower rental rates thus more affordable with rents at on average Kshs 23,970, 56.4% lower than detached at Kshs 55,000.
The performance of the residential sector in Nakuru Town is as summarized below:
|
(all values in Kshs, unless stated otherwise) |
|||||||||
|
Nakuru Town Residential Sector Performance Summary – February 2018 |
|||||||||
|
Segment |
Typology |
Selling Price per SQM |
Monthly Rent per SQM |
Uptake |
Annualized Uptake |
Occupancy |
Price Appreciation |
Yields |
Total Return |
|
High-End |
Apartments |
62,094 |
300 |
56.9% |
22.9% |
88.2% |
5.7% |
5.0% |
11.7% |
|
Mid-End |
Apartment |
50,530 |
261 |
93.2% |
39.7% |
93.9% |
5.1% |
5.5% |
9.7% |
|
Apartments Average |
|
56,312 |
281 |
75.0% |
31.3% |
91.0% |
5.4% |
5.3% |
10.7% |
|
High-End |
Detached Units |
107,466 |
384 |
53.6% |
21.5% |
68.8% |
3.8% |
3.0% |
6.8% |
|
Average |
|
81,889 |
332 |
64.3% |
26.4% |
79.9% |
4.6% |
4.2% |
8.8% |
|
· The average return from residential units in Nakuru Town stands at 8.8% with apartments outperforming detached units, recording on average total returns of 10.7%, 3.9% points higher than the 6.8% recorded for detached units. The lower returns for detached units can be attributed to a slower price appreciation of 3.8%, 1.6% points lower than 5.4% for apartments, this is attributable to developers being sceptical about raising prices in attempt to boost sales and due to slow annualized uptakes of 21.5%, 9.8% point lower than apartments at 31.3% · Additionally, standalone units record lower occupancy rates of 68.8%, 22.3% points lower than 91.0% for apartments since the market prefers apartments as they attract lower rental rates of on average Kshs 281 per SQM, 15.5% lower than standalone units at Kshs 332 per SQM |
|||||||||
|
· Apartments have higher annualized uptakes of 31.3%, 9.8% points higher than detached units that recorded uptakes of 21.5%, this is due to the fact that, apartments are preferred as they are more affordable .On average exit prices for apartments are Kshs 56,312 per SQM 90.8% lower than the Kshs 107,466 for detached units. |
|||||||||
Source: Cytonn Research February 2018
- Commercial Properties
- Office and MUDs Developments
The commercial office buildings and MUDs (comprising of a blend of both commercial office and retail) are mainly located in the Nakuru CBD. Generally, Nakuru Town lacks Grade A office spaces with most of the buildings being Grade C. In terms of performance, office spaces in Nakuru Town record average rental yields of 5.4%, 3.5% points lower than the 8.9% for MUDs. MUD’s outperform purely office buildings in the town due to higher footfall as they combine both office and retail uses. This results in higher occupancy rates, and consequently higher rents. On average, MUD’s have an occupancy rate of 81.6%, 16.6% higher than purely office buildings that have an average occupancy rate of 65.0%. The rents charged by MUDs are 29.5% higher at Kshs 86 per SQFT compared to Kshs 66 per SQFT charged for purely office buildings.
The summary of the sector’s performance is as below:
|
(all values in Kshs, unless stated otherwise) |
|||||
|
Nakuru Town Commercial Office and MUD Performance Summary – February 2018 |
|||||
|
Development |
Rent (SQFT) |
Service Charge 2018 (SQFT) |
Total Rent (SQFT) |
Occupancy |
Yield |
|
Commercial Office |
66 |
17 |
83 |
65.0% |
5.4% |
|
MUD |
86 |
19 |
105 |
81.6% |
8.9% |
|
Average |
76 |
18 |
94 |
73.3% |
7.2% |
|
· Commercial office spaces record average rental yields of 5.4%, 3.5% lower than the 8.9% for MUDs, the lower yields are as a result of lower occupancy rates of 65.0% for commercial office as compared to 81.6% for MUDs and lower rental rates at Kshs 66, 16.6% lower than Kshs 86 for Mixed Use Developments. The lower occupancy rates are attributed to lower demand as the market prefers MUDs to purely commercial office space due to higher footfalls as MUDs combine the retail and office uses |
|||||
Source: Cytonn Research 2018
- Retail Space
Nakuru County has 4 malls of which 50% are community malls (Gross Floor Area (GFA) of 125,001 – 400,000 SQFT) and 50% are neighbourhood malls (Gross Floor Area (GFA) of 20,000 – 125,000 SQFT). On average, the retail space in Nakuru has rental yields of 5.8% as compared to Nairobi, Mombasa and Kisumu that have average rental yields of 9.7%, 10.0% and 9.9%, respectively. The relatively low yields are as a result of low rental rates of Kshs 91.7 per SQFT, 39.3% lower than areas such as Kisumu that have rental rates of Kshs 151.0, as the malls have just been completed
In terms of performance by grade, community malls outperform neighbourhood malls, recording on average rental yields of 6.8%, 2.0% higher than the 4.8% average rental yields recorded in neighbourhood malls. The lower yields for neighbourhood malls are attributable to lower occupancy rates of 65.0% for neighbourhood malls, 17.5% points lower than 82.5% for community malls, as retailers prefer the newer community malls that attract higher footfall.
The summary of the sector’s performance is as below:
|
All values in Kshs, Unless Stated Otherwise |
|
|||||
|
Nakuru Town Commercial Retail Space Performance Summary and Analysis - 2018 |
||||||
|
Retail Grade |
Anchor Rent |
Rent Ground Floor 2018 |
Average Rent Per SQFT |
Service Charge 2018 |
Occupancy Rate |
Rental Yield |
|
Community Mall |
55 |
115 |
85 |
23 |
82.5% |
6.8% |
|
Neighbourhood Malls |
50 |
115 |
73 |
21 |
65.0% |
4.8% |
|
Average |
53 |
115 |
79 |
22 |
73.8% |
5.8% |
|
· Average rent for commercial retail spaces in Nakuru stands at Kshs 79.0 per SQFT and average yield of 5.8% at an occupancy level of 73.8% |
||||||
|
· Community malls recorded higher yields of 6.8%, 2.0% points higher than neighbourhood malls due to higher occupancy rates that stand at 82.5% , 17.5% points higher than 65.0% for neighbourhood malls, as retailers prefer the newer community malls that attract higher footfall |
||||||
Source: Cytonn Research 2018
- Land Analysis Summary
An analysis of changes in asking land prices in Nakuru was conducted in areas such as Kiamunyi, Milimani, Nakuru CBD, Ngata and Naka. Over the last 3-years the areas have recorded growth in asking land prices of 11.6%, 10.7%, 8.9%, 7.4%, 7.1% and 6.8% per annum, respectively, thus Nakuru Town land sector recorded an annualized capital appreciation of 8.8% this is attributed to speculation and increased demand for land in residential zones.
The summary of the sector’s performance is as highlighted below:
|
(all values in Kshs, unless stated otherwise) |
||||||
|
Nakuru Town Land Performance Summary – February 2018 |
||||||
|
Location |
Price per Acre 2015 |
Price per SQM 2015 |
Price per Acre 2018 |
Price per SQM 2018 |
Price Change from 2015 |
3-Year CAGR |
|
Kiamunyi |
12,000,000 |
3,000 |
16,700,000 |
4,175 |
1.4x |
11.6% |
|
Milimani |
28,000,000 |
7,000 |
38,000,000 |
9,500 |
1.4x |
10.7% |
|
Nakuru CBD |
155,000,000 |
38,750 |
200,000,000 |
50,000 |
1.3x |
8.9% |
|
Ngata |
10,000,000 |
2,500 |
12,400,000 |
3,100 |
1.2x |
7.4% |
|
Naka |
16,000,000 |
4,000 |
19,640,000 |
4,910 |
1.2x |
7.1% |
|
Section 58 |
11,000,000 |
2,750 |
13,413,333 |
3,353 |
1.2x |
6.8% |
|
Average |
|
9,667 |
|
12,506 |
1.3x |
8.8% |
|
Average excluding CBD |
3,850 |
5,008 |
1.3x |
8.7% |
||
|
· Land in Nakuru Town has appreciated by 1.3x, translating to a 3-year CAGR of 8.8% |
||||||
|
· Areas such as Kiamunyi and Milimani have recorded the highest growth rates growing by a 3-Year CAGR of 11.6% and 10.7% as a result of increased demand due to their prime locations near the CBD thus considered as a preferred location for individuals working within the Nakuru CBD |
||||||
Source: Cytonn Research 2018
- Nakuru Market Summary Analysis
The Nakuru real estate sector records a total return of 14.9%, with an average rental yield of 6.1% and a capital appreciation at 8.8% p.a. In terms of yields, the MUD theme surpassed all the other themes to record yields of on average 8.9%, as compared to 4.2%, 5.4% and 5.8% for the residential, commercial office and retail themes, respectively.
The summary of the real estate sector performance is as below;
|
(all values in Kshs, unless stated otherwise) |
||||
|
Nakuru Town Real Estate Sector Performance Summary – February 2018 |
||||
|
Theme |
Occupancy Rates |
Rental Yield |
Capital Appreciation |
Total Return |
|
Residential |
79.9% |
4.2% |
|
|
|
Commercial offices |
65.0% |
5.4% |
|
|
|
MUD |
81.6% |
8.9% |
|
|
|
Retail Sector |
73.8% |
5.8% |
|
|
|
Land |
8.8% |
|
||
|
Average |
75.1% |
6.1% |
8.8% |
14.9% |
|
· Nakuru real estate sector has an average yield of 6.1% and a capital appreciation of 8.8%, bringing the total returns to 14.9% per annum |
||||
|
· The residential sector records rental yields of on average 4.2% and a price appreciation of on average 4.6%. While the commercial offices and retail space record yields of on average 5.4% and 5.8%, respectively. MUDs in the town recorded the highest yields of on average 8.9% due to high occupancy rates of 81.6% and higher rents of on average Kshs 86.0 per SQFT, 8.9% higher than the Kshs 79.0 per SQFT for purely retail spaces, 30.3%higher than the Kshs 66 per SQFT for purely office spaces. This is as they attract higher footfall, due to the combined offering of both retail and office spaces |
||||
Source: Cytonn Research February 2018
Section 3: Comparative Analysis – Selected Counties in Kenya
In comparison to research done in other counties within Kenya, Nakuru Town has an average rental yield of 6.1%, which is lower than other towns and cities such as Nairobi, Mombasa, Kisumu and Nyeri, that have average rental yields of 8.1%, 8.4%, 7.8% and 8.6%, respectively. For the residential sector, Nakuru has an average rental yield of 4.2%, 0.1% points higher than Nyeri that has an average yield of 4.1%, but lower than Mombasa, Kisumu and Nairobi with average rental yields of 6.0%, 5.2% and 5.4%, respectively. For the commercial office sector, Nakuru has average rental yield of 7.2%, and lower than the Nairobi, Mombasa, Kisumu and Nyeri with average rental yields of 9.3%, 9.2%, 8.4% and 13.0%, respectively
Below is a summary of the analysis;
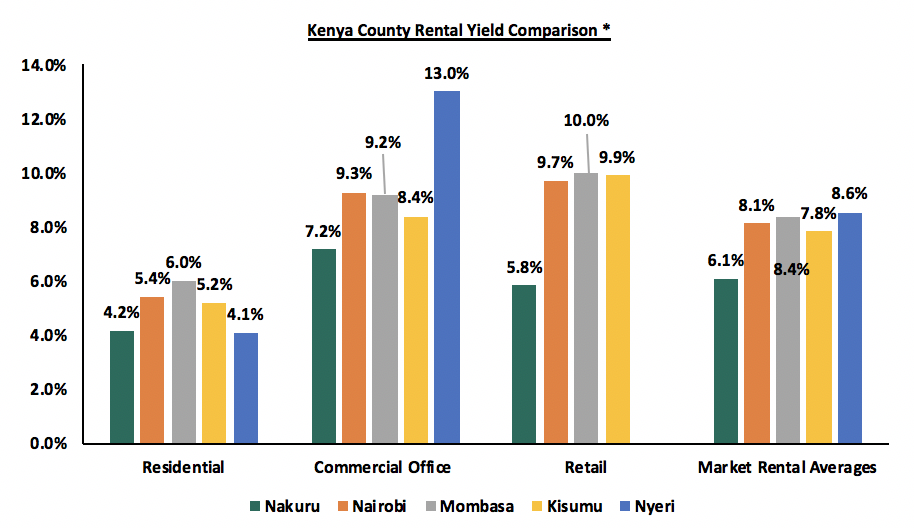
Source: Cytonn Research
*Mombasa data is based on 2016 figures
Section 4: Market Performance and Outlook
We have analyzed and identified the investment opportunity in Nakuru Town, based on 2018 performance as shown below;
|
Theme |
Performance (2018) |
Investment Opportunity |
Outlook |
|
Residential |
The residential sector records annualized uptake of 26.4% with apartments outperforming detached units to record an annualized uptake of 31.3% as compared to 21.5% for detached units. However, average rental yields of 4.2% for the sector, are low as compared to other towns such as Kisumu, Mombasa and Nairobi at 5.2%, 6.0% and 5.4%, respectively. |
The opportunity in the sector lies in 3-bed apartments in both the high end and mid end segment in areas such as Milimani, Section 58 and Naka. The units record average rental yields of 5.0% and 5.5%, respectively, higher than the market average of 4.2% as well as high-annualized uptakes of 22.9% and 39.7%, respectively. |
|
|
Commercial Offices |
The commercial office sector records average rental yields of on average 5.4%, against an occupancy rate of 65.0%. At an average rent of Kshs 66.4 per SQFT, 29.5% lower than MUDs at Kshs 86.0 per SQFT, lower than the 9.3%, 9.2%, 8.4% and 13.0% rental yields recorded in Nairobi, Mombasa, Kisumu and Nyeri towns, respectively. |
Our outlook for commercial office spaces is negative given the low yields and occupancy rates of on average 5.4% and 65.0%, respectively as compared to themes such as the MUD with yields and occupancy rates of 8.9% and 81.6%, respectively. |
|
|
MUD |
MUDs record high yields of 8.9% as compared to 5.4% for the conventional office space sector and 5.8% for retail space. Retail spaces in MUDs have high yields of 10.7% and 5.3% points higher than conventional office space with yields of 5.4%. |
An opportunity lies in the sector given the high occupancy rates of on average 81.6%, 16.6% higher than conventional office space at 65.0%, thus high yields of on average, 8.9% as compared to office at 5.4%. |
|
|
Retail Space |
Retail spaces recorded yields of on average 5.8% and occupancy rates of 73.8%. The yields are lower than regions such as Mombasa, Kisumu and Nairobi that have average rental yields of 10.0%, 9.9% and 9.6%, due to competition from MUDs in Nakuru Town. |
Our outlook for the retail space is negative given the low yields of 5.8%, as compared to areas such as Kisumu, Nairobi and Mombasa that have average rental yields of 9.4%, 9.7% and 10.0% respectively, |
|
|
Land |
Land in Nakuru Town has grown by a 3-year CAGR of 8.8%, with land in areas such as Kiamunyi, Milimani and Nakuru growing by 11.6%, 10.7% and 8.9% respectively. |
The opportunity in the sector lies in site and service schemes in areas such as Kiamunyi and Milimani with capital appreciation of 11.6% and 10.7%, respectively as compared to a market average of 8.8%. |
Out of the five real estate themes under evaluation in Nakuru, two themes, that is MUDs and land have a positive outlook, two themes that is retail and the commercial office sectors have a negative outlook while one theme, that is residential has a neutral outlook, thus our outlook for the Nakuru real estate market is neutral. Therefore, the investment opportunity lies in site and service schemes, in areas such as Kiamunyi and Milimani that have a capital appreciation rate of 11.6% and 10.7%, respectively, as compared to a market average of 8.8% and in MUDs that have average rental yields of 8.9% as compared to a market average of 6.1%.
Disclaimer: The views expressed in this publication are those of the writers where particulars are not warranted. This publication, which is in compliance with Section 2 of the Capital Markets Authority Act Cap 485A, is meant for general information only and is not a warranty, representation, advice or solicitation of any nature. Readers are advised in all circumstances to seek the advice of a registered investment advisor.

- Talk to us
- Kenya
- P.O Box 20695 - 00200, Nairobi, Kenya
- Cell +254709101200
- Tel +254709101200
- WhatsApp +254741676635
- United States
- +254709101200
- DOWNLOAD OUR APP
-


- Kenya
- 8th Floor, Pinetree Plaza, Kaburu Drive, Ngong Road, Nairobi, Kenya
- USA
- Suite 1150, 1775 Eye Street NW, USA, Washington DC 20006, USA
- Investments
- High Yield
- Private Equity
- Real Estate
- Real Estate
- RiverRun Estates
- Cytonn Towers
- The Ridge
- Taraji Heights
- The Alma