Nairobi Metropolitan 2020 Residential Report, & Cytonn Weekly #30/2020
By Cytonn Research, Jul 26, 2020
Executive Summary
Fixed Income
During the week, T-bills remained oversubscribed, with the subscription rate coming in at 149.6% down from 271.5% the previous week, the decline in the rate can be attributed to the primary bond auction that closed on 21st July 2020 and had an average subscription rate of 303.0%. The oversubscription in recent weeks has partly been attributable to the high liquidity in the money market, as well as Banks’ preference towards government securities as opposed to lending in the wake of the COVID-19 pandemic, which has heightened credit risk. The yields on the 91-day paper increased by 10.1 bps to 6.1% from 6.0% recorded the previous week, while that of the 182-day and 364-day papers declined by 8.4 bps and 9.4 bps, respectively, to 6.4% and 7.4%. We are projecting the y/y inflation rate for July 2020 to come in within the range of 4.9% - 5.0%, compared to 4.7% recorded in June;
Equities
During the week, the equities market recorded mixed performance, with NASI and NSE 25 recording gains of 1.8% and 0.5%, respectively, while NSE 20 recorded losses of 0.2%, taking their YTD performance to losses of 19.1%, 28.9%, and 23.9%, for NASI, NSE 20 and NSE 25, respectively. The NASI performance was driven by gains recorded by large-cap stocks, with the highest gains being recorded in EABL, Safaricom, BAT and NCBA, which gained by 4.8%, 4.1%, 2.3% and 1.2%, respectively. During the week, I&M Holdings issued a cautionary statement to its shareholders on its intention to acquire 90.0% of the share capital of Orient Bank Limited Uganda (OBL). This week also saw Access Bank Plc finalize the acquisition of 100.0% stake in Transnational Bank Plc;
Real Estate
During the week, Cytonn Investments announced that construction activities had resumed in phase 2 of their 600-unit comprehensive lifestyle residential development in Ruaka, Kiambu County. In the hospitality sector Ministry of Tourism and Wildlife Cabinet Secretary, Najib Balala, announced that the National Government had set aside Kshs 10 bn aimed at offering cheap loans to hotels and firms operating in the tourism sector through a state-backed credit scheme. In addition, PrideInn Azure Hotel, a 164-room hotel located in Westlands, and the Maasai Mara Game Reserve safari lodges and camps resumed operations, following a 4-month closure attributed to the Covid-19 pandemic;
Focus of the Week
This week we focus on the Nairobi Metropolitan Area (NMA) residential sector. We showcase the sector’s performance in the region in terms of price appreciation, rental yields and market uptake, based on research on 38 areas located within the Nairobi Metropolis. We also look at the recent developments impacting the sector as well as factors that are expected to shape demand and supply and conclude with a look at the investment opportunities as well as the sector’s overall outlook for the next financial year
- Weekly Rates:
- Cytonn Money Market Fund closed the week at a yield of 10.66%. To invest, just dial *809#;
- Cytonn High Yield Fund closed the week at a yield of 13.14% p.a. To invest, email us at sales@cytonn.com;
- Phase 1 of The Alma is now 100% sold with early buyers having achieved up to 55% capital appreciation. We are now running promotions:
- For Phase 2: Buy a unit in Phase 2 with a 15-year payment plan and 0% deposit;
- For Phase 1: Get a 10% rent discount on units we manage for investors;
- For inquiries, please email us on properties@cytonn.com;
- For an exclusive tour of Cytonn’s real estate developments, visit: Sharp Investor's Tour and for more information, email us at sales@cytonn.com;
- We continue to offer Wealth Management Training daily, from 9:00 am to 11:00 am, through our Cytonn Foundation. The training aims to grow financial literacy among the general public. To register for any of our Wealth Management Training, click here;
- For Pension Scheme Trustees and members, we shall be having different industry players talk about matters affecting Pension Schemes and the pensions industry at large. Join us every Wednesday from 9:00 am to 11:00 am for in-depth discussions on matters pension;
- Cytonn continues to inform the market on the importance of retirement planning and issues affecting the pensions industry. In this week's article we focus on the adequacy of NSSF savings for your retirement here;
- If interested in our Private Wealth Management Training for your employees or investment group, please get in touch with us through wmt@cytonn.com;
- For recent news about the company, see our news section here;
- We have 10 investment-ready projects, offering attractive development and buyer targeted returns. See further details here: Summary of Investment-ready Projects.
Money Markets, T-Bills & T-Bonds Primary Auction:
During the week, T-bills remained oversubscribed, with the subscription rate coming in at 149.6% down from 271.5% the previous week, the decline in the rate can be attributed to the primary bond auction that closed on 21st July 2020 and had an average subscription rate of 303.0%. The highest subscription rate was on the 91-day paper, which came in 270.4%, down from 746.9% recorded the previous week. The subscription for the 182-day paper also declined to 13.9% from 107.8% recorded the previous week, while the subscription of the 364-day paper decreased to 236.9% from 245.1% recorded the previous week. The oversubscription in recent weeks has partly been attributable to the high liquidity in the money market, as well as Banks’ preference towards government securities as opposed to lending in the wake of the COVID-19 pandemic which has heightened credit risk. This has seen Bank’s holdings in Government domestic debt rising to 54.9% from 54.1% as at the start of the year. The yields on the 91-day paper increased by 10.1 bps to 6.1% from 6.0% recorded the previous week, while that of the 182-day and 364-day papers declined by 8.4 bps and 9.4 bps to 6.4% and 7.4%, respectively. The acceptance rate increased to 99.8%, from 69.8% recorded the previous week, with the government accepting Kshs 35.8 bn of the Kshs 35.9 bn worth of bids received, higher than the weekly quantum of Kshs 24.0 bn.
On the primary bond auction, the period of sale for the recently reopened 3 fixed coupon treasury bonds, FXD1/2020/05, FXD2/2018/10 and FXD1/2019/15 with effective tenors of 5 years, 8 years and 14 years respectively, closed on 21st July 2020. The issue was oversubscribed with the average subscription rate coming in at 303.0%, as the government received bids worth Kshs 181.8 bn, higher than the Kshs 60.0 bn offered, mainly attributable to the high liquidity in the money markets. Yields on the bonds came in at 10.6%, 11.7% and 12.4%, respectively, for the five, ten and fifteen-year papers, which was in-line with our expectations. The government rejected high bids only accepting Kshs 80.9 bn out of the Kshs 181.8 bn worth of bids received, translating to an acceptance rate of 44.5%.
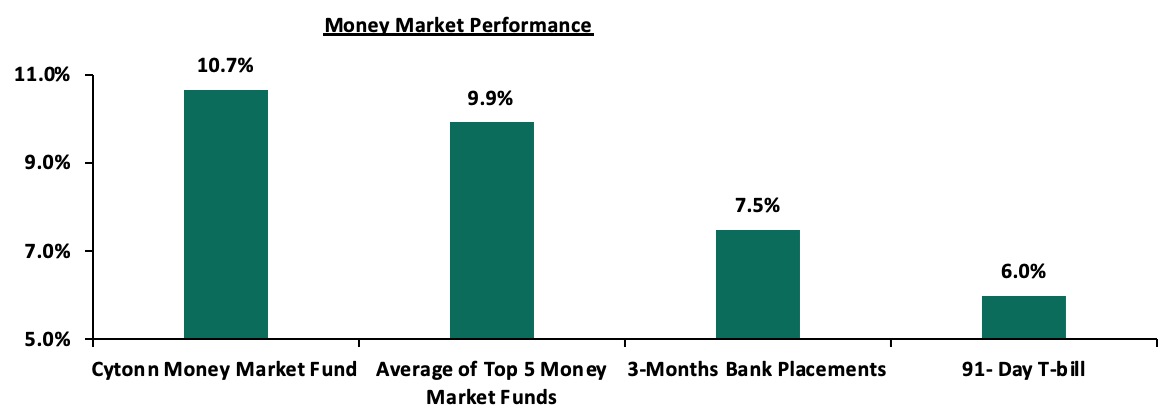
In the money markets, 3-month bank placements ended the week at 7.5% (based on what we have been offered by various banks), while the yield on the 91-day T-bill declined by 0.3% points to close the week at 6.0%, from 6.3% recorded the previous week. The average yield of Top 5 Money Market Funds recorded declined marginally to 9.9% from 10.0% recorded the previous week. The yield on the Cytonn Money Market gained by 0.2% to close the week at 10.7%, higher than the 10.5% recorded the previous week.
Liquidity:
The money market remained liquid during the week with the average interbank rate coming in at 2.3% a marginal rise from 1.8% recorded the previous week and below the 2019 average of 4.3%, mainly supported by government payments and maturing TADS of Kshs 162.2 mn. (TADs are used when the securities held by the CBK for Repo purposes are exhausted or when CBK considers it desirable to offer longer tenor options). The average interbank volumes declined by 43.0% to Kshs 5.5 bn, from Kshs 9.8 bn recorded the previous week. As per the Central Bank of Kenya, commercial banks’ excess reserves came in at Kshs 10.9 bn in relation to the 4.25% Cash Reserve Ratio.
Kenya Eurobonds:
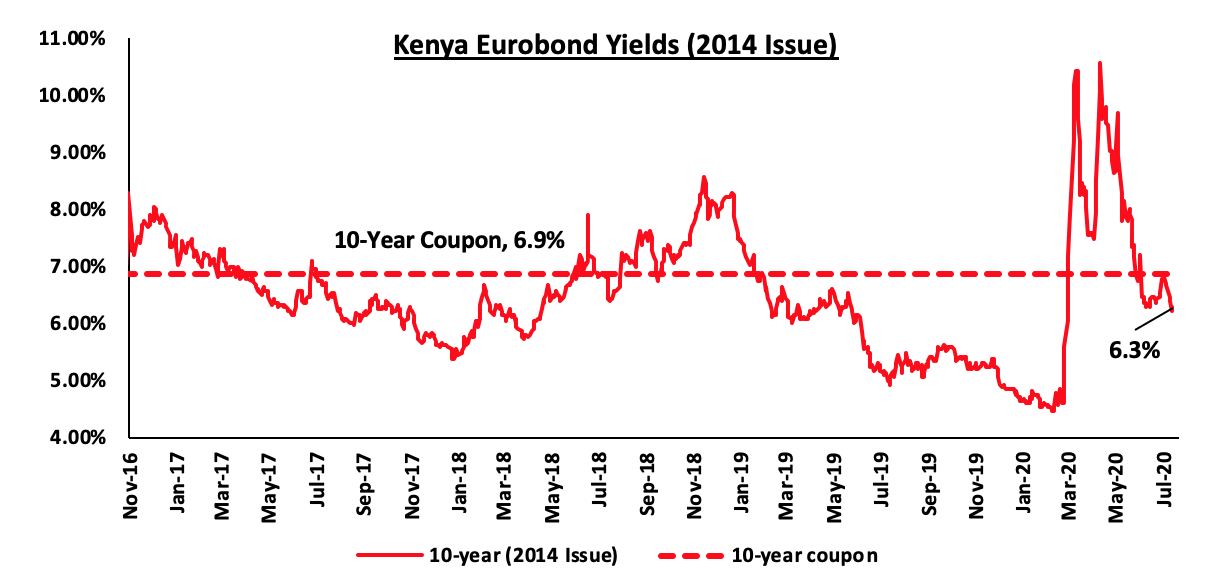
During the week, Eurobond yields were on a downward trend mainly attributable to the improved investor sentiments attributable to the recent easing of coronavirus restrictions. This is despite the continued surge in the coronavirus cases. According to Reuters, the yield on the 10-year Eurobond issued in June 2014 declined by 0.4% points during the week to close at 6.3% from 6.7% recorded the previous week.
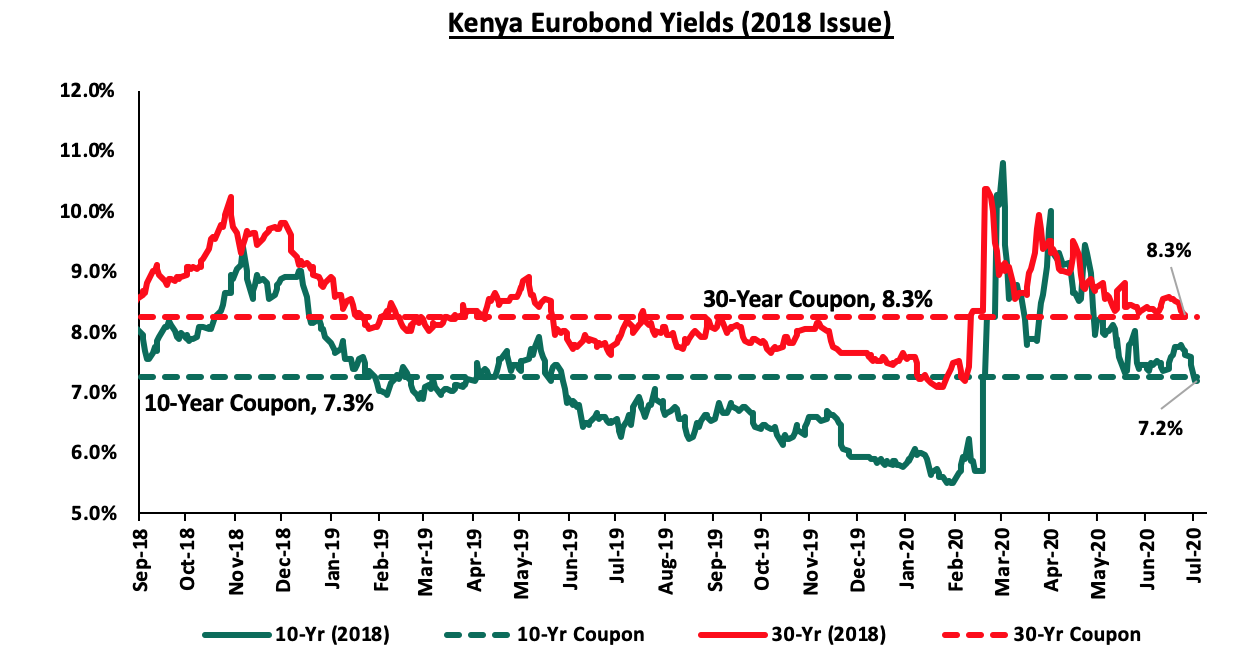
The yields on the 10-year Eurobond issued in 2018 declined by 0.4% points to close at 7.2% from 7.6% recorded the previous week. The yield on the 30-year Eurobonds issued in 2018 also declined by 0.2% points to close at 8.3%, lower than the 8.5% recorded the previous week.
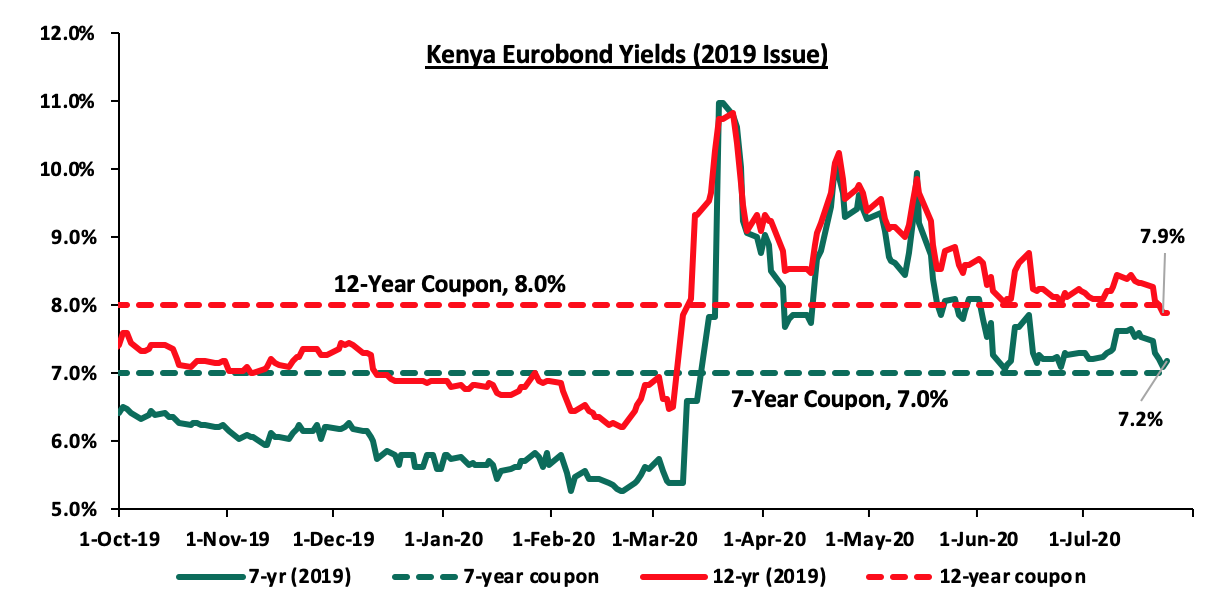
The yields on the 7-year Eurobond and 12-year Eurobond issued in 2019 declined by 0.3% and 0.4%points, respectively to 7.2% and 7.9% from 7.5% and 8.3% recorded the previous week, respectively.
Kenya Shilling:
During the week, the Kenya Shilling depreciated by 0.5% against the US Dollar to close the week at Kshs 108.0, from Kshs 107.5, recorded the previous week, attributable to increased demand for hard currencies by importers who are resuming business after the easing of the pandemic restrictions. On a year-to-date basis, the shilling has depreciated by 6.6% against the dollar, in comparison to the 0.5% appreciation in 2019. We expect continued pressure on the shilling due to:
- Demand from merchandise and energy sector importers as they beef up their hard currency positions,
- A deteriorating current account position, with the current account deficit deteriorating by 10.2% during Q1’2020, to Kshs 110.9 bn, from Kshs 100.6 bn recorded in Q1’2019 attributable to;
-
- 3.0% decline in the secondary income (transfers recorded in the balance of payments whenever an economy provides or receives goods, services, income or financial items) balance, to Kshs 124.1 bn, from Kshs 128.0 bn in Q1’2019, and,
- A 67.0% decline in the services trade balance (the difference between the imports and exports of services) to Kshs 20.4 bn, from Kshs 61.9 bn.
The shilling is however expected to be supported by:
- High levels of forex reserves, currently at USD 9.7 bn (equivalent to 5.9-months of import cover), this above the statutory requirement of maintaining at least 4.0-months of import cover, and the EAC region’s convergence criteria of 4.5-months of import cover, and,
- Improving diaspora remittances evidenced by the 24.0% increase to USD 258.2 mn in May 2020, from USD 208.2 seen the previous month, mainly due to the improvements in economic activities globally, as countries abroad eased their coronavirus restrictions. In terms of y/y performance, diaspora remittances increased by 6.2% to USD 258.2 mn in May 2020, from USD 243.2 mn recorded in May 2019.
Weekly Highlight:
Inflation Projections
We are projecting the y/y inflation rate for July 2020 will remain stable within the range of 4.9% - 5.2%, compared to 4.7% recorded in June. The stable inflation figures will be supported by stable food prices despite an expected increase in the transport index due to the increase in the fuel prices where petrol and diesel prices increased by 12.8% and 23.2%, respectively, while kerosene prices increased by 4.8%.
We expect inflation to remain stable despite supply-side disruption due to COVID-19 as low demand for commodities compensates for the cost-push inflation. The recent reopening of majority of the global markets will also address supply chain disruptions leading to stable import prices.
Rates in the fixed income market have remained relatively stable as the government rejects expensive bids. As a result of depressed revenue collection with the revenue target for FY’2020/2021 at Kshs 1.9 tn, we expect a higher budget deficit, which the Treasury estimates at 7.5% of GDP, creating uncertainty in the interest rate environment as additional borrowing from the domestic market will be required to plug in the deficit. Owing to this uncertain environment, our view is that investors should be biased towards short-term fixed income securities to reduce duration risk.
Market Performance
During the week, the equities market recorded mixed performance, with NASI and NSE 25 recording gains of 1.8% and 0.5%, respectively, while NSE 20 recorded losses of 0.2%, taking their YTD performance to losses of 19.1%, 28.9%, and 23.9%, for NASI, NSE 20 and NSE 25, respectively. The NASI performance was driven by gains recorded by large-cap stocks, with the highest gains being recorded in EABL, Safaricom, BAT and NCBA, which gained by 4.8%, 4.1%, 2.3% and 1.2%, respectively. However, the gains were slowed down by losses recorded by other large-cap stocks, with the highest losses being recorded by Co-operative Bank and Equity Group, which declined by 5.9% and 4.4%, respectively.
Equities turnover declined by 4.0% during the week to USD 30.7 mn, from USD 31.9 mn recorded the previous week, taking the YTD turnover to USD 920.1 mn. Foreign investors remained net sellers during the week, with the net selling position decreasing by 23.2% to USD 12.7 mn, from a net selling position of USD 16.5 mn recorded the previous week, taking the YTD net selling position to USD 266.0 mn.
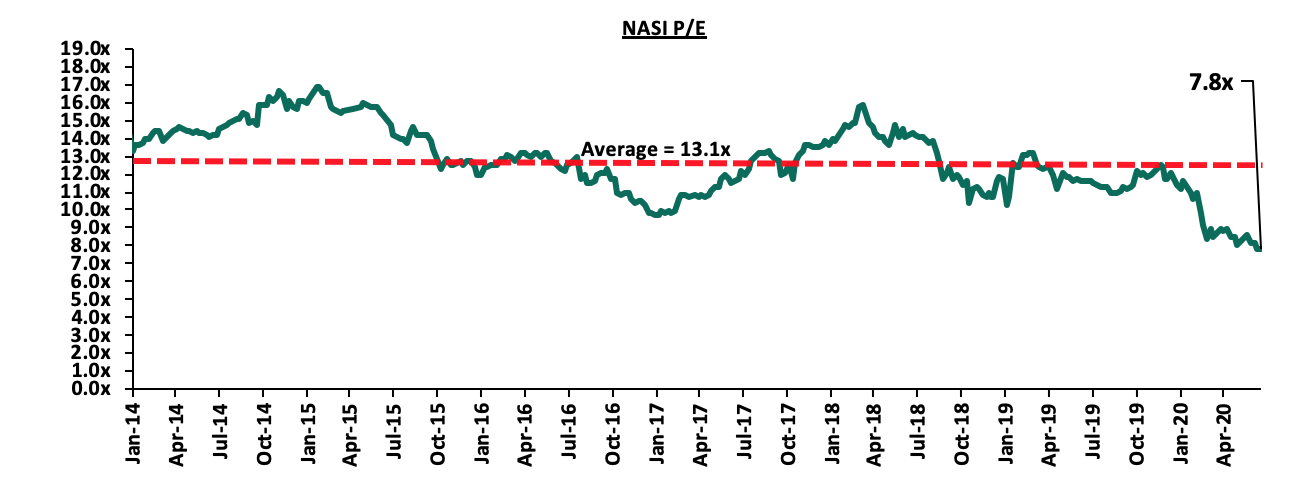
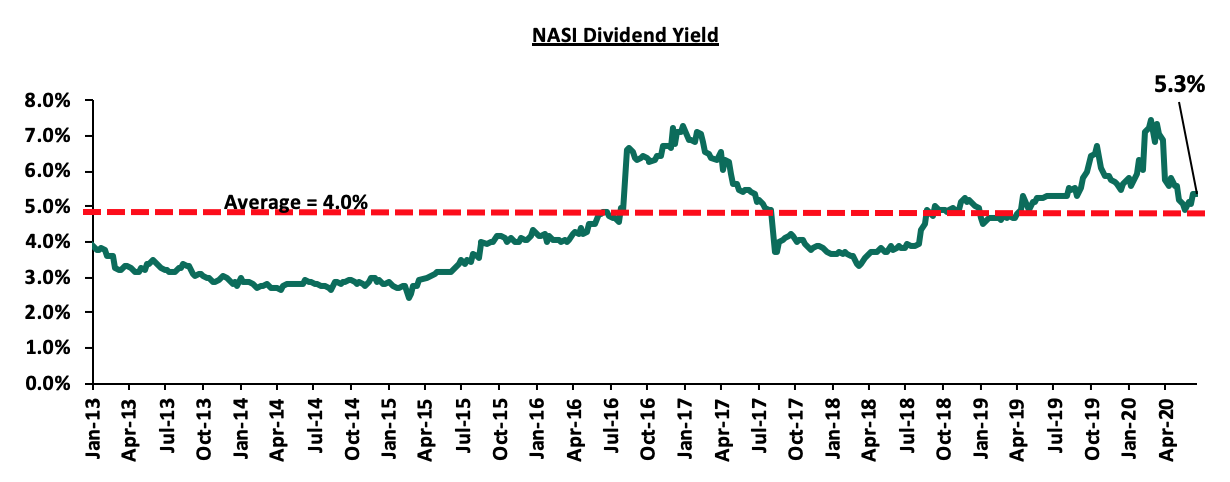
The market is currently trading at a price to earnings ratio (P/E) of 7.8x, 40.3% below the historical average of 13.1x. The average dividend yield is currently at 5.3%, unchanged from the previous week, and 1.3% points above the historical average of 4.0%. With the market trading at valuations below the historical average, we believe there are pockets of value in the market for investors with higher risk tolerance and are willing to wait out the pandemic. The current P/E valuation of 7.8x is at par with the most recent valuation trough of 7.8x experienced in the second week of July 2020. The charts below indicate the historical P/E and dividend yields of the market.
Weekly Highlight
During the week, I&M Holdings plc issued a cautionary statement to its shareholders on its intention to acquire 90.0% of the share capital of Orient Bank Limited Uganda (OBL). Once completed, this will be the third bank acquisition in 2020 after the CBK gave a go-ahead to Nigerian lender, Access Bank PLC to acquire 100.0% stake in Transnational Bank PLC and the 90.0% acquisition of Jamii Bora Bank by Co-operative Bank. The proposed transaction will be subject to approval from the Central Bank of Kenya, Central Bank of Uganda, the Capital Markets Authority and the company shareholders. The transaction will see I&M spend more than Kshs 2.0 bn in the acquisition of the Ugandan Bank. Orient Bank recorded loses of Ushs 1.1 bn (Kshs 30.8 mn) in FY’2019 from profits of Ushs 5.6 bn (Kshs 162.2 mn) in FY’2018, while its book value stood at Ushs 114.1 bn (Kshs 3.3 bn) in FY’2019. The 2019 performance was mainly driven by an increase in the Total Operating Expenses to Ushs 97.2 bn (Kshs 2.8 bn) in FY’2019 from Ushs 81.6 bn (Kshs 2.4 mn) in FY’2018, largely driven by a 172.6% increase in Loan Loss Provisions to Ushs 17.9 bn (Kshs 523.7 mn) in FY’2019, from Ushs 6.6 bn( Kshs 192.1 mn) in FY’2018. The Banks Total Operating Income also declined by 2.0% to Ushs 87.7 bn (Kshs 2.56 bn) in FY’2019, from Ushs 89.5 bn (Kshs 2.61 bn) in FY’2018. In our view, the acquisition will be in line with I&M’s expansion strategy and will also expand its operations in the Ugandan Market thus reducing its reliance on the Kenyan Market. Below is a table showing the combined pro forma financials for the banks:
|
Combined Pro forma Balance Sheet |
|||
|
Balance Sheet |
I&M Holdings Plc Q1’20 |
Orient Bank Ltd FY’19* |
Combined Entity (Kshs bn) |
|
Net Loans and Advances |
182.9 |
8.9 |
191.8 |
|
Total Assets |
336.0 |
23.8 |
359.8 |
|
Customer Deposits |
240.7 |
19.7 |
260.4 |
|
No of Branches |
67 |
13 |
80 |
|
*Converted to Kshs (1 Ushs = 0.029 Kshs) as at 24th July |
|||
This week also saw Access Bank Plc finalize the acquisition of 100.0% stake in Transnational Bank Plc. The Kshs 1.4 bn transaction comes months after the endorsement by the Competition Authority of Kenya and the Central Bank of Kenya in January as highlighted in our Cytonn Weekly #49/2019. Access Bank Nigeria will be among other Nigerian Banks such as Guaranty Trust Bank and United Bank of Africa already in the Kenyan market. The acquisition will see the Nigerian bank inject capital of an undisclosed amount to the loss making Transnational Bank as it seeks to return Transnational Bank to profitability. In Q1’2020, Transnational bank recorded losses of Kshs 2.5 mn, from Kshs 17.1 mn losses recorded in Q1’2019 and has assets worth Kshs 9.7 bn as at Q1’2020. In our view, the transaction will strengthen Kenya’s banking sector given that Access Bank is the largest lender in Nigeria with an asset base of USD 18.7 bn. We believe that continued bank consolidation efforts in Kenya, as highlighted in our Q1’2020 Banking Report, will lead to a stable banking sector, as consolidation continues to eliminate weaker banks. In our view, banks will continue to consolidate to form strategic partnerships and well-capitalized entities capable of navigating the relatively tough operating environment induced by stiff competition. The table below highlights the various transactions in the banking sector in the last 5-years that have either happened, been announced or expected to be concluded:
|
Acquirer |
Bank Acquired |
Book Value at Acquisition (Kshs. Bns) |
Transaction Stake |
Transaction Value |
P/Bv Multiple |
Date |
|
Commercial International Bank |
Mayfair Bank Limited |
1.0 |
51.0% |
Undisclosed |
N/A |
May-20* |
|
Co-operative Bank |
Jamii Bora Bank |
3.4 |
90.0% |
1.0 |
0.3x |
Mar-20* |
|
Access Bank PLC (Nigeria) |
Transnational Bank PLC. |
1.9 |
100.0% |
1.4 |
N/A |
Feb-20 |
|
KCB Group |
National Bank of Kenya |
7.0 |
100.0% |
6.6 |
0.9x |
Sep-19 |
|
CBA Group |
NIC Group |
33.5 |
53%:47% |
23.0 |
0.7x |
Sep-19 |
|
Oiko Credit |
Credit Bank |
3.0 |
22.8% |
1.0 |
1.5x |
Aug-19 |
|
CBA Group** |
Jamii Bora Bank |
3.4 |
100.0% |
1.4 |
0.4x |
Jan-19 |
|
AfricInvest Azure |
Prime Bank |
21.2 |
24.2% |
5.1 |
1.0x |
Jan-19 |
|
KCB Group |
Imperial Bank |
Unknown |
Undisclosed |
Undisclosed |
N/A |
Dec-18 |
|
SBM Bank Kenya |
Chase Bank Ltd |
Unknown |
75.0% |
Undisclosed |
N/A |
Aug-18 |
|
DTBK |
Habib Bank Kenya |
2.4 |
100.0% |
1.8 |
0.8x |
Mar-17 |
|
SBM Holdings |
Fidelity Commercial Bank |
1.8 |
100.0% |
2.8 |
1.6x |
Nov-16 |
|
M Bank |
Oriental Commercial Bank |
1.8 |
51.0% |
1.3 |
1.4x |
Jun-16 |
|
I&M Holdings |
Giro Commercial Bank |
3.0 |
100.0% |
5.0 |
1.7x |
Jun-16 |
|
Mwalimu SACCO |
Equatorial Commercial Bank |
1.2 |
75.0% |
2.6 |
2.3x |
Mar-15 |
|
Centum |
K-Rep Bank |
2.1 |
66.0% |
2.5 |
1.8x |
Jul-14 |
|
GT Bank |
Fina Bank Group |
3.9 |
70.0% |
8.6 |
3.2x |
Nov-13 |
|
Average |
75.9% |
1.4x |
||||
|
* Announcement Date ** Deals that were dropped |
||||||
The chart below highlights the ratio of the number of banks per 10.0 mn people in Kenya, South Africa and Nigeria
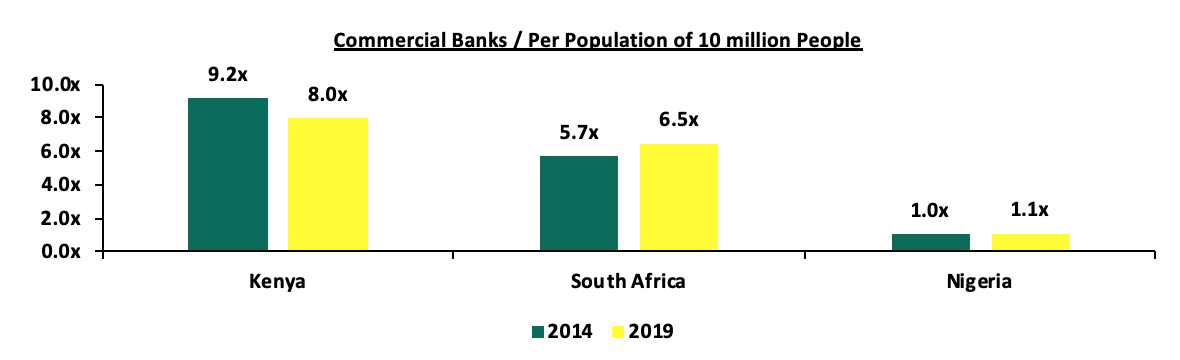
The number of banks in Kenya will be 38, compared to 43 banks from 5-years ago. The ratio of the number of banks per 10.0 million people in Kenya now stands at 8.0x, compared with a ratio of 9.2x, 5 years ago. However, despite the ratio improving, Kenya still remains overbanked as the number of banks remains relatively high compared to the population.
Universe of Coverage:
We are currently reviewing our target prices for the Banking sector coverage.
We are “Neutral” on equities for investors because, despite the sustained price declines, which have seen the market P/E decline to below its historical average presenting investors with attractive valuations in the market, the economic outlook remains grim.
- Residential sector
During the week, Cytonn Investments, an investments management firm and real estate developer, announced that construction activities had resumed in phase 2 of their 600-unit comprehensive residential development in Ruaka, Kiambu County. The developer suspended construction works at the project in April this year due to disruptions caused by the ongoing COVID-19 pandemic such as shorter working hours. The COVID-19 pandemic has resulted in an unprecedented disruption to the Kenyan economy over the past few months, with the building and construction sector being one of hardest hit sectors. According to the Architectural Association of Kenya(AAK) Impact of COVID-19 on Built Environment Industry Operations survey conducted in April, 29.8% of respondents, who were professionals working in the built environment, indicated that several of their projects had stalled, whereas 63.0% stated that there was a slowdown in progress in the various ongoing projects. The resumption of construction activities in the development underlines the ongoing recovery of the economy prompting the gradual revival of the construction sector. We expect the sector to pick up in the medium to long term, buoyed by; (i) the gradual reopening of the economy which has been supported by the easing of movement restrictions which is expected to minimize supply chain bottlenecks of equipment and construction materials, (ii) improving infrastructure with ongoing projects by the National Government such as the Nairobi - Mau Summit Highway and various upcoming projects such as the JKIA – Westlands Expressway, and (iii) various monetary and fiscal policies by government such as; lowering of the Central Bank Rate (CBR) to 7.0%, and, lowering of the Cash Reserve Ratio (CRR) by 1.0% to 4.25%, to increase the available cash for on lending and setting aside loans for onward lending to various sectors.
- Hospitality Sector
During the week, the Ministry of Tourism and Wildlife Cabinet Secretary, Najib Balala, announced that the National Government had set aside Kshs 10 bn aimed at offering cheap loans to hotels and firms operating in the tourism sector through a state-backed credit scheme. The funds, which are expected to be utilized in the renovation of existing facilities and the restructuring of business operations will be available at interest rates of 5.0%-7.0% p.a and the firms will be required to start making repayments 2 years from the date of issuance. The move is a measure by the National Government to ease financial distress on hospitality facilities which are experiencing reduced revenue inflows attributed to the ongoing COVID-19 pandemic, with the cabinet secretary estimating the total loss to be approximately 50.0% of the Kshs 163.6 bn total revenue generated by the sector in 2019. We expect the move by the ministry, coupled with other measures such as; (i) the restructuring of Kshs 634 mn loans to hospitality facilities affected by the Covid-19 pandemic by Tourism Finance Corporation (TFC), a financial institution with the mandate of facilitating and providing affordable development funding and advisory services to the Kenyan tourism industry, (ii) the formation of the National Tourism and Hospitality Protocols Taskforce meant to develop tourism and hospitality protocols and guidelines in response to COVID-19, and, (iii) the easing of movement restrictions along with the expected resumption of international flights, to cushion the hospitality sector and enhance its recovery in the medium term.
In relation to the above, the recent easing of movement restrictions and the anticipated resumption of international passenger flights have prompted the reopening of hospitality facilities such as safari lodges and camps, and, city hotels, as the sector anticipates an increase in tourist arrivals. During the week, PrideInn Azure Hotel, a 164-room hotel located in Westlands, resumed operations 4 months after its closure, while the Maasai Mara Game Reserve reopened various safari lodges and camps. The continued reopening of top tier hotels since May, following the government’s approval for restaurants located in major towns to resume operations albeit under strict safety measures, indicates the gradual recovery of the hospitality sector in Kenya following the adverse effects of the Coronavirus pandemic. Some of the key hospitality facilities that have reopened so far include;
|
Hotels That Have Resumed Operations |
Location |
|
Villa Rosa Kempinski |
Chiromo Rd., Nairobi |
|
Ole Sereni |
Mombasa Road |
|
Hemingways Watamu |
Watamu, Mombasa |
|
Radisson Blu Arboretum |
Arboretum Dr., Nairobi |
|
Trademark Hotel |
Limuru Road |
|
DusitD2 Nairobi |
Riverside Dr., Nairobi |
|
Maasai Mara Game Reserve(safari lodges and camps) |
Narok County |
The ongoing reopening of hospitality services is a positive step for hotel investors who have been grappling with revenue drops, attributed to a general slowdown in activities due to the ongoing pandemic. We thus expect hotels to embark on a recovery path as domestic tourism slowly picks up due to the easing of movement restrictions and the expected resumption of international passenger flights on August 1st which may see international tourists trickling in, subject to lifting of international travel bans across different regions globally, such as Europe and Asia which account for approximately 56.8% and 13.9% of the international tourist arrivals into Kenya, respectively.
We expect the real estate sector to continue recording increased activities supported by; the gradual reopening of the economy and easing of movement restrictions, the reopening of hospitality facilities, and, supportive government policies such as the extension of loans to hospitality services.
This week our focus is on the Nairobi Metropolitan Area (NMA) residential sector. We showcase the sector’s performance in the region in terms of price appreciation, rental yields and market uptake, based on research on 38 areas located within the Nairobi Metropolis. We also look at the recent developments impacting the sector as well as factors that are expected to shape demand and supply and conclude with a look at the investment opportunities as well as the sector’s overall outlook for the next financial year. As such, we shall look at the following:
- Overview of the Residential Sector,
- Recent Developments,
- Residential Market Performance,
- Investment Opportunity, and
- Conclusion
Section I: Overview of the Residential Sector
In 2019, the residential sector was marked by increasing affordability concerns amongst homebuyers amidst rising costs of living coupled by massive job losses and general economic uncertainty. However, according to KNBS Economic Survey 2020, despite the slow economic growth in 2019 which came in at 5.4%, the real estate sector, and by extension the residential market, was one of the sectors that continued to boost the country’s growth. The sector was also poised for further improvement with the anticipated increase in liquidity following the government’s repeal of the interest rate cap regime in November 2019, and as a result, the sector had started to stabilize at the end of 2019 and into the first quarter of 2020 recording a slight uptick in prices and rents. However, with the advent of the COVID-19 pandemic and its quick spread, and the subsequent adverse impact on the global economy, we expect the sector’s performance to see some negative performance. Generally, the measures imposed by the government to curb the pandemic’s spread as well as the global lockdowns suppressed construction activities negatively in the second quarter while housing demand remained sluggish as investors and homebuyers adopted a wait and see stance and incomes severely dented by the pandemic.
We expect the following factors to shape demand in the residential sector:
- Housing Deficit: The need for affordable housing is currently at an all-time high considering the current economic downturn which has seen increased unemployment and the subsequent drop in disposable incomes. Additionally, the government’s Affordable Housing initiative continues to lag behind expectations and therefore, the current housing deficit in Kenya which is estimated at 2.0 mn units is expected to continue increasing,
- Demographics: According to the 2019 census data, Kenya currently has a population of 47.6 mn persons, growing at 2.2% per annum, which is 1.0% points higher than the global average. Additionally, Kenya’s urban population continues to grow rapidly accounting for 31.1% of the total population and estimated to grow by 4.3% p.a. according to the World Bank. This demographic trend is expected to continue supporting housing demand especially in urban areas, exacerbating the need for decent and low-cost housing, and
- Access to Credit: The repeal of the interest cap regime in November 2019 was expected to enhance market liquidity and thereby stimulate growth of sectors such as real estate which are capital intensive. Additionally, according to Kenya Mortgage Refinancing Company’s Chief Executive Officer Johnstone Oltetia, the institution will begin refinancing mortgage portfolios in Q3’2020 and as such, we expect homebuyers to begin accessing to affordable credit for home-buying in the near term.
However, with the ongoing crisis, demand is expected to remain relatively weak due to; (i) weak macroeconomic environment leading to increased credit risk, (ii) decline in demand from expatriates due to the ongoing global lockdown, and (iii) decline in purchasing power with the increase in unemployment rates.
In terms of supply, the residential sector was largely constrained by insufficient access to affordable funding by developers, the challenging local land tenure systems, and approval delays between the months of June and August 2019. In 2020, new supply is also expected to slow down owing to:
- Slow Economic Growth: According to the World Bank, Kenya’s economic growth is expected to decelerate to 1.5% in 2020 from 5.4% in 2019, whereas growth in Sub-Saharan Africa is projected to slip into its first recession in 25 years with the average growth expected to decline from 2.4% in 2019 to a range of between (2.1%) and (5.1%) in 2020,
- Insufficient Access to Credit: With the increase in non-performing loans in the sector and increased economic uncertainty, we expect developers to continue experiencing barriers to adequate financial access. Currently, lending institutions have also tightened their lending standards. We, therefore, expect developers to seek alternative sources of financing such as Real Estate Investment Trusts and bonds,
- Reduced Revenues: The COVID-19 pandemic has seen real estate revenue collections drop significantly due to declines in economic activities and the subsequent decline in disposable incomes, thereby affecting developers’ ability to continue with development activities,
- Supply Chains Disruption: The global lockdown and partial national lockdowns in Kenya means developers are increasingly finding it difficult to access construction materials, which is likely to increase the input costs thus raising development costs higher, and
- High Development Costs: According to Centre for Affordable Housing Finance in Africa, Kenya remains as one the countries with the highest constructions costs in Africa at Kshs 51,064 per SQM on average, compared to countries like Nigeria and South Africa with Kshs 43,264 and Kshs 30,245, respectively. This is largely attributable to relatively high land costs, which as per the Cytonn Land Report 2020 grew by 1.5% in 2020 with Nairobi suburbs recording up to Kshs 419 mn per acre.
However, we expect developers to seek alternative ways of improving their margins. As such, we expect the supply side to see an increase in joint venture deals and public-private partnerships (PPP) with institutions like foreign investment institutions seeking to enter the market, and local pension funds seeking to diversify their investments.
Section II: Recent Developments
In terms of regulation, the government announced a couple of policies and measures affecting the residential sector namely:
- Finance Act 2020: (i) The Finance Act increased the amount of rental income that qualifies for Residential Rental Income (RRI) Tax to income to between Kshs 288,000 and Kshs 15 mn per annum from the initial income of between Kshs 144,000 and Kshs 10 mn, and (ii) The Act repealed section 22C of the Income Tax Act thereby abolishing Registered Home Ownership Savings (HOSP) schemes in Kenya effective January 2021,
- Tax (Amendment) Act 2020: The Act saw the amendment of Section 38 of the Retirement Benefits Act (1997) to allow access of retirement benefits for purposes of purchasing of a residential house. In the draft RBA regulations, the amount used shall be the lower of either 40% of the savings, Kshs 7.0 mn or the purchase price of the house. This is expected to unlock a significant amount of pension funds towards the housing sector,
- Institutional Regulations: (i) Following the president’s directive in November 2019 to make NHDF contributions voluntary rather than mandatory, the Cabinet Secretary for Housing this year drafted the new NHDF regulations which are aimed at guiding the institutions full operationalization, and (ii) the Central Bank of Kenya finally gazetted the Mortgage Refinancing Companies regulations in August 2019. The facility is slated to begin refinancing mortgage portfolios by Q3’2020,
- Finance Act 2019: The Act, which was assented into law in November 2019, introduced a couple of reforms: (i) inclusion of Fund Managers or Investment Banks registered under the Capital Markets Act as approved institutions for Home Ownership and Savings Plan (HOSP), (ii) stamp duty exemption on the transfer of a house constructed under the affordable housing scheme from the developer to the National Housing Corporation, and, (iii) exemption of goods supplied for the direct and exclusive use in the construction of houses under the affordable housing scheme from Value Added Tax (VAT).
In terms of construction activities, we continued to see key players launching projects with low-cost housing being the main focus, and a few upper market projects. Notable project launched during the period are as shown below:
|
Various Projects Launched in 2019/2020 |
|||||||
|
Project |
Developer |
Location |
Segment |
Category |
No. of Units |
Estimated Value (Kshs mn) |
Expected Completion Date |
|
Belasi |
Juja |
Detached |
Lower mid-End |
30 |
165 |
N/A |
|
|
Zaria Village |
Safaricom Investment Committee(SIC) |
Kiambu |
Detached |
Lower Mid-End |
331 |
N/A |
N/A |
|
Pazuri Holiday Homes |
Superior Homes |
Kilifi |
Detached |
Upper Mid-End |
372 |
7,000 |
Phase I: 2020 |
|
Heartland Home |
Ever Forgarden Limited |
Kilimani |
Apartments |
Upper Mid-End |
900 |
- |
- |
|
|
New Forhome Company |
Kilimani |
Apartments |
Upper Mid-End |
240 |
- |
- |
|
Wilma Towers |
Vaal Real Estate |
Kilimani |
Apartments |
Upper Mid-End |
227 |
1,500 |
October 2020 |
|
Greatwall Gardens III |
Erdemann Properties |
Mlolongo |
Apartments |
Lower mid-End |
288 |
3,200 |
|
|
Eboss Investments |
Eboss Investments |
Ruiru |
Detached |
Lower mid-End |
120 |
- |
- |
|
Tilisi |
Tilisi |
Tigoni |
Detached |
Upper Mid-End |
186 |
3,300 |
October 2021 |
|
Total |
2,694 |
15,165 |
|||||
Online Sources
While construction activities grounded to a halt in the second quarter of 2020, we expect developers to resume works as the economy regains momentum in Q3 and Q4’2020.
Section III: Residential Market Performance
In terms of performance, average total returns improved marginally in FY’20 averaging at 5.0%, 0.3% points higher than 4.7% recorded in FY’19, and can be attributed to annual rent increases. Price appreciation, however, declined averaging at (0.1%), 0.4% points lower compared to 0.3% recorded in FY’19. Market uptake remained subdued coming in at 18.3% on average, 2.6% points lower than 20.9% recorded last year, indicating weak demand amidst a tough economic environment. As such, the average price per SQM came in at Kshs 113,972, 4.5% lower than FY’19 average of Kshs 119,330, due to developers offering price discounts in a bid to attract buyers as well as prices remaining flat in majority of the markets.
(All Values in Kshs Unless Stated Otherwise)
|
Residential Performance Summary FY’20 |
||||||||
|
Segment |
Typology |
Average Price Per SQM |
Average Rent Per SQM |
Average Annual Uptake |
Average Occupancy |
Average Rental Yield |
Average Y/Y Price Appreciation |
Average Total Returns |
|
High-End |
Detached |
184,843 |
736 |
16.5% |
82.3% |
4.2% |
0.0% |
4.2% |
|
Upper Mid-End |
Detached |
140,642 |
601 |
17.7% |
88.9% |
4.6% |
0.9% |
5.6% |
|
Lower Mid-End |
Detached |
69,484 |
317 |
17.5% |
83.7% |
4.6% |
(0.5%) |
4.1% |
|
Upper Mid-End |
Apartments |
116,093 |
610 |
18.5% |
87.9% |
5.4% |
(0.7%) |
4.6% |
|
Lower Mid-End |
Apartments |
90,939 |
526 |
20.3% |
86.6% |
5.8% |
0.1% |
5.9% |
|
Satellite Towns |
Apartments |
81,833 |
426 |
19.5% |
84.3% |
5.4% |
(0.1%) |
5.3% |
|
Residential Market Average |
|
113,972 |
536 |
18.3% |
85.6% |
5.0% |
(0.1%) |
5.0% |
Source: Cytonn Research
Notably, average rental yields improved significantly to 5.0% from 4.3% last year, indicating sustained demand for rental housing whereas demand for sale houses declined amidst a tough financial environment.
|
Residential Market Performance Summary: FY’20/FY’19 Comparison |
|||||||||
|
Segment |
Average Rental Yield FY'20 |
Average Y/Y Price Appreciation FY'20 |
Average Total Returns FY'20 |
Average Rental Yield FY'19 |
Average Y/Y Price Appreciation FY'19 |
Average Total Returns FY'19 |
Change in Rental Yield |
Change in Y/Y Price Appreciation |
Change in Total Returns (% Points) |
|
High End |
4.2% |
0.0% |
4.2% |
3.7% |
0.1% |
3.8% |
0.5% |
(0.1%) |
0.4% |
|
Upper Mid-End |
4.6% |
0.9% |
5.6% |
4.1% |
0.1% |
4.2% |
0.5% |
0.8% |
1.4% |
|
Lower Mid-End |
4.6% |
(0.5%) |
4.1% |
3.9% |
0.4% |
4.3% |
0.7% |
(0.9%) |
(0.2%) |
|
Detached Average |
4.5% |
0.1% |
4.6% |
3.9% |
0.2% |
4.1% |
0.6% |
(0.1%) |
0.5% |
|
Upper Mid-End |
5.4% |
(0.7%) |
4.6% |
5.0% |
0.4% |
5.3% |
0.4% |
(1.1%) |
(0.7%) |
|
Lower Mid-End |
5.8% |
0.1% |
5.9% |
4.8% |
0.4% |
5.3% |
1.0% |
(0.3%) |
0.6% |
|
Satellite Towns |
5.4% |
(0.1%) |
5.3% |
4.5% |
0.6% |
5.1% |
0.9% |
(0.7%) |
0.2% |
|
Apartments Average |
5.5% |
(0.2%) |
5.3% |
4.8% |
0.5% |
5.2% |
0.8% |
(0.7%) |
0.0% |
|
Residential Market Average |
5.0% |
(0.1%) |
5.0% |
4.3% |
0.3% |
4.7% |
0.7% |
(0.4%) |
0.3% |
|
|||||||||
Source: Cytonn Research
Sub-Market Analysis
In our submarket analysis, we classify the various suburbs in the Nairobi Metropolitan Area into three segments
- High End Segment – Consists of prime suburbs in Nairobi, such as Karen, Runda and Kitisuru. Most of these zones have been zones for low rise residential developments only and are characterized by palatial villas and bungalows on half acre parcels
- Upper Middle Income Segment – Consists of suburbs such as Kilimani, Lavington, Kileleshwa, Loresho and Ridgeways among others. The population in these zones are middle class but with higher incomes than the average characterization of middle class. They are zones for both high rise and low density houses.
- Lower Middle Income Segment – Consists of suburbs in Nairobi habited by middle class such as Kikuyu, Ruaka, Dagoretti, Upper Kabete(Uthiru and parts of Mountain View), and Ngong Road(Race Course, Lenana, Corner), among others
- Detached Units
The detached market registered average rental yields of 4.5%, 0.6% points higher than 3.9% recorded in FY’19 on account of a vibrant rental market evidenced by the relatively high occupancy rates averaging at 85.0% from 81.4% in FY’19. The high-end market, however, recorded subdued performance with returns averaging 4.2%. This is largely due to subdued price growth as Rosslyn and Lower Kabete recorded negative averages of (0.1%) and (1.2%), respectively, attributable to decline in asking prices as developers attempt to sell off old stock as well as competition from other high-end markets such as Kitisuru and Runda.
The upper mid-end market recorded an annual price appreciation of 0.9% compared to other detached markets, testament to the relatively high demand from the expanding middle class.
The lower mid-end market recorded subdued performance with price appreciation averaging (0.5%). This is due to decline in asking prices especially in areas such as Ngong, Athi River and Syokimau owing to increased supply amidst minimal uptake especially as lower middle income earners continued to reel from a tough economic environment.
Ridgeways recorded the highest price appreciation and annual returns at 3.0% and 8.5%, respectively, compared to the detached markets averages of 0.1% and 4.6%. The area’s performance is boosted by the relatively low supply coupled by presence of good infrastructure and amenities as well as proximity to Runda and Muthaiga, which are high-end areas.
|
Detached Units’ Performance 2019/20 |
||||||||||||
|
Area |
Average Occupancy FY’20 |
Average Annual Uptake FY’20 |
Average Rental Yield FY’20 |
Average Y/Y Price Appreciation FY’20 |
Annual Total Returns FY’20 |
Average Rental Yield FY’19 |
Average Price Appreciation FY’19 |
Total returns FY’19 |
Change in Rental Yield (% Points) |
Change in Price Appreciation (% Points) |
Change in Total Returns (% Points) |
|
|
High-End |
||||||||||||
|
Runda |
89.1% |
17.6% |
4.3% |
0.7% |
5.0% |
4.0% |
1.8% |
5.8% |
0.3% |
(1.1%) |
(0.8%) |
|
|
Rosslyn |
85.7% |
14.0% |
4.7% |
(0.1%) |
4.7% |
4.3% |
(2.6%) |
1.7% |
0.4% |
2.5% |
3.0% |
|
|
Karen |
83.7% |
17.2% |
4.1% |
0.3% |
4.4% |
3.0% |
1.8% |
4.8% |
1.1% |
(1.5%) |
(0.4%) |
|
|
Kitisuru |
85.4% |
18.2% |
4.4% |
0.0% |
4.4% |
3.7% |
(0.4%) |
3.2% |
0.7% |
0.4% |
1.2% |
|
|
Lower Kabete |
67.3% |
15.6% |
3.7% |
(1.2%) |
2.5% |
3.3% |
0.0% |
3.3% |
0.4% |
(1.2%) |
(0.8%) |
|
|
Average |
82.3% |
16.5% |
4.2% |
0.0% |
4.2% |
3.7% |
0.1% |
3.80% |
0.6% |
(0.2%) |
0.4% |
|
|
Upper Mid-End |
||||||||||||
|
Ridgeways |
90.0% |
17.8% |
5.5% |
3.0% |
8.5% |
5.0% |
0.0% |
5.0% |
0.5% |
3.0% |
3.5% |
|
|
South B/C |
94.9% |
18.6% |
5.2% |
0.6% |
5.8% |
4.6% |
(0.7%) |
3.9% |
0.6% |
1.3% |
1.9% |
|
|
Lang’ata |
87.4% |
17.8% |
4.9% |
0.9% |
5.8% |
4.7% |
(1.7%) |
3.0% |
0.2% |
2.6% |
2.8% |
|
|
Lavington |
80.2% |
18.8% |
4.0% |
1.6% |
5.6% |
3.3% |
(0.3%) |
3.0% |
0.7% |
1.9% |
2.6% |
|
|
Runda Mumwe |
85.5% |
24.1% |
4.8% |
0.7% |
5.5% |
4.3% |
1.5% |
5.8% |
0.5% |
(0.8%) |
(0.3%) |
|
|
Loresho |
95.8% |
14.6% |
4.5% |
(0.3%) |
4.2% |
4.5% |
1.7% |
6.2% |
(0.0%) |
(2.0%) |
(2.0%) |
|
|
Redhill |
88.8% |
12.6% |
3.4% |
0.1% |
3.5% |
3.3% |
0.3% |
3.6% |
0.1% |
(0.2%) |
(0.1%) |
|
|
Average |
88.9% |
17.7% |
4.6% |
0.9% |
5.6% |
4.1% |
0.1% |
4.2% |
0.4% |
0.8% |
1.2% |
|
|
Lower Mid-End |
||||||||||||
|
Ruiru |
67.3% |
20.6% |
5.5% |
0.3% |
5.8% |
5.1% |
0.9% |
6.0% |
0.4% |
(0.6%) |
(0.2%) |
|
|
Kitengela |
88.3% |
17.7% |
5.2% |
0.0% |
5.2% |
3.1% |
1.6% |
4.3% |
2.1% |
(1.6%) |
0.9% |
|
|
Thika |
82.3% |
10.0% |
4.0% |
0.0% |
4.0% |
4.6% |
0.0% |
4.6% |
(0.6%) |
0.0% |
(0.6%) |
|
|
Juja |
90.1% |
17.1% |
3.8% |
0.0% |
3.8% |
2.7% |
(2.1%) |
0.7% |
1.1% |
2.1% |
3.1% |
|
|
Syokimau |
79.8% |
16.7% |
4.8% |
(1.1%) |
3.7% |
3.4% |
0.0% |
3.4% |
1.4% |
(1.1%) |
0.3% |
|
|
Athi River |
94.5% |
18.2% |
4.7% |
(1.2%) |
3.5% |
4.5% |
0.6% |
5.0% |
0.2% |
(1.8%) |
(1.5%) |
|
|
Ngong |
83.5% |
14.4% |
3.9% |
(1.1%) |
2.7% |
3.2% |
0.3% |
4.8% |
0.7% |
(1.4%) |
(2.1%) |
|
|
Average |
83.7% |
16.4% |
4.6% |
(0.5%) |
4.1% |
3.9% |
0.4% |
4.3% |
0.8% |
(0.6%) |
0.0% |
|
|
Detached Units’ Average |
85.0% |
16.9% |
4.5% |
0.1% |
4.6% |
3.9% |
0.2% |
4.1% |
0.6% |
(0.1%) |
0.5% |
|
|
||||||||||||
Source: Cytonn Market Research
- Apartments
With increased supply and thus, competition among developers, apartment prices remained subdued recording an average price appreciation of (0.2%), 0.7% points lower than FY’19. However, the rental yields remained relatively strong averaging at 5.5% compared to 4.8% last year, attributable to an increase in occupancy rates which averaged at 86.3% compared to 82.8% during the same period in 2019.
The upper mid-end segment recorded a mixed performance with an average price appreciation of (0.7%) as markets like Kileleshwa and Kilimani continued to experience a price correction. This is attributable to increased supply in the markets thus leading to downward pressure on prices amidst heightened competition among developers.
Apartments in lower mid-end suburbs recorded the highest total annual returns at 5.9% driven by demand from the growing middle class in Nairobi. Dagoretti recorded the highest price appreciation at 3.1%. This was due to increase in asking prices especially in projects previously selling as off-plan. The area also appeals to investors due to attractive rental yields, which averaged at 6.2% boosted by demand from Nairobi’s working population in surrounding commercial nodes such as Kilimani, Upperhill, and Westlands.
In Satellite Towns, apartments recorded a slight decline in price appreciation which came in at (0.1%) owing to decline in asking prices in areas such as kikuyu and Syokimau amidst reduced uptake. Thindigua recorded the highest annual total returns at 7.9% supported by a relatively high price appreciation which came in at 2.0%. This is due to continued demand in the area driven by the area’s proximity to the CBD, increased availability of amenities along Kiambu Road as well as proximity to upper markets such as Runda.
Areas such as Kahawa West and Kikuyu recorded high declines in asking prices with price appreciation averaging (1.4%) and (1.7%), respectively, indicating a drop in demand. Kahawa West continues to lose in appeal due to increased densification and lack of sufficient infrastructure while Kikuyu faces competition from other satellite towns such as Thindigua and Ruaka, thus suppressing price growth.
|
Apartments Performance 2019/20 |
|||||||||||
|
Area |
Average Occupancy FY’20 |
Average Annual Uptake FY’20 |
Average Rental Yield FY’20 |
Average Y/Y Price Appreciation FY’20 |
Annual Total Returns FY’20 |
Average Rental Yield FY’19 |
Average Price Appreciation FY’19 |
Total returns FY’19 |
Change in Rental Yield (% Points) |
Change in Price Appreciation (% Points) |
Change in Total Returns (% Points) |
|
Upper Mid-End |
|||||||||||
|
Westlands |
89.6% |
23.9% |
5.2% |
1.6% |
6.8% |
5.2% |
0.2% |
5.4% |
0.0% |
1.4% |
1.4% |
|
Parklands |
95.7% |
17.1% |
5.8% |
0.3% |
6.1% |
5.1% |
(0.3%) |
4.8% |
0.7% |
0.6% |
1.3% |
|
Loresho |
90.8% |
13.9% |
5.2% |
0.0% |
5.2% |
4.3% |
1.4% |
5.7% |
0.9% |
(1.4%) |
(0.5%) |
|
Kilimani |
88.3% |
20.0% |
5.8% |
(2.7%) |
3.1% |
5.6% |
0.0% |
5.6% |
0.2% |
(2.7%) |
(2.5%) |
|
Kileleshwa |
75.3% |
17.6% |
5.0% |
(3.0%) |
2.0% |
4.2% |
0.0% |
4.2% |
0.8% |
(3.0%) |
(2.2%) |
|
Average |
87.9% |
18.5% |
5.4% |
(0.7%) |
4.6% |
4.9% |
0.4% |
5.3% |
0.5% |
(1.1%) |
(0.7%) |
|
Lower Mid-End: Suburbs |
|||||||||||
|
Dagoretti |
87.0% |
21.9% |
6.2% |
3.1% |
9.3% |
5.1% |
0.0% |
5.1% |
1.1% |
3.1% |
4.2% |
|
South C |
96.9% |
22.7% |
6.0% |
0.1% |
6.1% |
4.8% |
0.8% |
5.6% |
1.2% |
(0.7%) |
0.5% |
|
Langata |
94.5% |
21.3% |
5.6% |
0.5% |
6.1% |
5.5% |
1.3% |
6.8% |
0.1% |
(0.8%) |
(0.7%) |
|
Donholm |
89.6% |
16.3% |
5.3% |
0.0% |
5.3% |
5.0% |
(0.1%) |
4.9% |
0.3% |
0.1% |
0.4% |
|
Upper Kabete |
76.1% |
23.2% |
6.0% |
(1.4%) |
4.6% |
4.3% |
1.0% |
5.3% |
1.7% |
(2.4%) |
(0.7%) |
|
Ngong Road |
76.2% |
23.3% |
5.3% |
(0.6%) |
4.7% |
4.5% |
0.9% |
5.4% |
0.8% |
(1.5%) |
(0.7%) |
|
Kahawa West |
85.6% |
13.3% |
5.9% |
(1.4%) |
4.5% |
3.9% |
(0.7%) |
3.1% |
2.0% |
(0.7%) |
1.4% |
|
Average |
86.6% |
20.3% |
5.8% |
0.0% |
5.8% |
4.8% |
0.4% |
5.3% |
1.0% |
(0.4%) |
0.5% |
|
Lower Mid-End: Satellite Towns |
|||||||||||
|
Thindigua |
88.2% |
22.0% |
5.9% |
2.0% |
7.9% |
4.2% |
1.8% |
6.1% |
1.7% |
0.20% |
1.8% |
|
Athi River |
87.4% |
16.6% |
6.1% |
0.0% |
6.1% |
5.2% |
0.3% |
5.5% |
0.9% |
(0.3%) |
0.6% |
|
Ruaka |
89.5% |
22.6% |
5.5% |
0.1% |
5.6% |
5.6% |
2.4% |
8.0% |
(0.1%) |
(2.3%) |
(2.4%) |
|
Kitengela |
82.7% |
19.4% |
5.1% |
0.0% |
5.1% |
4.5% |
2.2% |
6.6% |
0.6% |
(2.2%) |
(1.5%) |
|
Syokimau |
84.6% |
18.2% |
5.7% |
(0.8%) |
5.0% |
4.9% |
0.0% |
4.9% |
0.8% |
(0.8%) |
0.1% |
|
Ruiru |
74.5% |
19.7% |
4.6% |
0.0% |
4.6% |
3.9% |
(1%) |
3.2% |
0.7% |
0.8% |
1.4% |
|
Kikuyu |
83.3% |
18.2% |
5.0% |
(1.7%) |
3.3% |
4.3% |
0.0% |
4.3% |
0.7% |
(1.7%) |
(1.0%) |
|
Average |
84.3% |
19.5% |
5.4% |
(0.1%) |
5.4% |
4.5% |
0.6% |
5.1% |
0.9% |
(0.7%) |
0.3% |
|
Apartments Average |
86.3% |
19.4% |
5.5% |
(0.3%) |
5.3% |
4.7% |
0.5% |
5.2% |
0.8% |
(0.7%) |
0.1% |
|
|||||||||||
Source: Cytonn Research
Section IV: Investment Opportunity
In the residential report, we also gauge which residential nodes offer the most attractive investment opportunity based on important factors that investors consider when investing. To this end, we rank the areas based on:
- Average returns – This is the sum of the rental yield and price appreciation for each suburb. The higher the return the more points allotted,
- Annual uptake – Refers to how fast developments sell on average per annum, the higher/ faster the sales rate, the higher the points allotted,
- Distance from Main Business Nodes- This is to establish the commute distance for majority of the working population, where we assumed Nairobi Central Business District as the common node. This is particularly important to people living in apartments as they tend to attract more young people who prefer to live in close proximity to the CBD,
- Availability of development land – Areas with higher supply of development land have higher ranking and hence more points, and
- State of infrastructure – Ranked as poor, average or good, with poor referring to areas that are accessed by earth roads and have no sewer, average referring to areas that are accessed by tarmac but have no sewer and good referring to areas that are both tarmacked and have a sewerage system.
We allotted the highest points to returns and uptake at 35% and 30%, respectively. For an investor to recoup their investment in detached units, the most important factor would be how fast they can sell.
For detached units, Runda Mumwe and Ruiru continue to offer the best opportunity for detached units’ development driven by returns, relatively higher uptake and presence of good infrastructure.
|
Investment Opportunity: Top 5 Detached Units’ Markets |
|||||||
|
Location |
Amenities |
Infrastructure |
Annual Uptake |
Average Returns |
Availability of Development Land |
Total Points |
Rank |
|
Ruiru |
2.0 |
3.0 |
3.0 |
3.0 |
3.0 |
2.9 |
1 |
|
Runda Mumwe |
3.0 |
2.0 |
3.0 |
3.0 |
2.0 |
2.8 |
2 |
|
Runda |
3.0 |
2.0 |
3.0 |
3.0 |
2.0 |
2.8 |
2 |
|
South C |
2.0 |
1.0 |
3.0 |
3.0 |
1.0 |
2.4 |
4 |
|
Karen |
3.0 |
3.0 |
2.0 |
2.0 |
3.0 |
2.4 |
5 |
For apartments, Ruaka and Westlands ranked highest in terms of average returns, annual uptake and infrastructure, therefore are the best opportunity for development.
|
Investment Opportunity: Top 5 Apartment Markets |
|||||||||
|
Location |
Distance from Main Business Node |
Supply |
Amenities (Malls & Recreation) |
Infrastructure |
Uptake |
Returns |
Availability of Development Class Land |
Total Points |
Rank |
|
Ruaka |
2.0 |
2.0 |
3.0 |
3.0 |
3.0 |
3.0 |
2.0 |
2.8 |
1 |
|
Westlands |
3.0 |
1.0 |
3.0 |
3.0 |
3.0 |
3.0 |
1.0 |
2.7 |
2 |
|
Thindigua |
3.0 |
2.0 |
2.0 |
2.0 |
3.0 |
3.0 |
2.0 |
2.6 |
3 |
|
Langata |
3.0 |
1.0 |
2.0 |
2.0 |
3.0 |
3.0 |
1.0 |
2.5 |
4 |
|
Ngong Road |
2.0 |
1.0 |
2.0 |
3.0 |
3.0 |
2.0 |
1.0 |
2.3 |
5 |
Section V: Outlook and Conclusion
We use demand, access to credit, infrastructure and performance, as the key metrics to gauge our sentiment for the sector going forward.
|
Residential Market Outlook |
|||
|
Measure |
FY’20 Experience and Outlook Going Forward |
2019 Outlook |
2020 Outlook |
|
Demand |
|
Positive |
Positive |
|
Credit |
|
Neutral |
Neutral |
|
Infrastructure |
|
Positive |
Neutral |
|
Performance |
|
Neutral |
Neutral |
For the key metrics that have been used to determine the performance of the sector, one is positive, that is, demand, and three are neutral that is, infrastructure, access to credit and performance. Thus, our outlook for the sector is neutral. For apartments, the best opportunity is investment in areas such as Ruaka and Westlands driven by returns, uptake as well as state of infrastructure and amenities; for detached units, the best opportunity is in areas such as Runda Mumwe and Ruiru, driven by uptake and the current performance in terms of returns to investors. For more information, see the full report.
Disclaimer: The views expressed in this publication are those of the writers where particulars are not warranted. This publication is meant for general information only and is not a warranty, representation, advice, or solicitation of any nature. Readers are advised in all circumstances to seek the advice of a registered investment advisor.

- Talk to us
- Kenya
- P.O Box 20695 - 00200, Nairobi, Kenya
- Cell +254709101200
- Tel +254709101200
- WhatsApp +254741676635
- United States
- +254709101200
- DOWNLOAD OUR APP
-


- Kenya
- 8th Floor, Pinetree Plaza, Kaburu Drive, Ngong Road, Nairobi, Kenya
- USA
- Suite 1150, 1775 Eye Street NW, USA, Washington DC 20006, USA
- Investments
- High Yield
- Private Equity
- Real Estate
- Real Estate
- RiverRun Estates
- Cytonn Towers
- The Ridge
- Taraji Heights
- The Alma