Nairobi Metropolitan Area (NMA) Industrial Report 2024 and Cytonn Weekly #46/2024
By Investments Team, Nov 17, 2024
Executive Summary
Fixed Income
During the week, T-bills were oversubscribed for the seventh consecutive week, with the overall oversubscription rate coming in at 398.1%, albeit lower than the oversubscription rate of 409.9% recorded the previous week. Investors’ preference for the shorter 91-day paper persisted, with the paper receiving bids worth Kshs 30.4 bn against the offered Kshs 4.0 bn, translating to an oversubscription rate of 759.7%, higher than the oversubscription rate of 686.1% recorded the previous week. The subscription rates for the 182-day paper decreased to 323.3% from 427.8% recorded the previous week, while that of the 364-day paper increased to 328.2% from 281.5% recorded the previous week. The government accepted a total of Kshs 43.0 bn worth of bids out of Kshs 95.5 bn bids received, translating to an acceptance rate of 45.0%. The yields on the government papers were on a downward trajectory, with the yields on the 364-day, 182-day and 91-day papers decreasing by 54.8 bps, 78.2 bps and 65.9 bps to 13.9%, 13.1% and 12.8% respectively from 14.4%, 13.8% and 13.4% respectively recorded the previous week;
Also, during the week, the Central Bank of Kenya released the auction results for the reopened bond FXD1/2024/10 with a tenor to maturity of 9.3 years and a fixed coupon rate of 16.0%. The bond was oversubscribed with the overall subscription rate coming in at 277.9%, receiving bids worth Kshs 55.6 bn against the offered Kshs 20.0 bn. The government accepted bids worth Kshs 30.5 bn, translating to an acceptance rate of 54.9%. The weighted average yield of accepted bids came in at 15.9% which was slightly above our expected range of 15.20%-15.50%, and lower than the 16.9% recorded at issue in September 2024. With the Inflation rate at 2.7% as of October 2024, the real return of the bonds is 13.2%;
During the week, the National Treasury released Kenya’s 2024 Budget Review and Outlook Paper detailing the fiscal performance for FY’2023/24 and fiscal projections for the FY’2025/26. Notably, total revenue including Appropriations in Aid collected grew by 14.3% to Kshs 2.7 tn in FY’2023/24, from Kshs 2.4 tn collected in FY2022/23, representing 16.9% of GDP against the target of Kshs 2.9 tn. The 16.9% total revenue to GDP was up from 16.7% as of the previous year. The total expenditure and net lending amounted to Kshs 3.6 tn against a target of Kshs 3.9 tn;
During the week, The Energy and Petroleum Regulatory Authority (EPRA) released their monthly statement on the maximum retail fuel prices in Kenya, effective from 15th November 2024 to 14th December 2024. Notably, the maximum allowed price for Super Petrol, Diesel and Kerosene remain unchanged. Consequently, Super Petrol, Diesel and Kerosene will continue to retail at Kshs 180.7, Kshs. 168.1 and Kshs 151.4 per liter respectively;
Equities
During the week, the equities market recorded a mixed performance, with NSE 25, NSE 20 and NSE 10 gaining by 0.3%,0.1% and 0.1% respectively, while NASI declined by 0.5%, taking the YTD performance to gains of 35.9%, 33.8%, 27.9% and 25.1% for NSE 10, NSE 25, NSE 20 and NASI respectively. The equities market performance was mainly driven by gains recorded by large-cap stocks such as Equity Group, Absa Bank, and Standard Chartered Bank of 3.9%, 2.7%, and 2.4% respectively. The gains were however weighed down by losses recorded by large-cap stocks such as EABL, Safaricom and Bamburi of 4.0%, 3.2%, and 0.4% respectively;
During the week, Cooperative bank released their Q3’2024 financial results, recording a 4.4 % increase in Profit After Tax (PAT) to Kshs 19.2 bn, from Kshs 18.4 bn in Q3’2023. The performance was mainly driven by a 12.3% increase in net interest income to Kshs 36.9 bn in Q3’2024, from Kshs 32.8 bn recorded in Q3’2023, coupled with a 8.2% increase in net non-interest income to Kshs 22.3 bn, from Kshs 20.6 bn recorded in Q3’2023;
Also, Equity Bank released their Q3’2024 financial results, recording a 13.1% increase in Profit After Tax (PAT) to Kshs 40.9 bn, from Kshs 36.2 bn recorded in Q3’2023. The performance was mainly driven by a 11.0% increase in net interest income to Kshs 80.6 bn in Q3’2024, from Kshs 72.6 bn recorded in Q3’2023, coupled with a 5.8% increase in net non-interest income to Kshs 61.2 bn, from Kshs 57.8 bn recorded in Q3’2023.
Real Estate
During the week, the government proposed amendments to cap interest on land rates default. Under the proposed changes to the National Rating Bill of 2022, the interest charged on defaulted rates across the 47 counties will not exceed the prevailing Central Bank of Kenya (CBK) lending rate, currently set at 12.0%;
In the residential sector, Centum Real Estate announced a strategic partnership with Gulf African Bank to offer Shariah-compliant mortgage financing to its customers. This collaboration aims to expand home financing options and drive the uptake of Centum's property portfolio. Additionally, the Kenyan government disclosed that only 30.8% of the Kshs 54.1 bn collected through the housing levy in its first year of enforcement was utilized for affordable housing projects. This amounts to Kshs 16.7 bn, leaving a significant portion of funds idle amidst delays in project implementation;
In the Commercial Office sector , Stanbic Bank Kenya announced that it had extended a Kshs 3.3 bn (USD 25.6 mn) loan to Gateway CCI Limited, a subsidiary of Mauritius-based real estate firm Grit, for the ENEO CCI project located in Tatu City. This development is part of Grit’s efforts to expand its real estate portfolio in Kenya, encompassing both commercial and residential properties;
On the Unquoted Securities Platform, Acorn D-REIT and I-REIT traded at Kshs 25.4 and Kshs 22.2 per unit, respectively, as per the last updated data on 31st October 2024. The performance represented a 27.0% and 11.0% gain for the D-REIT and I-REIT, respectively, from the Kshs 20.0 inception price. Additionally, ILAM Fahari I-REIT traded at Kshs 11.0 per share as of 31st October 2024, representing a 45.0% loss from the Kshs 20.0 inception price;
Focus of the Week
This week, we shift our focus to Industrial Real Estate, with a special focus on the Nairobi Metropolitan Area (NMA). Industrial Real Estate often receives less attention compared to dominant segments like residential, commercial office, and retail Real Estate. However, in recent years, the government has actively promoted industrial activities through initiatives such as the Special Economic Zones (SEZs) and Export Processing Zones (EPZs) under the Ministry of Investments Trade and Industry (MITI). Additionally, Kenya's growing population has led to an increasing demand for commodities, fueling a rise in industrial activity. While industrial Real Estate in Kenya is often associated with manufacturing facilities and warehouses, it also includes other classes like slaughterhouses and emerging classes such as data centers, which are reshaping the sector. Given these developments, we find it prudent to analyze the Industrial Real Estate sector, with a particular focus on the Nairobi Metropolitan Area (NMA);
Investment Updates:
- Weekly Rates: Cytonn Money Market Fund closed the week at a yield of 18.03 % p.a. To invest, dial *809# or download the Cytonn App from Google Play store here or from the Appstore here;
- We continue to offer Wealth Management Training every Monday, from 10:00 am to 12:00 pm. The training aims to grow financial literacy among the general public. To register for any of our Wealth Management Trainings, click here;
- If interested in our Private Wealth Management Training for your employees or investment group, please get in touch with us through wmt@cytonn.com;
- Cytonn Insurance Agency acts as an intermediary for those looking to secure their assets and loved ones’ future through insurance namely; Motor, Medical, Life, Property, WIBA, Credit and Fire and Burglary insurance covers. For assistance, get in touch with us through insuranceagency@cytonn.com;
- Cytonn Asset Managers Limited (CAML) continues to offer pension products to meet the needs of both individual clients who want to save for their retirement during their working years and Institutional clients that want to contribute on behalf of their employees to help them build their retirement pot. To more about our pension schemes, kindly get in touch with us through pensions@cytonn.com;
Hospitality Updates:
- We currently have promotions for Staycations. Visit cysuites.com/offers for details or email us at sales@cysuites.com;
Money Markets, T-Bills Primary Auction:
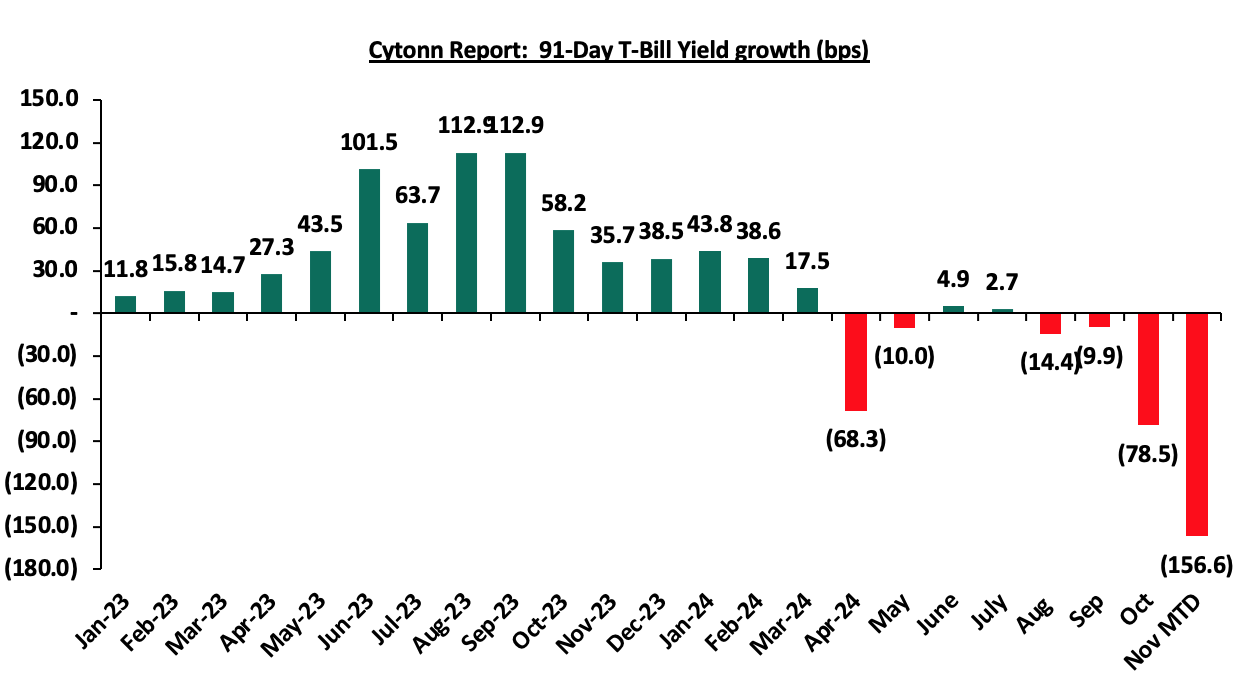
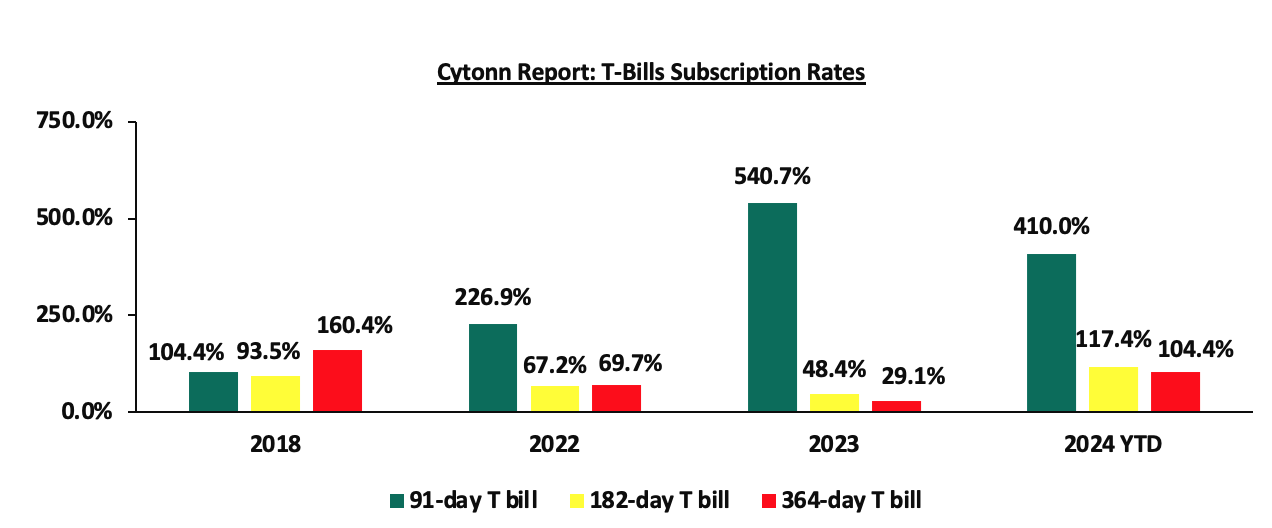
During the week, T-bills were oversubscribed for the seventh consecutive week, with the overall oversubscription rate coming in at 398.1%, albeit lower than the oversubscription rate of 409.9% recorded the previous week. Investors’ preference for the shorter 91-day paper persisted, with the paper receiving bids worth Kshs 30.4 bn against the offered Kshs 4.0 bn, translating to an oversubscription rate of 759.7%, higher than the oversubscription rate of 686.1% recorded the previous week. The subscription rates for the 182-day paper decreased to 323.3% from 427.8% recorded the previous week, while that of the 364-day papers increased to 328.2% from 281.5% recorded the previous week. The government accepted a total of Kshs 43.0 bn worth of bids out of Kshs 95.5 bn bids received, translating to an acceptance rate of 45.0%. The yields on the government papers were on a downward trajectory, with the yields on the 364-day, 182-day and 91-day papers decreasing by 54.8 bps, 78.2 bps and 65.9 bps to 13.9%, 13.1% and 12.8% respectively from 14.4%, 13.8% and 13.4% respectively recorded the previous week. The chart below shows the yield growth rate for the 91-day paper over the period:
The chart below compares the overall average T-bill subscription rates obtained in 2018, 2022, 2023, and 2024 Year-to-date (YTD):
Also, during the week, the Central Bank of Kenya released the auction results for the reopened bond FXD1/2024/10 with a tenor to maturity of 9.3 years and a fixed coupon rate of 16.0%. The bond was oversubscribed with the overall subscription rate coming in at 277.9%, receiving bids worth Kshs 55.6 bn against the offered Kshs 20.0 bn. The government accepted bids worth Kshs 30.5 bn, translating to an acceptance rate of 54.9%. The weighted average yield of accepted bids came in at 15.9% which was slightly above our expected range of 15.20%-15.50%, and lower than the 16.9% recorded at issue in September 2024. With the Inflation rate at 2.7% as of October 2024, the real return of the bonds is 13.2%.
Money Market Performance:
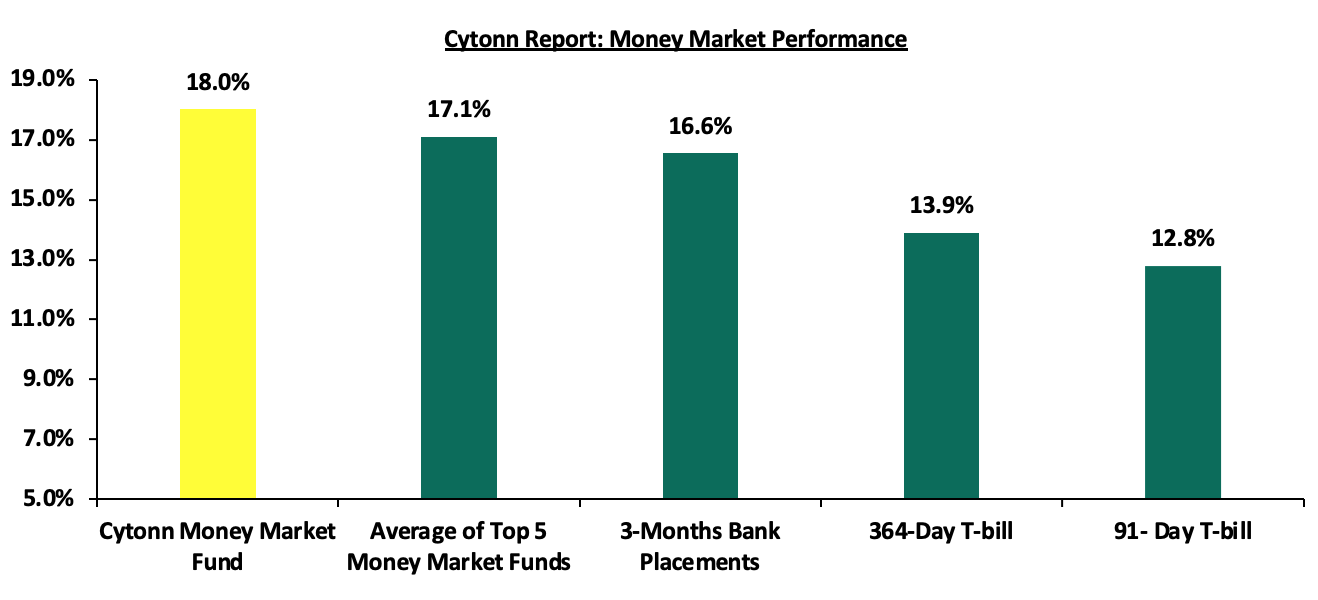
In the money markets, 3-month bank placements ended the week at 16.6% (based on what we have been offered by various banks), and the yields on the government papers were on a downward trajectory, with the yields on the 364-day and 91-day papers decreasing by 54.8 bps and 65.9 bps to 13.9% and 12.8% respectively, from 14.4% and 13.4% respectively recorded the previous week. The yields on the Cytonn Money Market Fund decreased marginally by 3.0 bps to close the week at 18.0%, from 18.1% recorded from the previous week, while the average yields on the Top 5 Money Market Funds decreased by 11.8 bps to close the week at 17.1%, from 17.2% recorded the previous week.
The table below shows the Money Market Fund Yields for Kenyan Fund Managers as published on 15th November 2024:
|
Cytonn Report: Money Market Fund Yield for Fund Managers as published on 15th November 2024 |
||
|
Rank |
Fund Manager |
Effective Annual Rate |
|
1 |
Cytonn Money Market Fund (Dial *809# or download the Cytonn App) |
18.0% |
|
2 |
Lofty-Corban Money Market Fund |
17.6% |
|
3 |
Etica Money Market Fund |
17.2% |
|
4 |
Arvocap Money Market Fund |
16.4% |
|
5 |
Kuza Money Market fund |
16.3% |
|
6 |
Ndovu Money Market Fund |
15.5% |
|
7 |
Mali Money Market Fund |
15.2% |
|
8 |
KCB Money Market Fund |
15.2% |
|
9 |
Faulu Money Market Fund |
15.2% |
|
10 |
Madison Money Market Fund |
15.0% |
|
11 |
Nabo Africa Money Market Fund |
15.0% |
|
12 |
Jubilee Money Market Fund |
15.0% |
|
13 |
Sanlam Money Market Fund |
14.9% |
|
14 |
Mayfair Money Market Fund |
14.8% |
|
15 |
Genghis Money Market Fund |
14.6% |
|
16 |
Enwealth Money Market Fund |
14.6% |
|
17 |
Co-op Money Market Fund |
14.4% |
|
18 |
Absa Shilling Money Market Fund |
14.4% |
|
19 |
GenAfrica Money Market Fund |
14.4% |
|
20 |
Orient Kasha Money Market Fund |
14.3% |
|
21 |
Apollo Money Market Fund |
14.1% |
|
22 |
Old Mutual Money Market Fund |
13.9% |
|
23 |
Dry Associates Money Market Fund |
13.8% |
|
24 |
ICEA Lion Money Market Fund |
13.6% |
|
25 |
CIC Money Market Fund |
13.5% |
|
26 |
AA Kenya Shillings Fund |
13.5% |
|
27 |
Stanbic Money Market Fund |
13.3% |
|
28 |
British-American Money Market Fund |
13.3% |
|
29 |
Equity Money Market Fund |
11.4% |
Source: Business Daily
Liquidity:
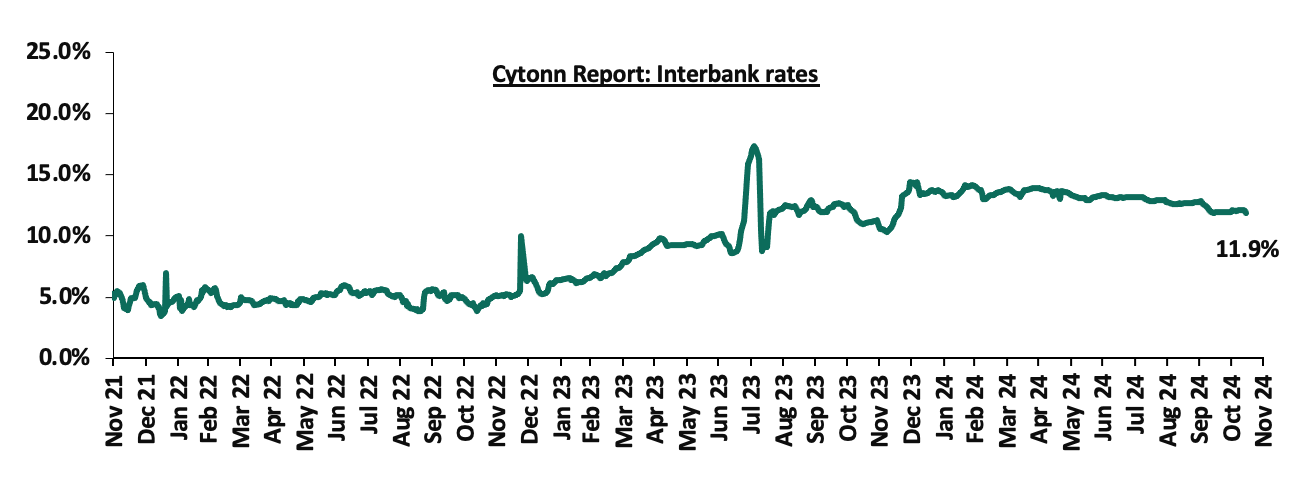
During the week, liquidity in the money markets marginally eased, with the average interbank rate decreasing by 7.6 bps, to 12.0% from the 12.1% recorded the previous week, partly attributable to government payments that offset tax remittances. The average interbank volumes traded decreased significantly by 60.6% to Kshs 21.7 bn from Kshs 55.2 bn recorded the previous week. The chart below shows the interbank rates in the market over the years:
Kenya Eurobonds:
During the week, the yields on Eurobonds were on an upward trajectory, with the yields on the 7-year Eurobond issued in 2024 increasing the most by 12.6 bps to 10.0% from 9.9% recorded the previous week. The table below shows the summary of the performance of the Kenyan Eurobonds as of 14th November 2024;
|
Cytonn Report: Kenya Eurobonds Performance |
||||||
|
|
2018 |
2019 |
2021 |
2024 |
||
|
Tenor |
10-year issue |
30-year issue |
7-year issue |
12-year issue |
13-year issue |
7-year issue |
|
Amount Issued (USD) |
1.0 bn |
1.0 bn |
0.9 bn |
1.2 bn |
1.0 bn |
1.5 bn |
|
Years to Maturity |
3.3 |
23.3 |
2.5 |
7.5 |
9.6 |
6.2 |
|
Yields at Issue |
7.3% |
8.3% |
7.0% |
7.9% |
6.2% |
10.4% |
|
01-Jan-24 |
9.8% |
10.2% |
10.1% |
9.9% |
9.5% |
|
|
01-Nov-24 |
9.1% |
10.2% |
8.3% |
9.9% |
9.8% |
9.9% |
|
07-Nov-24 |
9.0% |
10.2% |
8.3% |
9.9% |
9.8% |
9.9% |
|
08-Nov-24 |
8.9% |
10.1% |
8.2% |
9.8% |
9.7% |
9.8% |
|
11-Nov-24 |
8.9% |
10.1% |
8.1% |
9.8% |
9.7% |
9.8% |
|
12-Nov-24 |
9.0% |
10.2% |
8.1% |
9.9% |
9.8% |
10.0% |
|
13-Nov-24 |
9.0% |
10.2% |
8.3% |
9.9% |
9.8% |
10.0% |
|
14-Nov-24 |
9.0% |
10.2% |
8.3% |
9.9% |
9.8% |
10.0% |
|
Weekly Change |
0.1% |
0.1% |
0.0% |
0.1% |
0.1% |
0.1% |
|
MTD Change |
(0.0%) |
0.0% |
(0.1%) |
0.0% |
0.0% |
0.1% |
|
YTD Change |
(0.8%) |
0.1% |
(1.8%) |
0.1% |
0.3% |
- |
Source: Central Bank of Kenya (CBK) and National Treasury
Kenya Shilling:
During the week, the Kenya Shilling depreciated against the US Dollar by 10.8 bps, to Kshs 129.3 from the Kshs 129.2 recorded the previous week. On a year-to-date basis, the shilling has appreciated by 17.6% against the dollar, a contrast to the 26.8% depreciation recorded in 2023.
We expect the shilling to be supported by:
- Diaspora remittances standing at a cumulative USD 4,804.1 mn in the 12 months to October 2024, 15.3% higher than the USD 4,165.1 mn recorded over the same period in 2023, which has continued to cushion the shilling against further depreciation. In the October 2024 diaspora remittances figures, North America remained the largest source of remittances to Kenya accounting for 56.7% in the period, and,
- The tourism inflow receipts which came in at USD 352.5 bn in 2023, a 31.5% increase from USD 268.1 bn inflow receipts recorded in 2022, and owing to tourist arrivals that improved by 21.0% in the 12 months to August 2024, compared to a similar period in 2023.
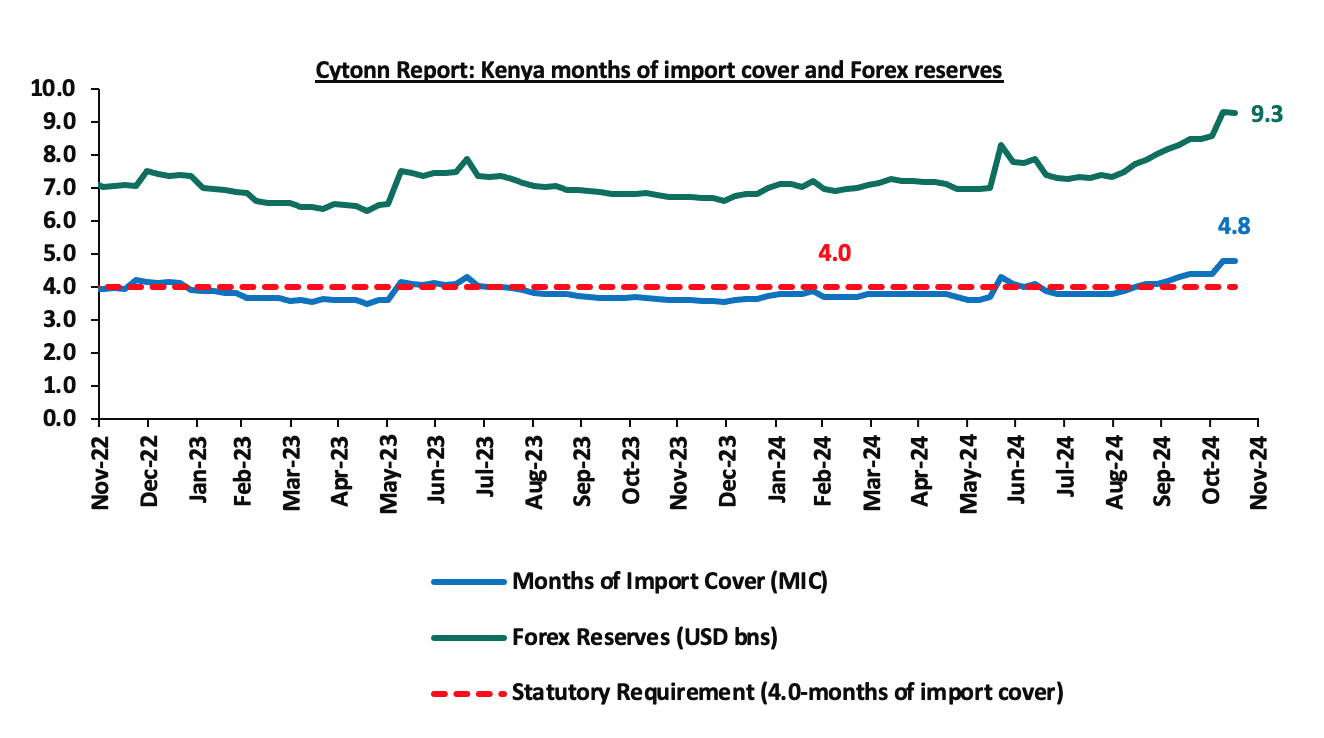
- Improved forex reserves currently at USD 9.3 bn (equivalent to 4.8-months of import cover), which is above the statutory requirement of maintaining at least 4.0-months of import cover and the EAC region’s convergence criteria of 4.5-months of import cover.
The shilling is however expected to remain under pressure in 2024 as a result of:
- An ever-present current account deficit which came at 3.8% of GDP in Q2’2024 from 3.7% recorded in Q2’2023, and,
- The need for government debt servicing, continues to put pressure on forex reserves given that 67.2% of Kenya’s external debt is US Dollar-denominated as of June 2024.
Key to note, Kenya’s forex reserves declined marginally by 0.5% during the week, to remain unchanged at 9.3 bn, equivalent to 4.8 months of import cover, and above to the statutory requirement of maintaining at least 4.0-months of import cover. The recent increase in forex reserves is primarily attributed to the disbursement from the International Monetary Fund (IMF). On October 30, 2024, the IMF approved a combined disbursement of around USD 606.1 mn following the successful completion of Kenya’s seventh and eighth reviews under the Extended Fund Facility (EFF), Extended Credit Facility (ECF), and Resilience and Sustainability Facility (RSF) arrangements. The chart below summarizes the evolution of Kenya's months of import cover over the years:
Weekly Highlights:
- Kenya 2024 Budget Review and Outlook Paper
During the week, the National Treasury released Kenya’s 2024 Budget Review and Outlook Paper detailing the fiscal performance for FY’2023/24 and fiscal projections for the FY’2025/26. Notably, total revenue including Appropriations in Aid collected grew by 14.3% to Kshs 2.7 tn in FY’2023/24, from Kshs 2.4 tn collected in FY2022/23, representing 16.9% of GDP against the target of Kshs 2.9 tn. The 16.9% total revenue to GDP was up from 16.7% as of the previous year. The total expenditure and net lending amounted to Kshs 3.6 tn against a target of Kshs 3.9 tn;
- FY’2023/2024 Budget Outturn
|
Amounts in Kshs bns unless stated otherwise |
|
||||||
|
Cytonn Report: FY'2023/24 Budget Outturn- |
|||||||
|
Item |
FY'2022/2023 Budget Outturn (a) |
FY'2023/24 Budget Targets (b) |
FY'2023/24 Actual Outturn (c) |
FY 23/24 % Deviation (c/b) |
FY23/24 % Growth (c/a) |
||
|
Ordinary Revenue |
2,041.1 |
2,461.0 |
2,288.9 |
(7.0%) |
12.1% |
||
|
Total Appropriation-in-Aid |
319.4 |
446.5 |
413.7 |
(7.3%) |
29.5% |
||
|
Total grants |
23.1 |
38.5 |
22.0 |
(42.7%) |
(4.5%) |
||
|
Total Revenue & Grants |
2,383.6 |
2,946.0 |
2,724.7 |
(7.5%) |
14.3% |
||
|
Recurrent expenditure |
2,308.8 |
2,776.6 |
2,678.4 |
(3.5%) |
16.0% |
||
|
Development expenditure |
493.7 |
669.3 |
546.4 |
(18.4%) |
10.7% |
||
|
County Transfer & Contingencies |
415.8 |
425.1 |
380.4 |
(10.5%) |
(8.5%) |
||
|
Total expenditure |
3,218.3 |
3,871.0 |
3,605.2 |
(6.9%) |
12.0% |
||
|
Fiscal deficit inclusive of grants |
(834.7) |
(925.0) |
(880.5) |
(4.8%) |
5.5% |
||
|
Projected Deficit as % of GDP |
(5.9%) |
(5.7%) |
(5.5%) |
(0.2%) * |
(0.4%) |
||
|
Net foreign borrowing |
310.8 |
259.3 |
222.7 |
(14.1%) |
(28.3%) |
||
|
Net domestic borrowing |
459.5 |
665.7 |
595.6 |
(10.5%) |
29.6% |
||
|
Total borrowing |
770.3 |
925.0 |
818.3 |
(11.5%) |
6.2% |
||
Source: National Treasury of Kenya
Key take outs from the release include;
- Total revenue collected in FY’2023/24 amounted to Kshs 2.7 tn against the target of Kshs 2.9 tn being short of its target by Kshs 0.2 tn. This is mainly attributed to below target income tax collections. Additionally, total revenue collected increased by 14.3% to Kshs 2.7 tn in FY’2023/24, from Kshs 2.4 tn in FY 2022/23 attributable to increased tax base, following tax reforms by the government,
- Total government expenditure for FY’2023/24 came at Kshs 3.6 tn, against a target of Kshs 3.9 tn, following a lower absorption for both recurrent and development expenditure. Further, total budget recorded a 12.0% increase to Kshs 3.6 tn, from the Kshs 3.2 tn recorded in FY’2022/23,
- Recurrent expenditure in FY’2023/24 amounted to Kshs 2.7 tn below its target expenditure of Kshs 2.8 tn being short of its target by Kshs 98.2 bn attributable to lower spending on Operations and Maintenance and payments of pensions.
- Development expenditure in FY’2023/24 amounted to Kshs 546.4 bn below its target expenditure of Kshs 669.3 bn being short of its target by Kshs 112.9 bn attributable to below target disbursements by the government to facilitate development of projects.
- County Transfer & Contingencies in FY’2023/24 amounted to Kshs 380.4 bn below its target expenditure of Kshs 425.1 bn being short of its target by Kshs 44.7 bn. Further, this was an 8.5% decline from the Kshs 459.5 bn recorded in FY’2022/23
- The total net government borrowing increased by 6.2% in FY’2023/234 to Kshs 818.3 bn, from Kshs 770.3 bn in FY’2022/23, with 72.8% of the total borrowing being net domestic borrowing.
- FY’2025/2026 Fiscal Projections
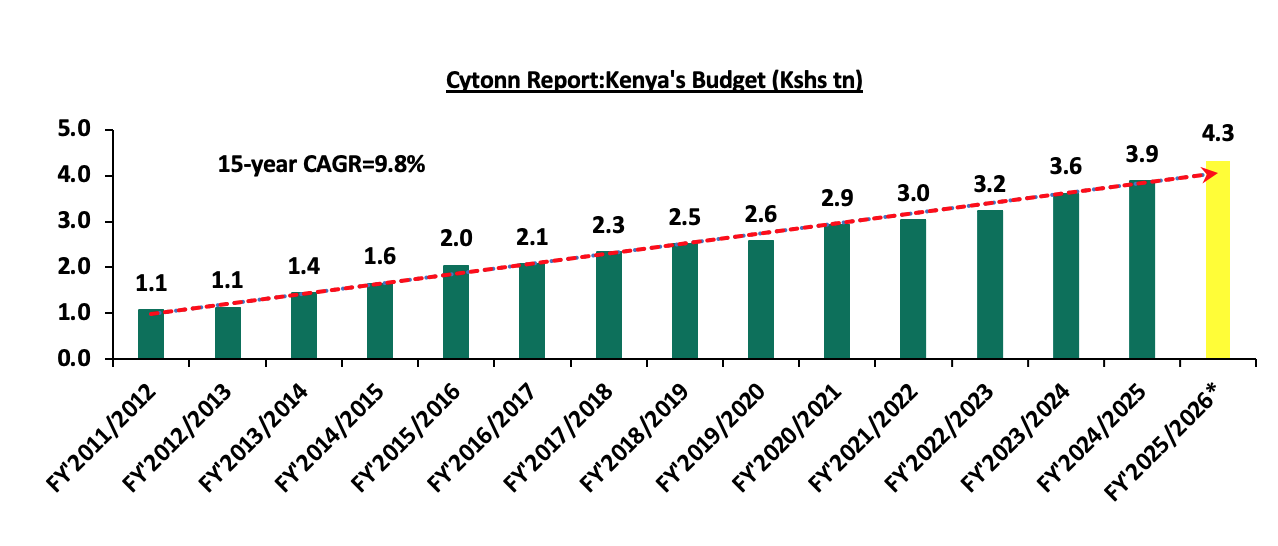
The Kenyan Government budget has been growing over the years on the back of increasing recurrent and development expenditures. For the FY’2025/2026, the budget is projected to increase by 11.6% to Kshs 4.3 tn, from Kshs 3.9 tn in FY’2024/2025 Supplementary 1. The expenditure will be funded by revenue collections of Kshs 3.5 tn and borrowings amounting to Kshs 759.4 bn. The table below shows Kenya’s budget growth over the years;
Source: Treasury
*BROP 2024 Budget estimate
The table below summarizes changes between the projected FY’2025/26 budget and the current FY’2024/25 Supplementary 1 Budget:
|
Amounts in Kshs billions unless stated otherwise |
|||
|
Cytonn Report: Comparison Between FY' 2024/25 and FY'2025/26 Actual Budget Outturn |
|||
|
Item |
FY'2024/2025 Estimates (Supp 1) |
FY'2025/26 Budget Estimates (BROP 2024) |
Change y/y (%) |
|
Ordinary Revenue |
2,631.4 |
3,018.8 |
14.7% |
|
Total Appropriation-in-Aid |
428.6 |
497.8 |
16.1% |
|
Total grants |
52.3 |
53.2 |
1.7% |
|
Total Revenue & Grants |
3,112.3 |
3,569.8 |
14.7% |
|
Recurrent expenditure |
2,826.2 |
3,076.9 |
8.9% |
|
Development expenditure |
599.5 |
804.7 |
34.2% |
|
County Transfer & Contingencies |
455.1 |
447.7 |
(1.6%) |
|
Total expenditure |
3,880.8 |
4,329.3 |
11.6% |
|
Fiscal deficit inclusive of grants |
(768.5) |
(759.5) |
(1.2%) |
|
Projected Deficit as % of GDP |
4.3% |
3.8% |
(0.5%) pts |
|
Net foreign borrowing |
355.5 |
213.7 |
(39.9%) |
|
Net domestic borrowing |
413.1 |
545.8 |
32.1% |
|
Total borrowing |
768.6 |
759.5 |
(1.2%) |
Source: National Treasury of Kenya
Key take outs from the release include;
- The total revenue and grants is projected to increase by 14.7% to Kshs 3.6 tn in FY 2025/26, from Kshs 3.1 tn in FY’2024/25 mainly on the back of the ongoing tax reforms in policy and revenue administration. Notably, ordinary revenue is also projected to increase by 14.7% to Kshs 3.0 tn, from Kshs 2.6 tn,
- The total expenditure is set to increase by 11.6% to Kshs 4.3 tn in FY’2025/26, from Kshs 3.9 tn FY’2024/25,
- Recurrent expenditure is set to increase by 8.9% to Kshs 3.1 tn from Kshs 2.8 tn in FY’2024/25, while development expenditure is also projected to increase by 34.2% to Kshs 804.7 bn, from Kshs 599.5 bn, representing just 18.6% of the total budget. Further, country transfers are expected to decline marginally by 1.6%,
- Public debt is expected to continue growing in FY’2025/26, as the approximate Kshs 759.5 bn fiscal deficit will be financed through net domestic debt totaling Kshs 545.8 bn and foreign debts totaling Kshs 213.7 bn. However, the total borrowing is expected to reduce by 1.2% to Kshs 759.5 bn in the FY’2025/26, from Kshs 768.6 bn as per the FY’2024/2025 supplementary budget 1,
- The budget deficit is projected to decline by 0.5% points to 3.8% of GDP, from the 4.3% of GDP in the FY’2024/2025 budget, mainly as growth in revenues outpace growth in expenditure.
Conclusion and Our View
The Kenyan economy is recovering from recent global and domestic shocks, with growth rebounding to 5.6% in 2023 from 4.9% in 2022, and expected to stabilize at 5.2% in 2023, supported by strong agricultural productivity, a robust services sector, and favorable global commodity prices. Further, the continued ease in the Central Bank Rate (CBR) to 12.00%, following stability of the Shilling and anchored inflationary rates is expected to support the private sector and improve credit availability. We therefore expect these factors to support revenue collection by the government.
Given the continued fiscal constraints, the government has outlined to employ Zero-Based Budgeting to prioritize funding for projects that enhance livelihoods, create jobs, and support economic recovery, with Sector Working Groups required to justify each expenditure based on efficiency and necessity.
Overall, we are of the view that the main driver of the growing public debt is the fiscal deficit occasioned by lower revenues as compared to expenditures. As a result, implementing robust fiscal consolidation would help the government bridge the deficit gap. This can be achieved by minimizing spending through the implementation of structural reforms and the reduction of amounts extended to recurrent expenditure. Fiscal consolidation would also allow the government to refinance other critical sectors, such as agriculture, resulting in increased revenue. However, the overall risk to the economy remains high, owing to the high debt servicing costs in the next fiscal year.
- Fuel Prices effective 15th November 2024 to 14th December 2024
During the week, The Energy and Petroleum Regulatory Authority (EPRA) released their monthly statement on the maximum retail fuel prices in Kenya, effective from 15th November 2024 to 14th December 2024. Notably, the maximum allowed price for Super Petrol, Diesel and Kerosene remain unchanged. Consequently, Super Petrol, Diesel and Kerosene will continue to retail at Kshs 180.7, Kshs. 168.1 and Kshs 151.4 per litre respectively.
Other key take-outs from the performance include;
- The average landing costs per cubic meter for Super Petrol and Kerosene increased by 0.5% and 4.0% each respectively to USD 641.1 and USD 648.2 respectively in October 2024 from USD 637.7 and USD 623.4 respectively recorded in September 2024, while the average landing costs per cubic meter for Diesel decreased by 4.3% to USD 608.6 in October 2024 from USD 636.2 recorded in September 2024,
- The Kenyan shilling gained marginally against the US Dollar by 0.1% to Kshs. 129.5 in October 2024, compared to the mean monthly exchange rate of Kshs 129.6 recorded in September 2024.
We note that fuel prices in the country have decreased in recent months largely due to the government's efforts to stabilize pump prices through the petroleum pump price stabilization mechanism which expended Kshs 9.9 bn in the FY2023/24 to cushion the increases applied to the petroleum pump prices, coupled with the ongoing appreciation of the Kenyan Shilling against the dollar and other major currencies, as well as a decrease in international fuel prices. We expect that fuel prices will drop in the coming months as a result of the government's efforts to mitigate the cost of petroleum through the pump price stabilization mechanism and strengthening of the Kenyan Shilling against the United States Dollar, having gained by 17.7% against the dollar on a year-to-date basis. As such, we expect the business environment in the country to improve as fuel is a major input cost, as well as further ease in inflationary pressures, with the inflation rate expected to remain within the CBK’s preferred target range of 2.5%-7.5%.
Rates in the Fixed Income market have been on a downward trend given the continued low demand for cash by the government and the improved liquidity in the money market. The government is 141.3% ahead of its prorated net domestic borrowing target of Kshs 157.1 bn, having a net borrowing position of Kshs 379.0 bn. However, we expect a downward readjustment of the yield curve in the short and medium term, with the government looking to increase its external borrowing to maintain the fiscal surplus, hence alleviating pressure in the domestic market. As such, we expect the yield curve to normalize in the medium-term and hence investors are expected to shift towards the long-term papers to lock in the high returns.
Market Performance:
During the week, the equities market recorded a mixed performance, with NSE 25, NSE 20 and NSE 10 gaining by 0.3%,0.1% and 0.1% respectively, while NASI declined by 0.5%, taking the YTD performance to gains of 35.9%, 33.8%, 27.9% and 25.1% for NSE 10, NSE 25, NSE 20 and NASI respectively. The equities market performance was mainly driven by gains recorded by large-cap stocks such as Equity Group, Absa Bank, and Standard Chartered Bank of 3.9%, 2.7%, and 2.4% respectively. The gains were however weighed down by losses recorded by large-cap stocks such as EABL, Safaricom and Bamburi of 4.0%, 3.2%, and 0.4% respectively.
During the week, equities turnover decreased by 54.8% to USD 5.4 mn from USD 12.0 mn recorded the previous week, taking the YTD turnover to USD 538.7 mn. Foreign investors remained net sellers for the sixth consecutive week, with a net selling position of USD 0.8 mn, from a net selling position of USD 1.5 mn recorded the previous week, taking the YTD net selling position to USD 4.7 mn.
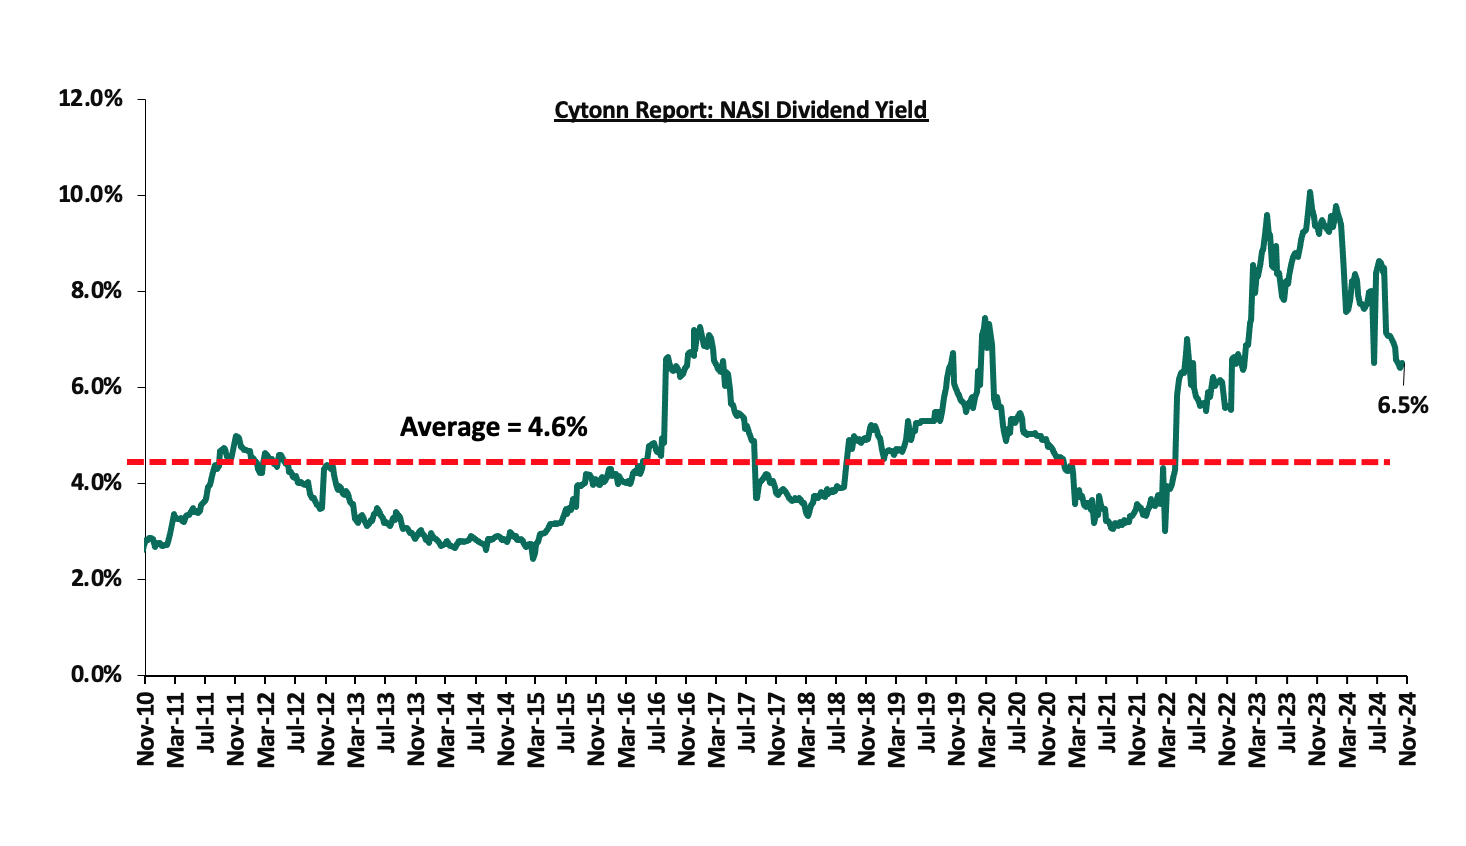
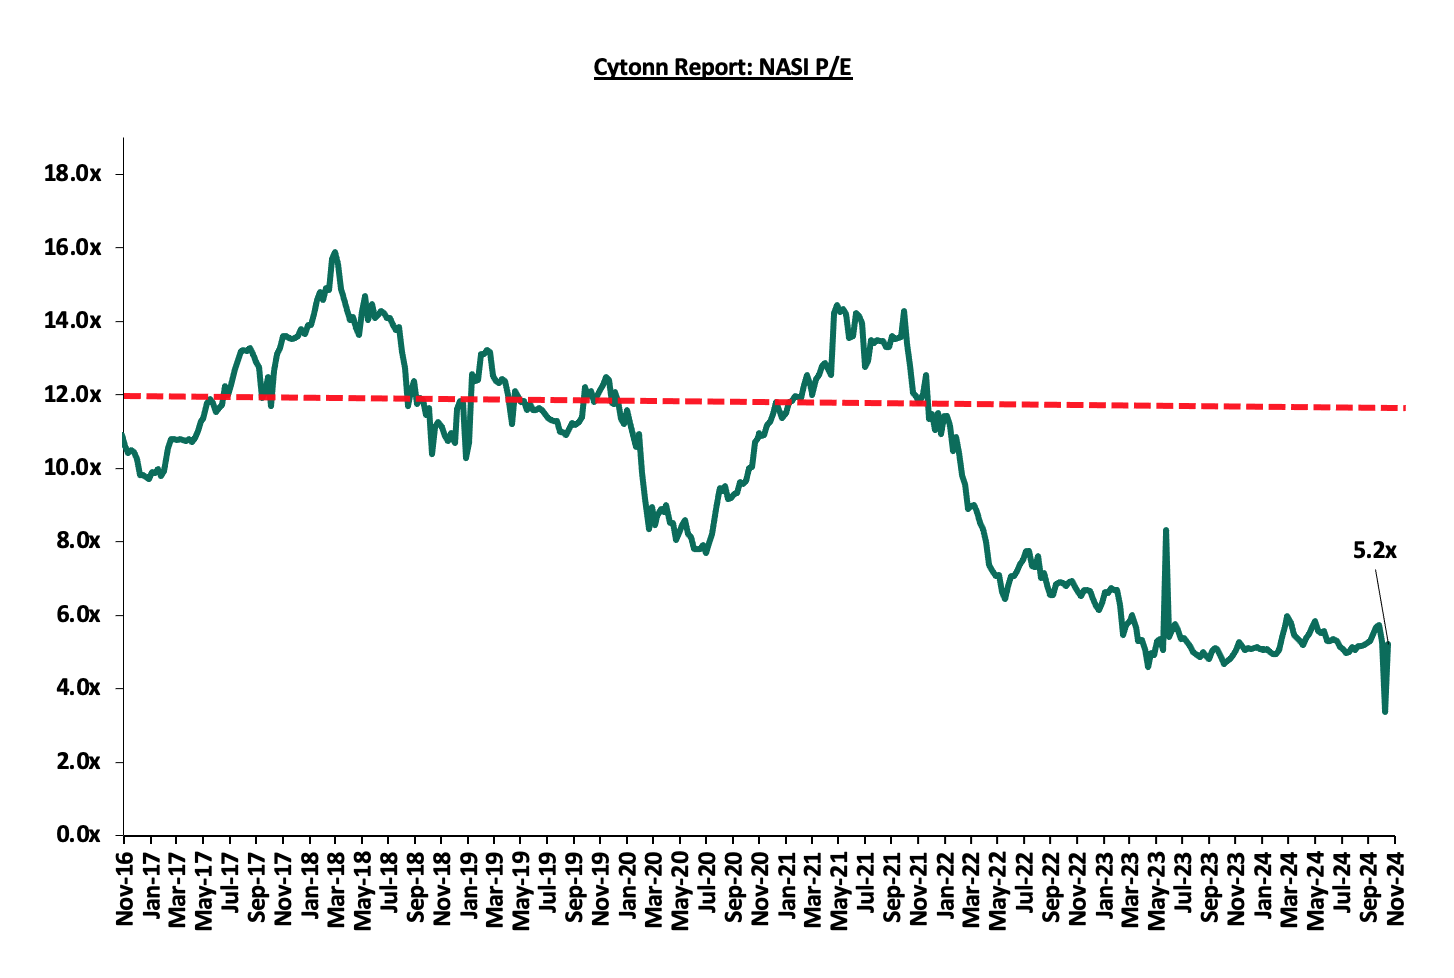
The market is currently trading at a price-to-earnings ratio (P/E) of 5.2x, 55.7% below the historical average of 11.7x, and a dividend yield of 6.5%, 1.9% points above the historical average of 4.6%. Key to note, NASI’s PEG ratio currently stands at 0.6x, an indication that the market is undervalued relative to its future growth. A PEG ratio greater than 1.0x indicates the market may be overvalued while a PEG ratio less than 1.0x indicates that the market is undervalued.
The charts below indicate the historical P/E and dividend yields of the market;
Universe of Coverage:
|
Cytonn Report: Equities Universe of Coverage |
||||||||||
|
Company |
Price as at 08/11/2024 |
Price as at 15/11/2025 |
w/w change |
YTD Change |
Year Open 2024 |
Target Price* |
Dividend Yield*** |
Upside/ Downside** |
P/TBv Multiple |
Average |
|
Jubilee Holdings |
163.0 |
164.0 |
0.6% |
(11.4%) |
185.0 |
260.7 |
8.8% |
68.7% |
0.3x |
Buy |
|
NCBA |
43.3 |
43.8 |
1.2% |
12.7% |
38.9 |
55.2 |
11.0% |
38.5% |
0.8x |
Buy |
|
Diamond Trust Bank |
52.0 |
52.3 |
0.5% |
16.8% |
44.8 |
65.2 |
9.6% |
35.0% |
0.2x |
Buy |
|
Equity Group |
48.1 |
49.9 |
3.9% |
45.9% |
34.2 |
60.2 |
8.3% |
33.6% |
0.9x |
Buy |
|
Britam |
5.7 |
5.8 |
2.5% |
13.2% |
5.1 |
7.5 |
0.0% |
32.0% |
0.8x |
Buy |
|
Co-op Bank |
14.2 |
14.5 |
2.1% |
27.8% |
11.4 |
17.2 |
10.6% |
31.7% |
0.7x |
Buy |
|
CIC Group |
2.3 |
2.2 |
(3.5%) |
(3.5%) |
2.3 |
2.8 |
5.7% |
27.9% |
0.7x |
Buy |
|
ABSA Bank |
15.1 |
15.5 |
2.7% |
33.8% |
11.6 |
17.3 |
10.3% |
25.2% |
1.2x |
Buy |
|
Stanbic Holdings |
134.0 |
135.8 |
1.3% |
28.1% |
106.0 |
145.3 |
11.5% |
19.9% |
0.9x |
Accumulate |
|
KCB Group |
39.0 |
39.1 |
0.3% |
78.1% |
22.0 |
46.7 |
0.0% |
19.6% |
0.6x |
Accumulate |
|
Standard Chartered Bank |
231.0 |
236.5 |
2.4% |
47.6% |
160.3 |
235.2 |
12.6% |
14.4% |
1.5x |
Accumulate |
|
I&M Group |
28.0 |
28.2 |
0.5% |
61.3% |
17.5 |
26.5 |
9.1% |
3.8% |
0.6x |
Lighten |
|
*Target Price as per Cytonn Analyst estimates **Upside/ (Downside) is adjusted for Dividend Yield ***Dividend Yield is calculated using FY’2023 Dividends |
||||||||||
Weekly Highlights
- Cooperative Bank of Kenya Q3’2024 Financial Results
In the just released Q3’2024 financial results, Cooperative Bank of Kenya recorded a 4.4 % increase in Profit After Tax (PAT) to Kshs 19.2 bn, from Kshs 18.4 bn in Q3’2023. The performance was mainly driven by a 12.3% increase in net interest income to Kshs 36.9 bn in Q3’2024, from Kshs 32.8 bn recorded in Q3’2023, coupled with a 8.2% increase in net non-interest income to Kshs 22.3 bn, from Kshs 20.6 bn recorded in Q3’2023.
The performance was however weighed down by a 32.5% increase in loan loss provisions to Kshs 5.6 bn in Q3’2024, from Kshs 4.2 bn in Q3’2023, coupled with the 10.8% increase in staff costs to Kshs 13.5 bn from Kshs 12.2 bn in Q3’2023.
Below is a summary of Co-operative Bank of Kenya’s Q3’2024 performance:
|
Balance Sheet |
Q3’2023 (Kshs bn) |
Q3’2024 (Kshs bn) |
y/y change |
|
Government Securities |
185.1 |
211.6 |
14.3% |
|
Net Loans and Advances |
378.1 |
381.3 |
0.9% |
|
Total Assets |
661.3 |
750.8 |
13.5% |
|
Customer Deposits |
432.8 |
514.0 |
18.7% |
|
Deposits per branch |
2.3 |
2.7 |
16.3% |
|
Total Liabilities |
553.2 |
620.0 |
12.1% |
|
Shareholders’ Funds |
108.1 |
131.8 |
22.0% |
|
Key Ratios |
Q3’2023 |
Q3’2024 |
% point change |
|
Loan to Deposit Ratio |
87.3% |
74.2% |
(13.2%) |
|
Government Securities to Deposits Ratio |
42.8% |
41.2% |
(1.6%) |
|
Return on average equity |
22.3% |
20.0% |
(2.3%) |
|
Return on average assets |
3.6% |
3.4% |
(0.2%) |
|
Income Statement |
Q3’2023 (Kshs bn) |
Q3’2024 (Kshs bn) |
y/y change |
|
Net Interest Income |
32.8 |
36.9 |
12.3% |
|
Non-Interest Income |
20.6 |
22.3 |
8.2% |
|
Total Operating income |
53.4 |
59.2 |
10.8% |
|
Loan Loss provision |
(4.2) |
(5.6) |
32.5% |
|
Total Operating expenses |
(29.0) |
(32.7) |
12.7% |
|
Profit before tax |
24.7 |
26.8 |
8.5% |
|
Profit after tax |
18.4 |
19.2 |
4.4% |
|
Core EPS |
3.1 |
3.3 |
4.4% |
|
Income Statement Ratios |
Q3’2023 |
Q3’2024 |
y/y change |
|
Yield from interest-earning assets |
12.2% |
13.3% |
1.1% |
|
Cost of funding |
4.2% |
5.9% |
1.7% |
|
Net Interest Spread |
8.0% |
7.4% |
(0.6%) |
|
Net Interest Income as % of operating income |
61.5% |
62.3% |
0.9% |
|
Non-Funded Income as a % of operating income |
38.5% |
37.7% |
(0.9%) |
|
Cost to Income |
54.3% |
55.2% |
0.9% |
|
CIR without provisions |
46.4% |
45.8% |
(0.6%) |
|
Cost to Assets |
3.7% |
3.6% |
(0.1%) |
|
Net Interest Margin |
8.4% |
8.0% |
(0.4%) |
|
Capital Adequacy Ratios |
Q3’2023 |
Q3’2024 |
% points change |
|
Core Capital/Total Liabilities |
23.1% |
22.8% |
(0.3%) |
|
Minimum Statutory ratio |
8.0% |
8.0% |
|
|
Excess |
15.1% |
14.8% |
(0.3%) |
|
Core Capital/Total Risk Weighted Assets |
17.9% |
18.5% |
0.6% |
|
Minimum Statutory ratio |
10.5% |
10.5% |
|
|
Excess |
7.4% |
8.0% |
0.6% |
|
Total Capital/Total Risk Weighted Assets |
22.1% |
21.6% |
(0.5%) |
|
Minimum Statutory ratio |
14.5% |
14.5% |
|
|
Excess |
7.6% |
7.1% |
(0.5%) |
|
Liquidity Ratio |
50.3% |
57.8% |
7.5% |
|
Minimum Statutory ratio |
20.0% |
20.0% |
|
|
Excess |
30.3% |
37.8% |
7.5% |
For more information, see our Co-operative Bank Q3’2024 Earnings Note
- Equity Group Holdings Q3’2024 Financial Results
In the just released Q3’2024 financial results, Equity Group recorded a 13.1% increase in Profit After Tax (PAT) to Kshs 40.9 bn, from Kshs 36.2 bn recorded in Q3’2023. The performance was mainly driven by a 11.0% increase in net interest income to Kshs 80.6 bn in Q3’2024, from Kshs 72.6 bn recorded in Q3’2023, coupled with a 5.8% increase in net non-interest income to Kshs 61.2 bn, from Kshs 57.8 bn recorded in Q3’2023.
The performance was also supported by a 33.2% decrease in loan loss provisions to Kshs 12.7 bn in Q3’2024, from Kshs 19.0 bn in Q3’2023, but weighed down by a 27.4% increase in other operating expenses to Kshs 54.1 bn in Q3’2024 from Kshs 84.5 bn recorded in Q3’2023, coupled with the 3.8% increase in staff costs to Kshs 24.0 bn from Kshs 23.1 bn in Q3’2023.
Below is a summary of Equity Group Q3’2024 performance:
|
Balance Sheet Items |
Q3’2023 |
Q3’2024 |
y/y change |
|
Government Securities |
242.5 |
258.9 |
6.8% |
|
Net Loans and Advances |
845.9 |
800.1 |
(5.4%) |
|
Total Assets |
1691.2 |
1703.1 |
0.7% |
|
Customer Deposits |
1207.7 |
1316.8 |
9.0% |
|
Deposits per branch |
3.6 |
3.7 |
3.8% |
|
Total Liabilities |
1497.9 |
1476.1 |
(1.5%) |
|
Shareholders’ Funds |
183.9 |
216.9 |
18.0% |
|
Balance Sheet Ratios |
Q3’2023 |
Q3’2024 |
%points change |
|
Loan to Deposit Ratio |
70.0% |
60.8% |
(9.3%) |
|
Government Securities to Deposits |
28.7% |
32.4% |
3.7% |
|
Return on average equity |
29.1% |
23.7% |
(5.4%) |
|
Return on average assets |
3.2% |
2.8% |
(0.4%) |
|
Income Statement |
Q3’2023 |
Q3’2024 |
y/y change |
|
Net Interest Income |
72.6 |
80.6 |
11.0% |
|
Net non-Interest Income |
57.8 |
61.2 |
5.8% |
|
Total Operating income |
130.4 |
141.7 |
8.7% |
|
Loan Loss provision |
(19.0) |
(12.7) |
(33.2%) |
|
Total Operating expenses |
(84.5) |
(90.7) |
7.4% |
|
Profit before tax |
45.9 |
51.0 |
11.1% |
|
Profit after tax |
36.2 |
40.9 |
13.1% |
|
Core EPS |
9.6 |
10.8 |
13.1% |
|
Income Statement Ratios |
Q3’2023 |
Q3’2024 |
% points change |
|
Yield from interest-earning assets |
11.2% |
11.7% |
0.4% |
|
Cost of funding |
3.7% |
4.2% |
0.4% |
|
Cost of risk |
14.6% |
8.9% |
(5.6%) |
|
Net Interest Margin |
5.6% |
7.7% |
2.1% |
|
Net Interest Income as % of operating income |
55.7% |
56.9% |
1.2% |
|
Non-Funded Income as a % of operating income |
44.3% |
43.1% |
(1.2%) |
|
Cost to Income Ratio |
64.8% |
64.0% |
(0.8%) |
|
CIR without LLP |
50.2% |
55.1% |
4.8% |
|
Cost to Assets |
4.3% |
4.6% |
0.3% |
|
Capital Adequacy Ratios |
Q3’2023 |
Q3’2024 |
% points Change |
|
Core Capital/Total Liabilities |
17.7% |
16.9% |
(0.8%) |
|
Minimum Statutory ratio |
8.0% |
8.0% |
0.0% |
|
Excess |
9.7% |
8.9% |
(0.8%) |
|
Core Capital/Total Risk Weighted Assets |
15.2% |
15.9% |
0.7% |
|
Minimum Statutory ratio |
10.5% |
10.5% |
0.0% |
|
Excess |
4.7% |
5.4% |
0.7% |
|
Total Capital/Total Risk Weighted Assets |
19.2% |
18.3% |
(0.9%) |
|
Minimum Statutory ratio |
14.5% |
14.5% |
0.0% |
|
Excess |
4.7% |
3.8% |
(0.9%) |
|
Liquidity Ratio |
49.7% |
55.0% |
5.3% |
|
Minimum Statutory ratio |
20.0% |
20.0% |
0.0% |
|
Excess |
29.7% |
35.0% |
5.3% |
For more information, see our Equity Q3’2024 Earnings Note
We are “Neutral” on the Equities markets in the short term due to the current tough operating environment and huge foreign investor outflows, and, “Bullish” in the long term due to current cheap valuations and expected global and local economic recovery. With the market currently being undervalued for its future growth (PEG Ratio at 0.6x), we believe that investors should reposition towards value stocks with strong earnings growth and that are trading at discounts to their intrinsic value. We expect the current foreign investors’ sell-offs to continue weighing down the equities outlook in the short term.
- Statutory Review
During the week, the government proposed amendments to cap interest on land rates default. Under the proposed changes to the National Rating Bill of 2022, the interest charged on defaulted rates across the 47 counties will not exceed the prevailing Central Bank of Kenya (CBK) lending rate, currently set at 12.0%. This is a shift from the current framework, where counties independently determine the interest rates.
The proposed cap aims to provide a uniform legislative framework for setting and collecting property rates, replacing the Rating Acts adopted in 2014. Property owners, who often face difficulties settling rates due to high penalties, stand to benefit from this standardization. However, the new structure could also result in higher interest rates if the CBK raises the base lending rate.
The bill, tabled before the National Assembly on Wednesday 13th November 2024, also mandates counties to update their property valuation rolls every five years. This measure seeks to ensure that counties capitalize on property appreciation, a step aimed at boosting revenue collection.
This amendment is critical for counties seeking to address high default rates, which hinder revenue generation. While property rates remain a major income source, businesses struggling due to economic challenges, such as the Covid-19 pandemic, have faced significant hurdles in meeting payment obligations.
If passed, the National Rating Bill of 2022 will unify property rate frameworks, alleviating businesses from excessive penalties while offering counties a more structured path to improving revenue collection.
- Residential Sector
- Centum Real Estate strategic partnership with Gulf African Bank
During the week, Centum Real Estate announced a strategic partnership with Gulf African Bank to offer Shariah-compliant mortgage financing to its customers. This collaboration aims to expand home financing options and drive the uptake of Centum's property portfolio. Under the agreement, customers will access up to 90.0% mortgage financing with a repayment period of up to 20 years and an expedited 48-hour approval process.
This initiative is set to boost homeownership rates among individuals seeking Shariah-compliant financial products. By addressing a growing demand for ethical financing in the Real Estate market, Centum Real Estate positions itself as a customer-centric developer while enhancing its market competitiveness. The partnership also provides Gulf African Bank an opportunity to deepen its footprint in the housing finance sector.
Shariah-compliant mortgages adhere to Islamic principles, including the prohibition of charging interest. Instead, the model typically involves profit-sharing or leasing arrangements, making it attractive to Muslim homebuyers and others seeking alternative financing solutions. This offering aligns with Centum Real Estate’s broader strategy to diversify financing options and cater to varied customer preferences.
We expect this partnership will positively influence housing demand particularly among niche markets seeking Shariah-compliant solutions. Additionally, similar collaborations between Real Estate developers and financial institutions could become a trend, further diversifying home financing options and promoting inclusivity in Kenya's residential sector.
- Underutilization of the Housing Levy
Additionally, during the week, the Controller of Budget disclosed that only 30.8% of the Kshs 54.1 bn collected through the housing levy in its first year of enforcement was utilized for affordable housing projects. This amounts to Kshs 16.7 bn, leaving a significant portion of funds idle amidst delays in project implementation.
The low absorption rate, reported at 26.0%, underscores challenges in implementing the Affordable Housing programme, which had initially budgeted Kshs 64.8 bn. Of further concern beyond absorption is that even for the Kshs. 16.7 bn deployed so far, there is no transparency as to what the funds have been used for.
The slow rollout impacts the government’s ambitious target of delivering 250,000 affordable housing units annually, thus delaying efforts to address the country’s housing deficit, which currently stands at 80.0%. Furthermore, the majority of the collected funds have been redirected to Treasury bills and bonds, reflecting delays in aligning the Affordable Housing Board's expenditure framework.
The Affordable Housing Act of 2024, enacted in March, mandates contributions from workers in both formal and informal sectors, with employees contributing 1.5% of their gross salaries. However, implementation bottlenecks persist, including a lack of finalized investment plans from implementing agencies like the National Housing Corporation.
We anticipate continued scrutiny of the Affordable Housing Board’s expenditure strategies as stakeholders demand accelerated implementation to meet annual housing targets. Streamlining fund allocation and project execution will be critical to fulfilling the government’s promise of addressing Kenya’s housing deficit and ensuring transparency in the use of housing levy funds.
The Affordable Housing Program (AHP) in Kenya is a key component of the government's Big Four Agenda, targeting the construction of 250,000 affordable homes annually. Despite these ambitious targets, the current housing supply falls significantly short, with only about 50,000 units being delivered annually against a demand of 250,000 units. This deficit underscores the critical need for initiatives like the Finsco-Greenwood partnership to boost affordable housing supply.
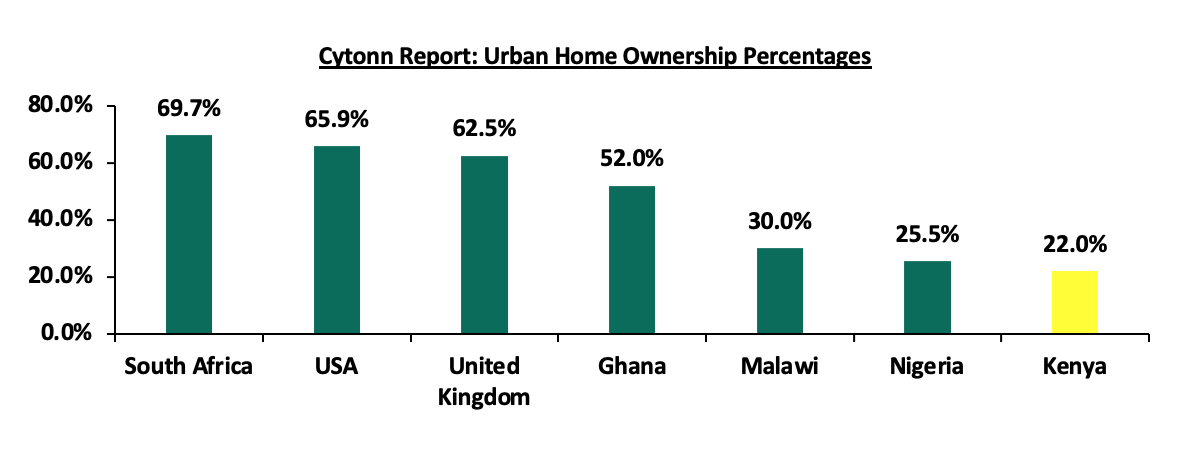
Homeownership in Kenya remains a challenge, with the majority of the population unable to afford homes due to high property prices and limited access to financing. The national homeownership rate stands at approximately 21.3% in urban areas sprawling the national average of 61.3% while 78.7% of urban dwellers rent. The government's push for affordable housing aims to improve this rate by making homes more accessible to lower and middle-income earners. The graph below highlights home ownership rates in different African countries;
Source: Centre for Affordable Housing Finance Africa (CAHF), US Census Bureau, UK Office for National Statistics
- Commercial Office Sector
During the week, Stanbic Bank Kenya announced that it had extended a Kshs 3.3 bn (USD 25.6 mn) loan to Gateway CCI Limited, a subsidiary of Mauritius-based real estate firm Grit, for the ENEO CCI project located in Tatu City. This development is part of Grit’s efforts to expand its real estate portfolio in Kenya, encompassing both commercial and residential properties. The ENEO CCI building, which serves as the headquarters for Call Centre International (CCI) Global, was commissioned on May 10, 2024.
The project was completed six months ahead of schedule and it is currently 90.0% occupied as of November 2024. It hosts not only the call center but also multinational corporations, including financial service firms, with expectations of full occupancy by December.
The injection of this significant loan reflects the confidence of financial institutions in Kenya’s commercial real estate market, particularly in strategic hubs like Tatu City. The ENEO CCI development has already created substantial employment opportunities, with over 4,000 jobs through CCI Global. Its designation as a Special Economic Zone (SEZ) enhances its attractiveness for multinational tenants, offering tax incentives and operational efficiencies that align with Kenya’s economic growth agenda.
Moreover, the project’s success, including its completion under budget and ahead of schedule, positions it as a benchmark for efficiency and financial prudence in the region’s real estate development sector.
Grit, through its subsidiaries Gateway CCI and Grit Services Limited, has increased its local borrowings, with the latter securing Kshs 3.9 bn (USD 30.58 mn) from NCBA Bank Kenya. This expansion underscores the growing importance of Kenya as a focal point for international real estate investments. Tatu City, as a master-planned urban development, continues to attract significant commercial investments, contributing to its emergence as a business hub.
The ENEO CCI project, designed to accommodate diverse tenants, aligns with the increasing demand for modern, well-equipped office spaces that can support global operations. Its SEZ status further strengthens its value proposition for companies looking for cost-efficient operations in East Africa.
As the ENEO CCI project approaches full occupancy by December 2024, we expect this to be a catalyst for further growth in the commercial office sector within the Nairobi Metropolitan Area (NMA). The increasing presence of multinational companies and the rise of co-working spaces will continue driving demand, particularly for modern, well-located, and efficient office spaces in strategic hubs like Tatu City.
However, with an existing oversupply of 5.8 mn SQFT of office space, market participants will need to focus on differentiation, such as sustainability, operational efficiency, and leveraging incentives like Special Economic Zone (SEZ) benefits. Projects like ENEO CCI demonstrate the potential for innovative developments to overcome these challenges, offering a path forward for Kenya’s commercial office sector to balance supply and demand while fostering economic growth.
- Real Estate Investments Trusts (REITs)
On the Unquoted Securities Platform, Acorn D-REIT and I-REIT traded at Kshs 25.4 and Kshs 22.2 per unit, respectively, as per the last updated data on 31st October 2024. The performance represented a 27.0% and 11.0% gain for the D-REIT and I-REIT, respectively, from the Kshs 20.0 inception price. The volumes traded for the D-REIT and I-REIT came in at Kshs 12.3 mn and Kshs 31.6 mn shares, respectively, with a turnover of Kshs 311.5 mn and Kshs 702.7 mn, respectively, since inception in February 2021. Additionally, ILAM Fahari I-REIT traded at Kshs 11.0 per share as of 31st October 2024, representing a 45.0% loss from the Kshs 20.0 inception price. The volume traded to date came in at 138,600 for the I-REIT, with a turnover of Kshs 1.5 mn since inception in November 2015.
REITs offer various benefits, such as tax exemptions, diversified portfolios, and stable long-term profits. However, the ongoing decline in the performance of Kenyan REITs and the restructuring of their business portfolios are hindering significant previous investments. Additional general challenges include: i) insufficient understanding of the investment instrument among investors, ii) lengthy approval processes for REIT creation, iii) high minimum capital requirements of Kshs 100.0 mn for trustees, and iv) minimum investment amounts set at Kshs 5.0 mn for the Investment REITs, all of which continue to limit the performance of the Kenyan REITs market.
We expect the performance of Kenya’s Real Estate sector to be sustained by: i) increased investment from local and international investors, particularly in the residential sectors ii) favorable demographics in the country, leading to higher demand for housing and Real Estate, (iii) government infrastructure development projects e.g. roads, opening up satellite towns for investment, and iv) ongoing residential developments under the Affordable Housing Agenda, aiming to reduce the housing deficit in the country which is currently at 80.0%. However, challenges such as rising construction costs, strain on infrastructure development, and high capital demands in REIT sector will continue to impede the sector’s optimal performance by restricting developments and investments.
In analyzing the Industrial Nairobi Metropolitan Area (NMA) we discuss the following;
- Overview of the Real Estate sector in Kenya,
- Overview of the Industrial sector in Kenya,
- Key trends, Opportunities and Challenges facing Industrial Real Estate Sector in NMA,
- Summary Performance of the NMA Industrial Sector in 2024,
- Conclusion and Outlook for the NMA Industrial Real Estate sector.
Section I: Overview of the Real Estate Sector in Kenya
The Real Estate sector in Kenya has grown over the years to become one of the largest contributors to the country’s Gross Domestic Product (GDP), supported by factors such as; i) positive demographics including higher urbanization and population growth rates of 3.7% p.a and 2.0% p.a, respectively, against the global average of 1.7% p.a and 0.9% p.a, respectively, as at 2023, ii) government’s sustained efforts to promote infrastructural development, opening up new areas for investments, iii) emphasis to provide affordable housing by the government through programs such as the Affordable Housing Program (AHP), iv) increased investment by both local and foreign investors, and, v) increased accessibility to low-interest loans provided by entities such as Kenya Mortgage Refinance Company (KMRC) among others.
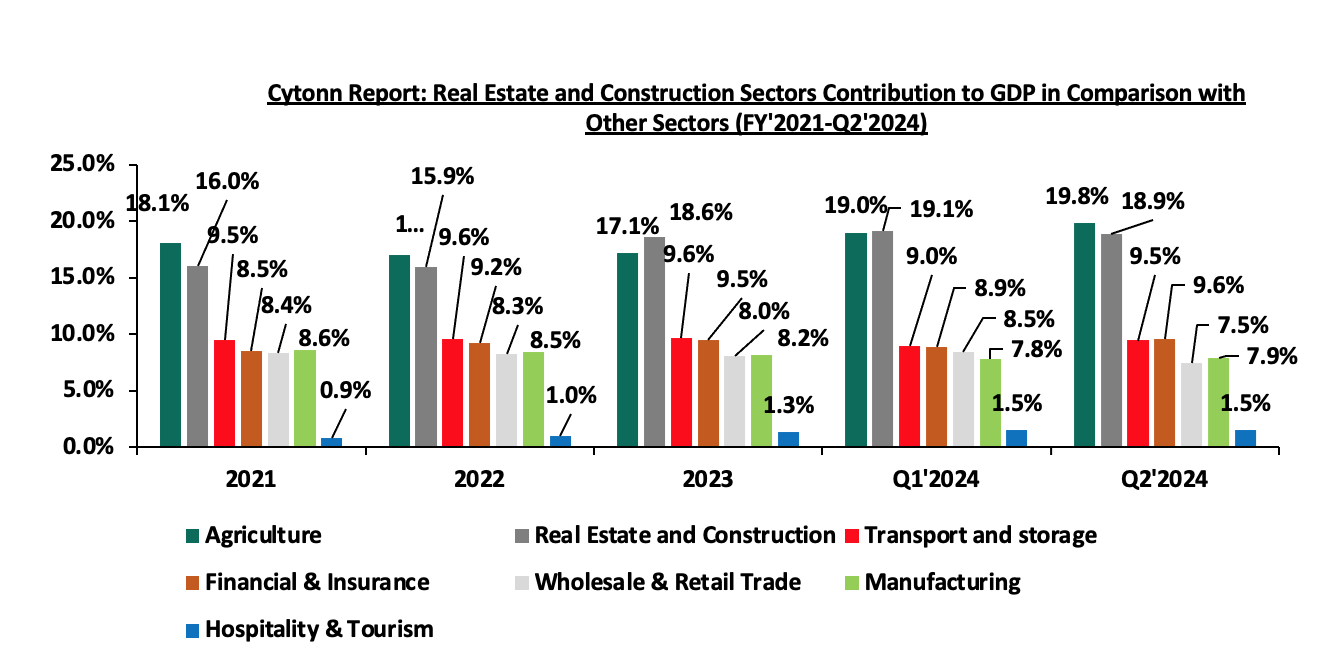
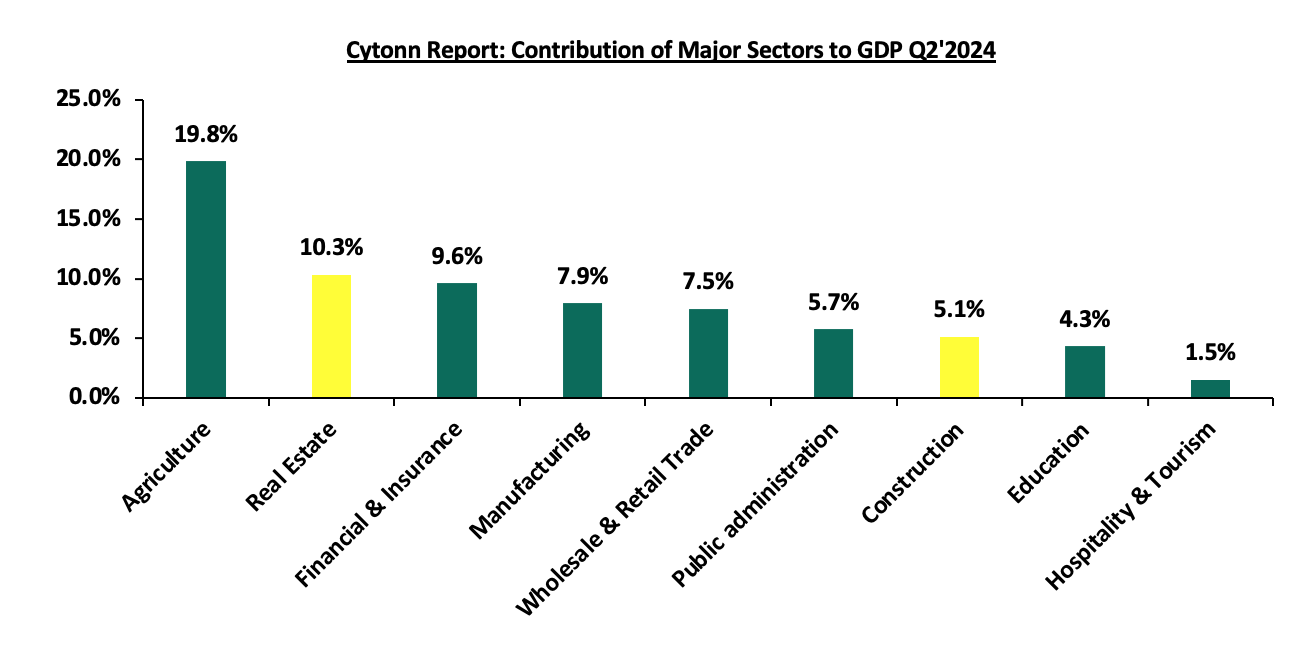
As we assess the growth in the Kenyan property market, it is imperative to recognize the growth achieved by the Real Estate sector, collaboratively with the construction sector, given their interdependence and inherent correlation. Construction and Real Estate sectors jointly contributed to 18.9% to the country’s GDP in Q2’2024, subsequently being the second largest contributors after Agriculture which contributed 19.8%. The performance surpassed major and perennial sector contributors including transport at 9.5%, financial services and insurance at 9.6%, and manufacturing which contributed 7.9%. The performance of the two sectors confirms their importance to the Kenyan economy, and additionally draws a positive outlook. The graph below shows the trend of the Real Estate and Construction sectors contribution to GDP between FY’2021 and Q2’2024;
Source: Kenya National Bureau of Statistics (KNBS)
Below is a graph highlighting the top sectoral contributors to GDP in Q2’2024;
Source: Kenya National Bureau of Statistics (KNBS)
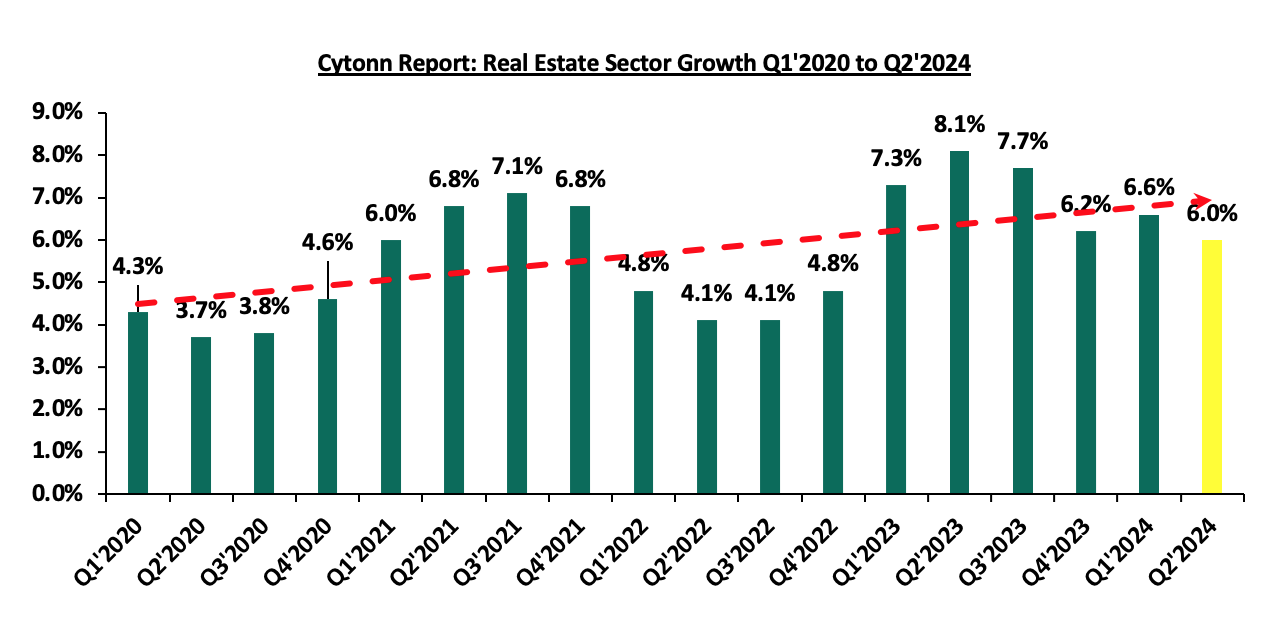
Despite the growth in the sector, the sector has also experienced some setbacks ranging from macro-economic factors to sector specific factors over the years. In FY’2020, the sector experienced the hardest shock from the unprecedented COVID-19 pandemic. However, the sector has since made a turnaround in FY’2021 as the business world embarked on reopening driven by mass administration of COVID-19 vaccine and ease of travel restrictions and lockdowns. In 2022, however, the sector’s witnessed a turnaround in performance, reverting to a downward trajectory. Notably, the sector’s growth declined to 4.8% in Q4’2022 from 6.8% in Q4’2021, attributable to the August general elections. In the period leading to the elections, investors faced uncertainty as they assessed the country’s political environment. However, the electioneering period concluded peacefully which boosted investors’ confidence, and paved way for the resumption of business activities in 2023 as evidenced by the 7.3 % average growth rate recorded in FY’2023.
The sector’s growth, however, declined in the subsequent quarters due to the tough macro-economic conditions including rising interest rates, which led to expensive borrowing, further dampening demand for mortgages and lending to developers, and inflationary pressures, particularly in building materials and labour costs, increased project costs, reducing the profitability of new developments and slowing down ongoing projects. The Real Estate sector in 2024 posted steady growth of 6.0% in Q2’2024, which is 2.1% points slower than the 8.1% growth registered in Q2’2023. This growth can be attributed to the increasing need for housing in the country. However, the growth remained subdued compared to Q2’2023 due to the sustained increase in the cost of construction materials, which posed a hurdle to investors and reduced the number of activities in the sector during the period under review, as well as a diminishing purchasing power by consumers Despite this, the value of approved building plans in the Nairobi Metropolitan Area (NMA), a major contributor to the Real Estate market in the country, increased y/y basis by 136.1% to Kshs 59.8 bn in Q2’2024, from Kshs 25.3 bn recorded in Q2’2023. The graph below shows the Real Estate Sector Growth Rate between Q1’2020 and Q2’2024;
Source: Kenya National Bureau of Statistics (KNBS)
Section II: Overview of the Industrial Sector in Kenya
The Nairobi Metropolitan Area has been on the front line and a major contributor to the Industrial Real Estate Sector accounting for approximately 90.0% of the country’s industrial space. Known for its high concentration of industrial project in areas like Nairobi, Kiambu, Machakos and Kajiado; with Nairobi County holding the largest share at 66.0%, largely due to its status as the capital city. Kiambu follows, housing key industrial investments such as Tatu City, Nairobi Gate Industrial Park (NGIP), Tilisi, and Northlands City. These areas have attracted major industrial projects like ALP West in Tilisi and ALP North in Tatu City, bolstering Kiambu’s market share. The growth in the area has been driven by several factors such as the surge in e-commerce, demand for high-quality facilities, favorable demographics, enhanced infrastructure, government-led initiatives aligned with Vision 2030 and Nairobi’s role as East Africa’s business hub which has attracted foreign investments.
The Special economic zones sectors include free port zones, free trade zones, ICT parks, business service parks, Industrial parks, livestock and agricultural zones among others. Such zones are located at Konza Technopolis and Tatu Cuty SEZ. These zones enjoy various benefits such as;
- Tax and Fiscal incentives- Businesses in SEZs often enjoy reduced corporate tax rates, exemptions from customs duties, VAT, and import/export levies. For example, Kenya provides tax holidays for firms operating in SEZs,
- Infrastructure development- SEZs provide modern infrastructure, including transport links, utilities, and telecommunications, which support industrial and commercial activities,
- Simplified regulations-SEZs streamline bureaucratic procedures with "one-stop-shop" services for licensing, permitting, and approvals, reducing administrative burdens on businesses,
- Increased Foreign Direct Investment (FDI)- SEZs attract FDI by providing a stable, predictable environment with business-friendly policies and guaranteed protection for investors,
- Export promotion-SEZs focus on export-driven industries, allowing businesses to operate competitively in global markets, often with preferential trade agreements, and,
- Economic diversification-SEZs enable countries to diversify away from traditional sectors by fostering new industries and technologies.
Nairobi Metropolitan Area (NMA) Industrial Sub-Sectors
- Manufacturing
Manufacturing is a core sub-sector of industrial Real Estate, encompassing facilities like factories, assembly plants, and production hubs. These properties are purpose-built to house machinery, assembly lines, and other production infrastructure, making them critical to supply chains. Industrial parks and zones, such as Kenya's SEZs and EPZs, often integrate manufacturing with warehousing and logistics to optimize production and distribution. Key features of these facilities include high ceilings, reinforced floors, and advanced utilities tailored for large-scale operations. Manufacturing hubs not only drive demand for industrial Real Estate but also attract investment, support SMEs, and facilitate regional trade, making them integral to economic growth.
The manufacturing industry has seen gradual decline in performance, having the contribution to GDP decrease by 0.8% to 7.9% in Q2’2024 from 8.7% average recorded in 2020. The manufacturing subsector accounted for about 7.9% of GDP in Q2’2024, falling short of the government’s target of 15.0%. The graph below shows the manufacturing sector contribution to GDP from FY’2020 to Q2’2024

Source: Kenya National Bureau of Statistics (KNBS)
The reduced performance in manufacturing can be attributed to i) high costs of production driven by harsh economic conditions, both locally; such as increased taxes and globally; due to supply chain disruption caused by geopolitical factors such as the Russia-Ukraine war and the Israel-Palestine war, ii) competition from imports, as some companies find it cost-effective to import goods rather than produce them locally, and, iii) decreasing purchasing power in the country hence a reduced demand of manufactured commodities. Despite the reduced growth, the industry is being promoted by the below activities;
- Textiles and Apparel- Benefiting from the African Growth and Opportunity Act (AGOA) with the U.S. and preferential market access within East Africa, textile exports have grown significantly. In 2024, export processing zones (EPZs) focusing on garment manufacturing, particularly for export to the U.S., have attracted major global brands. However, local challenges, like higher production costs compared to Asia, continue to limit the sector’s full potential. Kenya’s industrial sector is experiencing a dynamic transformation, propelled by strategic initiatives such as Special Economic Zones (SEZs) and Export Processing Zones (EPZs). These initiatives are crucial for attracting investment and fostering industrial growth. The government’s sanctioning of Tilisi Logistics Park as an EPZ in January 2024 marks a significant milestone. This move aligns with the broader strategy to enhance Kenya’s industrial capacity and export potential. Furthermore, the inauguration of a 100,000 SQM Textile Park within Nairobi Gate Industrial Park, designated as an SEZ, underscores the sector’s expansion. The Textile Park is anticipated to generate over 5,000 jobs and contribute significantly to the country’s GDP, estimated to add KShs 10.0 Bn annually by 2025.
- Agro-processing-With agriculture as Kenya's largest economic sector, agro-processing is an essential part of the industrial chain. Companies are focusing on value addition in tea, coffee, and horticultural products to increase their export value. For example, Kenyan tea companies have invested in new packaging facilities to export ready-to-drink tea products rather than raw tea, increasing value and market reach.
- Pharmaceuticals-Kenya aims to become East Africa's pharmaceutical manufacturing hub, especially in the wake of the COVID-19 pandemic, which highlighted the need for local drug production. Several local and foreign investors have shown interest in setting up manufacturing plants for essential drugs and vaccines, encouraged by government tax incentives.
- Data Centres
The growing need for rapid adoption of cloud services, fintech applications, and digital transformation among businesses has driven demand for data centers in the Nairobi Metropolitan Area providing a substantial boost to the growth of Industrial Real Estate growth. Companies like Safaricom, Microsoft, Amazon Web Services and the top tier lenders; are fueling the need for local data storage facilities to enhance speed and reduce latency. The sector has been supported by major investments such as Liquid Intelligent Technologies opened one of Africa’s largest data centers in Nairobi and Africa Data Centres (ADC) continues to expand its footprint in Nairobi, capitalizing on the region's connectivity and demand. There is an increasing need to i focus on hyperscale data centers to support multinational and regional clients. Additionally, the sector’s growth is supported by Nairobi’s advanced fiber-optic connectivity, supported by undersea cables (TEAMS and SEACOM) which positions the city as a data hub. The availability of affordable electricity and cooling systems in cooler areas like Limuru also enhances viability. On the other hand, the growth in the sector is challenged by factors such as i) high initial capital requirements, iii) dependency on a reliable power grid; outages can easily disrupt operations, and iv) regulatory gaps in data security and management in Kenya.
- Ware Housing and Logistics/Ecommerce
The industrial Real Estate market in Nairobi has witnessed a notable increase in prime warehouse rental prices, driven by high demand from sectors such as e-commerce, fast-moving consumer goods (FMCG), and agribusiness. During the first half of 2024, rental rates for prime warehouses in Nairobi grew exponentially reaching KShs 775 per SQM and achieving a rental yield of 9.5% on average, making Nairobi the second most expensive city in Africa for prime industrial rents after Kampala which recorded rental rate of Kshs 904.2 per SQM and a rental yield of 12.5% on average. Prime warehouse occupancy in Nairobi reached 85.0% in 2024, up from 78% in 2023 signifying 9.0% Y/Y growth. This highlights the absorption of new space amid robust demand. Warehousing solutions for e-commerce businesses focus on urban centers like Embakasi, Mlolongo, and Syokimau, near key transport routes such as SGR, Airport and major road connections. Developers have responded to the demand surge by constructing more speculative projects. An additional 400,000 square meters of warehouse space is expected to be completed by 2024 to address the growing requirements
The sub-sector has been performing well due to factors such as i) surge in E-commerce supported by platforms like Jumia, Kilimall, Jambo Shop and Glovo who needs warehouses to sell to their customers, ii) shift in modern warehousing from traditional go-downs due to the increased need in automation and climate-controlled environments and, iii) strategic location to areas with manager developments like Tatu City Industrial pack and Infinity park in Athi River. The sector is however being undermined by factors such as i) limited availability of Grade-A warehousing, ii) increasing land prices in prime areas like Mlolongo and JKIA, iii) poor road infrastructure in emerging warehousing zones.
- Slaughter Houses
Slaughterhouses are a vital component of industrial Real Estate in Nairobi Metropolitan Area (NMA), where the growing middle class has fueled a rising demand for meat consumption. These facilities play a critical role in meeting this demand by ensuring efficient processing, storage, and distribution of meat products. Major hubs like Kiamaiko, Bama, Neema and Nyonjoro serve as significant slaughter points, processing high volumes of livestock daily. . These facilities often cater to both local and export markets, especially for halal-certified meat, which adheres to strict religious guidelines. Several slaughterhouses operate with outdated infrastructure, leading to concerns over hygiene and public health. Regulatory bodies such as the National Environment Management Authority (NEMA) have raised concerns about effluent management and the environmental footprint of these facilities. Which highlights a gap for high quality slaughter houses in the area.
The sub-sector growth is undermined by i) lack proper systems to handle waste, leading to pollution of nearby rivers and water bodies ii) densely populated areas like Kiamaiko face logistical challenges due to limited space, poor road networks, and the proximity of slaughterhouses to residential zones, iii) regulatory crackdowns and temporary closures can destabilize the livelihoods of workers and trader’s dependent on these facilities. Striking a balance between enforcement and economic stability remains a challenge.
- Special Economic Zones (SEZs) and Export Processing Zones (EPZs)
Another important sub-sector of industrial Real Estate in Nairobi Metropolitan Area (NMA) is the Special Economic Zones (SEZs) and Export Processing Zones (EPZs). Both investment promotion programs that aim to build export-led economic development through industrialization. They offer incentives to investors, such as corporate tax holidays, duty, and VAT exemptions. However, they differ in their objectives, investment requirements, and approach: Also known as free zones, EPZs focus on manufacturing for export. This model has been widely used in developing countries for almost four decades. They usually combine residential and multiuse commercial and industrial activity.
The performance of this sector is promoted by factors such as; i) SEZs like Tatu City and Konza Technopolis, are attracting both local and international investors due to tax incentives and infrastructure readiness, ii) EPZ in Athi River remains one of the largest hubs, hosting over 100 companies focused on textiles, food processing, and assembly. These zones are primarily export-oriented, leveraging preferential trade agreements like AGOA (African Growth and Opportunity Act), iii) diversification in operations; beyond textiles, new EPZ entrants focus on pharmaceuticals, electronics, and processed foods. On the other hand, challenges like i) Over-dependence on AGOA, which faces periodic renewal risks, ii) high costs of compliance with export standards, especially for smaller firms, and iii) limited capacity to handle large-scale manufacturing due to infrastructure gaps.
Section III: Key trends, Opportunities and Challenges facing Industrial Real Estate Sector in NMA
- Key Trends in 2024
The industrial Real Estate sector in Kenya in 2024 has been defined by a number of trending factors including;
- The demand for quality internet services in Kenya, driven by the country's population, which ranks first globally for time spent on social media, according to Visual Capitalist. This demand is further driven by the growing adoption of remote working, which gained popularity during the COVID-19 pandemic, and the rise of e-learning. These factors have compelled Internet Service Providers to enhance their services, leading to increased demand for data centers and, consequently, growth in industrial Real Estate,
- Rising demand for warehousing and logistics facilities-The rise of e-commerce, driven by platforms like Jumia and global players like Amazon, has significantly increased demand for modern logistics and warehousing spaces. Businesses are focusing on proximity to key transport corridors, such as the Nairobi-Mombasa Road and the Nairobi Expressway, to facilitate efficient distribution,
- Industrial parks development large-scale developments, like Tatu Industrial Park and Infinity Industrial Park, are setting a benchmark for planned industrial zones offering modern infrastructure. Increased interest from multinational companies looking for regional hubs, particularly due to Nairobi's strategic location in East Africa.
- Adoption of green building practices. Developers are incorporating sustainable construction practices,including energy-efficient designs and solar energy systems, to align with global ESG (Environmental, Social, Governance) goals, as well as reducing over reliance on hydro-electricity, and
- Government incentives and policy support. Initiatives like the Special Economic Zones (SEZs) and Export Processing Zones (EPZs) offer tax incentives to attract investors into industrial real estate. Public-private partnerships are being promoted to fast-track industrial infrastructure development.
- Challenges Facing the Industrial Sector
- High acquisition land and construction costs to establish the Industrial Real Estate infrastructures such as warehouses. Prime land within the Nairobi metropolitan area is becoming increasingly expensive, driving developers to seek peripheral areas like Machakos and Kiambu counties. Inflation and fluctuating material costs have impacted project and products affordability,
- Inadequate infrastructure in peripheral areas remains a challenge in the sector. While central locations are well-connected, newer industrial zones face challenges such as poor road networks, unreliable power supply, and limited water access,
- Regulatory barriers and compliance Costs: Regulatory and bureaucratic hurdles such as lengthy approval processes and inconsistencies in land tenure systems discourage investment and zoning regulations sometimes conflict with market needs, limiting flexibility in land use. Industrial firms face lengthy approval processes, particularly in sectors like pharmaceuticals and food production, where stringent standards apply. While government agencies like the Kenya Bureau of Standards (KEBS) maintain quality, the process can be slow and costly. For example, obtaining certifications for export products can take months, delaying market entry, and,
- Over-reliance on foreign investment where a significant portion of funding for industrial projects comes from foreign investors, leaving the sector vulnerable to global economic shifts.
Below are some of the highlights witnessed throughout the year;
- Taita-Taveta County is set to achieve an economic milestone with the approval of a Kshs 11.0 bn steel plant by Devki Steel Mills Limited and will be completed within eight months. The plant is set to be constructed in Manga area, Voi. Narendra Raval of Devki Steel Mills was officially handed a 500-acre parcel of land to commence the construction of the plant. For more information, please see our Cytonn monthly August 2024, and
- President Ruto's visit to the U.S. resulted in the signing of an agreement between G42 and Microsoft to build a data center worth Kshs 131.0 bn (USD 1.0 bn) at the KenGen Green Park in Olkaria. The data center will run on 100.0% renewable geothermal power from the Olkaria Geothermal fields in Naivasha, Nakuru County. G42, in collaboration with other partners, will design and construct the state-of-the-art facility, which will provide access to Microsoft Azure through a new East Africa Cloud Region. For more information, please see our Cytonn Weekly #21/2024.
Section V: Summary Performance of the NMA Industrial Sector in 2024:
- Performance of Industrial Spaces in Kenya by regions
Average rental prices for Industrial spaces in the Nairobi Metropolitan Area (NMA) came in at KSHs 430 per SQM and selling prices on average are at KSHs 75,000 per SQM this performance is attributable to factors such as i) good infrastructures such as the SGR and road networks such as bypasses, major highways and various airports, ii) stable political environment, iii) strategic location and market access that is ,Proximity to major markets and It serves as a gateway to East African markets, with strong connections to other urban centers in the region through the East African Community (EAC) and African Continental Free Trade Area (AfCFTA), iv) the Nairobi region benefits from relatively reliable power and water supply compared to remote areas, despite nationwide challenges with energy costs, v) as a hub for education and innovation, Nairobi has a concentration of universities, technical institutions, and vocational training centers, vi) industries benefit from access to a pool of skilled professionals in fields such as manufacturing, technology, and engineering, and vii) the region hosts some of Kenya’s largest Special Economic Zones (SEZs) and Export Processing Zones (EPZs), including those in Athi River and the upcoming Konza Technopolis. These zones offer tax incentives, reduced import/export tariffs, and infrastructure tailored to industrial activities. The graph below shows average rental prices within the Kenyan Industrial Real Estate Sector in 2024

Source: Cytonn Research
The graph below shows average sale prices within the Kenyan Industrial Real Estate Sector in 2024;
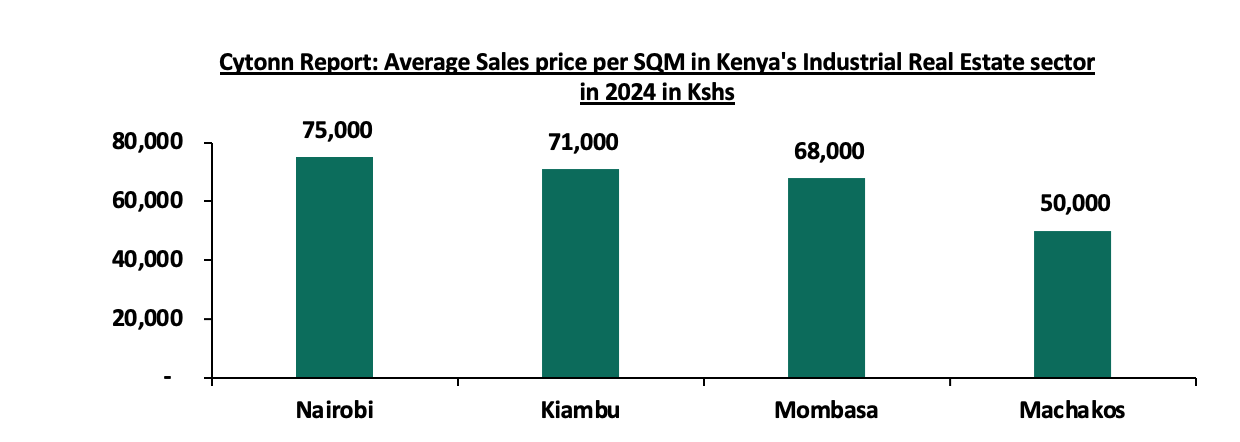
Source: Cytonn Research
- Performance of Industrial spaces in NMA by nodes
Industry Area, Ruaraka and Mombasa road areas, attract high rental and selling prices. Industry area has the highest average rent per Month of Kshs 550.0 per SQM and selling price of Kshs 80,000 Per SQM contributable to factors such as proximity to the Jomo Kenyatta International Airport (JKIA), increased road and rail network such as the Mombasa road, Eastern by pass, SGR and the Nairobi express way. On the other hand, Mlolongo is the least performing node with monthly rates of Kshs 260 per SQM and selling price per SQM of Kshs 40,000 attributable to the distance from the CBD, increased freight costs, and limited road access. The graph below compares rental performance of various nodes;
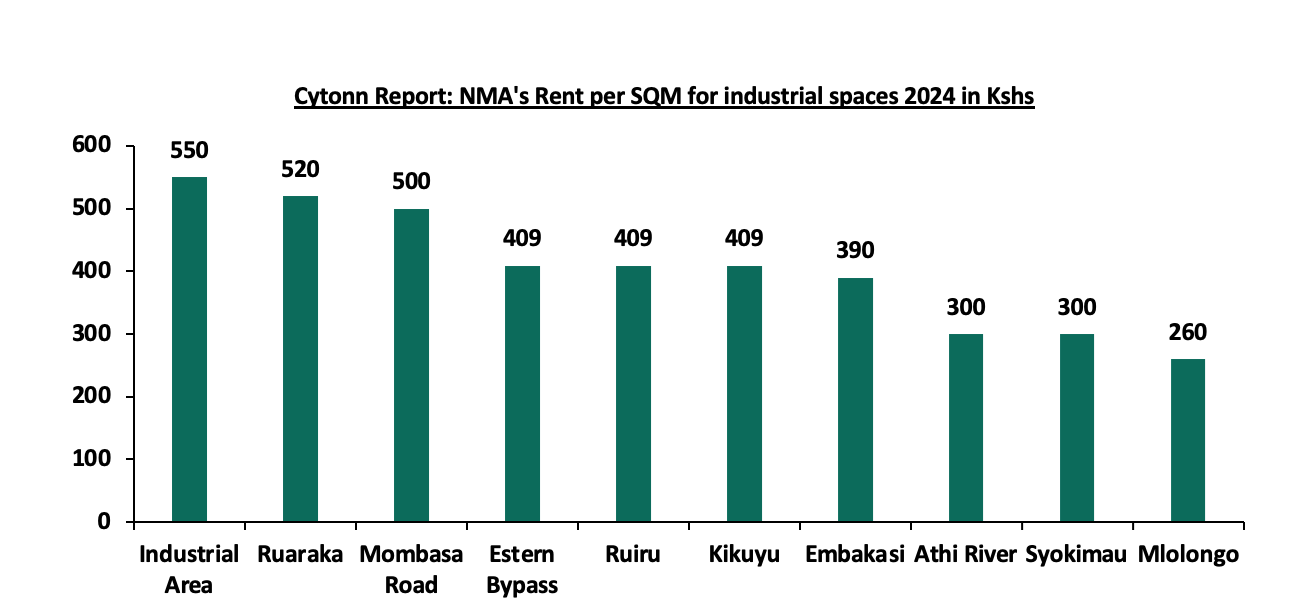
Source: Cytonn Research
The graph below compares various nodes performance in terms of selling prices within Nairobi Metropolitan Area (NMA);
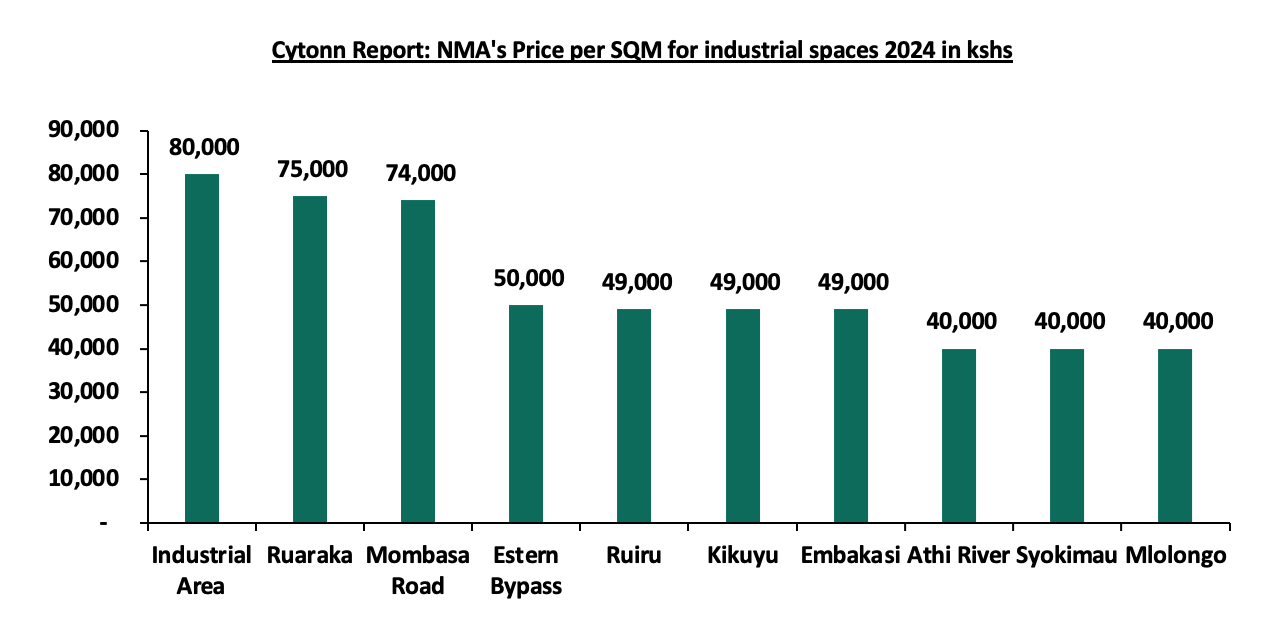
Source: Cytonn Research
Section VI: Conclusion and Outlook for the NMA Industrial Real Estate sector
The industrial Real Estate sector in Kenya in 2024 is on neutral since the sector faces a mix of challenges and opportunities. Sustained government support, increased regional trade, and continued investment in green energy and technology adoption are essential to ensure its growth. If these initiatives are maintained and bottlenecks addressed, NMA industrial sector is well-positioned to become a regional hub for manufacturing and innovation in the coming decade.
The industrial real estate sector in the Nairobi metropolitan area is experiencing significant growth, driven by evolving market demands and government support. While challenges such as high costs and infrastructural gaps persist, strategic planning, technological adoption, and focus on sustainable practices can unlock vast opportunities. Stakeholders, including developers, investors, and policymakers, should collaborate to address these challenges and leverage Nairobi’s strategic position as a regional hub.
We maintain a neutral outlook for the sector. Going forward, we expect the sector to continue on an upward trajectory driven by: i) the rising demand for data centers in the country, ii) an increasing demand for cold rooms, especially in the Nairobi Metropolitan Area, iii) demand for quality warehouses due to the growing e-commerce business in the country, iv) support from the government, as evidenced by the establishment of Special Economic Zones (SEZ) and Export Processing Zones (EPZ), v) increased development activities by industry players such as ALP Africa Logistics, vi) Kenya’s continued recognition as a regional hub, hence attracting international investors, and, vii) efforts by the government to support agricultural and horticultural products in the international market.
Disclaimer: The views expressed in this publication are those of the writers where particulars are not warranted. This publication, which is in compliance with Section 2 of the Capital Markets Authority Act Cap 485A, is meant for general information only and is not a warranty, representation, advice or solicitation of any nature. Readers are advised in all circumstances to seek the advice of a registered investment advisor.

