Cytonn Monthly – August 2024
By Cytonn Research, Sep 1, 2024
Executive Summary
Fixed Income
During the month of August 2024, T-bills were oversubscribed, with the overall average oversubscription rate coming in at 113.1%, higher than the oversubscription rate of 102.6% recorded in July 2024. The overall average subscription rate for the 91-day paper decreased to 286.5% from 352.2%, while the overall average subscription rates for the 182-day and 364-day paper increased to 111.5% and 45.5% respectively, from 64.8% and 40.6% respectively, which was recorded in July 2024. The average yields on the government papers recorded mixed performance during the month, with the 91-day and 182-day papers yields decreasing by 14.4 bps and 8.1 bps to 15.9% and 16.7% respectively from 16.0% and 16.8% recorded the previous month, while the yields on the 364-day paper increased marginally by 2.7 bps to remain relatively unchanged at 16.9% recorded the previous month. For the month of August, the government accepted a total of Kshs 100.1 bn of the Kshs 108.6 bn worth of bids received, translating to an acceptance rate of 92.1% compared to an acceptance rate of 86.0% in the month of July;
During the week, T-bills were oversubscribed, with the overall oversubscription rate coming in at 100.8%, a reversal from the undersubscription rate of 79.9% recorded the previous week. Investors’ preference for the shorter 91-day paper persisted, with the paper receiving bids worth Kshs 17.5 bn against the offered Kshs 4.0 bn, translating to an oversubscription rate of 437.4%, significantly higher than the oversubscription rate of 197.8% recorded the previous week. The subscription rates for the 182-day and 364-day papers decreased to 44.5% and 22.5% respectively from the 57.6% and 55.0% respectively recorded the previous week. The government accepted a total of Kshs 23.6 bn worth of bids out of Kshs 24.2 bn bids received, translating to an acceptance rate of 97.7%. The yields on the government papers were on a downward trajectory, with the yields on the 364-day, 182-day, and 91-day papers decreasing by 1.7 bps, 3.6 bps, and 1.0 bps to 16.84%, 16.63%, and 15.78% respectively from 16.86%, 16.67% and 15.79% respectively recorded the previous week;
Additionally, August 2024 bonds were oversubscribed, with the overall oversubscription rate coming in at 252.6%, higher than the undersubscription rate of 25.7% recorded in July 2024. The reopened bonds IFB1/2023/017 and 1FB1/2023/6.5, with fixed coupon rates of 14.4% and 17.9% respectively, received bids worth Kshs 126.3 bn against the offered Kshs 50.0 bn translating to an oversubscription rate of 252.6%, with the government accepting bids worth Kshs 88.7 bn, translating to an acceptance rate of 70.2%, with the average accepted yields coming at 17.7% and 18.3% respectively;
Also, during the week, the IFB1/2023/17 bond was oversubscribed with the overall subscription rate coming in at 234.6%, receiving bids worth Kshs 35.2 bn against the offered Kshs 15.0 bn. The government accepted bids worth Kshs 32.0 bn, translating to an acceptance rate of 91.0%. The weighted average yield of accepted bids came in at 17.7%, equal to the rate recorded when the bond was re-opened on 12th August 2024, while the coupon rate for the bond was fixed at 14.4%. Additionally, the tax effected rate for the IFB1/2023/017 is 19.7%;
During the week, KNBS released the y/y inflation highlighting that in August 2024 inflation increased by 0.1% points to 4.4%, from the 4.3% recorded in July 2024. This was in line with our expectation of an increase, as it came within our projected range of 4.4% to 4.7%. Our decision was mainly driven by the reduction in the Central Bank Rate (CBR) by 25.0 bps to 12.75% from 13.00% on 6th August 2024, which would increase the money supply and lower borrowing costs, hence causing a slight rise in inflation rates. The headline inflation in August 2024 was majorly driven by increase in prices of commodities in the following categories; Food & Non-Alcoholic Beverages, Housing, Water, Electricity, Gas & other fuels, and Transport by 5.3%, 4.2%, and 3.9% respectively;
Equities
During the month of August 2024, the equities market recorded mixed performance, with NSE 20 and NSE 25 gaining by 0.5% and 0.2% respectively, while NASI and NSE 10 declined by 1.9% and 0.5% respectively. The equities market performance was driven by losses recorded by large-cap stocks such as Safaricom, EABL, and DTB-K Group of 8.8%, 4.0%, and 2.3% respectively. The losses were, however, mitigated by gains recorded by large-cap stocks such as Bamburi, NCBA, and Standard Chartered Bank of 25.0%, 7.6%, and 7.4% respectively;
During the week, the equities market recorded mixed performance, with NSE 10 gaining by 1.1%, while NSE 20, NASI, and NSE 25 declined by 1.2%, 1.2%, and 0.4% respectively, taking the YTD performance to gains of 19.4%, 17.8%, 12.7%, and 11.2% for NSE 10, NSE 25, NASI, and NSE 20 respectively. The equities market performance was driven by losses recorded by large-cap stocks such as Standard Chartered Bank, Safaricom, and Stanbic Bank of 3.3%, 3.3%, and 2.8% respectively. The performance was, however, supported by gains recorded by large-cap stocks such as Bamburi, EABL, and Co-op Bank of 21.1%, 5.9%, and 3.0% respectively;
During the week, ABSA Bank Kenya Plc released their H1’2024 results, reporting a 28.9% increase in Profit After Tax (PAT) to Kshs 10.7 bn, from Kshs 8.3 bn recorded in H1’2023. The performance was mainly driven by a 19.7% increase in Net Interest Income to Kshs 23.0 bn in H1’2024, from Kshs 19.2 bn recorded in H1’2023, coupled with an 8.4% increase in Net Non-Interest Income to Kshs 8.8 bn from Kshs 8.1 bn recorded in H1’2023;
During the week, Diamond Trust Bank released their H1’2024 results, reporting that Profit After Tax (PAT) increased by 11.5% to Kshs 4.9 bn, from Kshs 4.4 bn recorded in H1’2023. The performance was mainly driven by a 10.3% increase in total operating income to Kshs 20.6 bn, from Kshs 18.7 bn in H1’2023, but was weighed down by the 12.1% increase in Total Operating Expenses to Kshs 14.2 bn in H1’2024, from Kshs 12.7 bn in H1’2023;
During the week, Britam Holdings released their H1’2024 results. This was the third time the company released their results under the new IFRS 17 reporting system. Britam’s Profit After Tax (PAT) increased by 22.6% to Kshs 2.0 bn, from Kshs 1.6 bn recorded in H1’2023. The performance was mainly driven by a 150.0% increase in Net Investment income to Kshs 13.3 bn, from Kshs 5.3 bn in H1’2023, but was weighed down by the 161.2% increase in Insurance Expenses to Kshs 12.3 bn in H1’2024, from Kshs 4.7 bn in H1’2023;
Also, During the week, Bamburi Cement Plc released their H1’2024 results, reporting a profit after tax from continuing operations for the year of Kshs 0.5 bn, a significant 131.7% increase from the Kshs 0.2 bn profit after tax recorded in H1’2023. This performance was partly attributable to the turnover which increased by 3.8% to Kshs 10.9 bn from Kshs 10.8 bn in H1’2024, and weighed down by the total operating costs increased slightly by 0.2% to remain relatively unchanged from the Kshs 10.1 bn recorded in H1’2024;
Notably, During the week, Savannah Clinker announced its intention to acquire 100% of the ordinary shares of Bamburi Cement Plc with a par value of Kshs 5.0 each for a cash consideration. The offer placed is of a total value of Kshs 25.4 bn, translating to a purchase price of Kshs 70.0 per share, just weeks after Amsons Industries (K) Limited made their offer of a total value of Kshs 23.6 bn, translating to a purchase price of Kshs 65.0 per share;
Additionally, During the week, Jubilee Holdings Limited released their H1’2024 results. Jubilee’s Profit After Tax (PAT) increased by 22.7% to Kshs 2.5 bn, from Kshs 2.0 bn recorded in H1’2023. The performance was mainly driven by a 28.4% increase in Insurance Services Revenues to Kshs 12.6 bn, from Kshs 9.8 bn in H1’2023, but was however weighed down by the 15.6% increase in Insurance Services Expenses to Kshs 11.3 bn in H1’2024, from Kshs 9.7bn in H1’2023;
Real Estate
During the week, in the retail sector, Naivas Supermarket, a Kenyan retail chain, opened its 105th outlet situated at the Nyali Bazaar Mall along Links Road, Mombasa County. The new retail store is the the 6th branch opened by Naivas in 2024 and 12th outlet in the region;
In the infrastructure sector, President Willian Ruto launched upgrading of link roads in Suna East Constituency in Migori county during his Nyanza area tour. Additionally, the President launched construction of Rusinga Ring Road in Homa Bay County. The Road will ease the transportation pressures in the area, promote business in the area and contribute to economic growth by providing improved accessibility and basic services which will attract investments and create jobs to the locals;
On the Unquoted Securities Platform, Acorn D-REIT and I-REIT traded at Kshs 25.4 and Kshs 22.2 per unit, respectively, as per the last updated data on 30th August 2024. The performance represented a 27.0% and 11.0% gain for the D-REIT and I-REIT, respectively, from the Kshs 20.0 inception price. Additionally, ILAM Fahari I-REIT traded at Kshs 11.0 per share as of 30th August, 2024, representing a 45.0% loss from the Kshs 20.0 inception price;
Investment Updates:
- Weekly Rates:
- Cytonn Money Market Fund closed the week at a yield of 18.26% p.a. To invest, dial *809# or download the Cytonn App from Google Play store here or from the Appstore here;
- We continue to offer Wealth Management Training every Monday, from 10:00 am to 12:00 pm. The training aims to grow financial literacy among the general public. To register for any of our Wealth Management Trainings, click here;
- If interested in our Private Wealth Management Training for your employees or investment group, please get in touch with us through wmt@cytonn.com;
- Cytonn Insurance Agency acts as an intermediary for those looking to secure their assets and loved ones’ future through insurance namely; Motor, Medical, Life, Property, WIBA, Credit and Fire and Burglary insurance covers. For assistance, get in touch with us through insuranceagency@cytonn.com;
- Cytonn Asset Managers Limited (CAML) continues to offer pension products to meet the needs of both individual clients who want to save for their retirement during their working years and Institutional clients that want to contribute on behalf of their employees to help them build their retirement pot. To more about our pension schemes, kindly get in touch with us through pensions@cytonn.com;
Hospitality Updates:
- We currently have promotions for Staycations. Visit cysuites.com/offers for details or email us at sales@cysuites.com;
Money Markets, T-Bills Primary Auction:
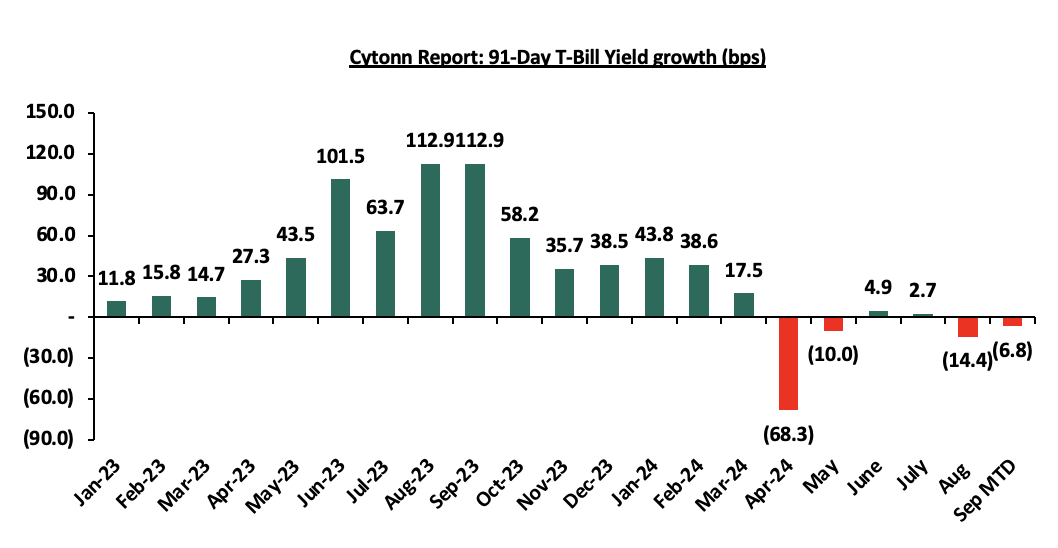
During the month of August 2024, T-bills were oversubscribed, with the overall average oversubscription rate coming in at 113.1%, higher than the oversubscription rate of 102.6% recorded in July 2024. The overall average subscription rate for the 91-day paper decreased to 286.5% from 352.2%, while the overall average subscription rates for the 182-day and 364-day paper increased to 111.5% and 45.5% respectively, from 64.8% and 40.6% respectively, which was recorded in July 2024. The average yields on the government papers recorded mixed performance during the month, with the 91-day and 182-day papers yields decreasing by 14.4 bps and 8.1 bps to 15.9% and 16.7% respectively from 16.0% and 16.8% recorded the previous month, while the yields on the 364-day paper increased marginally by 2.7 bps to remain relatively unchanged at 16.9% recorded the previous month. For the month of August, the government accepted a total of Kshs 100.1 bn of the Kshs 108.6 bn worth of bids received, translating to an acceptance rate of 92.1% compared to an acceptance rate of 86.0% in the month of July. The chart below shows the yield growth rate for the 91-day paper during the year:
This week, T-bills were oversubscribed, with the overall oversubscription rate coming in at 100.8%, a reversal from the undersubscription rate of 79.9% recorded the previous week. Investors’ preference for the shorter 91-day paper persisted, with the paper receiving bids worth Kshs 17.5 bn against the offered Kshs 4.0 bn, translating to an oversubscription rate of 437.4%, significantly higher than the oversubscription rate of 197.8% recorded the previous week. The subscription rates for the 182-day and 364-day papers decreased to 44.5% and 22.5% respectively from the 57.6% and 55.0% respectively recorded the previous week. The government accepted a total of Kshs 23.6 bn worth of bids out of Kshs 24.2 bn bids received, translating to an acceptance rate of 97.7%. The yields on the government papers were on a downward trajectory, with the yields on the 364-day, 182-day, and 91-day papers decreasing by 1.7 bps, 3.6 bps, and 1.0 bps to 16.84%, 16.63%, and 15.78% respectively from 16.86%, 16.67%, and 15.79% respectively recorded the previous week.
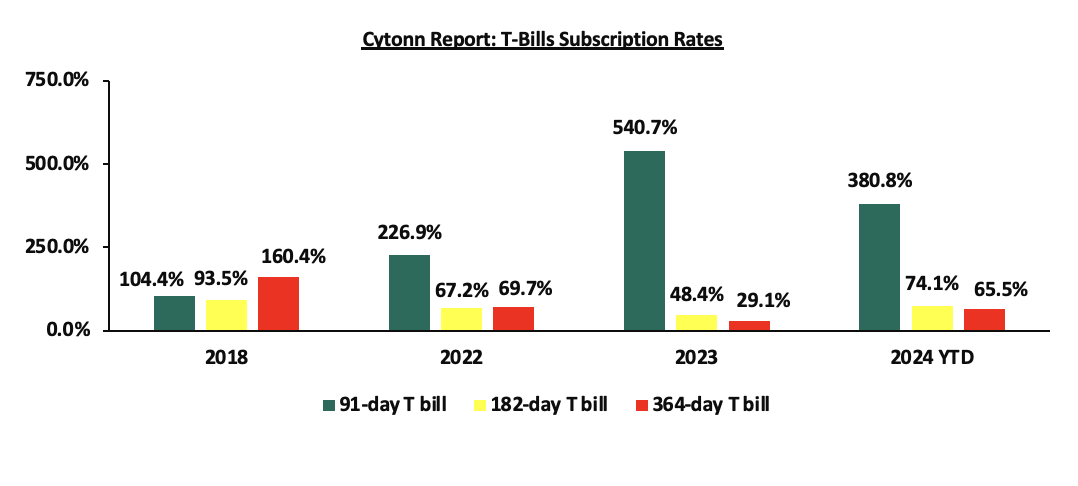
So far in the current FY’2024/25, government securities totalling Kshs 355.0 bn have been advertised. The government has accepted bids worth Kshs 360.6 bn, of which Kshs 229.6 bn and Kshs 131.0 bn were treasury bills and bonds, respectively. Total redemptions so far in FY’2024/25 equal to Kshs 181.0 bn, with treasury bills accounting for Kshs 181.0 bn. As a result, the government has a domestic borrowing surplus of Kshs 179.6 bn in FY’2024/25.
The chart below compares the overall average T-bill subscription rates obtained in 2018, 2022, 2023, and 2024 Year to Date (YTD):
Additionally, August 2024 bonds were oversubscribed, with the overall oversubscription rate coming in at 252.6%, higher than the undersubscription rate of 25.7% recorded in July 2024. The reopened bonds IFB1/2023/017 and 1FB1/2023/6.5, with fixed coupon rates of 14.4% and 17.9% respectively, received bids worth Kshs 126.3 bn against the offered Kshs 50.0 bn translating to an oversubscription rate of 252.6%, with the government accepting bids worth Kshs 88.7 bn, translating to an acceptance rate of 70.2%, with the average accepted yields coming at 17.7% and 18.3% respectively. The table below provides more details on the bonds issued in June, July and August 2024:
|
Cytonn Report: Bond Issuances in June, July and August 2024 |
||||||||||
|
Issue Date |
Bond Auctioned |
Effective Tenor to Maturity (Years) |
Coupon |
Amount offered (Kshs bn) |
Actual Amount Raised (Kshs bn) |
Total bids received |
Average Accepted Yield |
Subscription Rate |
Acceptance Rate |
|
|
10/06/2024
|
FXD1/2023/002 - Re-opened |
1.2 |
17.0% |
30.0 |
7.1 |
8.4 |
17.1% |
28.2% |
83.8% |
|
|
FXD1/2024/003 – Re-opened |
2.6 |
18.4% |
23.8 |
24.8 |
17.6% |
82.7% |
96.0% |
|||
|
17/06/2024
|
FXD1/2023/010 – Re-opened |
8.7 |
14.2% |
30.0 |
7.6 |
9.6 |
16.4% |
32.1% |
78.9% |
|
|
FXD1/2023/005 – Re-opened |
4.1 |
16.8% |
22.6 |
31.9 |
18.2% |
106.5% |
70.7% |
|||
|
24/06/2024
|
FXD1/2023/010 – Tapsale |
8.7 |
14.2% |
20.0 |
7.9 |
8.8 |
16.4% |
44.2% |
89.8% |
|
|
FXD1/2023/005 – Tapsale |
4.1 |
16.8% |
10.8 |
11.2 |
18.2% |
56.1% |
96.3% |
|||
|
FXD1/2024/003 – Tapsale |
2.6 |
18.4% |
3.3 |
3.3 |
17.6% |
16.3% |
101.6% |
|||
|
FXD1/2023/002 – Tapsale |
1.2 |
17.0% |
1.8 |
1.8 |
17.1% |
9.0% |
99.8% |
|||
|
08/07/2024 |
FXD1/2023/002 -Tapsale |
1.2 |
17.0% |
20.0 |
0.5 |
0.5 |
17.1% |
2.4% |
99.8% |
|
|
22/07/2024 |
FXD1/2024/010 – Re-opened |
9.7 |
16.0% |
30.0 |
9.8 |
14.7 |
16.6% |
48.9% |
66.5% |
|
|
FXD1/2008/020 – Re-opened |
3.9 |
13.8% |
18.3% |
|||||||
|
19/08/2024 |
IFB1/2023.6.5 |
5.8 |
17.9% |
50.0 |
88.7 |
126.3 |
18.3% |
252.6% |
70.2% |
|
|
IFB1/2023/17 |
15.7 |
14.4% |
17.7% |
|||||||
|
August 2024 Average |
10.8 |
16.2% |
50.0 |
88.7 |
126.3 |
18.0% |
252.6% |
70.2% |
||
|
July 2024 Average |
4.9 |
15.6% |
25.0 |
5.1 |
7.6 |
17.3% |
25.7% |
83.2% |
||
|
2023 Average |
6.1 |
14.8% |
740.3 |
735.2 |
872.4 |
15.5% |
117.8% |
82.0% |
||
Source: Central Bank of Kenya (CBK)
Also, during the week, the IFB1/2023/17 bond was oversubscribed with the overall subscription rate coming in at 234.6%, receiving bids worth Kshs 35.2 bn against the offered Kshs 15.0 bn. The government accepted bids worth Kshs 32.0 bn, translating to an acceptance rate of 91.0%. The weighted average yield of accepted bids came in at 17.7%, equal to the rate recorded when the bond was re-opened on 12th August 2024, while the coupon rate for the bond was fixed at 14.4%. Additionally, the tax effected rate for the IFB1/2023/017 is 19.7%.
Secondary Bond Market:
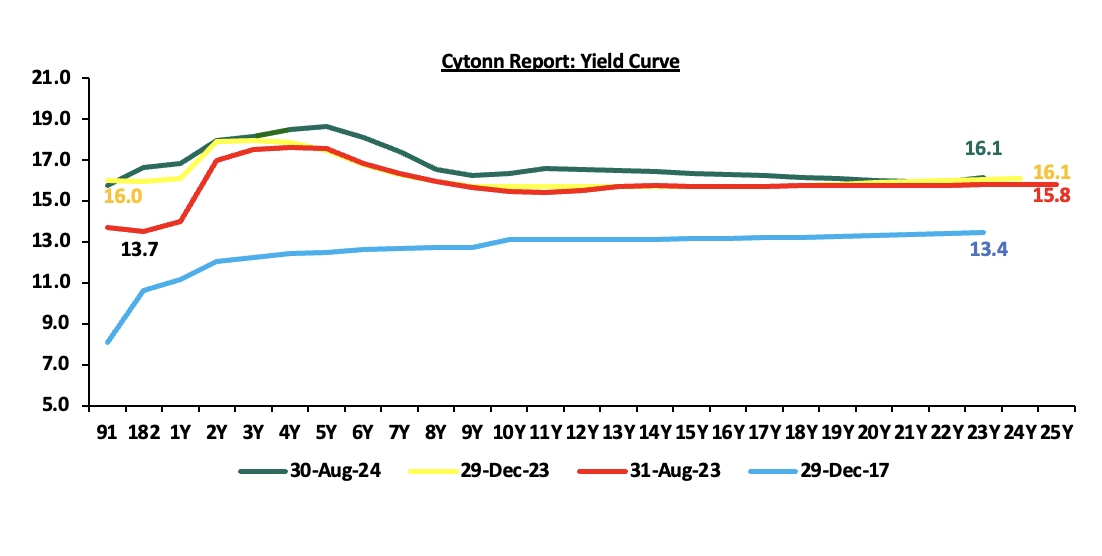
The yields on the government securities were on an upward trajectory during the month compared to the same period in 2023. We observe a humped yield curve for the medium-term bonds in the 2 to 5-year maturity range, an indication of the prevailing uncertainty in the market regarding both medium-term interest rates and inflation. Investors, apprehensive about the economic outlook in the near to medium term, are demanding higher yields for bonds in the 2 to 5-year maturity range to compensate for the perceived risks as they anticipate potential fluctuations in economic conditions in the Kenyan market on the back of the government’s debt sustainability concerns. The chart below shows the yield curve movement during the period:
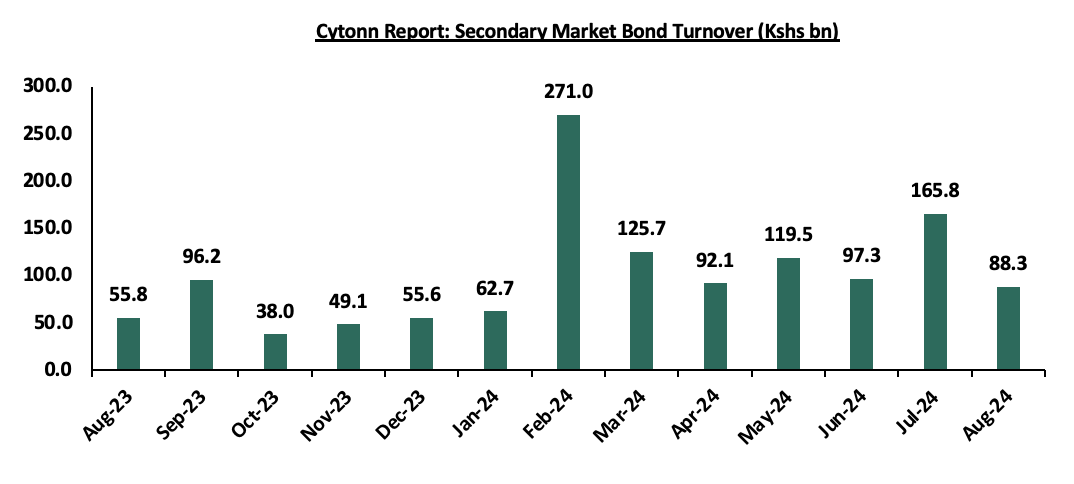
The secondary bond turnover decreased by 46.7% to Kshs 88.3 bn, from Kshs 165.8 bn recorded in July 2024, pointing towards decreased activities by commercial banks in the secondary bonds market for the month of August. However, on a year-on-year basis, the bond turnover increased by 58.2% from Kshs 55.8 bn worth of treasury bonds transacted over a similar period last year. The chart below shows the bond turnover over the past 12 months;
Money Market Performance:
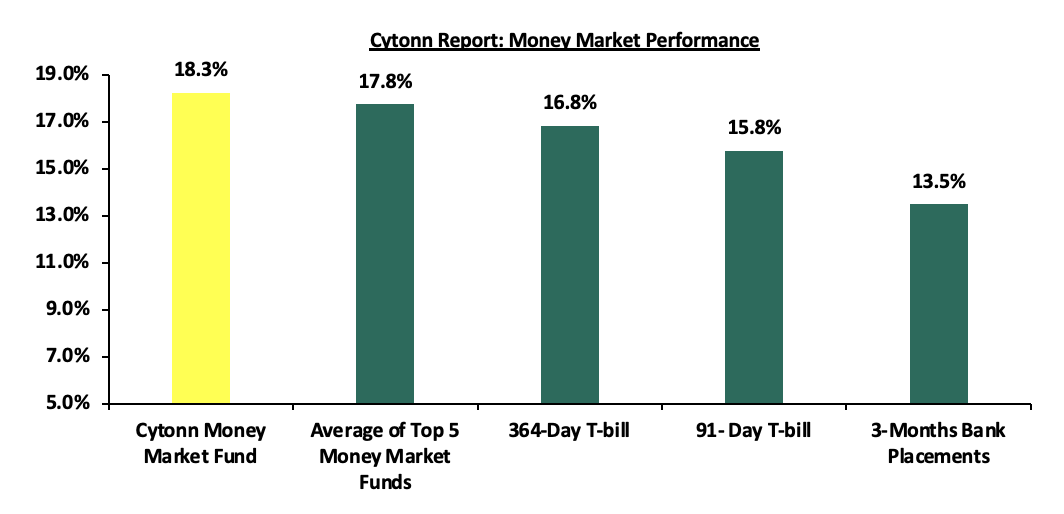
In the money markets, 3-month bank placements ended the week at 13.5% (based on what we have been offered by various banks), while the yield on the 364-day and 91-day papers decreased marginally by 1.7 bps and 1.0 bps to remain relatively unchanged at 16.9% and 15.8% respectively, recorded the previous week. The yield of Cytonn Money Market Fund remained unchanged to close the week at 18.3% recorded the previous week, and the average yields on the Top 5 Money Market Funds decreased by 11.6 bps to 17.8% from 17.9% recorded the previous week.
The table below shows the Money Market Fund Yields for Kenyan Fund Managers as published on 30th August 2024:
|
Cytonn Report: Money Market Fund Yield for Fund Managers as published on 30th August 2024 |
||
|
Rank |
Fund Manager |
Effective Annual |
|
1 |
Cytonn Money Market Fund (Dial *809# or download the Cytonn app) |
18.3% |
|
2 |
Lofty-Corban Money Market Fund |
18.2% |
|
3 |
Etica Money Market Fund |
17.9% |
|
4 |
Kuza Money Market fund |
17.3% |
|
5 |
Arvocap Money Market Fund |
17.0% |
|
6 |
GenAfrica Money Market Fund |
16.8% |
|
7 |
Nabo Africa Money Market Fund |
16.4% |
|
8 |
Jubilee Money Market Fund |
16.3% |
|
9 |
Enwealth Money Market Fund |
16.0% |
|
10 |
KCB Money Market Fund |
16.0% |
|
11 |
GenCap Hela Imara Money Market Fund |
16.0% |
|
12 |
Sanlam Money Market Fund |
15.7% |
|
13 |
Co-op Money Market Fund |
15.6% |
|
14 |
Absa Shilling Money Market Fund |
15.5% |
|
15 |
Madison Money Market Fund |
15.4% |
|
16 |
Mayfair Money Market Fund |
15.3% |
|
17 |
Mali Money Market Fund |
15.2% |
|
18 |
Apollo Money Market Fund |
15.2% |
|
19 |
Orient Kasha Money Market Fund |
15.2% |
|
20 |
AA Kenya Shillings Fund |
15.0% |
|
21 |
Dry Associates Money Market Fund |
14.2% |
|
22 |
ICEA Lion Money Market Fund |
13.9% |
|
23 |
CIC Money Market Fund |
13.7% |
|
24 |
Old Mutual Money Market Fund |
13.6% |
|
25 |
British-American Money Market Fund |
13.2% |
Source: Business Daily
Liquidity:
Liquidity in the money markets eased in the month of August 2024, with the average interbank rate decreasing by 20.9 bps to 13.0% from 13.2% recorded the previous month. Similarly, during the month of August, the average interbank volumes traded decreased by 19.9% to Kshs 22.9 bn, from Kshs 28.6 bn recorded in July.
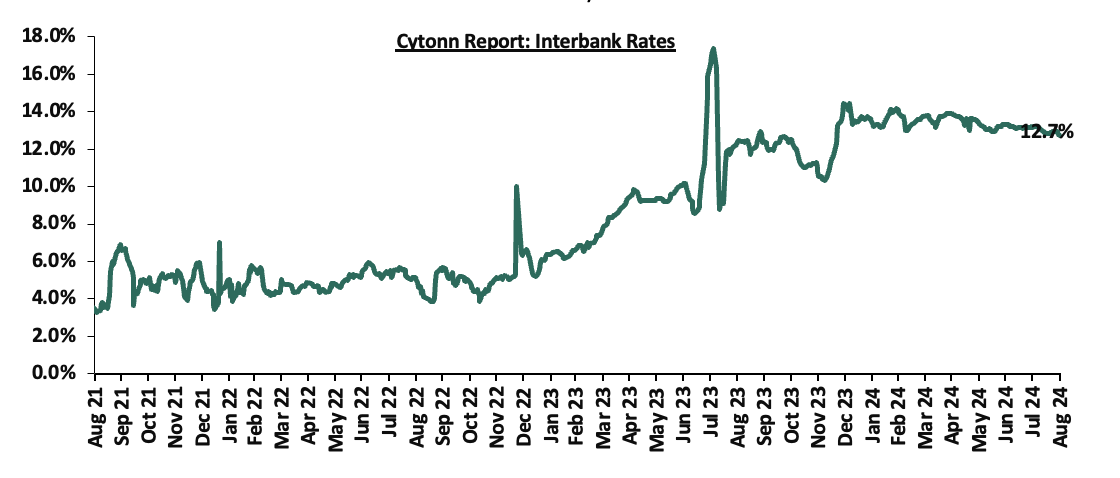
Also, during the week, liquidity in the money markets eased, with the average interbank rate decreasing by 4.1 bps to remain relatively unchanged from 12.9% recorded the previous week, partly attributable to government payments that offset tax remittances. The average interbank volumes traded increased marginally by 0.4% to remain relatively unchanged at Kshs 14.6 bn recorded the previous week. The chart below shows the interbank rates in the market over the years:
Kenya Eurobonds:
During the month, the yields on the Eurobonds were on a downward trajectory, with the yield on the 7-year Eurobond issued in 2019 decreasing the most by 60.2 bps to 9.9% from 10.6%, recorded at the end of July 2024. Also, during the week, the yields on Eurobonds were on a downward trajectory, with the yields on the 7-year Eurobond issued in 2019 decreasing the most by 22.2 bps to 9.9% from 10.2% recorded the previous week. The table below shows the summary of the performance of the Kenyan Eurobonds as of 29th August 2024;
|
Cytonn Report: Kenya Eurobonds Performance |
||||||
|
2018 |
2019 |
2021 |
2024 |
|||
|
Tenor |
10-year issue |
30-year issue |
7-year issue |
12-year issue |
13-year issue |
7-year issue |
|
Amount Issued (USD) |
1.0 bn |
1.0 bn |
0.9 bn |
1.2 bn |
1.0 bn |
1.5 bn |
|
Years to Maturity |
3.6 |
23.6 |
2.8 |
7.8 |
9.9 |
6.5 |
|
Yields at Issue |
7.3% |
8.3% |
7.0% |
7.9% |
6.2% |
10.4% |
|
01-Jan-24 |
9.8% |
10.2% |
10.1% |
9.9% |
9.5% |
|
|
31-Jul-24 |
10.6% |
11.0% |
10.6% |
10.9% |
10.8% |
11.0% |
|
22-Aug-24 |
10.4% |
10.9% |
10.2% |
10.6% |
10.6% |
10.7% |
|
23-Aug-24 |
10.3% |
10.9% |
10.0% |
10.6% |
10.5% |
10.7% |
|
26-Aug-24 |
10.4% |
10.9% |
10.1% |
10.6% |
10.5% |
10.7% |
|
27-Aug-24 |
10.3% |
10.8% |
10.0% |
10.5% |
10.5% |
10.6% |
|
28-Aug-24 |
10.2% |
10.8% |
9.9% |
10.5% |
10.4% |
10.6% |
|
29-Aug-24 |
10.3% |
10.8% |
9.9% |
10.4% |
10.4% |
10.6% |
|
Weekly Change |
(0.2%) |
(0.1%) |
(0.2%) |
(0.2%) |
(0.2%) |
(0.2%) |
|
MTM Change |
(0.3%) |
(0.3%) |
(0.6%) |
(0.5%) |
(0.5%) |
(0.4%) |
|
YTD Change |
0.4% |
0.6% |
(0.2%) |
0.5% |
0.9% |
- |
Source: Central Bank of Kenya (CBK) and National Treasury
Kenya Shilling:
During the month, the Kenya Shilling appreciated by 0.6% against the US Dollar, to close the month at Kshs 129.2, from Kshs 129.9 recorded at the end of July 2024. Also, during the week, the Kenya Shilling depreciated by 0.1% against the US Dollar to close at Kshs 129.2 from the Kshs 129.1 recorded the previous week. On a year-to-date basis, the shilling has appreciated by 17.7% against the US Dollar, a sharp contrast to the 26.8% depreciation recorded in 2023.
We expect the shilling to be supported by:
- Diaspora remittances standing at a cumulative USD 4,571.7 mn in the 12 months to July 2024, 12.2% higher than the USD 4,075.7 mn recorded over the same period in 2023, which has continued to cushion the shilling against further depreciation. In the July 2024 diaspora remittances figures, the North America remained the largest source of remittances to Kenya accounting for 54.9% in the period, and,
- The tourism inflow receipts which came in at USD 352.5 bn in 2023, a 31.5% increase from USD 268.1 bn inflow receipts recorded in 2022, and owing to tourist arrivals that improved by 27.2% in the 12 months to June 2024, from the arrivals recorded during a similar period in 2023.
The shilling is however expected to remain under pressure in 2024 as a result of:
- An ever-present current account deficit which came at 3.2% of GDP in Q1’2024 from 3.0% recorded in Q1’2023,
- The need for government debt servicing, continues to put pressure on forex reserves given that 67.9% of Kenya’s external debt is US Dollar-denominated as of March 2024, and,
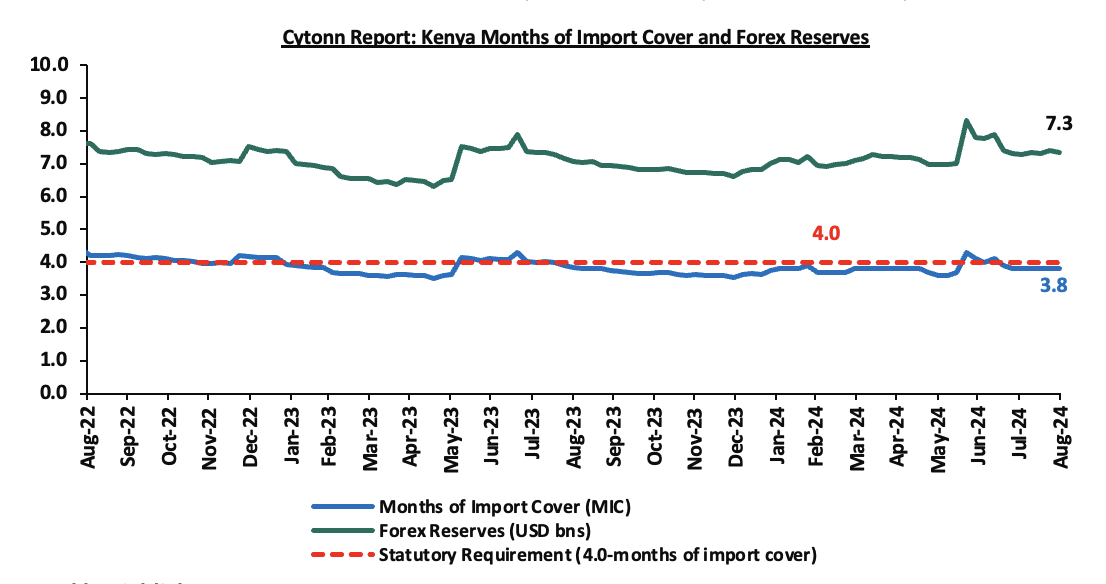
- Dwindling forex reserves currently at USD 7.3 bn (equivalent to 3.8-months of import cover), which is below the statutory requirement of maintaining at least 4.0-months of import cover, and also lower than the EAC region’s convergence criteria of 4.5-months of import cover.
Key to note, during the month of August 2024, Kenya’s forex reserves increased marginally by 0.5% to remain relatively unchanged at USD 7.3 bn, and the months of import cover remained at 3.8 months, recorded at the end of July 2024. Also, Kenya’s forex reserves decreased by 0.7% during the week to USD 7.3 bn from USD 7.4 recorded the previous week, equivalent to 3.8 months of import cover, unchanged from the previous week, and remained below the statutory requirement of maintaining at least 4.0-months of import cover.
The chart below summarizes the evolution of Kenya's months of import cover over the years:
Weekly Highlights:
- August 2024 Inflation Highlight
The y/y inflation in August 2024 increased by 0.1% points to 4.4%, from the 4.3% recorded in July 2024. This was in line with our expectation of an increase, as it came within our projected range of 4.4% to 4.7%. Our decision was mainly driven by the reduction in the Central Bank Rate (CBR) by 25.0 bps to 12.75% from 13.00% on 6th August 2024, which would increase the money supply and lower borrowing costs, hence causing a slight rise in inflation rates. The headline inflation in August 2024 was majorly driven by increase in prices of commodities in the following categories; Food & Non-Alcoholic Beverages, Housing, Water, Electricity, Gas & other fuels, and Transport by 5.3%, 4.2%, and 3.9% respectively. The table below shows a summary of both the year-on-year and month-on-month commodity indices performance:
|
Cytonn Report: Major Inflation Changes – August 2024 |
|||
|
Broad Commodity Group |
Price change m/m (August-2024/July -2024) |
Price change y/y (August-2024/August-2023) |
Reason |
|
Food and non-alcoholic beverages |
(0.7%) |
5.3% |
The m/m decrease was mainly driven by the decrease in prices of commodities such as tomatoes, spinach, and onion-leeks by 12.0%, 6.7% and 5.6% respectively. However, the decrease was weighed down by increase in prices of potatoes (Irish), oranges and mangoes by 7.1%, 3.2%, and 2.6%, respectively |
|
Transport |
0.3% |
4.2% |
The m/m increase recorded in the transport Index was mainly on the back of a 25.0% increase in bus fares while the prices of diesel and petrol remained unchanged from their July 2024 prices of Kshs 171.6 and Kshs 188.8 per litre respectively. |
|
Housing, water, electricity, gas and other fuels |
0.3% |
3.9% |
The m/m performance was mainly driven by the increase in prices of Electricity of 200kWh and 50kWh by 1.6% and 1.8% respectively. |
|
Overall Inflation |
0.1% |
4.4% |
The m/m increase was mainly attributable to the 0.3% increase in Transport. |
Notably, August’s overall headline inflation was on the rise for the first time in two months. Furthermore, it has remained within the Central Bank of Kenya (CBK) target range of 2.5% to 7.5% for the fourteenth consecutive month. The increase in headline inflation in August 2024 comes amid the maximum allowed price for Super Petrol, Diesel and Kerosene remaining unchanged from the prices announced for the previous period. Consequently, Super Petrol, Diesel and Kerosene will continue to retail at Kshs 188.8, Kshs 171.6 and Kshs 161.8 per litre respectively. The chart below shows the inflation rates for the past 5 years:
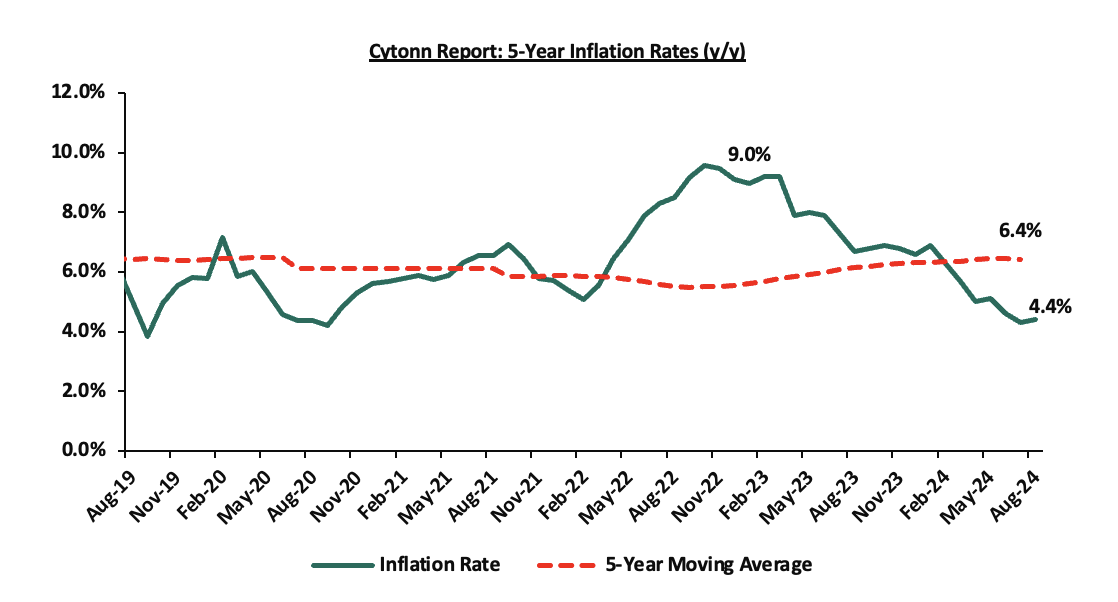
Going forward, we expect inflation to remain within the CBK’s preferred range of 2.5%-7.5%, mainly on the back of a strengthened currency, tight monetary policy and reducing fuel prices. The risk, however, lies in the fuel prices which despite their decline over the last months, still remain elevated compared to historical levels. Key to note is that the Monetary Policy Committee cut the Central Bank Rate by 25 bps to 12.75% from 13.0% in its August 2024 meeting, with the aim of easing the monetary policy and maintaining exchange rate stability, and will meet again on October 2024. In our view, the rate will be pegged on whether the shilling will sustain its appreciation against the dollar, resulting in a decline in the import bill and costs passed to consumers through hiked consumer prices. Additionally, favourable weather conditions may also contribute to stabilizing food prices, further supporting lower inflation rates.
Monthly Highlights:
- During the month, a global ratings agency, Fitch Ratings announced its revision of Kenya’s credit score, downgrading it to B- from a credit rating of B while also revising the outlook to stable, from a negative outlook affirmed on 16th February 2024. Their decision comes on the back of the government's decision to forgo proposed tax increases through the Finance Bill 2024 and rely on expenditure cuts, significantly impacting Kenya's fiscal trajectory and financing needs. The downgrade follows Moody’s downgrading Kenya’s IDR to Caa1 from a credit rating of B3 while maintaining a negative outlook on July 8th Please see our Cytonn Weekly 32/2024,
- During the month, Stanbic Bank released its monthly Purchasing Managers Index (PMI) highlighting that the index for the month of July 2024 sharply deteriorated, coming in at 43.1, below the 50.0 neutral for the second consecutive month, down from 47.2 in June 2024, signaling a deterioration in the operating conditions across Kenya. Please see our Cytonn Weekly 32/2024,
- During the month, the Monetary Policy Committee (MPC) met to review the outcome of its previous policy decisions against a backdrop of an improved global outlook for growth, easing in inflation in advanced economies as well as heightened geopolitical tensions. The MPC decided to lower the CBR rate by 25.0 bps to 12.75%, from 13.00% which was in line with our expectation for the MPC to lower the CBR rate. Please see our Cytonn Weekly 32/2024,
- During the month, The Energy and Petroleum Regulatory Authority (EPRA) released their monthly statement on the maximum retail fuel prices in Kenya, effective from 15th August 2024 to 14th September 2024. Notably, the maximum allowed price for Super Petrol, Diesel and Kerosene remained unchanged from the prices announced for the previous period. Consequently, Super Petrol, Diesel, and Kerosene will continue to retail at Kshs 188.8, Kshs 171.6, and Kshs 161.8 per litre respectively. Please see our Cytonn Weekly 33/2024,
- Additionally, during the month, the National Treasury gazetted the revenue and net expenditures for the first month of FY’2024/2025, ending 31st July 2024, highlighting that the total revenue collected as at the end of July 2024 amounted to Kshs 174.4 bn, equivalent to 6.6% of the revised estimates of Kshs 2,631.4 bn for FY’2024/2025 and is 79.5% of the prorated estimates of Kshs 219.3 bn. Please see our Cytonn Weekly 33/2024,
- Also, during the month, S&P Global Ratings announced its revision of Kenya’s long-term sovereign credit rating, downgrading it to B-, and a stable outlook from a credit rating of B and a negative outlook, on the back of the government's decision to forgo proposed tax increases through the Finance Bill 2024 and rely on expenditure cuts, significantly impacting Kenya's fiscal trajectory and financing needs. Please see our Cytonn Weekly 34/2024.
Rates in the Fixed Income market have been on an upward trend given the continued high demand for cash by the government and the occasional liquidity tightness in the money market. The government is 154.4% ahead of its prorated net domestic borrowing target of Kshs 70.7 bn, having a net borrowing position of Kshs 179.6 bn. However, we expect a downward readjustment of the yield curve in the short and medium term, with the government looking to increase its external borrowing to maintain the fiscal surplus, hence alleviating pressure in the domestic market. As such, we expect the yield curve to normalize in the medium to long-term and hence investors are expected to shift towards the long-term papers to lock in the high returns.
Market Performance:
During the month of August 2024, the equities market recorded mixed performances, with NSE 20 and NSE 25 gaining by 0.5% and 0.2% respectively, while NASI and NSE 10 declined by 1.9% and 0.5% respectively. The equities market performance was driven by losses recorded by large-cap stocks such as Safaricom, EABL, and DTB-K Group of 8.8%, 4.0%, and 2.3% respectively. The losses were, however, mitigated by gains recorded by large-cap stocks such as Bamburi, NCBA, and Standard Chartered Bank of 25.0%, 7.6%, and 7.4% respectively.
During the week, the equities market recorded mixed performances, with NSE 10 gaining by 1.1%, while NSE 20, NASI and NSE 25 declined by 1.2%, 1.2% and 0.4% respectively., taking the YTD performance to gains of 19.4%, 17.8%, 12.7%, and 11.2% for NSE 10, NSE 25, NASI, and NSE 20 respectively. The equities market performance was driven by losses recorded by large-cap stocks such as Standard Chartered Bank, Safaricom and Stanbic bank of 3.3%, 3.3%, and 2.8% respectively. The performance was, however, supported by gains recorded by large-cap stocks such as Bamburi, EABL and Co-op Bank of 21.1%, 5.9%, and 3.0% respectively.
Equities turnover increased by 13.1% in the month of August 2024 to USD 50.9 mn, from USD 45.0 mn recorded in July 2024. Foreign investors remained net sellers, with a net selling position of USD 0.02 mn, from a net selling position of USD 4.8 mn recorded in July 2024.
During the week, equities turnover increased significantly by 98.4% to USD 18.4 mn from USD 9.3 mn recorded the previous week, taking the YTD total turnover to USD 444.2 mn. Foreign investors remained net sellers with a net selling position of USD 2.4 mn, from a net selling position of USD 0.2 mn recorded the previous week, taking the YTD foreign net buying position to USD 1.8 mn.
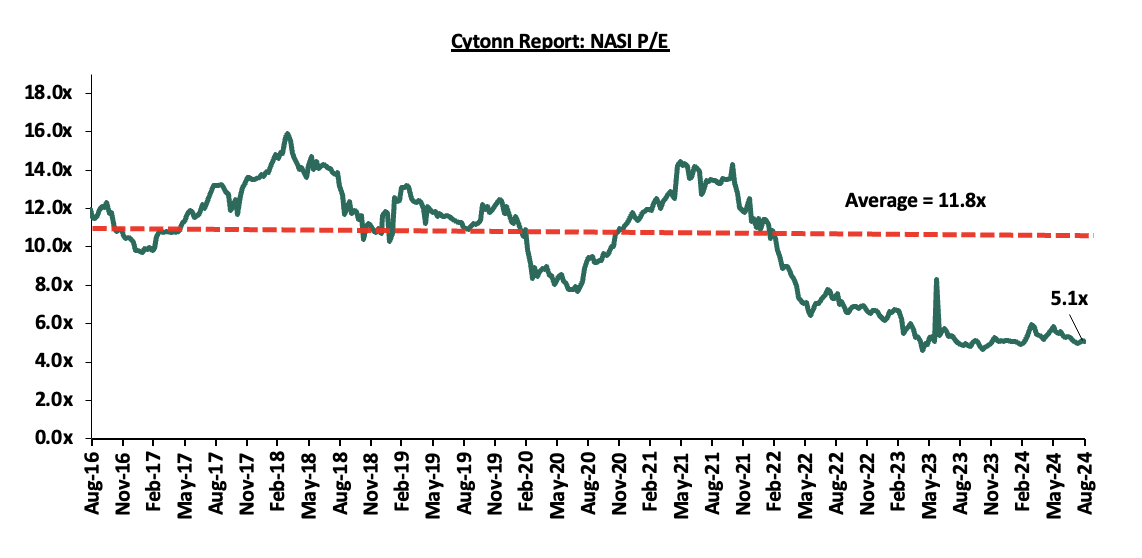
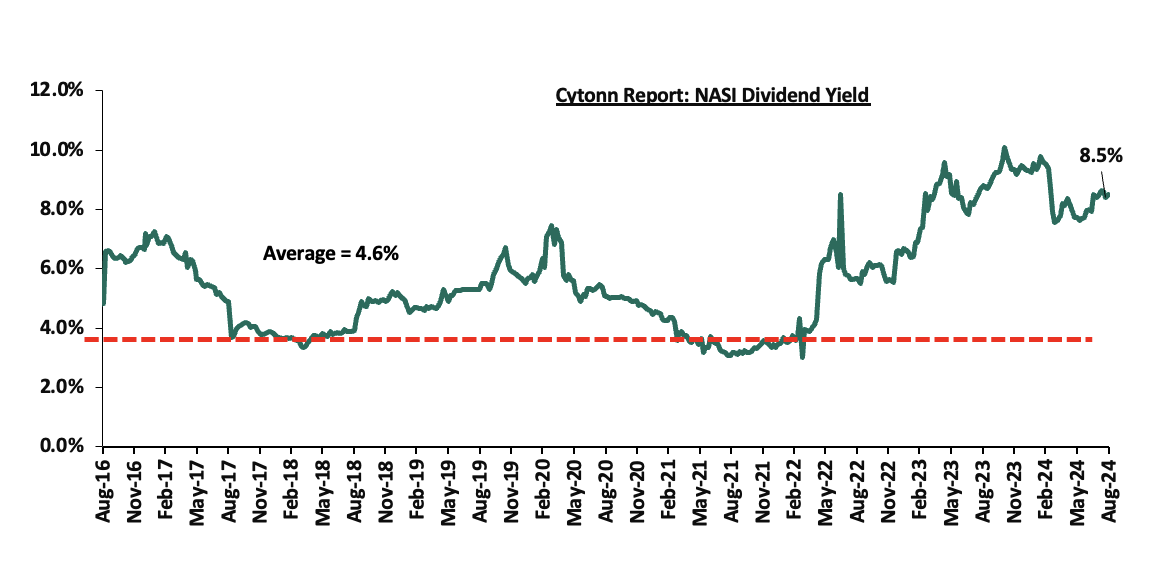
The market is currently trading at a price-to-earnings ratio (P/E) of 5.1x, 57.2% below the historical average of 11.8x. The dividend yield stands at 8.5%, 3.9% points above the historical average of 4.6%. Key to note, NASI’s PEG ratio currently stands at 0.6x, an indication that the market is undervalued relative to its future growth. A PEG ratio greater than 1.0x indicates the market is overvalued while a PEG ratio less than 1.0x indicates that the market is undervalued. The charts below indicate the historical P/E and dividend yields of the market;
Universe of Coverage:
|
Cytonn Report: Equities Universe of Coverage |
||||||||||
|
Company |
Price as at 23/08/2024 |
Price as at 30/08/2024 |
w/w change |
YTD Change |
Year Open 2024 |
Target Price* |
Dividend Yield |
Upside/ Downside** |
P/TBv Multiple |
Recommendation |
|
Jubilee Holdings |
153.0 |
150.3 |
(1.8%) |
(18.8%) |
185.0 |
260.7 |
9.5% |
83.0% |
0.2x |
Buy |
|
Equity Group*** |
40.5 |
41.1 |
1.4% |
20.0% |
34.2 |
60.2 |
9.7% |
56.4% |
0.8x |
Buy |
|
Diamond Trust Bank*** |
45.5 |
45.3 |
(0.5%) |
1.1% |
44.8 |
65.2 |
11.0% |
55.1% |
0.2x |
Buy |
|
KCB Group*** |
32.0 |
31.8 |
(0.6%) |
44.6% |
22.0 |
46.7 |
0.0% |
46.9% |
0.5x |
Buy |
|
CIC Group |
2.1 |
2.0 |
(4.3%) |
(12.2%) |
2.3 |
2.8 |
6.5% |
45.8% |
0.6x |
Buy |
|
NCBA*** |
42.0 |
43.1 |
2.5% |
10.8% |
38.9 |
55.2 |
11.0% |
39.3% |
0.8x |
Buy |
|
Co-op Bank*** |
13.2 |
13.6 |
3.0% |
19.4% |
11.4 |
17.2 |
11.1% |
38.0% |
0.6x |
Buy |
|
Britam |
5.5 |
5.5 |
0.0% |
7.4% |
5.1 |
7.5 |
0.0% |
35.9% |
0.8x |
Buy |
|
Stanbic Holdings |
123.3 |
119.8 |
(2.8%) |
13.0% |
106.0 |
145.3 |
12.8% |
34.2% |
0.8x |
Buy |
|
ABSA Bank*** |
14.2 |
14.3 |
0.7% |
23.8% |
11.6 |
17.3 |
10.8% |
31.8% |
1.1x |
Buy |
|
I&M Group*** |
27.8 |
22.1 |
(20.7%) |
26.4% |
17.5 |
26.5 |
11.6% |
31.7% |
0.5x |
Buy |
|
Target Price as per Cytonn Analyst estimates **Upside/ (Downside) is adjusted for Dividend Yield ***For Disclosure, these are stocks in which Cytonn and/or its affiliates are invested in |
||||||||||
Monthly Highlights
- During the month, I&M Group Holdings released their H1’2024 financial results, recording a 21.1% increase in Profit After Tax (PAT) to Kshs 6.1 bn, from Kshs 5.0 bn in H1’2023. The performance was mainly driven by a 35.2% increase in Net Interest Income to Kshs 16.5 bn, from Kshs 12.2 bn in H1’2023, but was weighed down by a 10.9% decrease in Non-Interest Income to Kshs 6.2 bn from Kshs 6.9 bn recorded over a similar period in 2023, taking the Total Operating Income to Kshs 22.7 bn, from Kshs 19.1 bn in H1’2023. For more information, please see our Cytonn Weekly #34/2024
- Standard Chartered Bank of Kenya released H1’2024 financial results, noting a 48.9% increase in Profit After Tax (PAT) to Kshs 10.3 bn, from Kshs 6.9 bn in H1’2023. The performance was mainly driven by a 24.9% increase in Total Operating Income to Kshs 26.1 bn, from Kshs 20.9 bn in H1’2023, attributable to the 36.1% increase in Net Non-Interest Income to Kshs 9.6 bn from Kshs 7.0 bn recorded in H1’2023. For more information, please see our Cytonn Weekly #34/2024
- NCBA Bank released their H1’2024 Financial results, recording a 5.0% in Profit After Tax (PAT) to Kshs 9.8 bn, from Kshs 9.3 bn recorded in H1’2023. The performance was mainly driven by a 7.9% increase in Net non-Interest Income to Kshs 14.9 bn in H1’2024, from Kshs 13.8 bn recorded in H1’2023, but was weighed down by a 4.4% decrease in Net Interest Income to Kshs 16.5 bn from Kshs 17.2 bn recorded in H1’2023. For more information, please see our Cytonn Weekly #34/2024
- KCB Group announced their H1’2024 financial results, recording an 86.4% increase in Profit After Tax (PAT) to Kshs 29.9 bn, from Kshs 16.1 bn in H1’2023. The performance was mainly driven by a 34.8% increase in net interest income to Kshs 61.3 bn in H1’2024, from Kshs 45.5 bn in H1’2023, coupled with a 20.8% increase in net non-interest income to Kshs 33.3 bn from Kshs 27.6 bn in H1’2023. For more information, please see our Cytonn Weekly #34/2024
- HF Group released their H1’2024 financial results, recording a 46.3% increase in Profit After Tax (PAT) to Kshs 0.3 bn, from Kshs 0.2 bn recorded in H1’2023. The performance was mainly driven by a 12.5% increase in Total Operating income to Kshs 2.0 bn in H1’2024, from Kshs 1.8 bn in H1’2023 which outpaced the 8.9% increase in Total Operating expenses to Kshs 1.8 bn, from Kshs 1.6 bn in H1’2023. For more information, please see our Cytonn Weekly #34/2024
- Liberty Kenya Holdings released their H1’2024 results, having fully implemented the new IFRS 17 reporting system. Liberty Kenya Holdings’ Profit After Tax (PAT) increased by 196.7% to Kshs 0.6 bn, from Kshs 0.2 bn recorded in H1’2023, mainly driven by an 851.9% increase in Net insurance income to Kshs 0.5 bn, from Kshs 0.1 bn in H1’2023, and further supported by a 39.2% increase in Net investment income to Kshs 1.0 bn, from Kshs 0.7 bn in H1’2023. For more information, please see our Cytonn Weekly #34/2024
- CIC Group released their H1’2024 results. CIC’s Profit After Tax (PAT) increased marginally by 0.6% to remain relatively flat at the Kshs 0.7 bn, recorded in H1’2023. The performance was mainly driven by a 35.7% increase in Net investment income to Kshs 1.8 bn in H1’2024, from Kshs 1.3 bn in H1’2023, and further supported by a 21.4% increase in Net income from insurance service to Kshs 1.0 bn, from Kshs 0.9 bn in H1’2023. However, the performance was weighed down by the 61.5% increase in net expenses from reinsurance contracts to Kshs 1.4 bn, from Kshs 0.9 bn in H1’2024. For more information, please see our Cytonn Weekly #34/2024
- Equity Group released its H1’2024 financial results, with its Core Earnings per Share (EPS) increasing by 12.5% to Kshs 7.8 from Kshs 7.0 in H1’2024, mainly driven by the 17.2% growth in total operating income to Kshs 97.1 bn, from Kshs 82.9 bn in H1’2023. Cooperative Bank of Kenya released its H1’2024 financial results, with its Core Earnings per Share (EPS) increasing by7.0% to Kshs 2.2, from Kshs 2.1 in H1’2023, driven by the 10.9% increase in total operating income to Kshs 39.2 bn, from Kshs 35.4 bn in H1’2023. For more information, please see our Cytonn Weekly #33/2024
- Sanlam Kenya Holdings released their H1’2024 results, recording a significant 264.1% increase in Profit After Tax to Kshs 0.3 bn, from the Kshs 0.2 bn loss recorded in H1’2023. The performance was mainly driven by a significant 316.9% increase in insurance investment revenue to Kshs 2.3 bn, from Kshs 0.6 bn in H1’2023, and supported by a 57.5% decrease in Net expenses from reinsurance contracts held to Kshs 0.1 bn in H1’2024, from Kshs 0.5 bn in H1’2023. For more information, please see our Cytonn Weekly #33/2024, and,
- Stanbic Holdings PLC released their H1’2024 Financial Results for the period ending 30th June 2024, recording a 2.3% increase in Profit After Tax (PAT) to Kshs 7.2 bn, from Kshs 7.1 bn recorded in H1’2023. The performance was mainly driven by a 4.2% increase in Net-Interest Income to Kshs 12.6 bn in H1’2024, from Kshs 12.1 bn recorded in H1’2023, but was weighed down by a 15.1% decrease in Non-Interest Income to Kshs 7.6 bn from Kshs 8.9 bn recorded in H1’2023. For more information, please see our Cytonn Weekly #33/2024
Weekly Highlights
- DTBK H1’2024 Financial Performance
Below is a summary of DTB-K H1’2024 performance:
|
Balance Sheet Items |
H1'2023 |
H1'2024 |
y/y change |
|
Government Securities |
136.1 |
124.3 |
(8.7%) |
|
Net Loans and Advances |
281.2 |
267.9 |
(4.7%) |
|
Total Assets |
579.2 |
585.4 |
1.1% |
|
Customer Deposits |
418.0 |
431.9 |
3.3% |
|
Deposits Per branch |
3.1 |
2.8 |
(9.5%) |
|
Total Liabilities |
496.6 |
501.1 |
0.9% |
|
Shareholders’ Funds |
72.4 |
74.6 |
3.0% |
|
Key Ratios |
H1'2023 |
H1'2024 |
% point change |
|
Loan to Deposit ratio |
67.3% |
62.0% |
(5.2%) |
|
Government Securities to Deposits ratio |
32.6% |
28.8% |
(3.8%) |
|
Return on Average Equity |
10.2% |
11.3% |
1.1% |
|
Return on Average Assets |
1.4% |
1.4% |
0.1% |
|
Income Statement |
H1'2023 (Kshs bn) |
H1'2024 (Kshs bn) |
y/y change |
|
Net interest Income |
13.1 |
14.2 |
8.3% |
|
Net non-interest income |
5.5 |
6.4 |
15.1% |
|
Total Operating income |
18.7 |
20.6 |
10.3% |
|
Loan loss provision |
3.3 |
3.6 |
11.1% |
|
Total Operating expenses |
5.4 |
6.1 |
13.1% |
|
Profit before tax |
12.7 |
14.2 |
12.1% |
|
Profit after tax |
6.0 |
6.3 |
4.3% |
|
Core EPS |
4.4 |
4.9 |
11.5% |
|
Income Statement Ratios |
H1'2023 |
H1'2024 |
y/y change |
|
Yield from interest-earning assets |
9.9% |
11.4% |
1.6% |
|
Cost of funding |
4.8% |
6.1% |
1.3% |
|
Net Interest Spread |
5.0% |
5.3% |
0.3% |
|
Net Interest Income as % of operating income |
70.3% |
69.0% |
(1.3%) |
|
Non-Funded Income as a % of operating income |
29.7% |
31.0% |
1.3% |
|
Cost to Income Ratio (CIR) |
68.1% |
69.2% |
1.1% |
|
CIR without provisions |
50.6% |
51.6% |
1.0% |
|
Cost to Assets |
4.8% |
5.6% |
0.8% |
|
Net Interest Margin |
5.3% |
5.7% |
0.4% |
|
Capital Adequacy Ratios |
H1'2023 |
H1'2024 |
% points change |
|
Core Capital/Total Liabilities |
21.6% |
18.2% |
(3.4%) |
|
Minimum Statutory ratio |
8.0% |
8.0% |
|
|
Excess |
13.6% |
10.2% |
(3.4%) |
|
Core Capital/Total Risk Weighted Assets |
18.5% |
17.6% |
(0.9%) |
|
Minimum Statutory ratio |
10.5% |
10.5% |
|
|
Excess |
8.0% |
7.1% |
(0.9%) |
|
Total Capital/Total Risk Weighted Assets |
19.3% |
19.1% |
(0.2%) |
|
Minimum Statutory ratio |
14.5% |
14.5% |
|
|
Excess |
4.8% |
4.6% |
(0.2%) |
|
Liquidity Ratio |
52.2% |
52.6% |
0.4% |
|
Minimum Statutory ratio |
20.0% |
20.0% |
|
|
Excess |
32.2% |
32.6% |
0.4% |
Key Take-Outs:
- Increased earnings - Core earnings per share (EPS) grew by by 11.5% to Kshs 17.4, from Kshs 15.6 in H1’2023, driven by the 10.3% increase in total operating income to Kshs 20.6 bn, from Kshs 18.7 bn in H1’2023. However, the performance was weighed down by an 12.1% increase in total operating expenses to Kshs 14.2 bn from Kshs 12.7 bn in H1’2023
- Deteriorated asset quality – The bank’s Asset Quality deteriorated, with Gross NPL ratio increasing to 13.5% in H1’2024, from 12.3% in H1’2023, attributable to a 5.6% increase in Gross non-performing loans to Kshs 38.6 bn, from Kshs 36.5 bn in H1’2023, compared to the 4.4% decline in gross loans to Kshs 285.0 bn, from Kshs 298.1 bn recorded in H1’2023
- Expanded Balanced sheet - The balance sheet recorded an expansion as total assets grew by 1.1% to Kshs 585.4 bn, from Kshs 579.2 bn in H1’2024, driven by a 107.9% increase in placements to Kshs 41.9 bn, from 20.1 bn in H1’2023, coupled with a 6.3% increase in other assets to Kshs 27.9 bn, from Kshs 26.3 bn in H1’2023,
For a more detailed analysis, see the DTB-K Bank H1’2024 Earnings Note
- ABSA H1’2024 Financial Performance
Below is a summary of ABSA Group’s H1’2024 performance:
|
Balance Sheet Items |
H1’2023 |
H1’2024 |
y/y change |
|
Government Securities |
80.7 |
63.7 |
(21.0%) |
|
Net Loans and Advances |
317.9 |
316.4 |
(0.5%) |
|
Total Assets |
503.7 |
481.4 |
(4.4%) |
|
Customer Deposits |
332.6 |
353.3 |
6.2% |
|
Deposits per branch |
4.4 |
4.2 |
(5.0%) |
|
Total Liabilities |
440.0 |
408.4 |
(7.2%) |
|
Shareholders’ Funds |
63.7 |
73.0 |
14.6% |
|
Balance Sheet Ratios |
H1’2023 |
H1’2024 |
% points change |
|
Loan to Deposit Ratio |
95.6% |
89.5% |
(6.1%) |
|
Government Securities to Deposit Ratio |
24.3% |
18.0% |
(6.2%) |
|
Return on average equity |
27.7% |
27.5% |
(0.2%) |
|
Return on average assets |
3.5% |
3.8% |
0.3% |
|
Income Statement |
H1’2023 |
H1’2024 |
y/y change |
|
Net Interest Income |
19.2 |
23.0 |
19.7% |
|
Net non-Interest Income |
8.1 |
8.8 |
8.4% |
|
Total Operating income |
27.4 |
31.8 |
16.3% |
|
Loan Loss provision |
(5.2) |
(5.2) |
0.3% |
|
Total Operating expenses |
(15.3) |
(16.6) |
8.3% |
|
Profit before tax |
12.1 |
15.3 |
26.5% |
|
Profit after tax |
8.3 |
10.7 |
28.9% |
|
Core EPS |
1.5 |
2.0 |
28.9% |
|
Dividend per share |
0.20 |
0.20 |
0.0% |
|
Dividend Yield (Annualized) |
3.4% |
2.8% |
(0.6%) |
|
Dividend Payout Ratio |
13.1% |
10.1% |
(2.9%) |
|
Income Statement Ratios |
H1’2023 |
H1’2024 |
% points change |
|
Yield from interest-earning assets |
11.5% |
14.2% |
2.7% |
|
Cost of funding |
3.3% |
5.0% |
1.7% |
|
Net Interest Spread |
1.8% |
2.6% |
0.8% |
|
Net Interest Margin |
9.0% |
10.1% |
1.1% |
|
Cost of Risk |
18.8% |
16.2% |
(2.6%) |
|
Net Interest Income as % of operating income |
70.3% |
72.3% |
2.0% |
|
Non-Funded Income as a % of operating income |
29.7% |
27.7% |
(2.0%) |
|
Cost to Income Ratio |
55.9% |
52.0% |
(3.9%) |
|
Cost to Income Ratio (without LLPs) |
37.0% |
35.8% |
(1.3%) |
|
Capital Adequacy Ratios |
H1’2023 |
H1’2024 |
% points change |
|
Core Capital/Total Liabilities |
17.3% |
18.3% |
1.0% |
|
Minimum Statutory ratio |
8.0% |
8.0% |
0.0% |
|
Excess |
9.3% |
10.3% |
1.0% |
|
Core Capital/Total Risk Weighted Assets |
13.5% |
14.8% |
1.3% |
|
Minimum Statutory ratio |
10.5% |
10.5% |
0.0% |
|
Excess |
3.0% |
4.3% |
1.3% |
|
Total Capital/Total Risk Weighted Assets |
17.7% |
18.6% |
0.9% |
|
Minimum Statutory ratio |
14.5% |
14.5% |
0.0% |
|
Excess |
3.2% |
4.1% |
0.9% |
|
Liquidity Ratio |
28.7% |
35.2% |
6.5% |
|
Minimum Statutory ratio |
20.0% |
20.0% |
0.0% |
|
Excess |
8.7% |
15.2% |
6.5% |
Key Take-Outs:
- Increased earnings - Core earnings per share increased by 28.9% to Kshs 2.0, from Kshs 1.5 in H1’2023, mainly driven by the 16.3% increase in total operating income to Kshs 31.8 bn, from Kshs 27.4 bn in H1’2023 which outpaced the 8.3% increase in total operating expenses to Kshs 16.6 bn, from Kshs 15.3 bn in H1’2023,
- Declined asset quality – The bank’s Gross NPL ratio increased to 11.5% in H1’2024, from 9.5% in H1’2023, attributable to the 22.4% increase in gross non-performing loans to Kshs 39.4 bn, from Kshs 32.2 bn in H1’2023, relative to the 0.8% increase in gross loans to Kshs 343.0 bn, from Kshs 340.3 bn recorded in H1’2023,
- Decreased Lending – The bank’s loan book recorded a contraction of 0.5% to Kshs 316.4 bn, from Kshs 317.9 bn in H1’2023
- Declaration of Dividends - The Board of Directors declared an interim dividend of Kshs 0.2 per share for H1’2024, a similar amount to that in H1’2023. This translates to a dividend payout ratio of 10.1% and an annualized dividend yield of 2.8% as of 30th August 2024.
For a more detailed analysis, see the ABSA Bank H1’2024 Earnings Note
Asset Quality:
The table below shows the asset quality of listed banks that have released their H1’2024 results using several metrics:
Key take-outs from the table include;
- Asset quality for the listed banks that have released declined during H1’2024, with market-
|
Cytonn Report: Listed Banks Asset Quality |
||||||
|
|
H1'2024 NPL Ratio* |
H1'2023 NPL Ratio** |
% point change in NPL Ratio |
H1'2024 NPL Coverage* |
H1'2023 NPL Coverage** |
% point change in NPL Coverage |
|
KCB Group |
18.1% |
16.2% |
1.9% |
18.1% |
16.2% |
1.9% |
|
Standard Chartered |
9.9% |
14.4% |
(4.5%) |
83.7% |
86.8% |
(3.1%) |
|
HF Group |
24.2% |
23.1% |
1.1% |
75.6% |
72.0% |
3.6% |
|
ABSA Bank |
11.5% |
9.5% |
2.0% |
67.7% |
69.4% |
(1.7%) |
|
I&M Group |
11.4% |
12.7% |
(1.3%) |
57.9% |
49.8% |
8.1% |
|
Equity Group |
13.9% |
11.2% |
2.7% |
58.8% |
54.5% |
4.3% |
|
DTB-K Bank |
13.5% |
12.3% |
1.2% |
44.4% |
46.4% |
(2.0%) |
|
Co-operative Bank of Kenya |
16.7% |
14.6% |
2.1% |
59.5% |
60.7% |
(1.2%) |
|
NCBA Bank |
12.2% |
13.4% |
(1.2%) |
59.8% |
57.8% |
2.0% |
|
Stanbic Bank |
9.5% |
9.2% |
0.3% |
75.0% |
57.4% |
17.6% |
|
Mkt Weighted Average* |
13.4% |
12.7% |
0.7% |
57.6% |
60.1% |
(2.5%) |
|
*Market cap weighted as at 16/08/2024 |
||||||
|
**Market cap weighted as at 21/09/2023 |
||||||
weighted average NPL ratio increasing by 0.7% points to 13.4% from 12.7% in H1’2023, and,
- Market-weighted average NPL Coverage for the listed banks that have released results decreased by 2.5% points to 57.6% in H1’2024 from 60.1% recorded in H1’2023. The increase was attributable to Standard Chartered’s coverage ratio decreasing by 3.1% to 83.7% from 86.8% in H1’2023, coupled with Cooperative Bank’s NPL coverage ratio increasing by 1.2% points to 60.7% from 59.5% in H1’2023. The performance was however supported by Stanbic Bank’s NPL Coverage ratio increasing by 17.6% points to 75.0% from 57.4% in H1’2023.
Summary Performance
The table below shows the performance of listed banks that have released their H1’2024 results using several metrics:
|
Cytonn Report: Listed Banks Performance in H1’2024 |
||||||||||||||
|
Bank |
Core EPS Growth |
Interest Income Growth |
Interest Expense Growth |
Net Interest Income Growth |
Net Interest Margin |
Non-Funded Income Growth |
NFI to Total Operating Income |
Growth in Total Fees & Commissions |
Deposit Growth |
Growth in Government Securities |
Loan to Deposit Ratio |
Loan Growth |
Return on Average Equity |
|
|
KCB Group |
86.4% |
38.9% |
46.5% |
34.8% |
7.1% |
20.8% |
35.2% |
1.5% |
1.3% |
(1.5%) |
67.8% |
0.0% |
22.7% |
|
|
Standard Chartered |
48.9% |
25.4% |
78.0% |
19.3% |
8.6% |
36.1% |
36.7% |
(17.7%) |
66.5% |
(19.9%) |
54.0% |
2.7% |
25.5% |
|
|
HF Group |
45.3% |
23.8% |
44.4% |
4.7% |
5.3% |
30.7% |
35.0% |
17.7% |
10.7% |
24.4% |
84.2% |
(0.4%) |
5.2% |
|
|
ABSA Bank |
28.9% |
29.3% |
60.1% |
19.7% |
10.1% |
8.4% |
27.7% |
2.3% |
6.2% |
(21.0%) |
89.5% |
(0.5%) |
27.5% |
|
|
I&M Group |
17.3% |
46.1% |
60.8% |
35.2% |
7.8% |
(10.9%) |
27.2% |
3.6% |
17.5% |
(18.6%) |
67.8% |
5.3% |
16.3% |
|
|
Equity Group |
12.5% |
21.5% |
30.1% |
17.2% |
7.7% |
17.2% |
44.0% |
15.5% |
10.6% |
(5.1%) |
60.9% |
(3.2%) |
23.7% |
|
|
DTB-K Bank |
11.5% |
17.9% |
28.6% |
8.3% |
5.7% |
15.1% |
31.0% |
2.1% |
3.3% |
(8.7%) |
62.0% |
(4.7%) |
11.3% |
|
|
Co-operative Bank of Kenya |
7.0% |
24.4% |
52.6% |
10.7% |
7.8% |
11.2% |
39.2% |
4.4% |
9.4% |
7.3% |
74.0% |
2.8% |
20.5% |
|
|
NCBA Bank |
5.0% |
25.4% |
64.5% |
(4.4%) |
(0.2%) |
7.9% |
47.5% |
6.4% |
2.4% |
(9.8%) |
58.6% |
5.9% |
23.1% |
|
|
Stanbic Holdings |
2.3% |
49.1% |
154.3% |
4.2% |
7.9% |
(15.1%) |
37.6% |
(6.3%) |
30.3% |
(21.0%) |
67.0% |
(2.4%) |
18.5% |
|
|
H1'24 Mkt Weighted Average* |
28.7% |
30.0% |
59.3% |
17.7% |
7.2% |
13.1% |
37.8% |
3.0% |
16.2% |
(9.6%) |
66.6% |
0.5% |
22.6% |
|
|
H1'23 Mkt Weighted Average** |
14.3% |
28.2% |
44.8% |
21.0% |
7.3% |
27.9% |
38.9% |
26.6% |
21.3% |
5.3% |
72.3% |
20.5% |
22.9% |
|
|
*Market cap weighted as at 31/08/2024 |
||||||||||||||
|
**Market cap weighted as at 21/09/2023 |
||||||||||||||
- Britam H1’2024 Financial Performance
|
Cytonn Report: Britam Holdings Income Statement |
|||
|
Item (All figures in Bns) |
H1'2023 |
H1'2024 |
y/y change |
|
Insurance Revenue |
16.6 |
17.8 |
7.4% |
|
Insurance service expenses |
11.8 |
13.6 |
14.6% |
|
Net Insurance income |
1.9 |
2.1 |
10.8% |
|
Net Investment Income |
5.3 |
13.3 |
150.0% |
|
Net Insurance and Finance expenses |
4.7 |
12.3 |
161.2% |
|
Other Income |
0.3 |
0.6 |
75.7% |
|
Other operating expenses |
0.8 |
1.2 |
50.1% |
|
Profit Before Tax |
2.4 |
2.8 |
18.0% |
|
Profit After Tax |
1.6 |
2.0 |
22.6% |
|
Cytonn Report: Bitam Holdings Balance Sheet |
|||
|
Item (All figures in Bns) |
H1'2023 |
H1'2024 |
y/y change |
|
Investment assets |
151.6 |
167.8 |
10.7% |
|
Intangible Assets |
2.1 |
1.9 |
(10.2%) |
|
Total Assets |
167.5 |
188.8 |
12.7% |
|
Insurance Contract Liabilities |
130.6 |
148.2 |
13.5% |
|
Provisions & other payables |
10.4 |
11.9 |
14.3% |
|
Total liabilities |
144.0 |
162.5 |
12.8% |
|
Shareholder funds |
23.3 |
26.3 |
12.9% |
|
Minority Interest |
0.2 |
0.3 |
23.8% |
|
Total Equity |
23.5 |
26.6 |
13.0% |
During the week, Britam Holdings released their H1’2024 results. This was the third time the company released their results under the new IFRS 17 reporting system. Britam’s Profit After Tax (PAT) increased by 22.6% to Kshs 2.0 bn, from Kshs 1.6 bn recorded in H1’2023. The performance was mainly driven by a 150.0% increase in Net Investment income to Kshs 13.3 bn, from Kshs 5.3 bn in H1’2023, but was weighed down by the 161.2% increase in Insurance Expenses to Kshs 12.3 bn in H1’2024, from Kshs 4.7 bn in H1’2023;
Key take outs from the results:
- Core Earnings Per share increased by 22.6% to Kshs 0.8 from Kshs 0.7 in H1’2023, driven by the 150.0% increase in Net Investment income to Kshs 13.3 bn, from Kshs 5.3 bn in H1’2023, but was weighed down by the 161.2% increase in Insurance Expenses to Kshs 12.3 bn in H1’2024, from Kshs 4.7 bn in H1’2023,
- Net Investment Income (NII) increased by 150.0% to Kshs 13.3 bn in H1’2024, from Kshs 5.3 bn in H1’2023. This was majorly attributable to the 34.1% increase in interest and dividend income to 9.1 bn from Kshs 6.8 bn in H1’2023, coupled with a 17.6% increase in income from investment property to remain relatively unchanged from the Kshs 0.3 bn in H1’2023,
- Insurance revenue increased by 7.4% to Kshs 17.8 bn in H1’2024 from Kshs 16.6 bn in H1’2023, while insurance expenses increased by 14.6% to Kshs 13.6 bn from Kshs 11.8 bn in H1’2023, and net expenses from reinsurance contracts decreased by 25.2% to Kshs 2.1 bn from Kshs 2.8 bn in H1’2023, translating to a Net insurance service result increase of 10.8% to Kshs 2.1 bn from Kshs 1.9 bn in H1’2023,
- The balance sheet recorded an expansion as total assets increased by 12.7% to Kshs 188.8 bn in H1’2024 from Kshs 167.5 bn in H1’2023 mainly driven by 10.7% increase in investment assets to Kshs 67.8 bn from Kshs 151.6 bn in H1’2023, coupled with a 425.5% increase in cash and bank balances assets Kshs 8.5 bn from Kshs 1.5 bn, and,
- Total liabilities increased by 12.8 to Kshs 162.5 bn from Kshs 144.0 bn in H1’2023, majorly on the back of Insurance contract liabilities 13.5% increase to Kshs 148.2 bn from Kshs 130.6 bn in H1’2023, as well as the 14.3% increase in provisions and other payables to Kshs 11.9 bn from Kshs 10.4 bn in H1’2023.
- Britam’s total equity recorded a 13.0% increase to Kshs 26.3 bn in H1’2024 from Kshs 23.3 bn in H1’2023, attributable to the 12.9% increase in shareholder funds to Kshs 26.3 bn in H1’2024 from Kshs 23.3 bn in H1’2023
Other highlights from the release include:
- Non-declaration of dividends – The Group’s board of directors declined to announce any dividends for the fourth consecutive year citing the group’s attempt to conserve capital.
Going forward, the factors that would drive the company’s growth would be:
- Microinsurance partnerships – With 43% market share in microinsurance, Britam continues to leverage this segment through internal initiatives and partnerships. Partnerships such as that between the company and Bonfire Adventures and Digital Innovation Hub Ohala to offer travel insurance, and another with Voltic Kenya to provide travel insurance and online ticketing are some notable initiatives
- Diversified Products – On top of their mainstream insurance products, Britam has innovatively introduced a number of products into the market. These diversified products, such as school personal accidents, new born baby insurance products and their unit trust products, will contribute to a continued growth of the company’s growth.
Valuation Summary:
- We are of the view that Britam Holdings Plc is a “Buy” with a target price of Kshs 7.5 representing an upside of 35.9%, from the current price of 5.5 as of 30th August 2024.
- Britam is currently trading at a P/TBV of 0.8x and a P/E of 6.8x vs an industry average of 0.6x and 5.2x respectively.
- Bamburi Cement H1’2024 Financial Performance
Bamburi Cement Plc’s H1’2024 Results
|
Cytonn Report: Bamburi Cement Plc H1'2024 Performance |
|||
|
Income Statement |
H1'2023 |
H1'2024 |
% Change |
|
Turnover |
10.5 |
10.9 |
3.8% |
|
Total Operating costs |
(10.1) |
(10.1) |
0.2% |
|
Operating Profit |
0.3 |
0.5 |
76.4% |
|
Finance Income & costs (Net) |
0.02 |
0.15 |
906.7% |
|
Profit/(Loss) Before Tax |
0.3 |
0.7 |
114.8% |
|
Income Tax |
(0.1) |
(0.2) |
75.3% |
|
Profit(loss) from continuing operations |
0.2 |
0.5 |
131.7% |
|
Loss from discontinued operations |
(0.1) |
(1.4) |
908.6% |
|
Profit/(Loss) After Tax |
0.1 |
(0.9) |
(1,095.5%) |
|
Earnings Per Share (EPS) |
0.4 |
2.5 |
583.3% |
|
Dividend Per Share |
0.0 |
18.3 |
|
|
Dividend Yield |
0.0% |
39.2% |
39.2% |
|
Cytonn Report: Bamburi Cement Plc H1'2024 Performance |
|||
|
Balance Sheet |
H1'2023 |
H1'2024 |
% Change |
|
Non-Current Assets |
23.6 |
23.7 |
0.3% |
|
Current Assets |
4.7 |
8.3 |
75.1% |
|
Total Assets |
44.6 |
34.5 |
(22.8%) |
|
Non-Current Liabilities |
3.3 |
3.3 |
(0.9%) |
|
Current Liabilities |
3.5 |
7.9 |
125.8% |
|
Working Capital |
1.2 |
0.4 |
(70.5%) |
|
Total Equity & Liabilities |
44.6 |
34.5 |
(22.8%) |
During the week, Bamburi Cement Plc released their H1’2024 results, reporting a profit after tax from continuing operations for the year of Kshs 0.5 bn, a significant 131.7% increase from the Kshs 0.2 bn profit after tax recorded in H1’2023. This performance was partly attributable to the turnover which increased by 3.8% to Kshs 10.9 bn from Kshs 10.8 bn in H1’2024, and weighed down by the total operating costs increased slightly by 0.2% to remain relatively unchanged from the Kshs 10.1 bn recorded in H1’2024.
Key take outs from the results:
- Core Earnings Per share decreased significantly by 783.3% to (Kshs 2.5) from Kshs 0.4 in H1’2024, driven by the 908.6% increase in losses from discontinued operations to Kshs 1.4 bn from Kshs 0.1 bn in H1’2024 which outweighed the 7% increase from the Kshs 0.2 bn profit after tax from continuing operations recorded in H1’2023,
- The company’s turnover increased by 8% to Kshs 10.9 bn from Kshs 10.8 bn in H1’2024. Meanwhile, total operating cost increased by 0.2% to remain relatively unchanged from the Kshs 10.1 bn recorded in H1’2024, resulting in a 76.4% increase in operating profit to Kshs 0.5 bn from Kshs. 0.3 bn recorded in FY’2022, and,
- The balance sheet recorded a contraction as total assets decreased by 22.8% to Kshs 34.5 bn from Kshs 44.6 bn in 0.2% to remain relatively unchanged from the Kshs 10.1 bn recorded in H1’2024 mainly driven by the disposal of assets worth Kshs 15.4 bn previously held for sale, in addition to the sale of the Ugandan based subsidiary Hima Cement.
Other highlights from the release include:
- Declaration of dividends – The directors of Bamburi Cement Plc have recommended a special dividend of Kshs 18.25 per share in relation to proceeds from the disinvestment of the company’s shareholding in Hima Cement, translating to a dividend yield of 23.5% as of 30th August 2024.
- The directors did not recommend any interim dividend for the Financial Year 2024.
Going forward, the factors that would drive the company’s growth would be:
- Successful share takeover – With two entities, Amsons Group and Savannah Clinker, announcing intention to acquire 100% of Bamburi’s shareholding at a bid price of KShs. 65.0 and Kshs 70 respectively. We expect that should one of these entities successfully acquire the company, that will subsequently influence the future direction and strategic path of the business.
- Innovative and Sustainable projects – The company is expected to create partnerships to explore environmentally friendly solutions to building. Partnerships such as the current one with Geocycle and Haller Park are expected to drive the company towards sustainability.
- Bamburi Cement Acquisition Offer
During the week, Savannah Clinker announced its intention to acquire 100% of the ordinary shares of Bamburi Cement Plc with a par value of Kshs 5.0 each for a cash consideration. The offer placed is of a total value of Kshs 25.4 bn, translating to a purchase price of Kshs 70.0 per share, just weeks after Amsons Industries (K) Limited made their offer of a total value of Kshs 23.6 bn, translating to a purchase price of Kshs 65.0 per share.
The Kenyan-based company is a direct investment company, whose principal activities include mining, manufacturing, processing, packaging, marketing, and selling of cement and is fully owned by Mr. Benson Sande Ndeta.
With the Kshs 25.4 bn, this deal will represent a 53.3% premium on the closing price of Bamburi cement shares of 45.7 recorded on 9th July 2024, as compared to the 42.4% premium on the Amsons deal. It shall also be a gain of 64.6% of the weighted average share price of Bamburi cement for the past 30 days leading to the announcement of the initial deal of 42.5, as compared to Amsons 52.9%. On the 90 and 180-day periods, this deal will represent a gain of 56.9% and 79.6% as compared to Amsons 58.2% and 85.7% at the time of their announcement
Additionally, the competing offer announcement came shortly after Bamburi Cement had announced a special dividend of Kshs 18.25 per share to its shareholders in relation to the proceeds received from the completed divestment of Bamburi shareholding in Hima Cement Limited. Earlier this year, Bamburi Cement Plc announced the successful completion of the sale of 1.3 mn ordinary shares in Hima Cement Limited, representing 70.0% of the total shares owned by Bamburi Cement Plc through its parent company Himcem Holdings Limited, to Sarrai Group Limited and Rwimi Holdings Limited. This deal injected an estimated Kshs 12.0 bn in the company’s books.
The table below represents some of the notable differences between the two offers:
|
Cytonn Report: Bamburi Offers Comparison |
|||
|
|
|
Savannah Clinker |
Amsons Industries (K) |
|
1. |
Value of offer |
Kshs 25.4 bn |
Kshs 23.6 bn |
|
2. |
Offer Price/share |
Kshs 70.0 |
Kshs 65.0 |
|
3. |
Long stop date for completion |
28th February |
28th November |
|
4. |
Conditions of the offers |
|
|
Given the differences between the two offers, we may see a counteroffer from Amsons Industries (K) Limited in the coming weeks. Also, given the attractive yields by both offers for Bamburi Cement shareholders, we anticipate that whichever offer will get approved will attract an over 90% acceptance rate that will see the company delisted from the Nairobi Securities exchange.
- Jubilee Holdings Ltd H1’2024 Results
|
Cytonn Report: Jubilee Holdings Ltd Income Statement |
|||
|
Item (All figures in Bns) |
H1’2023 |
H1’2024 |
y/y change |
|
Insurance Revenue |
9.8 |
12.6 |
28.4% |
|
Insurance service expenses |
(9.7) |
(11.3) |
15.6% |
|
Net expenses from reinsurance contracts held |
(0.2) |
(0.4) |
123.0% |
|
Net Insurance income |
(0.1) |
1.0 |
795.8% |
|
Net Financial Result |
3.4 |
0.9 |
(73.3) |
|
Net non-attributable income (expenses) |
(0.9) |
1.1 |
23.5% |
|
Profit Before Tax |
2.4 |
2.9 |
20.8% |
|
Taxation |
(0.4) |
(0.4) |
10.7% |
|
Profit After Tax |
2.0 |
2.5 |
22.7% |
|
Cytonn Report: Jubilee Holdings Ltd Balance Sheet |
|||
|
Item (All figures in Bns) |
H1’2023 |
H1’2024 |
y/y change |
|
Investment assets |
159.7 |
181.6 |
13.8% |
|
Insurance assets |
3.9 |
3.7 |
(6.7%) |
|
Total Assets |
180.7 |
202.6 |
12.1% |
|
Insurance Contract Liabilities |
125.7 |
138.1 |
10.0% |
|
Provisions & other payables |
8.2 |
7.6 |
(6.7%) |
|
Total liabilities |
133.7 |
145.7 |
9.0% |
|
Shareholder funds |
44.5 |
54.3 |
22.1% |
|
Minority Interest |
2.5 |
2.6 |
2.3% |
|
Total Equity |
47.0 |
56.9 |
21.1% |
During the week, Jubilee Holdings Limited released their H1’2024 results. Jubilee’s Profit After Tax (PAT) increased by 22.7% to Kshs 2.5 bn, from Kshs 2.0 bn recorded in H1’2023. The performance was mainly driven by a 28.4% increase in Insurance Services Revenues to Kshs 12.6 bn, from Kshs 9.8 bn in H1’2023, but was however weighed down by the 15.6% increase in Insurance Services Expenses to Kshs 11.3 bn in H1’2024, from Kshs 9.7bn in H1’2023,
key take outs from the results:
- Core Earnings Per share increased by 22.7% to Kshs 34.6 from Kshs 28.2 in H1’2023, driven by the 28.4% increase in Insurance Services Revenues to Kshs 12.6 bn, from Kshs 9.8 bn in H1’2023, but was however weighed down by the 15.6% increase in Insurance Services Expenses to Kshs 11.3 bn in H1’2024, from Kshs 9.7 bn in H1’2023
- Net financial result decreased significantly by 73.3% to Kshs 0.9 bn in H1’2024, from Kshs 3.4 bn in H1’2023, while net non-attributable expenses increased by 23.5% to Kshs 1.1 bn, from Kshs 0.9 bn in H1’2023, resulting in a 20.8% increase in the Profit Before Tax to Kshs 2.9 bn in H1’2024, from Kshs 2.4 bn recorded in H1’2023,
- Insurance services revenue increased by 28.4% to Kshs 12.6 bn in H1’2024 from Kshs 9.8 bn in H1’2023, while insurance expenses increased by 15.6% to Kshs 11.3 bn from Kshs 9.7 bn in H1’2023, and the net expenses from reinsurance contracts held increased significantly by 123.0% to Kshs 0.4 bn, from Kshs 0.2 bn in H1’2023. This translated to a Net insurance service result increase of 795.8% to Kshs 1.0 bn from Kshs (0.1) bn in H1’2023,
- The balance sheet recorded an expansion as total assets increased by 12.1% to Kshs 202.6 bn in H1’2024 from Kshs 180.7 bn in H1’2023 mainly driven by 102.5% increase in fixed assets to Kshs 2.7 bn from Kshs 1.4 bn in H1’2023, coupled with 13.8% increase in financial investment assets to Kshs 181.6 bn form Kshs 159.7 bn in H1’2023, and,
- Total liabilities increased by 9.0% to Kshs 145.7 bn from Kshs 133.7 bn in H1’2023, majorly on the back of Insurance contract liabilities 10.0% increase to Kshs 138.1 bn from Kshs 125.6 bn in H1’2023, but was however weighed down by the 6.7% decrease in other liabilities to Kshs 7.6 bn from Kshs 8.2 bn in H1’2023.
- Jubilee Holding’s’s total equity recorded a 21.2% increase to Kshs 56.9 bn in H1’2024 from Kshs 47.0 bn in H1’2023, attributable to the 22.2% increase in shareholder funds to Kshs 54.3 bn in H1’2024 from Kshs 44.5 bn in H1’2023
Other highlights from the release include:
- Declaration of dividends – The board of directors declared an interim dividend of Kshs 2.0 per share, similar to the interim dividend of Kshs 2.0 declared in H1’2023. This translated to an annualized dividend yield of 2.7% and a dividend payout of 5.8%.
Key to note, this was the third time the company was releasing their results under the new IFRS 17 reporting system. This standard requires insurers to measure insurance contracts using updated estimates and assumptions that account for the timing of cash flows and any uncertainties related to insurance contracts. Looking ahead, the Group's earnings are expected to benefit from its enhanced performance in both the life and general insurance segments.
We are “Neutral” on the Equities markets in the short term due to the current tough operating environment and huge foreign investor outflows, and, “Bullish” in the long term due to current cheap valuations and expected global and local economic recovery. With the market currently being undervalued for its future growth (PEG Ratio at 0.6x), we believe that investors should reposition towards value stocks with strong earnings growth and that are trading at discounts to their intrinsic value. We expect the current high foreign investors’ sell-offs to continue weighing down the equities outlook in the short term.
- Industry Report
During the month of August, the following industry reports were released and the key take-outs were as follows;
|
Cytonn Report: Notable Industry Reports During the Month of July 2024 |
|||
|
# |
Theme |
Report |
Key Take-outs |
|
1 |
Real estate and Hospitality Sectors |
Q1’2024 Quarterly Economic Review Central Bank of Kenya (CBK) |
|
|
2 |
Residential sector, commercial office spaces, retail sector and industrial sector |
Kenya Market Update H1’2024 Report by Knight Frank |
|
|
3
|
Hospitality Sector, Real Estate, Building and construction Sector |
Leading Economic Indicators (LEI) June 2024 Report by the Kenya National Bureau of Statistics (KNBS) |
|
- Residential Sector
There were five notable highlights during the month;
- Beulah City, a Nairobi-based developer in collaboration with AMS properties and KCB bank as a finance partner, announced the launch of its inaugural 1074 affordable units housing project along Wanyee road, off Naivasha road in Nairobi. For more information, please see our Cytonn weekly #32/2024,
- President William Ruto presided over the ground-breaking ceremony of Nyaribari Masaba Affordable Housing project in Nyaribari Masaba Constituency, Kisii County. The 244-housing unit project shall integrate social housing, affordable housing, and market housing units and will comprise 5 blocks of apartments. As well, the president Launched construction of Ogembo affordable housing project in Bomachoge Chache Constituency in Kisii County. For more information, please see our Cytonn weekly #33/2024,
- Megna Homes, a Mombasa-based developer, launched the construction of its Kshs 4.0 bn modern gated community housing project in Kwa Sonko area, Kisauni, Mombasa County. The project, dubbed ‘Santana’ is set to sit on 12.0 acres of land and will comprise 816 modern units, including 336 three-bedroom units, 432 two-bedroom units, and 48 one-bedroom units with prices starting at Kshs 2.6 mn. For more information, please see our Cytonn weekly #34/2024,
- Shelter Afrique Development Bank (ShafDB), a leading Pan-African financing institution focused on housing, urban, and related infrastructure development, announced the signing of a Memorandum of Understanding (MOU) with CPF Group to partner in affordable housing projects in Kenya through the establishment of a joint Housing Solutions Fund, targeting improving both the supply and demand sides of affordable housing units. For more information, please see our Cytonn weekly #34/2024, and,
- State-backed mortgage lender, Kenya Mortgage Refinance Company (KMRC) released its H1’2024 financial results, which posted an 84.4% increase in Profit after Tax (PAT) to Kshs 669.0 mn in H1’2024 from Kshs 362.8 mn in H1’2023. Additionally, the balance sheet expanded, with total assets registering a 15.0% increase to Kshs 24.9 bn in H1’2024 from Kshs 24.7 bn in H1’2023, driven by a 14.7% increase in loans advanced, which came in at Kshs 8.7 bn from Kshs 7.6 bn in H1’2023. For more information, please see our Cytonn weekly #34/2024.
We expect continued vibrant performance in the residential sector sustained by; i)ongoing residential developments under the Affordable Housing Agenda, aiming to reduce the housing deficit in the country currently estimated at 80.0%, ii) increased investment from local and international investors in the housing sector, iii) favorable demographics in the country, shown by high population and urbanization rates at 9.0% p.a and 3.7% p.a respectively, leading to higher demand for housing units. However, challenges such as rising construction costs, strain on infrastructure development, and limited access to financing will continue to restrict optimal performance of the residential sector.
- Retail Sector
During the week, Naivas Supermarket, a Kenyan retail chain, opened its 105th outlet situated at the Nyali Bazaar Mall along Links Road, Mombasa County. The new retail store is the the 6th branch opened by Naivas in 2024 and 12th outlet in the region. The location at Bazaar Mall was strategically chosen to capture foot traffic and serve the growing community in the Nyali area which is an emerging business hub which has attracted a number of major retail chains in the area. Naivas is expanding their retail chain to all areas in Kenya as their way of reaching many customers and establish a strong base in the retail market. The decision to expand is mainly driven by:
- Expanding to serve the growing urban population's need for convenience and diverse shopping options,
- Strengthening its presence to stay ahead of competitors like Quickmart and Carrefour,
- Reducing costs and increasing profitability through a larger network and optimized supply chains,
- Reducing reliance on any single location by expanding to multiple regions while building stronger customer connections and reinforcing brand preference, and,
- Naivas is pursuing an aggressive expansion strategy to establish market dominance in emerging and economically growing regions across the country. At the same time, this approach is designed to heighten competition with other retailers like Quickmart and Carrefour in highly contested areas, thereby continuously reinforcing its standing in the retail sector.
We anticipate that Naivas' initiative will create employment opportunities, both directly within the store and indirectly by boosting business for local suppliers and service providers. Furthermore, the presence of a large retailer like Naivas could increase demand for retail spaces in the area, as smaller businesses may seek to establish themselves nearby to benefit from the increased foot traffic. The chart below illustrates the main local and international retail supermarket chains;
|
Cytonn Report: Main Local and International Retail Supermarket Chains |
|||||||||||
|
# |
Name of retailer |
Category |
Branches as at FY’2018 |
Branches as at FY’2019 |
Branches as at FY’2020 |
Branches as at FY’2021 |
Branches as at FY’2022 |
Branches as at FY’2023 |
Branches opened in FY’2024 |
Closed Branches |
Current Branches |
|
1 |
Naivas |
Hybrid* |
46 |
61 |
69 |
79 |
91 |
99 |
6 |
0 |
105 |
|
2 |
Quick Mart |
Hybrid** |
10 |
29 |
37 |
48 |
55 |
59 |
1 |
0 |
60 |
|
3 |
Chandarana |
Local |
14 |
19 |
20 |
23 |
26 |
26 |
0 |
0 |
26 |
|
4 |
Carrefour |
International |
6 |
7 |
9 |
16 |
19 |
22 |
1 |
0 |
23 |
|
5 |
Cleanshelf |
Local |
9 |
10 |
11 |
12 |
12 |
13 |
0 |
0 |
13 |
|
6 |
Jaza Stores |
Local |
0 |
0 |
0 |
0 |
0 |
4 |
2 |
0 |
6 |
|
7 |
Tuskys |
Local |
53 |
64 |
64 |
6 |
6 |
5 |
0 |
59 |
5 |
|
8 |
China Square |
International |
0 |
0 |
0 |
0 |
0 |
2 |
2 |
0 |
4 |
|
9 |
Uchumi |
Local |
37 |
37 |
37 |
2 |
2 |
2 |
0 |
35 |
2 |
|
10 |
Panda Mart |
International |
0 |
0 |
0 |
0 |
0 |
0 |
1 |
0 |
1 |
|
11 |
Game Stores |
International |
2 |
2 |
3 |
3 |
0 |
0 |
0 |
3 |
0 |
|
12 |
Choppies |
International |
13 |
15 |
15 |
0 |
0 |
0 |
0 |
15 |
0 |
|
13 |
Shoprite |
International |
2 |
4 |
4 |
0 |
0 |
0 |
0 |
4 |
0 |
|
14 |
Nakumatt |
Local |
65 |
65 |
65 |
0 |
0 |
0 |
0 |
65 |
0 |
|
Total |
257 |
313 |
334 |
189 |
211 |
232 |
13 |
181 |
245 |
||
|
*51% owned by IBL Group (Mauritius), Proparco (France), and DEG (Germany), while 49% owned by Gakiwawa Family (Kenya) |
|||||||||||
|
**More than 50% owned by Adenia Partners (Mauritius), while Less than 50% owned by Kinuthia Family (Kenya) |
|||||||||||
Additionally, during the month;
- China Square, an international retail company, opened its latest store in Nyali, Mombasa County marking its 4th outlet in the country. The retail store which was officially opened to the public on 20th August, 2024 is situated at the Nyali Bazaar Mall along Links Road with an aim of providing affordable household products to residents. For more information, please see our Cytonn weekly #34/2024
We anticipate continued increase in activities within the retail sector influenced by: i) ongoing expansion efforts by both local and international retailers seeking new spaces around the country to capture a larger consumer market share, ii) Positive demographics in the country increasing demand for retail goods and services, iii) government investment in infrastructure, including roads and railways projects opening up new areas to retail investments. However, the sector may face challenges including: i) increasing adoption of e-commerce business model reducing demand for physical retail spaces, ii) existing oversupply of retail spaces with approximately 3.6 mn SQFT of retail space in the Nairobi Metropolitan Area (NMA) and an additional 1.9 mn SQFT across the Kenyan retail sector, this inhibits investors potential to achieve optimal occupancy rates and rental yields.
Industrial Sector
There was one notable highlight during the month;
- Taita-Taveta County is set to achieve an economic milestone with the approval of a Kshs 11.0 bn steel plant by Devki Steel Mills Limited and will be completed within eight months. The plant is set to be constructed in Manga area, Voi. Narendra Raval of Devki Steel Mills was officially handed a 500-acre parcel of land to commence the construction of the plant. For more information, please see our Cytonn weekly #32/2024.
We expect that the Kenyan industrial Real Estate sector to continue on an upward trajectory mainly driven by: i)Kenya’s continued recognition as a regional hub, hence attracting both local and international investors, ii) support from the government, as evidenced by the establishment of Special Economic Zones (SEZ) and Export Processing Zones (EPZ), iii) increasing demand for quality warehousing spaces due to continued growth in the E-commerce business in the country iv) the growing establishment of data centers in the country, v) increasing demand for cold storage facilities around Nairobi Metropolitan Area (NMA).
- Infrastructure Sector
During the week, President Willian Ruto launched upgrading of link roads in Suna East Constituency in Migori county during his Nyanza area tour. Upon completion, the roads are expected to further Migori’s business vibrancy, improve livelihoods, and unlock the region’s economic potential. Further, the president launched the construction of Rusinga Ring Road in Homa Bay County. The road will ease the transportation pressures in the area, promote business in the area, and contribute to economic growth by providing improved accessibility and basic services which will attract investments and create jobs for the locals.
The State Department for Roads received an allocation of Kshs 199.4 bn in the Appropriation Bill 2024, which is significant but comes with a substantial budget cut of Kshs 1.0 bn taking it to Kshs 184.3 bn. As a result, the department must now prioritize its road projects, potentially delaying or cancelling less critical projects.
Additionally, during the month;
- President William Ruto launched the tarmacking of the 25-kilometre Rukuriri-Kathageri-Kanyaumbora road in Embu County. Upon completion, the road is expected to further Embu’s agricultural vibrancy, improve livelihoods, and unlock the region’s economic potential. For more information, please see our Cytonn weekly #32/2024,
- The Dongo Kundu Bypass was officially opened to the public following its handover by the contractor to the government. This Kshs 40 bn project, undertaken by the China Civil Engineering Construction Corporation (CCECC), began in 2018 and features a 17.5-kilometer road with three bridges. For more information, please see our Cytonn weekly #32/2024, and,
- The president, oversaw ground breaking for the tarmacking of 65-Kilometre-long link roads in Sombogo, Kitutu Chache and tarmacking of Metembe-Ngenyi/Bobaracho-Ititi/Rioma-Nyaore/Marani-Nyakoe Roads in Marani, Kisii County. For more information, please see our Cytonn weekly #33/2024.
We expect the infrastructure sector in Kenya will continue to play a crucial role in promoting economic activities, supported by the government's commitment to construct and rehabilitate essential infrastructure such as roads, bridges, railways, and airports. These facilities will in turn support efficient delivery of people, goods, and services thereby increasing demand for Real Estate properties in remote areas and Satellite towns.
- Real Estate Investments Trusts (REITs)
The notable highlights during the month were;
- Acorn Holdings, a student hostel developer in Nairobi announced a bid to raise Kshs 2.8 bn in new capital for its development and income Real Estate Investment Trusts (REITS) by February 2025 to fund the development and acquisition of new properties. The firm targets Kshs 1.9 bn for the Acorn student accommodation I-REIT and Kshs 810.0 mn for the D-REIT, which is set to be raised through a combination of a rights issue that closed on 31st July and an open market offer which continues until February 2025. For more information, please see our Cytonn Weekly #32/2024, and,
- Laptrust released the H1’2024 financial results for the Imara I-REIT for the period ended 30th June 2024. It highlighted that the REIT’s net earnings during the period under review improved by 63.0% to Kshs 162.4 mn in H1’2024 from Kshs 99.6 mn recorded in H1’2023. For a more comprehensive analysis, please see our Laptrust H1’2024 Earnings Note.
On the Unquoted Securities Platform, Acorn D-REIT and I-REIT traded at Kshs 25.4 and Kshs 22.2 per unit, respectively, as per the last updated data on 30th August 2024. The performance represented a 27.0% and 11.0% gain for the D-REIT and I-REIT, respectively, from the Kshs 20.0 inception price. The volumes traded for the D-REIT and I-REIT came in at Kshs 12.3 mn and Kshs 31.6 mn shares, respectively, with a turnover of Kshs 311.5 mn and Kshs 702.7 mn, respectively, since inception in February 2021. Additionally, ILAM Fahari I-REIT traded at Kshs 11.0 per share as of 30th August, 2024, representing a 45.0% loss from the Kshs 20.0 inception price. The volume traded to date came in at 138,600 for the I-REIT, with a turnover of Kshs 1.5 mn since inception in November 2015.
REITs offer various benefits, such as tax exemptions, diversified portfolios, and stable long-term profits. However, the ongoing decline in the performance of Kenyan REITs and the restructuring of their business portfolios are hindering significant previous investments. Additional general challenges include: i) insufficient understanding of the investment instrument among investors, ii) lengthy approval processes for REIT creation, iii) high minimum capital requirements of Kshs 100.0 mn for trustees, and iv) minimum investment amounts set at Kshs 5.0 mn for the Investment REITs, all of which continue to limit the performance of the Kenyan REITs market.
We expect the performance of Kenya’s Real Estate sector to remain resilient supported by several factors: i) heightened activities from both private and government sectors, ii) an expanding population driving the need for housing, iii) government efforts under the Affordable Housing Program and the incentives advanced to developers aligned with the program, iv) an increase in deals in the commercial office sector likely to boost occupancy, v) increased investment by international and local investors in the retail sector, and vi) increased international arrivals in the country boosting the hospitality and tourism sector. However, challenges such as rising construction costs, an oversupply in select Real Estate classes, strain on infrastructure development, and high capital demands in REITs sector will continue to impede the real estate sector’s optimal performance by restricting developments and investments.
Disclaimer: The views expressed in this publication are those of the writers where particulars are not warranted. This publication, which follows Section 2 of the Capital Markets Authority Act Cap 485A, is meant for general information only and is not a warranty, representation, advice, or solicitation of any nature. Readers are advised in all circumstances to seek the advice of a registered investment advisor.

- Talk to us
- Kenya
- P.O Box 20695 - 00200, Nairobi, Kenya
- Cell +254709101200
- Tel +254709101200
- WhatsApp +254741676635
- United States
- +254709101200
- DOWNLOAD OUR APP
-


- Kenya
- 8th Floor, Pinetree Plaza, Kaburu Drive, Ngong Road, Nairobi, Kenya
- USA
- Suite 1150, 1775 Eye Street NW, USA, Washington DC 20006, USA
- Investments
- High Yield
- Private Equity
- Real Estate
- Real Estate
- RiverRun Estates
- Cytonn Towers
- The Ridge
- Taraji Heights
- The Alma