Nairobi Metropolitan Area Commercial Office Report 2019 & Cytonn Weekly #14/2019
By Cytonn Research Team, Apr 7, 2019
Executive Summary
Fixed Income
T-bills recorded an oversubscription during the week, with the subscription rate rising to 250.2%, from 183.7% recorded the previous week. The oversubscription was attributed to favorable liquidity in the market. The yields on the 91-day papers declined by 10 bps to 7.4% from 7.5% recorded the previous week, while those of 182-day and 364-day papers declined by 1.5 bps and 2.3 bps to 8.2% and 9.4%, respectively. During the week, Stanbic Bank released the Monthly Purchasing Manager’s Index (PMI), which showed that the business environment in the country improved at a slower rate in March 2019 with the PMI coming in at 51.0, a decline from 51.2 in February and the weakest improvement in business conditions over the last 16 months. The slow growth in business conditions was mainly attributable to weaker expansion in new orders which consequently led to a modest increase in output levels and a slight rise in employment;
Equities
During the week, the equities market recorded mixed performances with NASI and NSE 25 gaining by 1.2% and 1.3%, respectively, while NSE 20 remained flat, taking their YTD performance to gains of 13.5%, 0.5% and 12.3%, for NASI, NSE 20 and NSE 25, respectively. KCB Group had its revised final offer of the acquisition of Imperial Bank Limited under Receivership (IBLR) accepted by the Central Bank of Kenya, and the Kenya Deposit Insurance Corporation (KDIC);
Private Equity
Britam Holdings Limited, a diversified financial services group with operations in Kenya, Tanzania, South Sudan, Uganda, Rwanda, Malawi and Mozambique announced that it seeks to acquire an undisclosed stake in Tiserin Capital, a Kenyan based private equity firm, following approval by its board of directors. In Fundraising, Kudi, a Nigeria based Financial Technology (FinTech) company focused on digital payments and collections, raised USD 5.0 mn in Series A funding. The funding round was led by San Francisco based Partech Ventures, an investment firm that finances and supports technology and digital companies. Also, the European Investment Bank announced a EUR 25.0 mn investment in the Amethis Fund II, the second pan-African investment vehicle of the Amethis, an investment fund manager dedicated to long-term responsible investments in Africa;
Real Estate
During the week, I&M Bank announced that they will be relocating their head office from the Nairobi Central Business District (CBD) to new premises dubbed ‘1 Park Avenue’ in Parklands, come August this year. In the listed real estate sector, the Nairobi Securities Exchange (NSE), on 3rd April 2019, admitted property development company ‘My Space Properties’ under the Ibuka Incubator Programme, following a successful vetting of the subject company;
Focus of the Week
The Nairobi Metropolitan Area (NMA) Commercial Office Report released annually aims to inform on supply, performance and the investment opportunity in the NMA Commercial Office Market. This week, we update our findings in 2018, where we found that performance improved, albeit marginally. The sector recorded a 0.2% points and 0.7%-points y/y increase in average rental yields and occupancy rates, to 8.1% and 83.3%, respectively, on account of an improved macro-economic environment and the continued positioning of the Nairobi Metropolitan Area (NMA) as a regional hub, thus attracting investors who require office spaces.
- Want to win a brand-new Samsung Galaxy S8 phone? Take your power selfie at The Alma at Ruaka today, get the highest response on social media; the first winner shall be awarded on Monday 8th April 2019. *Terms & Conditions Apply! Tag and follow the conversation on Facebook here;
- Cytonn was named as one of the strongest brands in East Africa; read the article here;
- Cytonn’s Chief Executive Officer (CEO), Edwin H. Dande spoke at the Founders Breakfast, see event note here;
- Caleb Mugendi - Investments Associate at Cytonn was on CNBC to discuss Market movement at the NSE. Watch Caleb here;
- Natasha Gichuki - Legal Assistant at Cytonn was on KBC Channel 1 to discuss estate management. Watch Natasha here;
- For an exclusive tour of the developments, visit: Sharp Investor’s Tour and for more information, email us at sales@cytonn.com;
- Following the recent approval by Retirement Benefits Authority (RBA), for Cytonn Asset Managers to manage pension funds, we are looking for business development consultants and agents with networks in the pensions industry to build our pensions business at very attractive commissions. If interested in being an agent or know someone who can be an agent, kindly contact us at pensions@cytonn.com;
- Following the completion and handover of Amara Ridge in Karen, we have now launched our next Karen project, dubbed Applewood, a Kshs 2.5 bn residential development located in Miotoni, Karen. This signature development shall comprise luxury homes, each sitting on 1/2 acre. We invite you to the exhibition of Applewood which is ongoing at the Amara Ridge Clubhouse (Location pin: https://goo.gl/maps/B3GVnu8pHyn) or at the Applewood Sales Centre on Miotoni Road (Location pin: https://goo.gl/maps/ZfABuGjFo1z) from 9:00 am to 5:00 pm daily. Call 0709 101 000 or email resales@cytonn.com to reserve a villa! See Video here;
- We continue to hold weekly workshops and site visits on how to build wealth through real estate investments. The weekly workshops and site visits target both investors looking to invest in real estate directly and those interested in high yield investment products to familiarize themselves with how we support our high yields. Watch progress videos and pictures of The Alma, Amara Ridge, and The Ridge. Key to note is that our cost of capital is priced off the loan markets, where all-in pricing ranges from 16.0% to 20.0%, and our returns on real estate developments range from 23.0% to 25.0%, hence our top-line gross spread is about 6.0%. If interested in attending the site visits, kindly register here;
- We continue to see very strong interest in our weekly Private Wealth Management Training (largely covering financial planning and structured products). The training is at no cost and is open only to pre-screened participants. We also continue to see institutions and investment groups interested in the training for their teams. Cytonn Foundation, under its financial literacy pillar, runs the Wealth Management Training. If interested in our Private Wealth Management Training for your employees or investment group, please get in touch with us through wmt@cytonn.com. To view the Wealth Management Training topics, click here;
- For recent news about the company, see our news section here;
- We have 10 investment-ready projects, offering attractive development and buyer targeted returns of around 23.0% to 25.0% p.a. See further details here: Summary of Investment-Ready Projects;
- We continue to beef up the team with ongoing hires for Financial and Real Estate Advisors for our offices in Nairobi, Nakuru, Kisumu, and Nyeri. Visit the Careers Section on our website to apply.
T-Bills & T-Bonds Primary Auction:
T-bills recorded an oversubscription during the week, with the subscription rate rising to 250.2%, from 183.7% recorded the previous week. The oversubscription was attributed to favorable liquidity in the market. The yields on the 91-day papers declined by 10 bps to 7.4% from 7.5% recorded the previous week, while those of the 182-day and 364-day papers declined by 1.5 bps and 2.3 bps to 8.2% and 9.4%, respectively. The acceptance rate improved to 70.9%, from 69.3% recorded the previous week, with the government accepting Kshs 42.7 bn of the Kshs 60.2 bn worth of bids received, higher than its weekly quantum of Kshs 24.0 bn. The subscription rate for the 91-day paper declined to 107.2%, from 167.4% recorded the previous week, while that of the 182-day and 364-day papers rose to 102.6% and 456.5% from 73.4% and 300.5% recorded the previous week, respectively. Investors’ participation remained skewed towards the longer dated paper, with the continued demand being attributable to the scarcity of newer short-term bonds in the primary market.
For the month of April, the Kenyan Government has issued 10-year (FXD 2/2019/10) and 20-year (FXD 1/2019/20) Treasury bonds, both with market determined coupon rates, in a bid to raise Kshs 50.0 bn for budgetary support. We expect the 10-year bond to generate more interest in the primary market with most investors avoiding the longer-tenor (20-year) bond due to the relatively flat yield curve on the long-end due to saturation of long-term bonds, coupled with the duration risk associated with long-term papers. Given that the Treasury bonds with the same tenor as the FXD 2/2019/10 & FXD 1/2019/20 are currently trading at yields of 12.1% and 12.7%, respectively, we expect bids to come in at 12.1% - 12.3% and 12.7% - 12.9% for the 10-year and 20-year bonds, respectively.
Liquidity:
The market remained relatively liquid with the average interbank rate coming in at 3.2%, which was a marginal rise from 2.8%, recorded the previous week. The marginal rise was due to demand as banks raised funds for tax payments with Pay as You Earn (PAYE) due on Tuesday 9th April. The average volumes traded in the interbank market rose by 23.0% to Kshs 3.6 bn, from Kshs 2.6 bn the previous week. This decline in the interbank rate points towards favourable liquidity conditions, driven partly by government payments, which offset tax remittances by banks.
Kenya Eurobonds:
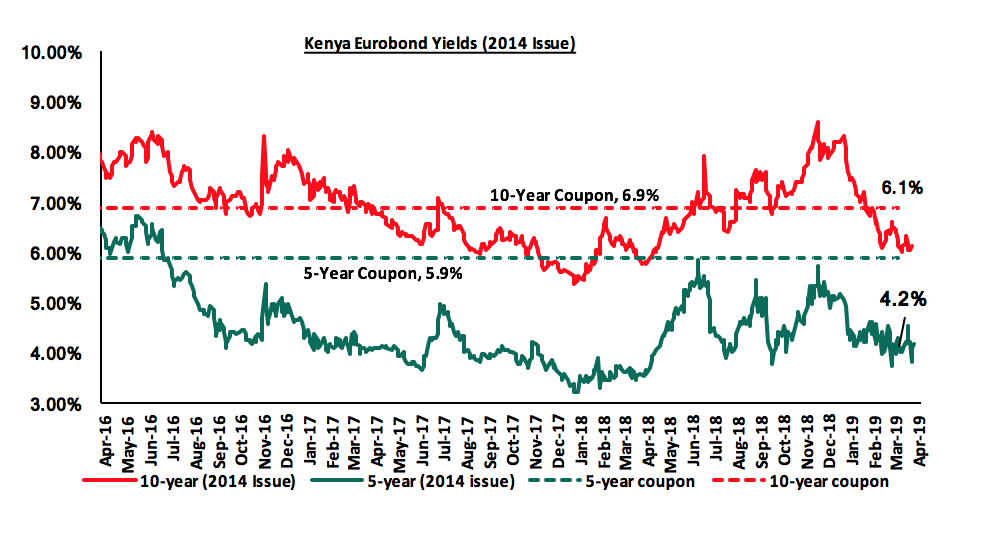
According to Bloomberg, the yield on the 10-year Eurobonds issued in 2014 declined by 0.1% points to 6.1% from 6.2%, while that of the 5-year remained unchanged at 4.2% as in the previous week. Since the mid-January 2016 peak, yields on the Kenyan Eurobonds have declined by 4.6% points and 3.5% points for the 5-year and 10-year Eurobonds, respectively, an indication of the relatively stable macroeconomic conditions in the country. Key to note is that these bonds have 0.2-years and 5.2-years to maturity for the 5-year and 10-year, respectively.
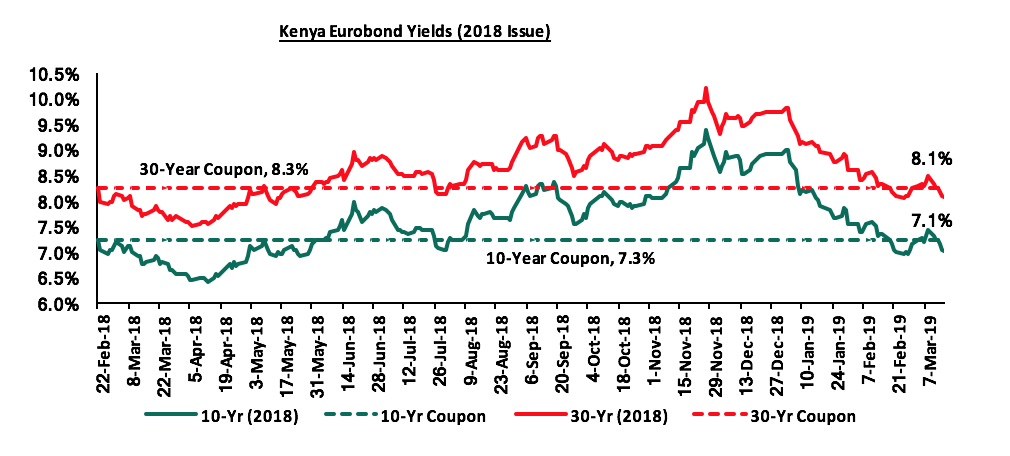
For the February 2018 Eurobond issue, during the week, the yields on 10-year Eurobond and 30-year Eurobond remained unchanged at 7.1% and 8.1%, respectively, from the previous week. Since the issue date, the yields on both the 10-year and 30-year Eurobond have both declined by 0.2% points.
The Kenya Shilling:
During the week, the Kenya Shilling appreciated marginally against the US Dollar to Kshs 100.7, from Kshs 100.8 the previous week propped up by diaspora remittances and reduced dollar demand from oil and merchandise importers. The Kenya Shilling has appreciated by 1.1% year to date, and in our view the shilling should remain relatively stable to the dollar in the short term, supported by:
- The narrowing of the current account deficit with preliminary data on balance of payments indicating continued narrowing to 4.7% of GDP in the 12-months to February 2019, from 5.5% recorded in February 2018. The decline has been attributed to improved agriculture exports, increased diaspora remittances, strong receipts from tourism, and lower food and SGR-related equipment relative to 2017,
- Improving diaspora remittances, which increased by 17.2% m/m in January 2018 to USD 244.8 mn from USD 208.9 mn recorded in a similar period of review in 2018. The rise is due to:
- Increased uptake of financial products by the diaspora due to financial services firms, particularly banks, targeting the diaspora, and,
- New partnerships between international money remittance providers and local commercial banks making the process more convenient,
- CBK’s supportive activities in the money market, such as repurchase agreements and selling of dollars, and,
- High levels of forex reserves, currently at USD 8.1 bn, equivalent to 5.3-months of import cover, above the statutory requirement of maintaining at least 4-months of import cover, and the EAC region’s convergence criteria of 4.5-months of import cover.
Highlight of the Week:
According to Stanbic Bank’s Monthly Purchasing Manager’s Index (PMI), the business environment in the country improved at a slower rate in March 2019. The seasonally adjusted PMI fell slightly coming in at 51.0 in March, a decline from 51.2 in February, and a 16-month low since the 42.8 recorded in November 2017. A PMI reading of above 50 indicates improvements in the business environment, while a reading below 50 indicates a worsening outlook. The slower improvement in business conditions was as a result of a slower rise in new orders which was linked to cash flow issues. Consequently, this led to only a modest increase in output levels and a slight rise in employment. Purchase prices rose at a subdued rate during the month as the rate of input inflation cooled for the sixth month in a row, with higher raw material costs being offset by lower fuel prices. We expect the business environment to improve going forward supported by improved purchasing activity due to suppressed inflation as well as improved weather conditions with the long rains expected to commence in April and boost output from the agricultural sector.
Rates in the fixed income market have remained relatively stable as the government rejects expensive bids, being currently 14.1% ahead of its domestic borrowing target for the current financial year, having borrowed Kshs 279.0 bn against a pro-rated target of Kshs 244.5 bn. A budget deficit is likely to result from depressed revenue collection, creating uncertainty in the interest rate environment as additional borrowing from the domestic market goes to plug the deficit. Despite this, we do not expect upward pressure on interest rates due to increased demand for government securities, driven by improved liquidity in the market owing to the relatively high debt maturities. Our view is that investors should be biased towards medium-term fixed income instruments to reduce duration risk associated with long-term debt, coupled with the relatively flat yield curve on the long-end due to saturation of long-term bonds.
Market Performance:
During the week, the equities market recorded mixed performances with NASI and NSE 25 gaining by 1.2% and 1.3%, respectively, while NSE 20 remained flat, taking their YTD performance to gains of 13.5%, 0.5% and 12.3%, for NASI, NSE 20 and NSE 25, respectively. The performance in NASI was driven by gains in large cap stocks such as Equity Group, KCB Group and Safaricom, which gained by 4.0%, 1.7% and 1.6%, respectively.
Equities turnover declined by 10.4% during the week to USD 27.5 mn, from USD 30.7 mn the previous week, taking the YTD turnover to USD 473.8 mn. Foreign investors remained net buyers for the week, although the net buying position declined by 93.7% to USD 0.5 mn, from last week’s net buying position of USD 7.2 mn.
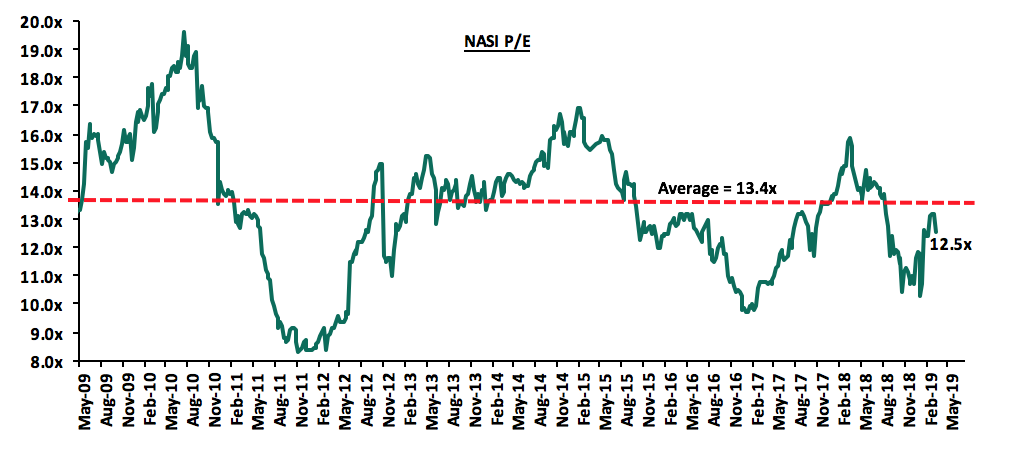
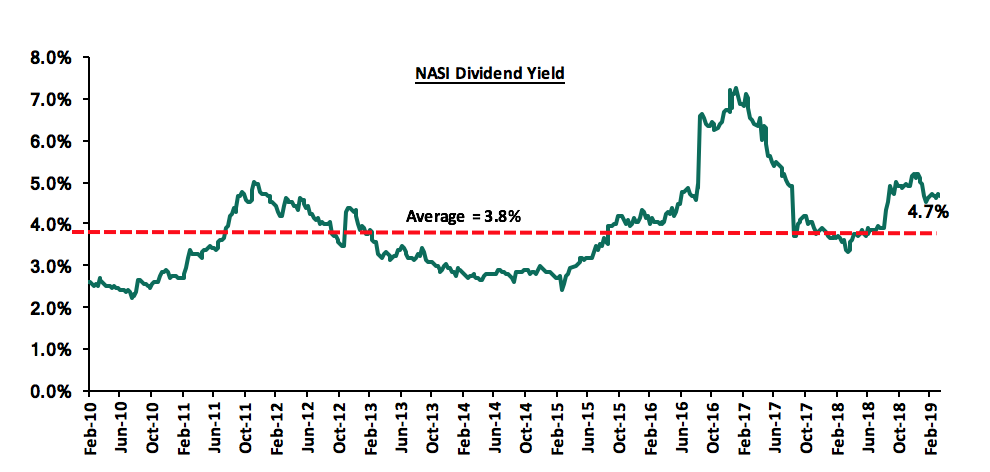
The market is currently trading at a price to earnings ratio (P/E) of 12.5x, 6.7% below the historical average of 13.4x, and a dividend yield of 4.7%, above the historical average of 3.8%. With the market trading at valuations below the historical average, we believe that value exists in the market. The current P/E valuation of 12.5x is 28.9% above the most recent trough valuation of 9.7x experienced in the first week of February 2017, and 50.6% above the previous trough valuation of 8.3x experienced in December 2011. The charts below indicate the historical P/E and dividend yields of the market.
Weekly Highlights
During the week, the Financial Access (FinAccess) Household Survey 2019 report was released. The survey, which was jointly conducted by the Kenya National Bureau of Statistics (KNBS), The Central Bank of Kenya (CBK) and Financial Sector Deepening (FSD) Kenya, highlighted the rise in the level of financial inclusion in Kenya with 82.9% of the adult population having access to formal financial services and products, up from 75.3% in 2016. Key take-outs from the report include:
- 89.0% of the population can access both formal and informal financial services and products, an increase from the 82.5% inclusion in 2016. The rise in the level of financial inclusion has largely been attributable to increased innovation, and a proliferation of digital financial access channels such as mobile banking applications developed by various banks, agency banking, and digital lending applications,
- Nairobi region maintained the highest level of formal inclusion, at 96.0%, followed by Mombasa, Central Rift Valley, and Central Kenya, with inclusions of 94.0%, 88.0%, and 85.0%. The rise in inclusion, cements Kenya’s third position, after South Africa and Seychelles, which have 95.0%, and 90.0% inclusion, and,
- In terms of use of financial services by channel, digital loan apps recorded the fastest growth, accounting for 8.3% of usage, from a paltry 0.6% usage in 2016. Mobile money, mobile banking and insurance recorded improvements to 79.4%, 25.3% and 27.9%, from 71.4%, 17.5% and 23.2% in 2016.
We note that despite the increased usage of mobile banking channels, the proportion of the population using the channels is still relatively low at 25.3%, which should provide significant growth runway for banks to exploit as they grow transactional income generated from these applications. Microfinance Institutions (MFIs) however recorded a decline in usage, to 1.7% from 3.6% in 2016, largely affected by the uptake of mobile banking products, rapid uptake of digital loans apps, and increasing role of mobile money. We are of the view that the rapid increase in digital lending apps’ prominence should signal the need of regulation of this space. Going forward, we expect service and product providers to focus on innovation with the aim of improving the quality of products and services provided as competition increases.
KCB Group’s bid to acquire Imperial Bank Limited under Receivership (IBLR), reached a significant milestone, with the acceptance of KCB Group’s final offer by both the Central Bank of Kenya and the Kenya Deposit Insurance Corporation (KDIC). The transaction will see an additional 19.7% of deposits availed to depositors, an addition to the 35.0% availed, on the acceptance of the binding offer by KDIC and CBK in December 2018. The remaining deposit balances will be availed to depositors in three tranches, 12.5% after the official signing of the agreement, a further 12.5% one-year after the signing of the agreement, and 25.0% balance on the second, third and fourth anniversaries of the signing of the agreement. The split of the 25.0% deposits in the second, third and fourth anniversaries is however yet to be disclosed. The deposits will continue to earn interest in line with KCB’s prevailing deposit rates on its products. However, the recovery does not include the realization of approximately Kshs 36.0 bn of loans, translating to 50.0% of the current loan balances, linked to ongoing litigation. KCB confirmed that it would take over five branches of IBLR, out of the 26 that IBLR had prior to going under receivership. We note that as the transaction nears completion, this would mark the second instance a bank is brought out of receivership, after the concluded deal that saw SBM Kenya complete the acquisition of certain assets and liabilities of Chase Bank Limited (under Receivership). We view this as a significant step towards instilling confidence on the existence of robust frameworks for the resolution of issues affecting the banking sector, which should consequently boost the sector’s stability.
Universe of Coverage
Below is a summary of our SSA universe of coverage:
Kenyan banks have been excluded, as they are under review following the release of the FY’2018 results.
|
SUMMARY OF THE SSA UNIVERSE OF COVERAGE |
||||||||||
|
Banks |
Price as at 29/03/2019 |
Price as at 5/04/2019 |
w/w change |
YTD Change |
Year Open |
Target Price* |
Dividend Yield |
Upside/ Downside** |
P/TBv Multiple |
Recommendation |
|
GCB Bank |
4.0 |
3.9 |
(1.5%) |
(14.3%) |
4.6 |
7.7 |
9.6% |
105.6% |
0.9x |
Buy |
|
UBA Bank |
7.7 |
6.2 |
(19.5%) |
(19.5%) |
7.7 |
10.7 |
13.7% |
86.3% |
0.5x |
Buy |
|
Zenith Bank |
21.8 |
20.4 |
(6.7%) |
(11.7%) |
23.1 |
33.3 |
13.3% |
77.0% |
1.0x |
Buy |
|
Access Bank |
6.5 |
5.7 |
(11.6%) |
(16.2%) |
6.8 |
9.5 |
7.0% |
73.7% |
0.4x |
Buy |
|
CRDB |
125.0 |
125.0 |
0.0% |
(16.7%) |
150.0 |
207.7 |
0.0% |
66.2% |
0.4x |
Buy |
|
Ecobank |
8.0 |
8.0 |
0.0% |
7.1% |
7.5 |
10.7 |
0.0% |
33.6% |
1.8x |
Buy |
|
CAL Bank |
1.1 |
1.1 |
0.0% |
7.1% |
1.0 |
1.4 |
0.0% |
33.3% |
0.9x |
Buy |
|
Union Bank Plc |
6.7 |
7.0 |
5.3% |
25.0% |
5.6 |
8.2 |
0.0% |
16.4% |
0.7x |
Accumulate |
|
SBM Holdings |
6.0 |
6.0 |
(0.3%) |
0.0% |
6.0 |
6.6 |
5.0% |
15.1% |
0.9x |
Accumulate |
|
Bank of Kigali |
275.0 |
275.0 |
0.0% |
(8.3%) |
300.0 |
299.9 |
5.0% |
14.1% |
1.5x |
Accumulate |
|
Guaranty Trust Bank |
36.1 |
35.0 |
(2.9%) |
1.6% |
34.5 |
37.1 |
6.9% |
12.9% |
2.3x |
Accumulate |
|
Bank of Baroda |
130.0 |
130.0 |
0.0% |
(7.1%) |
140.0 |
130.6 |
1.9% |
2.4% |
1.1x |
Lighten |
|
Stanbic Holdings |
100.0 |
100.0 |
0.0% |
10.2% |
90.8 |
92.6 |
5.9% |
(1.6%) |
1.0x |
Sell |
|
Standard Chartered Ghana |
20.0 |
20.0 |
0.0% |
(4.8%) |
21.0 |
19.5 |
0.0% |
(2.7%) |
2.5x |
Sell |
|
Standard Chartered Bank Kenya |
215.3 |
215.3 |
0.0% |
10.7% |
194.5 |
196.3 |
5.8% |
(3.0%) |
1.7x |
Sell |
|
FBN Holdings |
8.2 |
7.4 |
(10.4%) |
(7.5%) |
8.0 |
6.6 |
3.4% |
(6.4%) |
0.5x |
Sell |
|
Stanbic IBTC |
46.0 |
46.3 |
0.5% |
(3.5%) |
48.0 |
37.0 |
1.3% |
(18.7%) |
2.4x |
Sell |
|
Ecobank Transnational |
13.2 |
11.6 |
(12.1%) |
(31.8%) |
17.0 |
9.3 |
0.0% |
(20.0%) |
0.5x |
Sell |
*Target Price as per Cytonn Analyst estimates
**Upside / (Downside) is adjusted for Dividend Yield
***Banks in which Cytonn and/or its affiliates holds a stake.
****Stock prices indicated in respective country currencies
Kenyan banks are currently under review following the release of the FY’2018 results
We are “Positive” on equities for investors as the sustained price declines have seen the market P/E decline to below its historical average. We expect increased market activity, and possibly increased inflows from foreign investors, as they take advantage of the attractive valuations, to support the positive performance.
Britam Holdings Limited, a diversified financial services group with operations in Kenya, Tanzania, South Sudan, Uganda, Rwanda, Malawi and Mozambique announced its intention to acquire an undisclosed stake in Tiserin Capital, following approval from its board of directors. Nairobi-based Tiserin Capital, is a private equity firm that manages the Tiserin Capital Fund, which invests in companies with enterprise values of less than Kshs 5.1 bn (USD 50.0 mn) in East Africa, Ethiopia, Mozambique and South Africa taking up a controlling stake or a strong minority position. Tiserin Capital seeks to partner with Asian and Latin American companies to enhance the operating capabilities of its portfolio companies by transferring industrial and managerial know-how. The Fund focuses on Agribusiness, Fast Moving Consumer Goods, Food Retail, Healthcare, and the Technology sector. With the move, Britam seeks to diversify its investments beyond traditional investments as the acquisition will offer Britam indirect ownership in the private firms that Tiserin Capital will invest in. Britam Asset Managers, a subsidiary of Britam Holdings Limited in January of this year, bought a 40.0% stake worth Kshs 1.4 bn in a local electricity producer, Gulf Energy, through a New York-based energy investment vehicle Everstrong Capital. We are of the view that the acquisition is driven by private equity investments in Africa remaining robust and the need for investment managers to diversify their investments and grow their return as evidenced by the increasing investor interest, which is attributed to; (i) rapid urbanization, (ii) a resilient and adapting middle class and increased consumerism, (ii) the attractive valuations in Sub Saharan Africa’s private markets compared to its public markets, (iv) the attractive valuations in Sub Saharan Africa’s markets compared to global markets, and (v) better economic projections in Sub Saharan Africa compared to global markets.
Kudi, a Nigeria based Financial Technology (FinTech) company focused on digital payments and collections, raised USD 5.0 mn (Kshs 503.6 mn) in Series A funding. The funding round was led by San Francisco based Partech Ventures, an investment firm that finances and supports technology and digital companies. The funding round was also joined by Michael Seibel, the CEO and a partner at Y Combinator, an American based seed accelerator. Existing investors Khosla Ventures and Y Combinator also participated in the funding round. Kudi has raised a total of USD 6.7 mn, having raised USD 1.7 mn in seed capital. Kudi seeks to make financial services accessible and affordable for all Africans, and they achieve this by enabling the underbanked and unbanked Africans access to basic financial services like money transfers, bill payments and cash withdrawals through an agent network and through mobile phones. Since its launch in January 2017, Kudi has grown its agent network to over 4,500 merchants and is adding new agents every day. The company makes it easy for agents to sign-up and have more visibility into the company’s day-to-day operations. They process over USD 30.0 mn (Kshs 3.0 bn) in payments each month. Kudi will use the funding to grow its team, grow its agent network, develop and launch new financial services products such as savings, loans and insurance and build partnerships with banks and other FinTech companies.
FinTech remains the most attractive sector and was the highest funded sector for investors in 2018 with 4 of the 10 largest deals made in 2018 being from this sector. The growth in the funding of FinTech companies is expected to improve due to;
- High Returns - According to data collected by Crunchbase, since 2007, Fintech start-ups have raised an average of USD 41.0 mn in Venture Capital and exited for an average value of USD 242.9 mn. This gives investors a better opportunity to invest in a sector that attracts a growing pool of new investors and in the end exit at a high price,
- Attractive Realization Periods - Private equity firms typically focus on investing for a short lead-time, often between three to five years. Many Fintech companies start showing profits by year three hence giving a chance for investors to realize their gains in time, and,
- Cheaper Running Costs - They are cheaper to run since a FinTech company is not weighed down by the same burden of costly regulation that governs traditional businesses. This makes PE firms to manage their FinTech portfolio with easy flexibility.
FinTech lending and microfinance institutions in general have been a major attraction for investors in Kenya and Sub-Saharan Africa. Lack of access to finance is a major issue for entrepreneurs and Micro, Small and Medium Enterprises (MSMEs) across Africa. According to the IMF, there are 44.2 mn MSMEs in Sub-Saharan Africa with a potential demand for USD 404.0 bn in financing. The current volume of financing in Sub-Saharan Africa is estimated at USD 70.0 bn signifying a huge financing gap of USD 331.0 bn. Microfinance institutions aim to bridge this gap by offering convenient access to credit.
The European Investment Bank announced a EUR 25.0 mn investment in the Amethis Fund II, the second pan-African investment vehicle of the Amethis, an investment fund manager dedicated to long-term responsible investments in Africa. Amethis Fund II follows the same investment strategy as Amethis Fund I by providing growth capital to African mid-cap champions, through investments with an average ticket size of EUR 10.0 mn-EUR 30.0 mn or more through co-investment. Other investors in the fund include the International Finance Corporation (IFC) and Proparco, and Bpifrance, the French public investment bank. In February 2019, Amethis announced an intermediary closing of its Fund II at EUR 305.0 mn. The additional funding brings the total raised amount to EUR 330.0 mn. Amethis, manages two other funds, Amethis Fund I (PanAfrican focus, EUR 250.0 mn), part of which is invested in Kenya’s Kenfric, a fast moving consumer goods (FMCG) manufacturer and distributor with a strong focus on confectionary ,and Amethis Maghreb Fund I (North African focus, EUR 75.0 mn) and advises Amethis West Africa (West African focus, EUR 45.0 mn). Amethis Fund II aims for geographic and sector diversification, targeting sectors delivering goods and services to the middle class of African consumers: industry, distribution, consumer goods, financial services, telecommunications, health and education. Amethis Fund II focuses on countries that have an economic growth driven by their strong domestic demand and that are resistant to global headwinds. The continued capital-raising initiatives signify the increasing investor interest in the region, with investors looking to tap into the opportunities in the fast-growing private equity industry.
We maintain a positive outlook on private equity investments in Africa as evidenced by the increasing investor interest, which is attributed to; (i) economic growth, which is projected to improve in Africa’s most developed PE markets, (ii) attractive valuations in Sub Saharan Africa’s private markets compared to its public markets, and (iii) attractive valuations in Sub Saharan Africa’s markets compared to global markets. Going forward, the increasing investor interest, stable macro-economic and political environment will continue to boost deal flow into African markets.
- Commercial Office
Businesses continue to relocate their offices from the Central Business District (CBD) to upcoming business nodes in search of more exclusive locations, ample space, tranquility, and less congestion. During the week, I&M Bank announced that they will be relocating their head office from the Nairobi CBD to 1 Park Avenue building located in Parklands, come August this year. The new age building will be part of the real estate investment portfolio of the bank’s property arm, I&M Realty. The 12,358 SQM building, whose cost remains undisclosed, will be partially owner-occupied while the rest of the space will be let out. According to the Nairobi Metropolitan Area Commercial Office Report 2019, Parklands area was one of the best performing areas in the commercial sector, recording a rental yield and occupancy rate of 8.4% and 86.0%, respectively, 0.3% points and 2.7% points above the market average of 8.1% and 83.3%, respectively, in FY’2018. This was mainly attributed to increased demand for office space by multinational companies given the supply of quality Grade A offices in the submarket, which in end enables developers to charge a premium on rentals.
The table below shows the FY’2018 performance of commercial office submarkets in Nairobi:
|
All values in Kshs unless stated otherwise |
||||
|
Nairobi Commercial Office Submarket Performance FY’2018 |
||||
|
Commercial Nodes |
Price Kshs/ SQFT FY 2018 |
Rent Kshs/SQFT FY 2018 |
Occupancy FY 2018(%) |
Rental Yield (%) FY 2018 |
|
Gigiri |
13,833 |
141 |
88.3% |
10.5% |
|
Karen |
13,666 |
118 |
88.6% |
9.2% |
|
Westlands |
12,050 |
110 |
82.1% |
9.0% |
|
Parklands |
12,494 |
102 |
86.0% |
8.4% |
|
Kilimani |
13,525 |
99 |
88.3% |
8.0% |
|
Upperhill |
12,560 |
100 |
80.7% |
7.9% |
|
Nairobi CBD |
12,425 |
89 |
88.3% |
7.6% |
|
Thika Road |
12,517 |
86 |
81.5% |
6.7% |
|
Mombasa Road |
11,400 |
79 |
65.6% |
5.8% |
|
Average |
12,719 |
103 |
83.3% |
8.1% |
|
· Gigiri, Karen and Westlands recorded the highest rental yields at 10.5%, 9.2%, and 9.0%, respectively, attributed to increased demand by businesses and multinational companies due to proximity to CBD and other business nodes, high quality office space and relatively good infrastructure network, · Thika Rd and Mombasa Rd, had the lowest returns with average rental yields of 6.7% and 5.8%, respectively attributed to traffic snarl-ups and low-quality office space |
||||
Source: Cytonn Research 2019
We expect local and multinational companies to continue focusing on high return areas such as Parklands, Westlands, Karen and Gigiri, with the aim of maximizing on returns in addition to leveraging on the high-quality office spaces in the areas. These will eventually result in the significant growth of the areas as commercial nodes, as firms seek to settle further from the congested Nairobi CBD.
- Listed Real Estate
On 3rd April, 2019, the Nairobi Securities Exchange (NSE) admitted property development company, ‘My Space Properties’, under the Ibuka Incubator Programme, following a successful vetting of the subject company. The incubator experience is intended to give companies a realistic and practical feel of the listing process, as the interested firms have an opportunity to participate in a stage by stage, one on one, structured engagement with the Capital Markets Authority, the Nairobi Securities Exchange, Nominated Advisors (NOMADS), transaction advisors, lawyers, auditors, stockbrokers and investment banks, among other service providers, to allow for confidential Business-to-Business( B2B) discussions on their readiness for listing. My Space Properties plans to officially list after the incubation making it the second property developer to be listed in Kenya, the first one being Home Afrika Limited, which went public on 15th July 2013. We, however, note that listed real estate investment stocks have so far been performing poorly with low subscriptions and price declines, post listing;
- Home Afrika was listed at an IPO price of Kshs 12.0 per share and has since lost 95.0% of its value to a price of Kshs 0.6 as at 5th April 2019,
- Stanlib Fahari i-REIT achieved only 29.0% subscription and is currently trading at Kshs 10.1 per unit, 49.5% below its listing price of Kshs 20.0 as at 27Th Nov 2015, and
- The Fusion D-REIT, in 2016, failed to list after attaining only 38.0% subscription, and thus failing to raise at least half of the initial gross proceeds it had targeted.
In our view, the main reasons listed real estate stocks have failed to gain momentum include inadequate investor knowledge and the poor performance of the same, for example with Home Afrika recording a 95.0% decline in the value of its share from its initial listing value. The development of a vibrant real estate capital market is necessary given;
- the large amount of funding required for the reduction of the existing housing deficit in Kenya,
- the traditional sources of real estate funding, such as bank debt and private equity, are not sufficient to meet the financing demands required by real estate which is capital intensive, and
- the low credit lending to the private sector as the actual cost of credit remains high averaging at 16.7% due to additional administration fees, which raises the cost of development, thus making real estate development expensive for both developers and off-takers.
In order to improve the uptake and performance of listed real estate, the following needs to be done;
- creation of awareness of the stocks thus enhance investor knowledge and confidence in the same,
- broad institutional support,
- simplify the process of incorporation to have a one stop shop solution,
- the new products may also require initially an industry initiative or government sponsorship, thus rather than each player trying to launch their own REIT, a few strong real estate and investment players should collaborate on a club deal that has broad support with the goal of not just economic viability but also proofing the REIT concept to the market,
- bringing down the minimum amounts required for investments, as the current amounts, for example, the minimum of Kshs. 5 million for the Fusion D-REIT is very high and locks out most investors,
- most traditional money houses such as banks are not real estate specialists, yet REIT trustees are almost all banks, who are not historically good at alternative assets product innovation and development; the pool for REIT Trustees needs to be broadened, and
- improved corporate governance around issuance.
We expect the real estate sector to continue recording increased activities supported by the continued demand for office space in prime locations in addition to improved diversification of avenues aimed at raising capital by investors in the sector.
The Nairobi Metropolitan Area (NMA) Commercial Office Report released annually aims to inform on supply, performance and the investment opportunity in the NMA Commercial Office Market. As per the Report-Market Review 2017, released in 2018, the commercial office sector had a surplus of 4.7 mn SQFT of office space, with average occupancy rates and rental yields coming in at 82.6% and 7.9%, respectively, 5.4% points and 0.6% point lower than 2016’s performance at 88.0% and 8.5%, respectively. The subdued performance was mainly attributed to a tough operating environment in 2017, with i) low credit supply as a result of the implementation of the Banking Amendment Act 2015, and ii) political uncertainty as 2017 was an election year, both factors leading to slower commercial activities thus reduced demand for office space amid the increasing supply of the same.
In this report in 2019, we updated our findings with data from 2018, where we found that performance improved, albeit marginally. The sector recorded a 0.2% points and 0.7%-points y/y increase in average rental yields and occupancy rates, to 8.1% and 83.3%, respectively, on account of an improved macroeconomic environment and the continued positioning of the Nairobi Metropolitan Area (NMA) as a regional hub, thus attracting investors who require office spaces.
This week, we cover the Nairobi Metropolitan Area Commercial Office market by looking at the following:
- Introduction to the Commercial Office Sector in the Nairobi Metropolitan Area (NMA),
- Commercial Office Supply in the Nairobi Metropolitan Area,
- Commercial Office Performance, by Location and by Grades, and
- Office Market Outlook and the Investment Opportunity in the Sector.
- Introduction to the Commercial Office Sector in the Nairobi Metropolitan Area (NMA):
The Nairobi Metropolitan Area’s positioning as a regional hub continues to set it apart as an investment destination, supporting the growth of the office sector.
The commercial office sector continued to record increased supply, with 4.3 mn SQFT of new office stock being delivered into the NMA market in 2018, 23.9% higher 3.5 mn SQFT completed in 2017. The main factors that have contributed to NMA’s attractiveness to investors include;
- Recognition as a Regional Hub - This has seen international organizations such as Nairobi Overseas Centre by Enterprise Singapore open offices in the Nairobi Metropolitan Area (NMA) signaling the robustness of NMA’s commercial scene,
- Positive Investment Ranking - In 2019, Nairobi was ranked #6 as the most dynamic city in the world according to JLL’s City Momentum Index, up 4 positions from #10 in 2018, attributable to infrastructural investment and the robust start-up culture. In addition, the EY Attractiveness Report 2018, recorded a 68% increase in inward investment projects within the country. This has, in turn, boosted the appeal of the city to local and international firms and favored property development by investors, and,
- The Growth of Small and Medium Sized Enterprises (SMEs) – SMEs contribute approximately 45% of Kenya’s GDP, 80% of employment in Kenya and constitute 98% of businesses locally according to a CNBC News Report 2014 and are thus a key driver for the commercial office sector.
In spite of the highlighted drivers, a number of factors have constrained performance in the sector including:
- Accessibility to Finance - Despite the capping of banking interest rates, the actual cost of credit remains high averaging at 16.7% due to additional administration fees, which raises the cost of development, thus making real estate development expensive for both developers and off-takers. This lack of affordable funding for development has resulted in the use of expensive debt in the funding structure thus affecting the supply of office spaces due to its capital-intensive nature,
- Oversupply of office Space – Real estate developers have focused heavily on construction of office buildings attributed to the relatively high yields in the commercial office market at 8.1%, compared to the real estate market average of 7.4%, leading to a supply of 9.0 mn SQFT in 2018, against a demand of 3.8 mn SQFT, hence an oversupply of 5.2 mn SQFT, and
- Insufficient Infrastructure- The rate of real estate development and increased commercial activity has by far exceeded the rate of infrastructural improvement causing strains on the trunk infrastructure driving up real estate development costs as developers resort to financing any infrastructural inadequacies.
- Commercial Office Supply in Nairobi Metropolitan Area
Total commercial office stock increased by 10.4% to 35.5 mn SQFT in 2018 from 31.5 mn SQFT in 2017.
In 2018, the total office stock in Nairobi increased by 10.4% to 35.5 mn SQFT, from 31.5 mn SQFT in 2017, driven by completion of office complexes such as Prism Towers (482,000 SQFT) in Upper Hill, One Africa Place (138,004 SQFT) and The Promenade (215,999 SQFT) in Westlands, and Victoria Towers (85,002 SQFT) in Two Rivers along Limuru Road. Office space supply has grown at a 23.6% CAGR between 2012 and 2018, driven by demand from growing SMEs and multinationals setting up operations in the country being the regional hub for East Africa.
The table below summarizes the commercial office space supply over time:
|
Commercial Office Space Supply Analysis |
|||||||||||||
|
Year |
2011 |
2012 |
2013 |
2014 |
2015 |
2016 |
2017 |
2018 |
2019F |
2020F |
2021F |
2022F |
6-yr (2012-2018) CAGR |
|
Stock (mn SQFT) |
6.7 |
7.7 |
9.7 |
15.4 |
22.9 |
28.9 |
31.8 |
35.5 |
38.2 |
41.2 |
44.1 |
47.0 |
28.9% |
|
Completions (mn SQFT) |
1.2 |
2.1 |
5.9 |
7.8 |
6.5 |
3.5 |
4.3 |
3.4 |
3.8 |
3.8 |
3.8 |
23.6% |
|
|
Vacancy Rate (%) |
9.0% |
9.0% |
10.0% |
10.0% |
11.0% |
12.0% |
16.8% |
16.7% |
16.7% |
16.0% |
15.0% |
14.0% |
10.9% |
|
Vacant Stock (mn SQFT) |
0.6 |
0.7 |
1.0 |
1.5 |
2.5 |
3.5 |
5.3 |
5.9 |
6.4 |
6.6 |
6.6 |
6.6 |
42.9% |
|
Occupied Stock (mn SQFT) |
6.1 |
7.1 |
8.8 |
13.9 |
20.3 |
25.4 |
26.5 |
29.6 |
31.8 |
34.6 |
37.5 |
40.4 |
27.0% |
|
Net Absorption (mn SQFT) |
1.0 |
1.7 |
5.1 |
6.5 |
5.1 |
1.0 |
3.1 |
2.2 |
2.8 |
2.9 |
2.9 |
21.1% |
|
|
Demand (mn SQFT) |
1.1 |
1.9 |
5.3 |
6.8 |
5.6 |
1.6 |
3.7 |
2.9 |
3.5 |
3.7 |
3.8 |
22.6% |
|
|
Available Supply, AS(T) |
1.7 |
2.6 |
6.5 |
8.8 |
8.4 |
6.3 |
9.0 |
8.6 |
9.0 |
9.5 |
9.4 |
32.5% |
|
|
Under(Over)supply |
(0.5) |
(0.8) |
(1.2) |
(2.1) |
(2.9) |
(4.7) |
(5.2) |
(5.6) |
(5.8) |
(5.7) |
(5.6) |
||
|
· Assuming we retain the 2018 occupancy rates and the expected 2019 commercial office completions at 3.4 mn SQFT, we expect oversupply to increase by 7.6% to 5.6 mn SQFT in 2019 from 5.2 mn SQFT in 2018 |
|||||||||||||
Source: Cytonn Research 2018, Building Plan Approvals Data from the Nairobi City County
Over the next two-years, we expect the forces of demand and supply to come into play and office space completions to decline by a 2-year CAGR of 6.0% to 3.8 mn SQFT in 2020, from 4.3 mn SQFT recorded in 2018. Assuming we retain the 2018 occupancy rates and the expected 2019 commercial office completions at 3.4 mn SQFT, we expect oversupply to increase by 7.6% to 5.6 mn SQFT in 2019 from 5.2 mn SQFT in 2018. For more information on the commercial office supply calculation, see the Nairobi Metropolitan Area Commercial Office Report 2019.
- Commercial Office Performance, by Location and by Grades:
The sector recorded a 0.2% points increase in rental yields to 8.1% in 2018, from 7.9% in 2017, driven by an improved macroeconomic environment and the positioning of Nairobi Metropolitan Area as a regional hub.
In 2018, the commercial office sector recorded an average rental yield of 8.1%, at an average occupancy of 83.3%, monthly rental charges of Kshs 103 per SQFT, and price per SQFT of Kshs. 12,719. The overall performance improved marginally in 2018, recording 0.2% points and 0.7% points y/y increase in average rental yields and occupancy rates, to 8.1% and 83.3% from 7.9% and 82.6%, respectively, in 2017. The positive performance was largely driven by:
- Political stability that led to an improved macroeconomic environment and attracted more tenants to office space, with the GDP growing to 6.0% in Q3’2018, higher than the 4.7% recorded in Q3’2017, and expected to close at 5.8% for the year 2018, and,
- The positioning of the Nairobi Metropolitan Area as a regional hub and thus increased entrance of multinationals creating demand for commercial offices.
Asking rents increased marginally by 1.6% to an average of Kshs 103 per SQFT, from Kshs 101 per SQFT in 2017, while asking prices increased by 0.6% to Kshs 12,719 in 2018, from Kshs 12,649 in 2017. The slow rise in rents and prices is attributed to the oversupply of 5.2 mn SQFT office space as at 2018, which has created a bargaining chip for firms forcing developers to reduce or maintain prices and rents in order to remain competitive and attract occupants to their office spaces.
The table below summarizes the performance of the commercial office theme over time:
|
(All Values in Kshs Unless Stated Otherwise) |
||||||||
|
Commercial Office Market Performance Summary |
||||||||
|
2011* |
2013* |
2015* |
2016* |
2017* |
2018 |
y/y ∆ 2017 |
y/y ∆ 2018 |
|
|
Occupancy (%) |
91.0% |
90.0% |
89.0% |
88.0% |
82.6% |
83.3% |
(5.4%) |
0.7% |
|
Asking Rents (Kshs/SQFT) |
78 |
95 |
97 |
97 |
101 |
103 |
4.2% |
1.6% |
|
Average Prices (Kshs/SQFT) |
10,557 |
12,433 |
12,776 |
12,031 |
12,649 |
12,719 |
5.1% |
0.6% |
|
Average Rental Yields (%) |
8.1% |
8.3% |
8.1% |
8.5% |
7.9% |
8.1% |
(0.6%) |
0.2% |
|
*Rental yields for FY’11 to FY’17 restated to include average market occupancy rates. The average rental yield for offices published in our previous reports assumed 100% occupancy rates · Average rental yields and occupancy rates increased by 0.2% points and 0.7% points, respectively to 8.1% and 83.3% in 2018 from 7.9% and 82.6%, respectively in 2017, due to the increased demand driven by increased economic activities as a result of the improved macroeconomic environment and positioning of the Nairobi Metropolitan Area as a regional hub · Asking rents increased marginally by 1.6% to an average of Kshs 103 per SQFT in 2018, from Kshs 101 per SQFT in 2017 attributed to an oversupply of 5.2 mn SQFT office space as at 2018, which has created a bargaining chip for firms forcing developers to reduce or maintain prices and rents in order to remain competitive and attract occupants to their office spaces |
||||||||
Source: Cytonn Research 2018
- Performance by Nodes: Gigiri and Karen recorded the highest yields of 10.5% and 9.2%, respectively, being prime locations with quality offices
For submarket analysis, we classified the main office nodes in the Nairobi Metropolitan Area into 9 nodes: i) Nairobi CBD, ii) Westlands, covering environs including Riverside, iii) Parklands, iv) Mombasa Road, v) Thika Road, vi) Upperhill, vii) Karen, viii) Gigiri, and ix) Kilimani, which includes offices in Kilimani, Kileleshwa and Lavington.
Gigiri, Karen and Westlands were the best performing nodes in 2018, recording rental yields of 10.5%, 9.2%, and 9.0%, respectively, attributed to increased demand by businesses and multinational companies due to their proximity to the Central Business District (CBD) and other business nodes, high quality office space and relatively good infrastructure network.
Thika Road and Mombasa Road were the worst performing nodes recording rental yields of 6.7% and 5.8%, respectively, due to the lack of quality offices and the prevalence of traffic snarl-ups that have made them generally unattractive to firms.
The nodal office performance is as summarized in the table below:
|
(All Values in Kshs Unless Stated Otherwise) |
|||||||||||
|
Commercial Office Market Performance by Node |
|||||||||||
|
Commercial Nodes |
Price Kshs/ SQFT FY 2018 |
Rent Kshs/SQFT FY 2018 |
Occupancy FY 2018(%) |
Rental Yield (%) FY 2018 |
Price Kshs/ SQFT FY 2017 |
Rent Kshs/SQFT FY 2017 |
Occupancy FY 2017(%) |
Restated Rental Yield (%) FY 2017 |
∆ Rent Y/Y |
∆ Occupancy Y/Y (% points) |
∆ Rental Yields Y/Y (% points) |
|
Gigiri |
13,833 |
141 |
88.3% |
10.5% |
13,750 |
138 |
81.4% |
9.8% |
1.9% |
6.9% |
0.7% |
|
Karen |
13,666 |
118 |
88.6% |
9.2% |
13,167 |
113 |
89.2% |
9.2% |
4.7% |
(0.6%) |
0.0% |
|
Westlands |
12,050 |
110 |
82.1% |
9.0% |
12,872 |
103 |
88.5% |
8.5% |
6.5% |
(6.4%) |
0.5% |
|
Parklands |
12,494 |
102 |
86.0% |
8.4% |
12,729 |
103 |
85.7% |
8.3% |
(0.9%) |
0.3% |
0.1% |
|
Kilimani |
13,525 |
99 |
88.3% |
8.0% |
12,995 |
99 |
82.0% |
7.5% |
(0.1%) |
6.3% |
0.5% |
|
Upperhill |
12,560 |
100 |
80.7% |
7.9% |
12,901 |
101 |
84.5% |
7.9% |
(1.2%) |
(3.8%) |
(0.1%) |
|
Nairobi CBD |
12,425 |
89 |
88.3% |
7.6% |
12,286 |
88 |
84.1% |
7.2% |
0.9% |
4.2% |
0.4% |
|
Thika Road |
12,517 |
86 |
81.5% |
6.7% |
11,500 |
82 |
73.6% |
6.3% |
5.3% |
7.9% |
0.4% |
|
Msa Road |
11,400 |
79 |
65.6% |
5.8% |
11,641 |
82 |
74.2% |
6.3% |
(4.0%) |
(8.6%) |
(0.5%) |
|
Average |
12,719 |
103 |
83.3% |
8.1% |
12,649 |
101 |
82.6% |
7.9% |
1.6% |
0.7% |
0.2% |
|
· Gigiri, Karen and Westlands recorded the highest rental yields at 10.5%, 9.2%, and 9.0%, respectively, attributed to increased demand by businesses and multinational companies due to proximity to CBD and other business nodes, high quality office space and relatively good infrastructure network, · Thika Rd and Mombasa Rd, had the lowest returns with average rental yields of 6.7% and 5.8%, respectively attributed to traffic snarl-ups and low-quality office space |
|||||||||||
Source: Cytonn Research 2018
- Commercial Office Performance by Class/Grade: Grade B office spaces had the highest rental yields at 8.4%
We also analysed performance in terms of class/grade where we classified commercial office buildings into three main categories based on size and quality of office spaces. These are:
- Grade A: Office buildings with a total area ranging from 100,001 - 300,000 square feet that are pacesetters in establishing rents and that generally have ample natural good lighting, good views, prestigious finishing, and on-site undercover parking, and a minimum parking ratio of 3:1000 SQFT,
- Grade B: Office buildings with a total area ranging from 50,000 to 100,000 SQFT. They have good (but lower than Grade A) technical services and ample parking space, and,
- Grade C: These are buildings of any size, usually older and in need of renovation, they lack lobbies and may not have on-site parking space. They charge below average rental rates.
In terms of supply, Grade B offices are the most common, accounting for 58.1% of commercial offices in the Nairobi Metropolitan Area. The market witnessed an increase in Grade A office supply with offices such as FCB Mihrab (298,000 SQFT) and Prism towers (482,000 SQFT) coming into the market and therefore increasing the market share of Grade A offices from approximately 24.0%, to approximately 25.0% of our sample size. Gigiri has the highest percentage of its offices being Grade A at 66.7%. Nairobi CBD has the highest percentage of its offices being Grade B at 84.6% and no Grade A office space, while Mombasa Road has the highest percentage of its offices being Grade C at 50%.
With regard to performance, Grade B office spaces had the highest rental yields at 8.4% driven by a 0.8% and 3.0% points increase in occupancy and rental rates, respectively. Rental yields for Grades B and C increased by 0.5% and 0.9% points, respectively, to average at 8.4% and 7.9%. Grade A office yields however declined by 0.3% points from 8.4% to 8.1%, due to a decline in occupancy rates, with new completions recording lower occupancy rates, and as they charge high rental rates, 12.5% above the market thus tenants opt for Grade B offices.
The performance according to grades/class is as summarized in the table below;
|
(All Values in Kshs Unless Stated Otherwise) |
|||||||||||
|
Commercial Office Performance by Grade |
|||||||||||
|
Office Grade |
Price 2018 Kshs/ SQFT |
Rent 2018 (Kshs/SQFT) |
Occupancy 2018 (%) |
Yield 2018(%) |
Price Kshs/ SQFT |
Rent 2017 (Kshs/SQFT) |
Occupancy 2017(%) |
Yield 2017(%) |
∆ Rent Y/Y |
∆ Occupancy Y/Y (% points) |
∆ Rental Yields Y/Y (% points) |
|
Grade A |
13,006 |
113 |
74.3% |
8.1% |
13,053 |
112 |
81.5% |
8.4% |
0.7% |
(7.2%) |
(0.3%) |
|
Grade B |
12,615 |
102 |
85.9% |
8.4% |
12,804 |
99 |
85.1% |
7.9% |
3.0% |
0.8% |
0.5% |
|
Grade C |
11,022 |
86 |
87.6% |
7.9% |
11,929 |
84 |
83.1% |
7.0% |
2.4% |
4.5% |
0.9% |
|
Average |
12,215 |
100 |
82.6% |
8.1% |
12,595 |
98.3 |
83.2% |
7.8% |
2.0% |
(0.6%) |
0.3% |
|
· Grade B office spaces had the highest rental yields at 8.4% driven by a 0.8% and 3.0% points increase in occupancy and rental rates, respectively · Grade A office yields declined by 0.3% points from 8.4% to 8.1%, due to decline in occupancy rates, given that they are new in the market hence occupancy rates haven’t stabilized and they charge high rental rates, 12.5% above the market thus tenants prefer Grade B offices |
|||||||||||
Source: Cytonn Research 2018
- Class and Node Analysis: Gigiri, Westlands and Parklands nodes present the best investment opportunity in Grade A, B and C offices, respectively
Combining the analysis of performance by nodes and by class, we found that for Grade A offices the opportunity is in Gigiri with high yields of on average 12.0%. For Grade B, the opportunity is in Westlands with an average rental yield of 9.6%. For Grade C, the opportunity in lies in Parklands with rental yields of on average 8.9%.
|
Commercial Office Performance in 2018 by Nodes and Grades |
||||||
|
Typology |
Grade A |
Grade B |
Grade C |
|||
|
Location |
Rental Yield (%) |
Occupancy (%) |
Rental Yield (%) |
Occupancy (%) |
Rental Yield (%) |
Occupancy (%) |
|
Gigiri |
12.0% |
90.0% |
7.6% |
85.0% |
||
|
Karen |
9.1% |
84.5% |
9.2% |
89.7% |
||
|
Parklands |
8.6% |
87.6% |
7.7% |
81.9% |
8.9% |
90.2% |
|
Westlands |
8.4% |
74.8% |
9.6% |
83.6% |
8.2% |
92.7% |
|
Upper Hill |
7.7% |
66.0% |
7.9% |
85.8% |
8.3% |
96.0% |
|
Kilimani |
6.3% |
69.5% |
8.4% |
90.7% |
6.2% |
92.0% |
|
Msa Road |
4.7% |
62.5% |
6.9% |
73.3% |
5.4% |
60.0% |
|
Thika Road |
3.6% |
40.0% |
6.9% |
86.6% |
7.8% |
94.5% |
|
Nairobi CBD |
7.5% |
88.0% |
8.3% |
89.9% |
||
|
· Gigiri and Karen offered the highest returns for Grade A offices, with average rental yields of 12.0% and 9.1%, respectively as they enjoy a superior location characterized by a serene and low-density environment · For Grade B, Westlands has the highest rental yield of 9.6% and hence present an investment opportunity for the same in the market · Parklands offer the best investment opportunity for Grade C with average rental yields of 8.9% attributed to its proximity to the CBD and Westlands, ample infrastructure and favorable zoning regulations facilitating densification · Location and quality of office space continue to be the main factors determining office performance |
||||||
Source: Cytonn Research 2018
- Office Market Outlook and the Investment Opportunity in the Sector
In conclusion, having looked at supply, demand and investor returns, we have a general Negative outlook for the commercial office sector theme in Nairobi Metropolitan Area (NMA) given the increased office space supply and expected stagnation in performance in 2019, and thus investment in the sector should be geared to the long-term horizon for gains when the market picks up. Investment opportunity exists in zones with low supply and high returns such as Gigiri and in differentiated concepts such as serviced offices recording a rental yield of up to 13.5% to boost returns.
|
Commercial Office Outlook |
||||
|
Measure |
2017 Sentiment |
2018 Sentiment |
2018 Review |
2019 Outlook |
|
Supply |
· We had an oversupply of 4.7 mn SQFT of office space in 2017, which impacted the performance negatively, lowering commercial office rental yields and occupancy rate to 7.9% and 82.6%, respectively, from 8.5% and 88.0% recorded in 2016 |
· We had an oversupply of 5.2 mn SQFT of office space in 2018, and it is expected to grow by 7.6% to 5.6 mn SQFT in 2019, compared to 10.8% in 2018 due to decreasing supply with completions expected to decrease by 21.4% from 4.3 mn SQFT to 3.4 mn SQFT in 2019 |
Negative |
Negative |
|
Demand |
· There was reduced demand for office space in the Nairobi Metropolitan Area (NMA) evidenced by the 4.8% y/y decline in occupancy mainly attributable to a tough operating environment characterized by low credit supply and political uncertainty as a result of the protracted electioneering period |
· There was increased demand for office space in the Nairobi Metropolitan Area (NMA) evidenced by the 0.7% y/y increase in occupancy mainly attributable to political stability that has led to increased economic activities, positioning of the NMA as a regional hub and thus increased entrance of multinationals and improving macroeconomic environment, with the GDP growing at 6.0% in Q3’2018, higher than the 4.7% recorded in Q3’2017, and expected to close at 5.8% for the year 2018 |
Neutral |
Neutral |
|
Office Market Performance |
· The performance of the office market softened, with yields reducing by 0.6 % points to 7.9% in 2017 from 8.5% in 2016, and occupancy rates reducing by 5.4% points from 88.0% in 2016 to 82.6% in 2017 |
· The performance of the office market improved with yields increasing by 0.2% points to 8.1% in 2018 from 7.9% in 2017, and occupancy rates increased by 0.7% points from 82.6% in 2017 to 83.3% in 2018. |
Neutral |
Neutral |
|
General Outlook and Opportunity |
· We have a negative outlook for the commercial office theme in the Nairobi Metropolitan Area (NMA) given the increased office space supply and expected stagnation in performance in 2019, and thus investment in the commercial office theme should be geared to the long-term horizon for gains when the market picks up · Investments should be made in zones with low supply and high returns such as Gigiri and in differentiated concepts such as serviced offices recording a rental yield of up to 13.5% to boost returns |
|||
For 2019, we have a negative outlook for the commercial office market in the Nairobi Metropolitan Area (NMA), with one out of three metrics we looked at being negative and two metrics being neutral. Investments in the commercial office sector should therefore, be aimed towards long-term gains when the market picks up; but if you have to invest in commercial office, we would pick Gigiri, Westlands and Karen. We continue to track performance of the office sector, and as per our Cytonn Q1’2019 Markets Review, the sector recorded 0.1% and 0.9% points decline in average rental yields and occupancy rates, to 8.0% and 82.4%, respectively. For more information click here. For the full Commercial Office Report 2019, click here.

- Talk to us
- Kenya
- P.O Box 20695 - 00200, Nairobi, Kenya
- Cell +254709101200
- Tel +254709101200
- WhatsApp +254741676635
- United States
- +254709101200
- DOWNLOAD OUR APP
-


- Kenya
- 8th Floor, Pinetree Plaza, Kaburu Drive, Ngong Road, Nairobi, Kenya
- USA
- Suite 1150, 1775 Eye Street NW, USA, Washington DC 20006, USA
- Investments
- High Yield
- Private Equity
- Real Estate
- Real Estate
- RiverRun Estates
- Cytonn Towers
- The Ridge
- Taraji Heights
- The Alma