Nairobi Metropolitan Area Mixed-Use Developments (MUDs) Report 2018, & Cytonn Weekly #44/2018
By Cytonn Research Team, Nov 18, 2018
Executive Summary
Fixed Income
T-bills were under-subscribed during the week, with the overall subscription rate coming in at 93.8%, up from 87.4% recorded the previous week. Yields on the 91-day, 182-day, and 364 -day paper remained unchanged at 7.3%, 8.3%, and 9.5%, respectively. The National Treasury released the budgetary review for the first quarter of the 2018/2019 financial year, with total revenue collection at Kshs 366.0 bn, a 5.9% increase from Kshs 345.6 bn collected for the same period the previous year. This was 83.5% of the Kshs 438.3 bn target;
Equities
During the week, the equities market recorded mixed performances with NSE 20 and NASI declining by 0.9% and 1.4%, respectively, while NSE 25 gained by 0.4%, taking their YTD performance to declines of 24.4%, 15.4%, and 14.5%, for NSE 20, NASI, and NSE 25, respectively. KCB Group and Co-operative Bank released their Q3’2018 financial results, recording core Earnings per Share growth of 19.7% and 8.2%, respectively;
Private Equity
In the financial services sector, investment firm TransCentury has rolled over by one year Kshs 369.5 mn worth of short-term loans it had taken from its controlling shareholder Kuramo Capital. In other activity, Sidian Bank has secured a Kshs 235.0 mn loan from the East African Development Bank (EADB) to expand its loan book to small and medium enterprises (SMEs) in the agribusiness sector;
Real Estate
During the week, local real estate agency Hass Consult announced plans to undertake a real estate joint venture with the family of the late Government Minister Munyua Waiyaki (stake ownership details undisclosed), that will see the development of a Kshs 10.0 bn luxury residential project along Redhill Road, Nairobi. In the retail sector, leading global fashion brand, Hugo Boss, opened its first East African store at the Westgate Mall in Westlands, while in the hospitality sector, 10 Kenyan hotels won global awards at the World Luxury Hotel Brands Awards held in Bali, Indonesia, affirming Kenya’s position as a leading international tourist destination;
Focus of the Week
Developers are increasingly undertaking projects whose goal is to maximise land-use and improve the quality of life for the users, in order to out-do their competition and generate better returns. One of the trends we have seen in Kenya is the construction of large-scale Mixed-Use Developments (MUDs), which integrate various uses (residential, commercial, hospitality, retail etc.) within one development thus creating a live, work, play and invest environment. Some of the recently launched MUDs in Nairobi include Pinnacle Towers in Upperhill, Global Trade Centre and Le’ Mac in Westlands. This week, we shall, therefore, demystify Mixed-Use Developments, highlight their advantages and limitations, analyse their performance, then draw conclusions on the viability of the same.
- Following the successful completion and hand over of Amara Ridge, the gated community in Karen opposite Bomas of Kenya, we have launched our next project in Karen, called Situ Village. The launch was held at the Amara Clubhouse on 10th November 2018, where 20% of Phase 1 was sold. See Event Note here;
- We invite you to the ongoing exhibition of Situ Village, our Kshs 5.5 bn gated community development in Oloolua Ridge, Karen. The exhibition is at the Amara Ridge Clubhouse (Location Pin: https://goo.gl/maps/B3GVnu8pHyn) from 9:00 am to 5:00 pm daily, and it will end on 30th November 2018. Do not miss the opportunity! See the video for the completed Amara Ridge here;
- We continue to hold weekly workshops and site visits on how to build wealth through real estate investments. The weekly workshops and site visits target both investors looking to invest in real estate directly and those interested in high yield investment products to familiarize themselves with how we support our high yields. Watch progress videos and pictures of The Alma, Amara Ridge, The Ridge, and Taraji Heights. Key to note is that our cost of capital is priced off the loan markets, where all-in pricing ranges from 16.0% to 20.0%, and our yield on real estate developments ranges from 23.0% to 25.0%, hence our top-line gross spread is about 6.0%. If interested in attending the site visits, kindly register here;
- We continue to see very strong interest in our weekly Private Wealth Management Training (largely covering financial planning and structured products). The training is at no cost and is open only to pre-screened participants. We also continue to see institutions and investment groups interested in the training for their teams. The Wealth Management Training is run by the Cytonn Foundation under its financial literacy pillar. If interested in our Private Wealth Management Training for your employees or investment group, please get in touch with us through wmt@cytonn.com. To view the Wealth Management Trainingtopics, click here;
- For recent news about the company, see our news section here;
- We have 10 investment-ready projects, offering attractive development and buyer targeted returns of around 23.0% to 25.0% p.a. See further details here: Summary of Investment-Ready Projects;
- We continue to beef up the team with ongoing hires for Financial and Real Estate Advisors for our offices in Nairobi, Nakuru, Kisumu, and Nyeri. Visit the Careers sectionon our website to apply; and
- Cytonn Centre for Affordable Housing (CCFAH) is looking for a 2-acre land parcel for a joint venture/buy in Kiambu County (Ruiru, Kikuyu, Lower Kabete), Nairobi County and its environs. The parcel should be; i) fronting a main road, or not more than 800 metres from the main road, and ii) priced at Kshs 20 mn per acre or below. For more information or leads email us at affordablehousing@cytonn.com
T-Bills & T-Bonds Primary Auction:
T-bills were under-subscribed during the week, with the overall subscription rate coming in at 93.8%, up from 87.4% recorded the previous week. The under-subscription is partly attributable to the 20-year tenor infrastructure bond sale that closed this week. The subscription rate for the 91-day and 182-day paper increased to 182.1% and 24.4% from 49.1% and 23.0%, recorded the previous week, respectively, while the subscription rate for the 364-day paper declined to 127.9%, from 167.1% recorded the previous week. The yields on the 91-day, 182-day, and 364-day paper remained unchanged at 7.3%, 8.3% and 9.5%, respectively. The acceptance rate for T-bills improved to 96.0%, from 89.0% the previous week, with the government accepting Kshs 21.6 bn of the Kshs 22.5 bn worth of bids received.
This week, the Kenyan Government issued a Kshs 50.0 bn, 20-year infrastructure bond, issue No. IFBI/2018/20 at a coupon of 11.95%, aimed at funding infrastructure projects in the road, water and energy sectors. The issue was under-subscribed, with the subscription rate coming in at 80.8%, with bids worth Kshs 40.4 bn received against the Kshs 50.0 bn on offer. This was lower in comparison to the 15-year infrastructure bond issue No. IFB1/2018/15 floated in January 2018, which recorded a 139.5% subscription with the total bids coming in at Kshs 55.8 bn of the Kshs 40.0 bn on issue. In this issue, the government accepted Kshs 27.6 bn out of the Kshs 40.4 bn worth of bids received, translating to an acceptance rate of 68.3%. The average accepted yield for the issue came in at 12.2%. The low subscription rate can be attributed to:
- Uncertainty over the interest rate environment that has made investors reluctant to commit to long-term bonds,
- Relatively low returns due to the continued decline of yields in the primary auction as the government continues to reject expensive bids. The 20-year bond’s coupon was set at 11.95% with the accepted yield coming in at 12.2%, which is relatively low compared to the shorter tenor 15-year infrastructure bond issued in January, which had a coupon of 12.5% with the accepted yield coming in at 12.5%, and,
- Short bidding period of only 2-days with the period of sale being 12/11/2018 to 13/11/2018.
It is evident that there is a low appetite for the long-dated papers as evidenced by the six bonds, issued from the start of the FY’2018/2019 in July, worth Kshs 242.0 bn, only managing to raise Kshs 113.1 bn hence the Treasury has to heavily rely on the short-term treasury bills to meet its domestic borrowing target.
|
(All figures in Kshs bn) |
|||||||||||
|
FY2018/2019 Long-Term Bonds Issue |
|||||||||||
|
Issue No. |
Issue Amount |
Bids Received |
Bids Accepted |
Coupon Rate |
|||||||
|
FXD2/2018/20 |
40.0 |
13.8 |
10.5 |
13.2% |
|||||||
|
FXD1/2018/10 |
40.0 |
29.8 |
19.4 |
12.7% |
|||||||
|
FXD1/2018/10 & FXD2/2018/20 |
40.0 |
32.5 |
26.6 |
12.9% |
|||||||
|
FXD2/2018/15 |
40.0 |
27.0 |
7.9 |
12.8% |
|||||||
|
FXD2/2018/15 |
32.0 |
25.4 |
21.3 |
12.8% |
|||||||
|
IFB1/2018/20 |
50.0 |
40.4 |
27.6 |
12.0% |
|||||||
|
|
242.0 |
168.9 |
113.1 |
||||||||
We are of the view that the continued issuance of medium to long-term domestic securities is well guided as lengthening the average maturity will reduce the potential rollover risks in the medium term. The issuance of medium to long-term securities have however been having a lacklustre performance, which we attribute to the saturation of long-end offers, leading to a relatively flat yield curve on the long-end and the government will need to offer more incentive for the long-term bonds by increasing the yields to attract investors.
Liquidity:
The average interbank rate increased to 3.3%, from 3.0% the previous week, while the average volumes traded in the interbank market declined by 31.3% to Kshs 20.3 bn, from Kshs 29.5 bn the previous week. The higher interbank rate points to tightened liquidity conditions attributed to mobilization of funds by banks for VAT and excise duty remittances that were due.
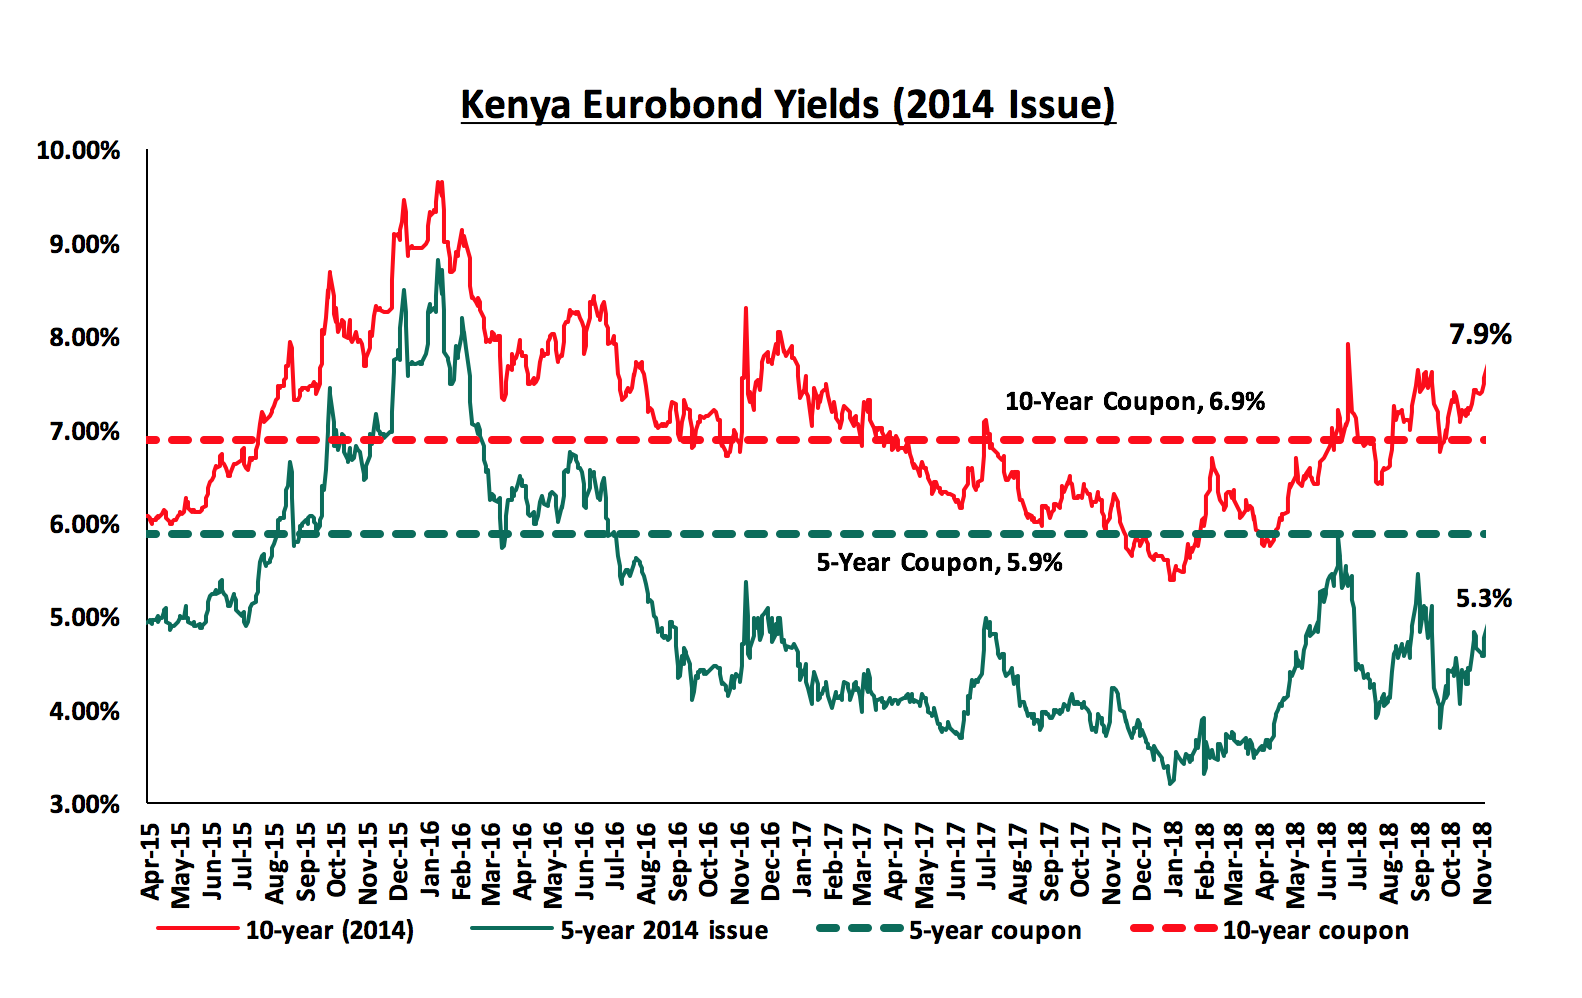
Kenya Eurobonds:
According to Bloomberg, the yields on the 5-year and 10-year Eurobonds issued in 2014 both increased by 0.5% and 0.4% points to 5.3% and 7.9%, from 4.8% and 7.5% recorded the previous week, respectively. Since the mid-January 2016 peak, yields on the Kenyan Eurobonds have declined by 1.7% points and 3.5% points for the 10-year and 5-year Eurobonds, respectively, an indication of the relatively stable macroeconomic conditions in the country. Key to note is that these bonds have 0.6-years and 5.6-years to maturity for the 5-year and 10-year, respectively.
For the February 2018 Eurobond issue, during the week, the yields on both the 10-year and 30-year Eurobonds rose by 0.5% and 0.4% points to 8.7% and 9.6% from 8.2% and 9.2% the previous week, respectively. Since the issue date, the yields on the 10-year and 30-year Eurobonds have both increased by 1.4% and 1.3% points, respectively.
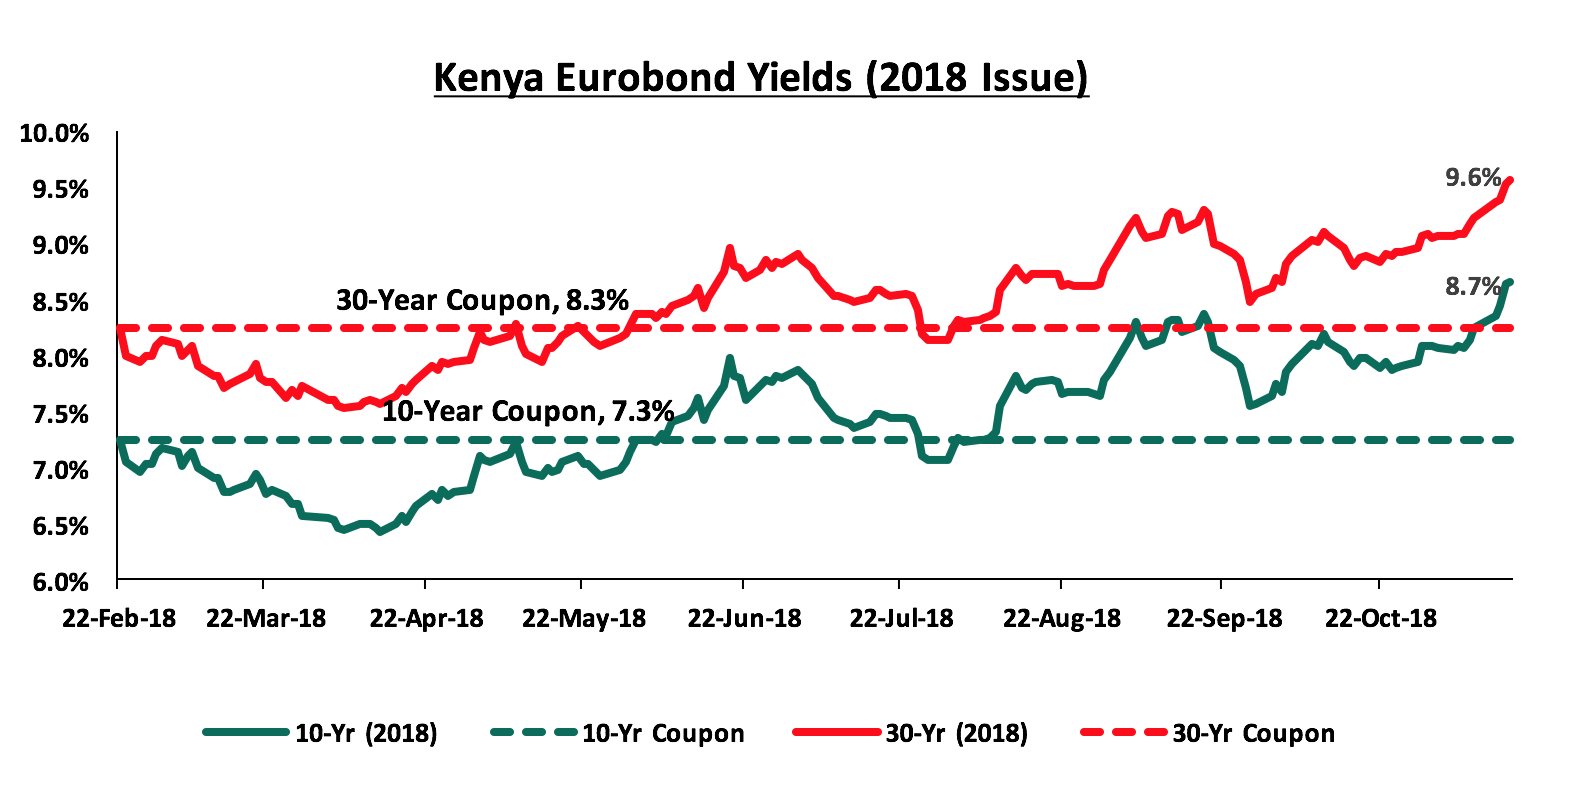
Key to note, the yields on all the Eurobonds have been on the rise in recent weeks. The rising yield on all the Eurobonds signals higher country risk perception by investors, partly attributed to International Monetary Fund (IMF) raising the risk of Kenya’s debt distress from low to moderate on October, resulting in investors demanding a higher return for the risk. In November, the yields on the 5-year and 10-year Eurobonds have both increased by 0.5% points while the yields on the 10-year and 30-year 2018 issues have increased by 0.6% points and 0.5% points, respectively. The increment in the Federal Rate twice this year, currently at 2.0% - 2.25% has also led to market correction in Eurobond yields in the emerging markets with the 2014 Eurobond issues having increased by 1.9% points and 2.3% points for the 5-year and 10-year 2014 Eurobond issues, respectively.
Kenya Shilling:
During the week, the Kenya Shilling depreciated by 1.3% against the US Dollar to close at Kshs 103.2, from Kshs 101.9 recorded the previous week, attributed to increased dollar demand by companies in the oil, manufacturing and energy sectors to close end of year orders ahead of the December holidays. The shilling has continued to slide over the week, mainly due to the levels of dollar inflows failing to meet the demand mainly from oil importers, which has also seen the oil import bill rise on the back of a rally in fuel prices. This coupled with the declined value of Kenya’s principal exports, with the average price of tea having declined by 15.5% since January and the average price of horticulture declining by 19.7% has led to a deteriorating external position eating into the forex reserves and exerting pressure on the local currency. Tea and horticulture contributed to 19.5% and 16.2% of the total August 2018 export bill. Key to note, Kenya’s forex reserves have fallen by 8.9% to USD 8.1 bn, from USD 8.9 bn since the start of the FY’2018/2019 in July.
All the gains made by the Kenya Shilling this year were eroded this week as it reached a 10-month low at Kshs 103.2, the same price it closed the year 2017. In our view, the shilling should remain relatively stable to the dollar going forward, supported by:
- CBK’s activities in the money market, such as repurchase agreements and selling of dollars,
- High levels of forex reserves, currently at USD 8.1 bn, equivalent to 5.3-months of import cover, compared to the one-year average of 5.5-months, which is above the IMF threshold for emerging markets, which is 3-months, and,
- Improving diaspora remittances, which increased by 71.9% y/y to USD 266.2 mn in June 2018 from USD 154.9 mn in June 2017 and by 4.9% m/m, from USD 253.7 mn in May 2018, with the largest contributor being North America at USD 130.1 mn, attributed to; (a) recovery of the global economy, (b) increased uptake of financial products by the diaspora due to financial services firms, particularly banks, targeting the diaspora, and (c) new partnerships between international money remittance providers and local commercial banks making the process more convenient.
Highlight of the Week:
During the week, the Energy Regulatory Commission (ERC) released their monthly statement on the Maximum Retail Prices in Kenya effective from 15th November 2018 to 14th December 2018. Below are the key take-outs from the statement:
- Petrol prices have increased 2.1% to Kshs 118.1, from Kshs 115.7 per litre previously. Similarly, diesel and kerosene prices have increased by 2.9% and 2.8% to Kshs 112.8 and 111.8 per litre, from Kshs 109.7 and Kshs 108.8 per litre recorded previously, respectively,
- The changes in prices have been attributed to the increase in average landing costs of imported super petrol by 4.0% to USD 758.3 per ton in October, from USD 729.0 per ton in September. Landing costs for diesel and kerosene increased by 5.8% and 5.8% to USD 741.3 per ton and USD 763.5 per ton in October, respectively, from USD 700.4 per ton and USD 721.6 per ton in September,
- The mean monthly USD to Kenyan Shilling exchange rate depreciated by 0.3% from Kshs 100.8 per USD in September to Kshs 101.7 per USD in October,
- Kerosene prices have been on a steady rise due to the continued effects of the anti-adulteration levy of Kshs 18.0 per litre of the customs value of kerosene payable by the importer at the time of entry of the Kerosene into the country. The levy was introduced in a bid to harmonize the prices of kerosene and diesel thus eliminating fuel adulteration that has led to pollution, damage to vehicle engines as well as adversely affecting government’s revenue, and,
- A weakening Kenya Shilling has also weighed in on the pump price, as it costs importers more to import the fuel.
We shall highlight the implication of the higher fuel prices on inflation in our inflation projection for November 2018 on next weeks’ Cytonn Weekly Report.
The National Treasury released the budgetary review for the first quarter of the 2018/2019 financial year. Below are the key take-outs:
|
(All Amounts in ‘Kshs bn’ unless stated otherwise) |
|||||||||||
|
Q1’ FY 2018/2019 Budget Outturn |
|||||||||||
|
Item |
Q1'2018/2019 |
||||||||||
|
Collected/Spent |
Target |
% met |
|||||||||
|
Total revenue |
366.0 |
438.3 |
83.5% |
||||||||
|
External grants |
3.6 |
8.1 |
44.4% |
||||||||
|
Total revenue & external grants |
369.6 |
446.4 |
82.8% |
||||||||
|
Recurrent expenditure |
345.4 |
360.0 |
96.0% |
||||||||
|
Development expenditure & Net Lending |
83.6 |
87.8 |
95.2% |
||||||||
|
County governments+ contingencies |
23.5 |
55.2 |
42.6% |
||||||||
|
Total expenditure |
452.5 |
502.9 |
90.0% |
||||||||
|
Fiscal deficit |
(82.9) |
(56.6) |
|||||||||
|
Deficit as % of GDP |
0.8% |
0.6% |
|||||||||
|
Net foreign borrowing |
16.8 |
14.9 |
113.1% |
||||||||
|
Net domestic borrowing |
69.2 |
40.7 |
170.1% |
||||||||
|
Other domestic financing |
2.6 |
4.0 |
65.0% |
||||||||
|
Total borrowing |
88.7 |
59.6 |
148.7% |
||||||||
|
GDP Estimate |
9,990.0 |
9,990.0 |
|||||||||
- The total revenue collected amounted to Kshs 366.0 bn, a 5.9% increase from Kshs 345.6 bn collected during the same period the previous year. The government managed to hit 83.5% of the Kshs 438.3 bn target. Ordinary revenue collection from taxes excluding Appropriation in Aid was at Kshs 332.2 bn, against a target of Kshs 400.9 bn, thus the Kenya Revenue Authority managed to meet 82.9% of the set target as per the budget. The revenue was 3.7% of GDP,
- The total expenditure amounted to Kshs 452.5 bn, a 9.8% increase from Kshs 412.3 bn recorded the same period last year. This was 90.0% of the Kshs 502.9 bn target, with a significant share of the expenditure being on recurrent expenditure, which accounted for 76.3% of total expenditure. Development expenditure only accounted for 18.5%. Total expenditure was, however, 10.0% lower than the targeted expenditure as per the budget an indication that the austerity measures undertaken by the government were taking effect. The lower expenditure was mainly attributed to lower expenditure recorded in domestic interest payment, wages and salaries and pension expenditures, which came in at Kshs 19.1 bn, Kshs 16.1 bn, and Kshs 9.9 bn, respectively
We are of the view that revenue mobilization still remains a key concern, with the government having managed to meet 83.5% of its target, which is a decline from the 89.1% recorded in Q1’2017/2018 indicating that the government efforts of improving revenue mobilization have not been successful. The key concern, however, remains on the expenditure side, which has continued to grow faster recording a 9.8% growth, compared to the 5.9% growth in revenue collection. This has led to widening of the fiscal deficit to Kshs 82.9 bn, 0.8% of GDP from Kshs 65.1 bn, 0.7% of GDP in Q1’2017/2018. This in effect has led to increased total government borrowing, both foreign and domestic to plug in the deficit, with domestic borrowing having increased by 40.7% to Kshs 69.2 bn from Kshs 49.2 bn in Q1’2017/2018, while foreign borrowing has increased by 124.0% to Kshs 16.8 bn, from Kshs 7.5 bn in Q1’2017/2018. We are of the view that the government efforts of raising revenue through the implementation of the 8.0% VAT on fuel might not be effective as evidenced by the 25.0% drop in petrol and diesel sales to 255,450 tons in September after its implementation, from 338,460 tons recorded in August. The declined sales might also have a trickle effect in the corporate earnings from oil marketers, due to dampened profits and eventually reduced revenue collections from corporate tax.
Rates in the fixed income market have been on a declining trend, as the government continues to reject expensive bids, as it is currently 33.2% ahead of its pro-rated domestic borrowing target for the current financial year, having borrowed Kshs 146.2 bn against a pro-rated target of Kshs 109.8 bn. The 2018/19 budget had given a domestic borrowing target of Kshs 271.9 bn, 8.6% lower than the 2017/2018 fiscal year’s target of Kshs 297.6 bn, which may result in reduced pressure on domestic borrowing. With the rate cap still in place, with the president having assented to the Finance Bill 2018, we maintain our expectation of stability in the interest rate environment. With the expectation of a relatively stable interest rate environment, our view is that investors should be biased towards medium-term fixed-income instrument.
Market Performance
During the week, the equities market recorded mixed performances with NSE 20 and NASI declining by 0.9% and 1.4%, respectively, while NSE 25 gained by 0.4%, taking their YTD performance to declines of 24.4%, 15.4%, and 14.5%, for NSE 20, NASI and NSE 25, respectively. The decline in the NASI was driven by declines in large-cap stocks such as British American Tobacco (BAT) and Safaricom, which declined by 6.8% and 2.1%, respectively.
Equities turnover increased by 82.4% during the week to USD 19.5 mn from USD 10.7 mn the previous week, taking the YTD turnover to USD 1.7 bn. Foreign investors remained net sellers for the week, with a net selling position of USD 0.7 mn, a 121.3% increase from last week’s net selling position of USD 0.3 mn. We expect the market to remain subdued in the near-term as international investors exit the broader emerging markets due to the expectation of rising US interest rates coupled with the strengthening of the US Dollar.
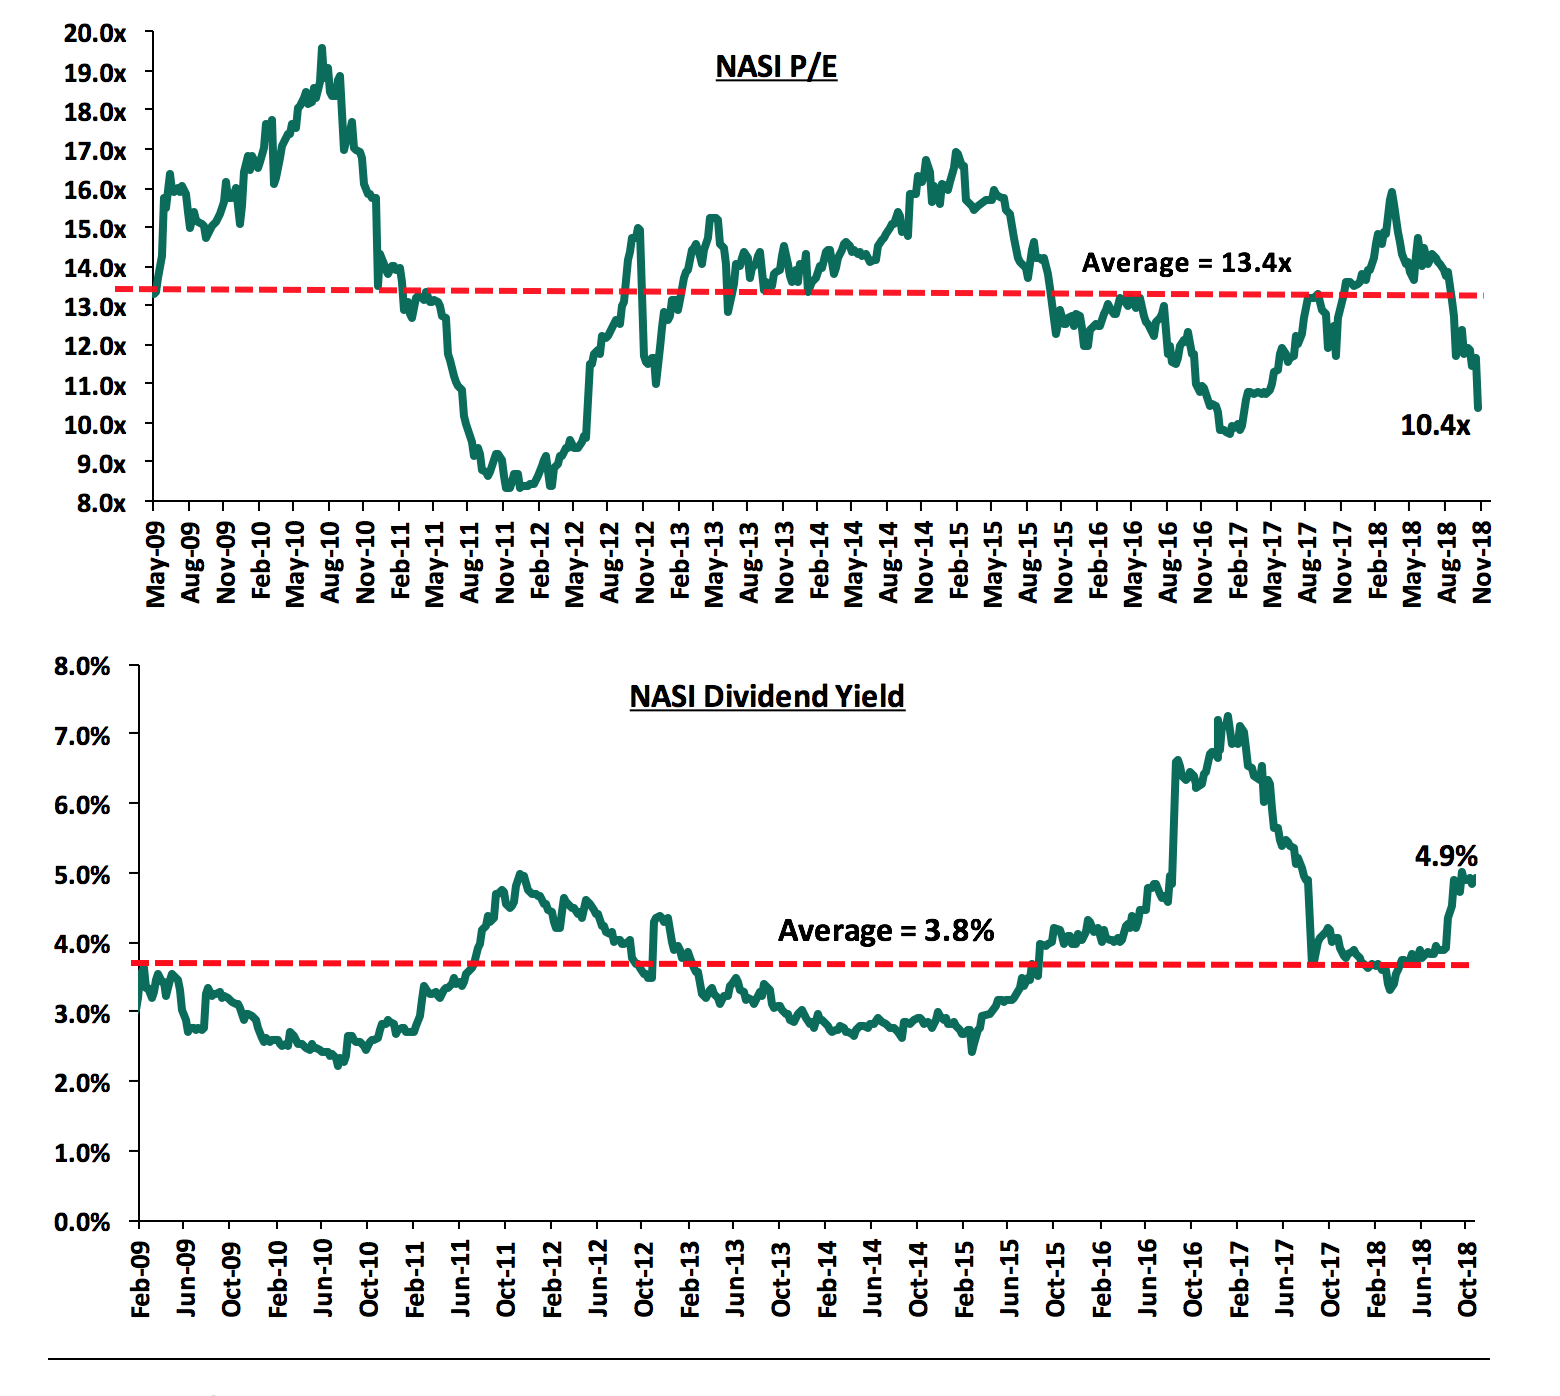
The market is currently trading at a price to earnings ratio (P/E) of 10.4x, 22.6% below the historical average of 13.4x, and a dividend yield of 4.9%, above the historical average of 3.8%. The current P/E valuation of 10.4x is 6.1% above the most recent trough valuation of 9.8x experienced in the first week of February 2017, and 25.2% above the previous trough valuation of 8.3x experienced in December 2011. The charts below indicate the historical P/E and dividend yields of the market.
Earnings Releases
KCB Group released Q3’2018 results during the week;
KCB Group released their Q3’2018 results, registering core earnings per share growth of 19.7% to Kshs 5.9, from Kshs 4.9 in Q3’2017, above our expectation of a 12.4% increase to Kshs 5.5. The performance was driven by a 2.0% increase in total operating income, coupled with the 6.8% decline in the total operating expenses. However, the variance in core earnings per share growth against our expectations was largely due to the 42.6% decline in loan loss provisions to Kshs 1.8 bn from Kshs 3.1 bn. We expected a 32.1% decline in loan loss provisions to Kshs 2.1 bn from Kshs 3.1 bn recorded in Q3’2017. Highlights of the performance from Q3’2017 to Q3’2018 include:
- Total operating income increased by 2.0% to Kshs 54.2 bn from Kshs 53.2 bn in Q3’2017. This was due to a 1.8% increase in Net Interest Income (NII) to Kshs 36.3 bn from Kshs 35.7 bn in Q3’2017, coupled with a 2.6% rise in Non-Funded Income (NFI) to Kshs 17.9 bn, from Kshs 17.5 bn in Q3’2017,
- Interest income increased by 5.1% to Kshs 49.2 bn, from Kshs 46.8 bn in Q3’2017. This was driven by a 4.9% growth in interest income from government securities to Kshs 9.7 bn from Kshs 9.3 bn in Q3’2017, and a 5.2% increase in interest income on loans and advances to Kshs 39.0 bn, from Kshs 37.1 bn in Q3’2017. The yield on interest-earning assets remained unchanged at 11.4%,
- Interest expense increased by 16.0% to Kshs 12.9 bn from Kshs 11.1 bn in Q3’2017, following a 13.9% increase in the interest expense on customer deposits to Kshs 11.3 bn, from Kshs 9.9 bn in Q3’2017. Interest expense on deposits and placements from banking institutions increased by 33.0% to Kshs 1.6 bn from Kshs 1.2 bn in Q3’2017. The cost of funds thus rose to 3.2%, from 2.9% in Q3’2017. Consequently, the Net Interest Margin (NIM) declined to 8.5%, from 8.7% in Q3’2017,
- Non-Funded Income (NFI) increased by 2.6% to Kshs 17.9 bn, from Kshs 17.5 bn in Q3’2017. The increase was driven by a 2.4% increase in other fees and commission income to Kshs 6.6 bn from Kshs 6.4 bn in Q3’2017, and a 24.1% increase in other income to Kshs 3.3 bn, from Kshs 2.6 bn in Q3’2017 outweighing the 7.9% decline in fees and commissions on loans to Kshs 4.4 bn from Kshs 4.8 bn in Q3’2017. As a result, the revenue mix remained the same at 67:33 funded to non-funded income,
- Total operating expenses declined by 6.8% to Kshs 28.6 bn, from Kshs 30.7 bn, largely driven by a 42.6% decline in Loan Loss Provisions (LLP) to Kshs 1.8 bn in Q3’2018, from Kshs 3.1 bn in Q3’2017, coupled with a 7.4% decline in staff costs to Kshs 12.8 bn in Q3’2018, from Kshs 13.8 bn in Q3’2017,
- Consequently, the Cost to Income Ratio (CIR) improved to 52.8%, from 57.8% in Q3’2017. Without LLP, the cost to income ratio also improved to 49.5%, from 51.9% in Q3’2017,
- Profit before tax increased by 14.2% to Kshs 25.6 bn, up from Kshs 22.4 bn in Q3’2017. Profit after tax increased by 19.7% to Kshs 18.0 bn in Q3’2018, from Kshs 15.1 bn in Q3’2017 as the effective tax rate declined to 32.5% from 36.4% in Q3’2017,
- The balance sheet recorded an expansion as total assets increased by 6.3% to Kshs 684.2 bn from Kshs 643.8 bn in Q3’2017. This growth was largely driven by a 15.3% increase in government securities to Kshs 119.5 bn, from Kshs 103.7 bn in Q3’2017, coupled with a 3.8% increase in their loan book to Kshs 435.3 bn from Kshs 419.5 bn in Q3’2017, which was mainly attributed to an increase in the corporate loan book,
- Total liabilities rose by 7.0% to Kshs 578.7 bn from Kshs 540.6 bn in Q3’2017, driven by a 6.2% increase in customer deposits to Kshs 526.8 bn, from Kshs 496.3 bn in Q3’2017. Deposits per branch increased by 8.6% to Kshs 2.1 bn, from Kshs 1.9 bn in Q3’2017, with the number of branches having reduced to 257 from 263 in Q3’2017. Placement liabilities increased by 20.4% to Kshs 12.6 bn from Kshs 10.5 bn in Q3’2017. Borrowings increased by 43.7% to Kshs 20.7 bn from Kshs 14.4 bn in Q3’2017,
- The faster growth in deposits as compared to loans led to a decline in the loan to deposit ratio to 82.6% from 84.5% in Q3’2017,
- Gross Non-Performing Loans (NPLs) declined by 0.1% to Kshs 34.8 bn in Q3’2018 from Kshs 34.7 bn in Q3’2017. The NPL ratio thus improved to 7.6% in Q3’2018 from 7.8% in Q3’2017. General Loan Loss Provisions (LLPs) declined by 15.6% to Kshs 16.7 bn from Kshs 19.8 bn in Q3’2017. The NPL coverage declined to 60.4% in Q3’2018 from 67.9% in Q3’2017, as provisions declined at a faster rate than the NPLs,
- Shareholders’ funds increased by 2.2% to Kshs 105.5 bn in Q3’2018 from Kshs 103.2 bn in Q3’2017, as retained earnings grew by 25.6% y/y to Kshs 79.1 bn from Kshs 63.0 bn in Q3’2017,
- KCB group is currently sufficiently capitalized with a core capital to risk-weighted assets ratio of 16.3%, 5.8% above the statutory requirement. In addition, the total capital to risk-weighted assets ratio was 17.8%, exceeding the statutory requirement by 3.3%. Adjusting for IFRS 9, the core capital to risk-weighted assets stood at 17.6%, while total capital to risk-weighted assets came in at 19.0%, indicating that the bank’s total capital relative to its risk-weighted assets declined by 1.2% due to implementation of IFRS 9,
- The bank currently has a Return on Average Assets (ROaA) of 3.5% and a Return on Average Equity (ROaE) of 21.7%.
For more information, see our KCB Group Q3’2018 Earnings Note
Co-operative Bank released Q3’2018 results during the week;
Co-operative Bank released Q3’2018 results during the week, with core earnings per share growth of 8.2% to Kshs 1.8 from Kshs 1.6 in Q3’2017, in line with our expectations of an 8.5% increase to Kshs 1.8. The performance was driven by a 4.6% increase in total operating income, despite the 3.1% increase in the total operating expenses. Highlights of the performance from Q3’2017 to Q3’2018 include:
- Total operating income increased by 4.6% to Kshs 32.3 bn from Kshs 30.9 bn over the same period in Q3’2017. This was due to a 4.7% increase in Net Interest Income (NII) to Kshs 21.7 bn from Kshs 20.8 bn in Q3’2017, coupled with 4.3% growth in Non-Funded Income (NFI) to Kshs 10.6 bn, from Kshs 10.1 bn in Q3’2017,
- Interest income increased by 3.5% to Kshs 30.9 bn from Kshs 29.9 bn in Q3’2017. This was driven by a 13.1% growth in interest income from government securities to Kshs 6.9 bn from Kshs 6.1 bn in Q3’2017, and a marginal 0.8% increase in interest income on loans and advances to Kshs 23.8 bn, from Kshs 23.5 bn in Q3’2017. Interest income on deposits and placements with banking institutions rose by 13.3% to Kshs 0.17 bn from Kshs 0.15 bn in Q3’2017. However, the yield on interest-earning assets declined to 11.9% in Q3’2018 from 12.3% in Q3’2017, given the faster growth of 16.9% in government securities that have relatively lower yields than loans,
- Interest expense remained flat at Kshs 9.1 bn in Q3’2018. Interest on customer deposits increased by 2.5% to Kshs 8.2 mn from Kshs 8.0 mn, while other interest charges decreased by 3.4% to Kshs 0.88 bn from Kshs 0.91 bn in Q3’2017. The cost of funds decreased to 3.8% from 3.9% in Q3’2017. Consequently, net interest margin decreased to 8.3% from 8.6% in Q3’2017,
- Non-Funded Income (NFI) increased by 4.3% to Kshs 10.6 bn, from Kshs 10.1 bn in Q3’2017. The increase in NFI was realized across all NFI segments apart from fees and commissions on loans which declined by 29.7 % to Kshs 1.3 bn from Kshs 1.9 bn in Q3’2017, with management indicating that the appraisal fees declined by 51.0%, while negotiation fees declined by 16.0%. The values were however undisclosed. Other fees and commission income increased by 9.9% to Kshs 6.6 bn, from Kshs 6.0 bn in Q3’2017. Forex trading income increased by 13.6% to Kshs 1.8 bn, from Kshs 1.5 bn in Q3’2017. Other income increased by 24.1% to Kshs 0.9 bn, from Kshs 0.8 bn in Q3’2017, with management citing recoveries from loans and revenue from the custody business as the key drivers for the growth in the other income segment. As a result, the current revenue mix remained at 67:33 funded to non-funded income,
- Total operating expenses increased by 3.1% to Kshs 17.8 bn, from Kshs 17.3 bn, largely driven by a 12.5% increase in other operating expenses to Kshs 8.4 bn in Q3’2018, from Kshs 7.5 bn in Q3’2017, as the bank improved its Information Technology (IT) infrastructure, as it pushes for further automation of its processes, together with improving its data analytics function. Staff costs increased by 12.3% to Kshs 8.1 bn from Kshs 7.2 bn in Q3’2017, attributed to recruitment by the bank for the IT department, with management indicating the expertize was hired at a premium. Loan Loss Provisions (LLP) however declined by 50.3% to Kshs 1.3 bn in Q3’2018, from Kshs 2.6 bn in Q3’2017,
- The Cost to Income Ratio (CIR) improved to 55.1%, from 55.9% in Q3’2017. Without LLP, the cost to income ratio deteriorated to 51.2%, from 47.6% in Q3’2017,
- Profit before tax increased by 6.6% to Kshs 14.6 bn, up from Kshs 13.7 bn in Q3’2017. Profit after tax increased by 8.2% to Kshs 10.3 bn in Q3’2018, from Kshs 9.5 bn in Q3’2017,
- The balance sheet recorded an expansion as total assets increased by 4.1% to Kshs 404.2 bn from Kshs 388.3 bn in Q3’2017. This growth was largely driven by a 16.9% increase in government securities to Kshs 83.3 bn, from Kshs 71.2 bn in Q3’2017. This was despite the 2.0% decrease in their loan book to Kshs 254.2 bn from Kshs 259.4 bn in Q3’2017,
- Total liabilities rose by 3.5% to Kshs 332.5 bn from Kshs 321.1 bn in Q3’2017, driven by a 2.5% increase in customer deposits to Kshs 296.1 bn from Kshs 289.0.8 bn in Q3’2017. In terms of distribution, transaction accounts, current accounts and fixed deposits accounted for the highest proportion at 29.5%, 28.9% and 22.6% respectively. Deposits per branch decreased by 1.5% to Kshs 1.91 bn from Kshs 1.94 bn in Q3’2017, with six branches opened to bring the total to 155 from 149 in Q3’2017. Placement liabilities increased by 24.0% to Kshs 1.5 bn from Kshs 1.2 bn in Q3’2017. Borrowings decreased by 7.2% to Kshs 26.0 bn from Kshs 28.0 bn in Q3’2017,
- The growth in deposits as compared to decline in loans led to a slight decline in the loan to deposit ratio to 85.9% from 89.8% in Q3’2017,
- Gross Non-Performing Loans (NPLs) increased by 75.3% to Kshs 29.7 bn in Q3’2018 from Kshs 16.9 bn in Q3’2017. Consequently, the NPL ratio increased to 11.2% in Q3’2018 from 6.4% in Q3’2017. The Loan Loss Provisions (LLPs) due to IFRS 9 increased by 78.4% to Kshs 9.9 bn from Kshs 5.6 bn in Q3'2017, however, the specific LLPs for the quarter decreased by 50.3% to Kshs 1.3 bn from Kshs 2.6 bn in Q3’2017. With the growth in NPLs partially matched with a similar increase in provisioning, the NPL coverage decreased to 36.8% in Q3’2018 from 38.1% in Q3’2017. The increase in the non-performing loans was attributed to challenges experienced in the manufacturing, trade, real estate, and consumer loans sectors,
- Shareholders’ funds increased by 5.3 % to Kshs 70.9 bn in Q3’2018 from Kshs 67.3 bn in Q3’2017, as retained earnings grew by 6.5% y/y to Kshs 62.5 bn, from Kshs 58.7 bn in Q3’2017,
- Co-operative Bank remains sufficiently capitalized with a core capital to risk-weighted assets ratio of 16.5%, 6.0% above the statutory requirement. In addition, the total capital to risk-weighted assets ratio was 16.6%, exceeding the statutory requirement by 2.1%. Adjusting for IFRS 9, the core capital to risk-weighted assets stood at 17.3%, while total capital to risk-weighted assets came in at 17.4%, indicating that the bank’s total capital relative to its risk-weighted assets declined by 0.8% due to implementation of IFRS 9. This is because the banks are allowed to add back amounts used in provisioning to capital for capital computation purposes, as they implement IFRS 9,
- The bank currently has a Return on Average Assets (ROaA) of 3.1% and a Return on Average Equity (ROaE) of 17.6%.
For more information, see our Co-operative Bank Q3’2018 Earnings Note
Universe of Coverage
Below is a summary of our SSA universe of coverage:
|
Equities Universe of Coverage |
|||||||||
|
Banks |
Price as at 9/11/2018 |
Price as at 16/11/2018 |
w/w change |
YTD Change |
LTM Change |
Target Price* |
Dividend Yield** |
Upside/Downside |
P/TBv Multiple |
|
NIC Bank*** |
22.8 |
23.0 |
1.1% |
(31.9%) |
(30.7%) |
48.8 |
4.3% |
116.5% |
0.6x |
|
Diamond Trust Bank |
158.0 |
160.0 |
1.3% |
(16.7%) |
(15.8%) |
283.7 |
1.6% |
78.9% |
0.9x |
|
KCB Group*** |
39.0 |
38.0 |
(2.6%) |
(11.1%) |
(6.7%) |
61.3 |
7.9% |
69.2% |
1.2x |
|
Union Bank Plc |
5.1 |
4.9 |
(4.0%) |
(37.8%) |
(20.8%) |
8.2 |
0.0% |
68.0% |
0.5x |
|
Ghana Commercial Bank*** |
4.9 |
5.1 |
3.9% |
0.8% |
19.2% |
7.7 |
7.5% |
59.1% |
1.2x |
|
I&M Holdings*** |
90.0 |
90.0 |
0.0% |
(29.1%) |
(25.0%) |
138.6 |
3.9% |
57.9% |
0.9x |
|
Ecobank |
7.5 |
7.0 |
(6.7%) |
(7.9%) |
2.0% |
10.7 |
0.0% |
53.3% |
1.5x |
|
Equity Group |
39.3 |
39.0 |
(0.6%) |
(1.9%) |
(3.1%) |
56.2 |
5.1% |
49.2% |
1.9x |
|
Zenith Bank*** |
24.0 |
24.4 |
1.7% |
(4.8%) |
1.5% |
33.3 |
11.1% |
47.6% |
1.1x |
|
Co-operative Bank |
14.1 |
14.2 |
0.7% |
(11.3%) |
(11.5%) |
19.9 |
5.6% |
45.8% |
1.2x |
|
UBA Bank |
7.8 |
8.0 |
1.9% |
(22.8%) |
(16.3%) |
10.7 |
10.7% |
45.3% |
0.5x |
|
CRDB |
150.0 |
145.0 |
(3.3%) |
(9.4%) |
(3.3%) |
207.7 |
0.0% |
43.2% |
0.5x |
|
CAL Bank |
1.0 |
1.0 |
2.0% |
(5.6%) |
10.0% |
1.4 |
0.0% |
37.3% |
0.9x |
|
HF Group |
5.5 |
5.4 |
(1.8%) |
(48.6%) |
(51.6%) |
6.6 |
6.5% |
29.9% |
0.2x |
|
Access Bank |
7.7 |
7.7 |
0.0% |
(26.3%) |
(21.9%) |
9.5 |
5.2% |
28.6% |
0.5x |
|
Barclays |
11.6 |
11.2 |
(3.0%) |
16.7% |
12.6% |
12.5 |
8.9% |
20.5% |
1.5x |
|
Stanbic Bank Uganda |
32.8 |
33.0 |
0.5% |
21.1% |
21.1% |
36.3 |
3.5% |
13.5% |
2.3x |
|
SBM Holdings |
6.2 |
6.1 |
(0.3%) |
(18.1%) |
(19.2%) |
6.6 |
4.9% |
11.7% |
0.9x |
|
Standard Chartered |
190.0 |
192.0 |
1.1% |
(7.7%) |
(12.7%) |
196.3 |
6.5% |
8.8% |
1.5x |
|
Bank of Kigali |
280.0 |
289.0 |
3.2% |
(3.7%) |
1.4% |
299.9 |
4.8% |
8.6% |
1.6x |
|
Bank of Baroda |
125.0 |
125.0 |
0.0% |
10.6% |
13.6% |
130.6 |
2.0% |
6.5% |
1.1x |
|
Guaranty Trust Bank |
36.9 |
37.2 |
0.7% |
(8.8%) |
(13.8%) |
37.1 |
6.5% |
6.3% |
2.3x |
|
Stanbic Holdings |
91.0 |
91.5 |
0.5% |
13.0% |
14.4% |
92.6 |
2.5% |
3.7% |
0.9x |
|
FBN Holdings |
7.5 |
7.5 |
0.0% |
(15.3%) |
12.5% |
6.6 |
3.4% |
(7.7%) |
0.4x |
|
Standard Chartered |
20.2 |
21.8 |
7.9% |
(13.7%) |
(0.3%) |
19.5 |
0.0% |
(10.7%) |
2.7x |
|
National Bank |
5.8 |
5.8 |
(0.9%) |
(38.5%) |
(39.8%) |
4.9 |
0.0% |
(14.8%) |
0.4x |
|
Stanbic IBTC Holdings |
48.0 |
47.1 |
(1.9%) |
13.5% |
10.6% |
37.0 |
1.3% |
(20.2%) |
2.4x |
|
Ecobank Transnational |
15.8 |
15.6 |
(1.3%) |
(8.5%) |
(8.5%) |
9.3 |
0.0% |
(40.3%) |
0.6x |
|
*Target Price as per Cytonn Analyst estimates **Upside / (Downside) is adjusted for Dividend Yield ***Banks in which Cytonn and/or its affiliates holds a stake. ****Stock prices indicated in respective country currencies |
|||||||||
We are “NEUTRAL” on equities for investors with a short-term investment horizon since the market has rallied and brought the market P/E slightly above its’ historical average. However, pockets of value exist, with a number of undervalued sectors like Financial Services, which provide an attractive entry point for long-term investors, and with expectations of higher corporate earnings this year, we are “POSITIVE” for investors with a long-term investment horizon.
In the financial services sector, TransCentury, a Kenyan-based Investment firm with focus in infrastructure has rolled over USD 3.5 mn (Kshs 360.2 mn) worth of short-term loans by one year. The loan was taken from Kuramo Capital, a New York- based investment management firm focused on alternative investments in frontier and emerging markets. The loan was acquired through three separate transactions:
- A USD 1.8 mn (Kshs 185.2 mn) loan issued February 2017 at an interest rate of 6.0% and is due December 2018. The loan is secured by a charge of 56.7 mn ordinary shares of East African Cables which have a current market value of Kshs 153.1 as at November 16,2018,
- A USD 1.2 mn (Kshs 123.5 mn) loan issued June 2017 at an interest rate of 5.0% and was due July 2018. The loan is secured by a similar number of shares (56.7 mn shares) in East African Cables which have a current market value of Kshs 153.1 mn as at November 16, 2018, and,
- A USD 0.5 mn (Kshs 51.5 mn) loan issued in October 2017 at an interest rate of 5.0% and matures in December 2018. The loan is secured by a charge of 0.1 mn ordinary shares of Tanelec Limited.
This comes after the Capital Markets Authority called out TransCentury and its subsidiary East African Cables, which are currently operating in a negative working capital position contrary to the rules governing issuers at the Nairobi Securities Exchange (NSE). The extension allows cash strapped TransCentury time to further clean up its books. Failure to settle the loan by TransCentury will result in Kuramo Capital acquiring stakes in the subsidiaries (East African Cables and Tanelec), adding to the 25.0% stake Kuramo Capital owns in TransCentury. Currently TransCentury owns 68.4% stake in EA Cables and defaulting of the loan will lead to Kuramo Capital acquiring 30.9% stake of TransCentury in EA Cables.
In another transaction, Kenyan Tier 3 bank Sidian Bank has secured Kshs 235.0 mn from the East African Development Bank (EADB) for lending to small and medium enterprises (SMEs) in the agribusiness sector across the country. The loan will run for eight-years at an undisclosed rate and comes with technical assistance through capacity building to equip the bank’s staff with skills on best practices for agribusiness financing. The East African Development Bank (EADB) is a development finance institution established in 1967 with the objective of providing financial support to the member countries of the East African Community. The EADB’s loan portfolio is well distributed, but more than 60.0% of its lending is to projects in health and education, hotels and tourism, construction and building, electricity and water, and agriculture. The partnership will enable Sidian Bank to expand its financing to farmers, enterprises, producer organisations as well as those in the agribusiness value chain. Kenyan banks have, in recent years, taken on substantial loans from international financiers including International Finance Corporation (IFC), European Investment Bank and the African Development Bank (AfDB). Previously, Equity Group, Co-operative Bank, Diamond Trust Bank, Stanbic Holdings and KCB Group have borrowed from international financiers mainly to finance their onward lending businesses. This is as highlighted in the table below;
|
International Loans to Kenyan Banks |
|||||
|
Issuer |
Bank |
Issue Date |
Amount of Loan (Kshs bn) |
Term of Credit |
|
|
1. |
Africa Development Bank |
Kenya Commercial Bank |
Oct-17 |
10.4 |
Not specified |
|
2. |
IFC |
I&M Holdings |
Jan-18 |
1.0 |
Not specified |
|
3. |
IFC |
Cooperative Bank |
Feb-18 |
15.2 |
7-years |
|
4. |
Africa Development Bank |
Diamond Trust bank |
Mar-18 |
7.5 |
7-years |
|
5. |
SwedFund |
Victoria Commercial Bank |
Apr-18 |
0.5 |
Not specified |
|
6. |
14 financial Institutions (syndicated) |
Stanbic Bank |
May-18 |
10.0 |
2,3 years |
|
7. |
FMO |
I&M Holdings |
Oct-18 |
4.0 |
Not Specified |
|
8. |
Africa Development Bank |
Sidian Bank |
Nov-18 |
0.3 |
8-years |
|
Total |
48.8 |
||||
The asset-liability mismatch by tenor due to the relatively long-term nature of loans and short-term nature of deposits exposes a gap that banks have chosen to fill with credit from the international financiers.
Despite the recent slowdown in growth, we maintain a positive outlook on private equity investments in Africa as evidenced by the increasing investor interest, which is attributed to; (i) economic growth, which is projected to improve in Africa’s most developed PE markets, (ii) the attractive valuations in Sub-Saharan Africa’s private markets compared to its public markets, and, (iii) the attractive valuations in Sub-Saharan Africa’s markets compared to global markets. Going forward, the increasing investor interest, stable macro-economic and political environment will continue to boost deal flow into African markets.
- Residential Sector
Local real estate agency Hass Consult announced a joint venture with the family of the late Government Minister Munyua Waiyaki, which will see the development of 450 apartment units, on 22-acres of land owned by the family. The Kshs 10.0 bn project located along Redhill Road will have one, two, three, and four bedroom apartments with price points of Kshs 15.0 mn, 20.0 mn, 40.0 mn, and 80.0 mn, respectively, as well as studio apartments of Kshs 6-10 mn (sizes undisclosed). The Mixed-use Development dubbed ‘Enaki’ is slated to break ground mid-2019, and will include a hotel, retail, and high-end amenities such as an amphitheater, a floating restaurant, and a public botanical garden. Local developers’ continued investment in luxury homes has been driven by:
- Relatively high returns to investors; According to Cytonn Research, luxury developments offer higher returns to investors, with luxury apartments generating total returns to investors of 13.1% p.a as at 2017 (rental yield of 8.1% and price appreciation of 5.0%), compared to the residential market average of 5.4% as at 2017 and 2.8% as at Q2’2018. The returns are boosted by premium rents luxury homes attract as a result of the amenities and high quality of level of finishing,
- The growth of the middle class as well as high net-worth individuals with sophisticated tastes, aspirational lifestyles, and increased disposable incomes, thus creating a market for luxury products, and,
- The presence of multinational firms such as Google, General Electric and Hewlett Packard, as well as the recent entry of firms such as Wrigley’s and Volkswagen, creating demand for up-market housing from expatriates.
Developers are, therefore, likely to continue investing in luxury products given the above factors. However, developers of luxury products ought to differentiate their products, especially in terms of amenities, quality and design, given the increased supply in middle class and high-end units in the market, to attract their target clientele.
- Retail Sector
During the week, global luxury fashion house, Hugo Boss, opened its first store in East Africa at the Westgate Mall, in Westlands area, at a cost of Kshs 173.1 mn. The brand currently operates 31 stores across 26 countries in Africa and 127 stores globally. This comes after the recent opening by Mango, also a multinational fashion company that launched its first store in Eastern and Southern Africa, still at the Westgate Mall. The continued expansion of global retailers demonstrates the attractiveness of Kenya as an investment destination and we attribute this to:
- Stable economic growth, with Kenya’s GDP growth averaging at 5.1% over the last five-years, and set to come in at 5.4%-5.6%, according to Cytonn Research,
- Kenya’s improvement in ease of doing business rankings, with the World Bank Doing Business Report 2019 ranking the country #61 a rise in 19 ranks from #80 in the 2018 report, mainly on account of the protection of minority investors, ease of getting credit, and ease of resolving insolvency, among others. For more information, see our Topical on the World Bank Doing Business Report 2019 here,
- The rising middle-class that has increased purchasing power as well as varying tastes and preferences for different goods and services, thus creating demand for international brands, and,
- The expanding cluster of wealthy individuals who have created demand for luxury products. According to the 2018 Knight Frank Wealth Report, the number of high net-worth individuals in Kenya worth at least USD 5.0 mn excluding their primary residence increased by 16.2% to 1,290 in 2017 from 1,110 in 2016 and is expected to grow by 60.5% by 2022. The increase in wealth and thus, increase in disposable income, leads to demand for luxury products especially clothing, accessories, and automobile items.
Other luxury brands that have set up shop in Kenya are luxury jewelry brand Swarovski, as well as luxury car brands Bentley and Porsche. These multinational brands demand top quality retail spaces, resulting in a surge in high-grade mall supply and incorporation of differentiating practices such as Green Building Technology, spacious and aesthetically appealing working spaces, as well as provision of adequate parking spaces.
For investors in retail real estate, the entry of foreign players boosts retail space uptake and thus, enhances investor returns. According to Cytonn Q3’2018 Markets Review, the retail sector recorded an average rental yield of 9.4% with average occupancy of 83.7%. Westlands was the best performing retail node with an average rental yield of 12.4%, 3.0% higher than the market average, attributable to relatively high occupancy rates, which came in at 90.2%, and premium rental rates that it attracts as it is a prime commercial and residential area hosting several multinational companies and is in close proximity to affluent neighborhoods such as Riverside, Spring Valley, Gigiri and Runda, which host a large portion of Nairobi’s high-end and upper-middle class population. These residents create a ready market for sophisticated products and services, thus attracting both local and international retailers to the malls located in Westlands.
|
Nairobi Retail Sector Performance by Nodes Q3'2018 |
|||
|
Location |
Average Rent Q3'2018 per SQFT per Month |
Average Occupancy Rate Q3'2018 |
Rental Yield Q3'2018 |
|
Westlands |
218.8 |
90.2% |
12.4% |
|
Kilimani |
184.1 |
97.5% |
11.8% |
|
Karen |
212.8 |
96.0% |
10.8% |
|
Ngong Road |
170.5 |
94.4% |
10.1% |
|
Thika road |
194.3 |
76.5% |
8.8% |
|
Kiambu Road |
199.9 |
67.0% |
8.7% |
|
Mombasa Road |
156.2 |
74.4% |
7.8% |
|
Satellite Towns |
124.5 |
89.3% |
6.6% |
|
Eastlands |
149.1 |
68.2% |
7.0% |
|
Average |
178.9 |
83.7% |
9.4% |
Source: Cytonn Research
We expect global retailers to continue showing interest in the Kenyan retail sector, mainly attracted by the rise in disposable incomes, change in consumer tastes & preferences, and fast economic growth enabled by infrastructural developments.
- Hospitality Sector
During the week, the Kenyan hospitality scene received global recognition as 10 local hotels brands bagged various awards at the World Luxury Hotel Brands Awards 2018 held in Bali, Indonesia. Some of the notable winning hotels include Sarova and DusitD2, as shown below:
|
World Luxury Hotel Brand Award 2018 Winners |
|
|
Hotel |
Award |
|
Sarova Hotels, Resorts, and Game Lodges |
Global Luxury Brand |
|
Sankara Nairobi |
Continental Luxury Boutique Hotel |
|
Lake Nakuru Sopa Lodge |
Global Luxury Wilderness Lodge |
|
DusitD2 |
Regional Luxury Business Hotel |
|
Elewana Loisaba Tented Camp, Laikipia |
Global Luxury Tented Safari Camp |
|
|
Source: World Luxury Hotel Brands Awards 2018
The awards give Kenya a competitive edge as they affirm the high-quality accommodation services provided, which is a pull factor and is likely to increase the number of inbound international tourists. According to the latest release by the Kenya National Bureau of Statistics (KNBS), Leading Economic Indicators September 2018, the number of tourist arrivals through the Jomo Kenyatta and Moi International Airports, increased by 8.0% for the first 8-months of 2018, reaching 685,736 persons in comparison to the same period in 2017, which came in at 634,828. This is attributable to a calm political climate in 2018, aggressive marketing of the tourism industry by the government, and increased international standard quality in the accommodation sector. Therefore, we expect that the global accolades will boost the number of international arrivals, and thus, hospitality sector returns, coming just a few weeks after the launch of the historic direct flight to the USA by the national carrier Kenya Airways.
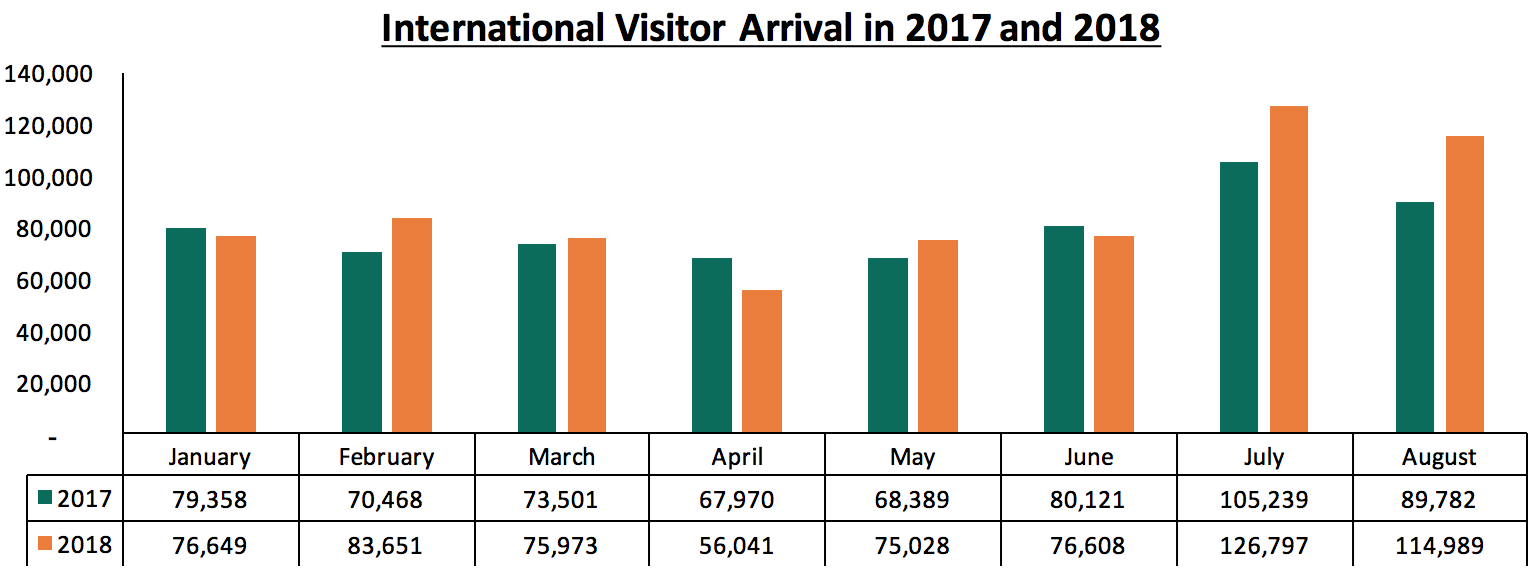
Source: KNBS
Other Highlights:
- Naivas supermarket announced plans of taking up space at the Likoni Mall in Mombasa, in space previously occupied by Nakumatt. This will mark the retailer’s 47th store nationwide, and 3rd in Mombasa County.
We maintain a positive outlook for the real estate industry. We expect the sector to continue growing, bolstered especially by the increased entry of global players, the growth of the middle class, and the improved performance of the tourism & hospitality industries.
Kenya’s real estate and construction market has grown over the last 8-years, with its contribution to GDP increasing from 12.6% in 2010 to 14.1% in 2017, as per statistics from Kenya National Bureau of Statistics (KNBS). The growth has been fuelled primarily by:
- Demand as a result of rapid population growth at 2.6% p.a compared to the global average growth rate of 1.2% as at 2017 according to the World Bank,
- High rate of urbanization at 4.4% p.a, compared to the global average of 2.1%,
- Infrastructural development in various parts of the country, which has opened up areas for development and improved the ease of doing business in the country,
- Entrance of multi-national firms such as Wrigley and Volkswagen & Swarovski, who demand institutional grade commercial and residential real estate,
- Relatively high real estate developer returns of over 20.0% p.a. on average over the last 5- years, compared to an average of 13.2% p.a for traditional asset classes, and,
- Nairobi’s positioning as the regional hub for East Africa.
As the market peaks, however, there has been increased supply of office space, retail space and residential units in the upper segment of the market, against shrinking demand, resulting in increased competition among developers and thus subdued returns. In order to differentiate their products, we are now seeing more developers undertaking Mixed-Use Developments (MUDs), which integrate various uses (residential, commercial, hospitality, retail, etc.) in one so as to maximise land use whilst increasing uptake through creation of a live, work, play and invest environment for building occupants. This week, we look into MUDs in the Nairobi Metropolitan Area by covering the following:
- Introduction to Mixed-Use Developments,
- Advantages of Mixed-Use Developments,
- Limitations of Mixed-Use Developments,
- Performance of Mixed-Use Developments in the Nairobi Metropolitan Area, and
- Recommendations and Conclusions.
- Introduction to Mixed-Use Developments
A Mixed-Use Development (MUD) refers to a real estate development containing more than one real estate theme. Such a development would, therefore, have 2 or more uses, that is, residential, retail, office, and hospitality, all in one location. MUDs are not a new trend in Kenya with several developments particularly in the commercial zones having a mix of office and retail space, while those in townships areas have retail space on the ground floors and residential areas on the upper floors. In the recent years, however, we have seen the emergence of large-scale integrated mixed-use developments, composed of extensive retail malls, Grade A office spaces, residential precincts with apartments and/or villas, restaurants, hotel rooms and serviced apartments. Some of the recently completed MUDs in the Nairobi Metropolitan Area include Garden City along the Thika Super Highway, Two Rivers along Limuru road, Le Mac in Westlands, NextGen along Mombasa road, Yaya centre in Kilimani, and 14 Riverside in Riverside; while some of those in the pipeline include Montave and Pinnacle Towers in Upper Hill, and Global Trade Center in Westlands.
- Advantages of Mixed-Use Developments
The growing popularity of mixed-use developments is mainly driven by the following advantages;
- Higher Returns - According to our research, MUDs perform better, recording an average rental yield of 8.0% (retail, offices and residential spaces in MUDs recording a rental yield of 8.5%, 8.2% and 5.6%, respectively), compared to a market average of 7.5% for single-themed developments (retail, offices and residential spaces recording a rental yield of 9.5%, 7.9% and 5.0%, respectively),
- Operational Synergies - The various themes in an MUD can generate operational synergies whereby one’s performance complements the others. For instance, building residents will create a ready market for retail services while firms occupying office space are potential clients for hotel, restaurant and conferencing space in the hotel. As a result, improvement of performance of one theme leads to better performance in other themes,
- Risk Diversification - Having multiple components in the development creates multiple revenue streams that help to diversify the risk of a project. In case uptake for one of the themes is low, the developer or property manager will continue to receive revenues from the other themes. The developer can also opt to alter uses, depending on each theme’s performance; for example, underperforming residential units can be converted to office space if zoning regulations allow for it,
- Economies of Scale - MUDs enable effective use of space/land hence maximisation of returns while shared infrastructure and facilities such as lifts, parking, and lobbies result in savings on construction and operational costs, and,
- Greater Efficiency for Occupants - MUDs create an environment where occupants can live, work, play and invest all in one location, hence reducing time and cost incurred while commuting. By creating convenience, therefore, MUDs attract demand from both prospective homeowners and corporations.
- Limitations of Mixed-Use Developments
Despite the highlighted benefits, Mixed-Use Developments have downsides, including;
- High Construction and Development Costs - MUDs are costly to construct attributable to the intricacy of the architectural designs aimed at ensuring functionality, proper interfacing across the incorporated uses and the overall aesthetic appeal of the project, soaring land prices in urban areas and lengthened time-frames of large-scale developments which results in higher financing costs,
- Cannibalisation Risk – If not well-planned, MUDs face the risk of cannibalisation due to having competing concepts in the same development such as serviced apartments and hotel, and,
- Congestion – If an MUD is constructed on a small piece of land, it may result in congestion causing problems such as noise transfer from commercial to residential areas and inadequacy of facilities such as parking spaces, making it less appealing for prospective residents/firms.
From the above, we can see that the success of a Mixed-Use Development significantly depends on how it is executed right from the site selection, concept design and user/tenant mix. Developers, therefore, need to identify suitable locations based on market demand and also establish how to strike the right balance between the incorporated uses in a Mixed-Use Development in order to achieve optimal returns.
- Performance of Mixed-Use Developments (MUDs) in the Nairobi Metropolitan Area
We undertook market research on MUDs in the Nairobi Metropolitan Area to determine their returns and issue recommendations on the best areas to invest. We also compared returns in MUDs to single-themed developments. In our research, we focussed on projects with a Total Built Area (TBA) of at least 60,000 SQFT and analyzed the performance of the residential, commercial office and retail segments of Mixed-Use Projects. The key metrics we looked into include;
- Prices – This is a measure of how much developers are asking for sale units in the market,
- Rental Rates – This is the amount tenants pay per unit of space in a specific market. This will inform potential investors on the rental income they are likely to gain from investing in an MUD,
- Annual Uptake – This measures the number of units in a development that are sold out per annum. This allows the investor to appreciate the rate at which available units are sold over a specific period and gauge whether it is profitable to invest in a given area,
- Occupancy Rates -This measures the number of units or the size of the development that is let out, in order to inform on the expected rental yield of the building, and,
- Rental Yield - This measures the return on real estate property value, from the rental income collected. This informs potential investors on the return they are likely to get from a property and hence the time it will take for an investor to get back the money invested. This is calculated as ((Rent x Occupancy Rate x 12 months)/Price) X 100%
In our analysis of the MUD market performance in 2018, we will start by covering the general market performance in Nairobi per location then proceed to compare real estate themes in MUD versus single themed developments’ performance.
- Mixed-Use Development Performance per Node
From our research, MUDs encompassing office, retail and residential themes have an average rental yield of 8.0%. MUDs in the Limuru Road and Karen nodes are the best performing, recording a rental yield of 9.6% and 9.4%, respectively. The performance is attributable to the fact that these developments are located in high-end neighbourhoods (Karen, Runda, Rosslyn, Kitisuru, among others) hosting Nairobi’s middle-end and high-end population, with higher purchasing power and who are thus willing to pay a premium for class and amenities provided. Areas characterized by traffic congestion and a low-income population with low purchasing power such as Mombasa road and Eastlands, are the worst performing nodes recording average rental yields of 5.7% and 5.4%, respectively.
The performance of the key nodes in the Nairobi Metropolitan Area is as summarized below:
All values in Kshs unless stated otherwise
Nairobi’s Mixed-Use Developments Market Performance by Nodes 2018
Development Composition %
Retail Performance
Office Performance
Residential Performance
Location
Retail %
Office %
Resi. %
Price Kshs / SQFT
Rent Kshs /SQFT
Occup. (%)
Rental Yield (%)
Price Kshs / SQFT
Rent Kshs/SQFT
Occup. %)
Rental Yield (%)
Price Kshs /SQM
Rent Kshs /SQM
AnnualUptake %
Rental Yield %
Average MUD yield
Limuru Rd
60.0%
20.0%
19.0%
23,975.0
277.0
80.0%
11.1%
13,500.0
103.0
70.0%
6.4%
177,935
1,259
25.0%
8.5%
9.6%
Karen
51.0%
48.0%
5.0%
23,333.0
186.0
99.0%
9.4%
13,409.0
120.0
87.0%
9.3%
215,983
821
27.0%
4.6%
9.4%
UpperHill
10.0%
90.0%
15,903.0
147.0
72.0%
7.7%
13,095.0
113.0
86.0%
8.8%
8.7%
Kilimani
25.0%
75.0%
19,571.0
168.0
87.0%
9.1%
12,875.0
102.0
82.0%
7.7%
8.6%
Thika Rd
36.0%
14.0%
50.0%
35,000.0
297.0
95.0%
9.7%
12,500.0
111.0
90.0%
9.6%
161,849.0
756.0
20.0%
5.6%
7.6%
Westland
27.0%
58.0%
59.0%
16,399.0
179.0
65.0%
8.1%
12,845.0
113.0
76.0%
8.1%
201,274.0
636.0
31.0%
3.8%
7.0%
Msa Rd
51.0%
10.0%
39.0%
20,000.0
180.0
50.0%
5.4%
13,200.0
96.0
75.0%
6.5%
171,304.0
843.0
5.9%
5.7%
Eastlands
25.0%
75.0%
20,000.0
132.0
76.0%
6.0%
81,717.0
351.0
20.0%
5.1%
5.4%
Average
58.1%
30.9%
41.3%
19,663.5
181.2
76.9%
8.5%
13,014.6
110.3
81.1%
8.2%
168,343.5
777.5
24.5%
5.6%
8.0%
- Retail space outperforms other themes, recording a rental yield of 8.5%, followed by office space at 8.2% and the residential theme at 5.6%, translating to a weighted average rental yield of 8.0% p.a.
- Limuru Road and Karen are the best performing nodes, recording a rental yield of 9.6% and 9.4%, respectively. The performance is attributable to the fact that these are high-end neighbourhood hosting most of Nairobi’s middle-end and high-end population, with higher purchasing power and thus willing to pay a premium for class and amenities provided
- Mombasa road and Eastland’s are the worst performing nodes, attributable to traffic congestion in Mombasa road and competition from informal real estate developments in Eastlands hence leading to low market price and rental charges
Source: Cytonn Research
- Performance of Real Estate Themes in MUDs versus Single-themed Developments’ Performance
We looked at the prices, rents and returns of each theme in mixed-use developments in comparison to the theme’s average performance in the market, to determine the return margin of investing in an MUD. The findings are as summarised below;
- Retail Space
Retail space in mixed-use developments record an average rental yield of 8.5% with an average occupancy of 76.9%. This is 1.1% points and 4.3% percentage points lower than the market average at 9.5% yield and 81.2% occupancy. This indicates that retail space performs worse in an MUD context in comparison to being in isolation and we attribute this to competition from shopping centres and malls, strategically located in residential areas, making them easier to access. We, however, note that in destination mixed-use developments, retail space performs better due to the state-of-the-art facilities provided that attract clientele who are looking for an experience.
Below is a summary of the performance of retail space in MUDs versus market performance:
All values in Kshs unless stated otherwise
Performance of Retail Space in MUDs versus Market Performance 2018
MUD Performance
Market Performance
Location
Rent Kshs/SQFT
Occupancy (%)
Rental Yield (%)
Rent Kshs/SQFT
Occupancy (%)
Rental Yield (%)
Rental Yield Difference
Limuru Road
277.0
80.0%
11.1%
199.9
67.0%
8.7%
2.4%
Thika Road
296.7
95.0%
9.7%
194.3
76.5%
8.8%
0.8%
Eastlands
132.5
76.0%
6.0%
149.1
68.2%
7.0%
(1.0%)
Karen
186.3
99.0%
9.4%
212.8
96.0%
10.8%
(1.4%)
Kilimani
168.3
86.7%
9.1%
177.3
95.9%
11.0%
(1.9%)
Mombasa Road
179.7
50.0%
5.4%
156.2
74.4%
7.8%
(2.4%)
Westlands
179.5
65.0%
8.1%
218.8
90.2%
12.4%
(4.2%)
UpperHill
147.3
71.7%
7.7%
Average
181.2
76.9%
8.5%
186.9
81.2%
9.5%
(1.1%)
- Retail space in MUDs records a rental yield of 8.5%, 1.1% points lower than the market average at 9.5%, attributable to the competition from malls that are located in key residential areas
- Retail spaces in MUDs in the Limuru road and Thika road nodes have a positive margin of 2.4% and 0.8% points, respectively, as they charge higher rental rates and have higher occupancies with projects such as Two Rivers mall and Garden City mall, which are destination malls thus attracting higher footfall
- Retail spaces in MUDs in Westlands, Mombasa Road, Kilimani and Karen nodes record a negative margin, due to competition from community malls in these nodes that are strategically located in residential areas, while Eastlands’ performance is negatively impacted by competition from the informal retail shops such as Kiosks
Source: Cytonn research
- Commercial Office Space
Commercial offices in mixed-use developments record higher rental yields of 8.2%, 0.3% points higher than the market average at 7.9%. This is attributable to high rental charges of Kshs 110.3/SQFT compared to the market average at Kshs 99.2/SQFT, given that they are mainly Grade A offices with state-of-the-art technical services provided such as high-quality elevators, fittings and automation systems and ample parking at a minimum ratio of 3:1000 (3 parking slots for every 1000 SQFT), which lack in Grade B and C offices, hence tenants are willing to pay a premium.
Below is a summary of the performance of commercial offices in MUDs versus market performance:
All values in Kshs unless stated otherwise
Performance of Commercial Offices in MUDs versus Market Performance 2018
MUD Performance Market Performance
Location
Price Kshs / SQFT
Rent Kshs/SQFT
Occupancy (%)
Rental Yield (%)
Price Kshs / SQFT
Rent Kshs/SQFT
Occupancy (%)
Rental Yield (%)
Rental Yield Difference
Thika Road
12,500.0
111.0
90.0%
9.6%
11,750.0
85.0
89.0%
7.7%
1.9%
UpperHill
13,095.0
113.0
86.0%
8.8%
13,385.7
99.6
89.5%
7.9%
0.9%
Karen
13,409.0
120.0
87.0%
9.3%
12,887.5
116.7
82.5%
9.0%
0.4%
Mombasa Road
13,200.0
96.0
75.0%
6.5%
11,750.0
81.7
71.0%
6.2%
0.4%
Kilimani
12,875.0
102.0
82.0%
7.7%
13,031.4
101.4
80.9%
7.7%
0.0%
Westlands
12,845.0
113.0
76.0%
8.1%
11,346.2
111.2
89.0%
9.1%
(1.0%)
Limuru Road
13,500.0
103.0
70.0%
6.4%
Average
13,014.6
110.3
81.1%
8.2%
12,358.5
99.2
83.7%
7.9%
0.4%
*The average rental yield for offices published in our previous reports assumed 100% occupancy rates
- Offices in MUDs records a rental yield 8.2%, 0.4% points higher than the market average at 7.9%, attributable to higher rental charges due to a live work play environment provided by MUD and a state-of-the-art technical services provided such as high-quality elevators, fittings and automation systems and ample parking at a minimum ratio of 3:1000 (3 parking slots for every 1000 SQFT) which lack in Grade B and C offices which are common in the market
Source: Cytonn research
- Residential Space
Incorporation of the residential theme in large scale integrated mixed-use developments in the Nairobi Metropolitan Area is growing in popularity, and we have seen this in developments such as Two Rivers along Limuru road, Garden City along Thika road and Nextgen along Mombasa road among others. Residential units in MUDs record higher prices at Kshs 168,343.5/SQM and rental yield at 5.6%, compared to the market average price at Kshs 127,895.3/SQM and rental yield at 5.0% due the convenience, that MUDs create, therefore, attract demand from prospective homeowners who are willing to pay a premium on the same.
Below is a summary of the performance of residential units in MUDs versus market performance:
All values in Kshs unless stated otherwise
Performance of Residential Units in MUDs versus Market Performance 2018
MUD performance
Market performance
Location
Price Kshs /SQM
Rent Kshs /SQM
Uptake %
Rental Yield %
Price Kshs /SQM
Rent Kshs /SQM
Uptake %
Rental Yield %
Rental Yield Difference
Thika Road
161,848.5
756.1
20.1%
5.6%
124,554.0
297.0
22.3%
2.8%
2.8%
Mombasa Road
171,304.2
842.5
5.9%
107,819.4
510.4
26.5%
5.7%
0.2%
Karen
215,982.7
820.7
26.7%
4.6%
194,340.6
799.5
28.3%
4.7%
(0.2%)
Eastlands
81,717.2
350.6
20.0%
5.1%
80,635.0
370.7
21.5%
5.6%
(0.5%)
Westlands
201,273.9
635.9
30.5%
3.8%
132,127.6
635.9
26.1%
6.0%
(2.2%)
Limuru Road
177,934.7
1,258.9
25.0%
8.5%
Average
168,343.5
777.5
24.5%
5.6%
127,895.3
522.7
24.9%
5.0%
0.0%
*Key to note, Thika Road represents Kasarani area, Mombasa Road represents South B & C area, while Eastlands represents the Donholm & Komarock area
- Residential units in MUDs record a rental yield 5.6%, 0.6% points higher than the market average, attributable to higher prices and rental charges due to the premium charged on amenities and trunk infrastructure provided and convenience enjoyed due to a live-work-play environment in MUDs
- MUDs in Thika road and Mombasa road have the highest positive margin of 2.8% and 0.2% points, respectively due to higher rental charges of 154.5% and 65.1% above market, with MUD targeting high-end income earners willing to pay a premium for class, hence a different market niche
- MUDS in Karen, Eastlands and Westlands record a negative margin of 0.2%, 0.5% and 2.2% points, respectively. The Karen and Westlands performance is attributable to the fact that the target market is looking for privacy and exclusivity that MUDs don't offer, while Eastlands the market is more low income thus looking for affordability
Source: Cytonn Research
- Retail Space
- Summary of Thematic Performance in MUDs in Comparison to General Market Performance
When we compare the average rental yields of themes in MUDs to the overall market performance for each theme, we find that office space and residential units in MUDs have higher rental yields at 8.2% and 5.6% compared to the market average at 7.9% and 5.0% mainly attributed to higher rents and prices charged due to amenities and facilities provided.
All values in Kshs unless stated otherwise
Thematic Performance in MUDs in Comparison to Overall Market Performance in the Highlighted Nodes 2018
Themes
MUD Themes Average
Rental Yield %
Market Average
Rental Yield %
Rental Yield
Difference
Retail
8.5%
9.5%
(1.0%)
Offices
8.2%
7.9%
0.3%
Residential
5.6%
5.0%
0.6%
Average
7.4%
7.5%
0.0%
- Office space and residential units in an MUDs have higher rental yields at 8.2% and 5.6% compared to the market average at 7.9% and 5.0% mainly attributed to higher rents and prices charged due to amenities and facilities provided
- Retail sector records 1.0% points, lower than the market average due to competition from destination and community malls that are located strategically in residential areas
Source: Cytonn research
- Recommendations and Conclusion
With an average weighted rental yield of 8.0%, (8.5% for retail space accounting for 30.9% of MUD lettable area on average, 8.2% for office space accounting for 58.1% of MUD lettable area on average and 5.6% for residential space accounting for 41.3% of MUD lettable area on average) mixed-use developments have higher returns compared to market average at 7.5%. MUDs are, therefore, a viable investment mainly for office and residential spaces recording a high rental yield of 8.2% and 5.6%, 0.3% and 0.6% points, above the market average at 7.9% and 5.0%, respectively and minimal allocation to retail space. They are suitable for developers and investors looking to diversify their real estate portfolio, given that some themes such as office and retail having an oversupply of 4.7mn and 2.0mn SQFT space, respectively in Nairobi Metropolitan Area. The investment opportunity within the Nairobi Metropolitan Area is, thus, in areas such as Limuru road, Karen, Upperhill and Kilimani recording the highest rental yield returns of 9.7%, 9.4%, 8.7%, and 8.6%, respectively.

- Talk to us
- Kenya
- P.O Box 20695 - 00200, Nairobi, Kenya
- Cell +254709101200
- Tel +254709101200
- WhatsApp +254741676635
- United States
- +254709101200
- DOWNLOAD OUR APP
-


- Kenya
- 8th Floor, Pinetree Plaza, Kaburu Drive, Ngong Road, Nairobi, Kenya
- USA
- Suite 1150, 1775 Eye Street NW, USA, Washington DC 20006, USA
- Investments
- High Yield
- Private Equity
- Real Estate
- Real Estate
- RiverRun Estates
- Cytonn Towers
- The Ridge
- Taraji Heights
- The Alma