Cytonn Q3’2018 Markets Review
By Cytonn Research Team, Sep 30, 2018
Executive Summary
Global Markets Review
The global economy is expected to remain strong, with the World Bank projecting that 2018 growth will stabilize at 3.1% and ease gradually over the next 2-years to 2.9% in 2020, as major Central Banks gradually depart from accommodative monetary policies. In September 2018, the US Fed increased the Federal Funds Rate to a range of 2.0 % - 2.25% from 1.75%-2.0% set in June 2018, citing strong economic growth, which it projected at 3.1% in 2018. The key risk to global growth remains the rising trade tensions that have escalated between the US and China;
Sub Saharan Africa Regional Review
Sub-Saharan Africa is estimated to have grown by 2.8% in Q2’2018, which was an increase from 2.6% in Q2’2017; the growth was driven by a supportive external environment and the robust global demand for key commodities. Majority of the SSA stock markets recorded negative returns during Q3’2018 a trend that was also replicated in most emerging markets, attributed to uncertainties from the escalated trade disputes between world powers which saw deepening sell-offs across emerging markets by investors to realize the gains made in various sectors. In the near term, we expect the markets to remain subdued due to the exit by foreign investors
Kenya Macroeconomic Review
The Kenyan economy grew by 6.3% in Q2’2018 according to data released by the Kenya National Bureau of Statistics (KNBS), compared to 4.7% in Q2’2017. Inflation rates increased to 5.7% in September 2018 from 4.2% in June 2018, in line with our expectations of 5.3% - 5.7%. The Monetary Policy Committee (MPC) met twice during the quarter and reduced the Central Bank Rate (CBR) by 50 basis points to 9.0% from 9.5% citing that inflation expectations were well anchored within the target range, and that economic growth prospects were improving;
Fixed Income
During the third quarter of 2018, T-bills auctions recorded an oversubscription, with the average subscription rate coming in at 133.3% compared to 162.7% in Q2’2018. Overall average subscription rates for the 91, 182, and 364-day papers came in at 99.4%, 91.8% and 188.4%, respectively, from 108.5%, 127.8%, 219.4% in Q2’2018. Yields on T-bills declined by 28 bps, 110 bps and 100 bps in Q3’2017, closing at 7.7%, 9.1%, and 10.0%, from 7.9%, 10.2%, and 11.0% for the 91, 182, and 364-day papers, respectively, as at end of Q2’2018;
Equities
During the quarter, the equities market was on a significant downward trend, with NASI, NSE 25 and NSE 20 declining by 14.2%, 15.6% and 12.5%, respectively; taking their YTD performance as at the end of September to (12.6%), (22.5%), and (13.6%) for NASI, NSE 20 and NSE 25, respectively. For the last twelve months (LTM), NASI, NSE 20 and NSE 25 have declined by 8.4%, 22.6%, and 10.5%, respectively. Listed banks in Kenya released their H1’2018 results during the quarter, recording an average core earnings growth of 19.0% compared to a 14.4% decline in H1’2017;
Private Equity
During Q3’2018, we witnessed high levels of private equity activity across the sectors we cover, including Financial Services, FinTech, and Education, evidenced by increased deal activity by global investors including Old Mutual, Kuramo Capital, and Advtech Group, among others. Notable transactions during the quarter include the acquisition of a 6.0% stake in UAP-Old Mutual Holdings by Old Mutual, the successful fundraising of USD 8.0 mn (Kshs 806.3 mn) by Paystack Payments Limited and an initial injection of Kshs 205.0 mn in Kitengela International School (KISC) as part of a Kshs 400.0 mn investment by Fanisi Capital;
Real Estate
During Q3’2018, the real estate sector recorded an array of activities across of all themes bolstered by (i) continued demand for investment property from multinational individuals and the growing middle class, (ii) Kenyan Government efforts towards providing a conducive operating environment for developers through key statutory reforms such as National Land Use Policy, and initiatives such as the National Housing Development Fund set to fund public-private partnerships in delivery of affordable homes, and for end users such as the proposed stamp duty exemption for first time home buyers, (iii) the expanding middle class, and (iv) continued infrastructural improvements. In this report, we have highlighted the industry reports released during the quarter then covered the sectoral performance in the residential, commercial, hospitality, infrastructure, land and listed real estate themes;
- On 29th September 2018, Cytonn Investment Management Plc held its Company, Markets & Projects Updates Event for Quarter 3 at the Alma in Ruaka. The quarterly forums enable the company to provide updates to investors on our outlook of the economy and attractive investment opportunities, while also addressing any questions clients may have pertaining to their investment with Cytonn. See event note here
- On Thursday 27th September 2018, Patricia Wachira, Senior Research Analyst at Cytonn Investments Management Plc was a key note speaker on “Affordable Housing in Kenya” at the Multimedia University Innovation Week. See event note here
- Ian Kagiri, Investment Analyst was on Ebru TV to discuss the performance of the banking sector in H1’2018. Watch him here
- Stanley Ngugi, Financial Advisor at Cytonn Investment Management Plc was on KTN News to discuss the impact of the Finance Act 2018. Watch him here
- We continue to hold weekly workshops and site visits on how to build wealth through real estate investments. The weekly workshops and site visits target both investors looking to invest in real estate directly and those interested in high yield investment products to familiarize themselves with how we support our high yields. Watch progress videos and pictures of The Alma, Amara Ridge, The Ridge, and Taraji Heights. Key to note is that our cost of capital is priced off the loan markets, where all-in pricing ranges from 16.0% to 20.0%, and our yield on real estate developments ranges from 23.0% to 25.0%, hence our top-line gross spread is about 6.0%. If interested in attending the site visits, kindly register here
- We continue to see very strong interest in our weekly Private Wealth Management Training (largely covering financial planning and structured products). The training is at no cost and is open only to pre-screened participants. We also continue to see institutions and investment groups interested in the training for their teams. The Wealth Management Training is run by the Cytonn Foundation under its financial literacy pillar. If interested in our Private Wealth Management Training for your employees or investment group, please get in touch with us through wmt@cytonn.com. To view the Wealth Management Training topics, click here
- For recent news about the company, see our news section here
- We have 10 investment-ready projects, offering attractive development and buyer targeted returns of around 23.0% to 25.0% p.a. See further details here: Summary of Investment-Ready Projects
- We continue to beef up the team with ongoing hires for Business Manager-Commercialization and Unit Managers - Mt. Kenya Region. Visit the Careers section on our website to apply
- Cytonn Real Estate is looking for a 0.75-acre land parcel for a joint venture in any of the following areas, Lavington, Loresho (near Loresho Shopping Centre and its environs), Spring Valley Shopping Centre and its environs, Redhill Road (should be between Limuru Road Junction and Westlands Link Road), Lower Kabete Road (between Ngecha Road Junction and UON Campus), and Karen. The parcel should be in a good location with frontage to a tarmac road. Please note that we are not in the market for land purchase, we are looking ONLY for Joint Venture opportunities. For more information or leads, email us at rdo@cytonn.com
Introduction
According to the World Bank, the global economy grew at an estimated 3.6% in Q2’2018, compared to 3.1% in Q1’2018. Global growth is projected to stabilize at 3.1% in 2018, the same pace as last year, supported by firming investments in advanced economies, a continued recovery in commodity-exporting emerging market and developing economies (EMDEs), and a robust growth in commodity-importing economies. Global growth is projected to ease gradually over the next 2-years to 2.9% in 2020, as major Central Banks gradually depart from accommodative monetary policies that seek to stimulate growth by increasing the overall money supply in the economy. Below is the summary of the key occurrences in Q3’2018 per region:
Unites States:
The US economy grew by 4.2% y/y in Q2’2018, compared to 2.2% y/y in Q2’2017, making it the fastest growth rate in 4-years, attributable to strong gains in private consumption and capital spending. According to the World Bank, growth in Q3’2018 remains robust despite the trade deficit widening, amid rising fiscal stimulus and a strengthening US Dollar. The economy continued to add about 200,000 jobs per month while nominal wage growth reached 2.9% y/y in August, its highest level since 2009.
The Chicago Purchasing Manager’s Index (PMI) fell to a 5-month low of 60.4 in September, down 3.2% points from 63.6 in August. Consumer spending increased steadily in August, supporting expectations of solid economic growth in the third quarter, while a measure of underlying inflation remained within the Federal Reserve’s 2.0% target for a fourth straight month.
The annual GDP growth estimate for 2018 rose to 3.1% from 2.8%, according to the US Federal Reserve, with a projection of 2.5% in 2019, up from an earlier projection of 2.4%., before slowing to 2.0% in 2020 and 1.8% in 2021. The expected slowdown in economic growth will be attributable to the decline in impact of the recent tax cuts, heightened inflation and a rise in interest rates. Additionally, there is rising concern on U.S.’s imposed tariffs on Chinese goods and steel and aluminium imports from most countries. The turn towards protectionist trade policies, aimed at reducing the influence and competitiveness of foreign imports, threatens to slow growth and exert upward pressure on inflation.
The US Fed raised interest rates at its meeting on 26th September 2018, by lifting the benchmark rate by 25 basis points to a range of 2.0 % - 2.25% from 1.75% - 2.0% set in June 2018. The increase in rates was the third this year and the seventh in the last eight quarters, which has been observed as the end of the accommodative monetary policy era after the deep financial crisis.
The hikes were backed by the Fed’s sentiments that (i) the economy was growing at a faster-than-expected rate of 3.1% this year and would continue to expand moderately for at least 3-years from 2018, (ii) a sustained low unemployment rate that is estimated to rise in the fourth-quarter of 2018 from 3.6% to 3.7%, and (iii) stable inflation which is expected to remain close to its 2.0% target over the next 3-years. The U.S. Fed still foresees another rate hike in December, three more in 2019, and one increase in 2020.
The S&P 500 gained by 7.1% in the quarter and has gained 9.0% on a YTD basis, making it the biggest quarterly advance since the fourth quarter of 2013. This growth is tied to the tax overhaul passed last year. The changes, which included a cut to the corporate tax rate, sent corporate profits sharply higher through the first two quarters of the year, and analysts expect third-quarter earnings to be robust as well. Going forward, a strengthening U.S. economy is expected to keep the rally going and help investors look past the continuing trade tensions between the U.S. and China and other nations.
Eurozone:
The European Central Bank (ECB) met on 13th September 2018 and maintained the interest rate on the main refinancing operations at 0.00%, and the interest rates on the marginal lending facility and the deposit facility at 0.25% and (0.40%) respectively. The key ECB interest rates are expected to remain at their present levels through the summer of 2019 and thereafter, to ensure the continued convergence of inflation to levels that are below, but close to 2.0% over the medium term.
The Eurozone recorded a slow 0.4% growth in Q2’2018, compared to a growth of 1.5% in Q2’2017, down from an average of 2.7% in the last two quarters of 2017. According to the September 2018 European
Central Bank (ECB) macroeconomic projections, the Eurozone annual real GDP is projected to increase by 2.0% in 2018, 1.8% in 2019 and 1.7% in 2020. This is a slight downward revision from the June 2018 projections, of 2.1% in 2018 and 1.9% in 2019, reflecting the impact of weakening global trade in leading world economies, compounded by the effect of the Euro’s past appreciation.
Inflation decreased to 2.0% in August 2018 from 2.1% in July, with ECB foreseeing a further decrease to 1.7% in the remainder of 2018, 2019 and 2020. Underlying inflation is expected to pick up towards the end of the year and increase gradually over the medium term, supported by the ECB’s monetary policy measures, the continuing economic expansion and rising wage growth. The unemployment rate declined to 8.2% in July 2018 from 9.1% in July 2017, which is the lowest level observed since Q4’2008, attributable to strong economic growth.
The Euro Stoxx 600 gained by 1.3% in Q2’2018, but has however declined by 1.54% YTD. The index is currently on a declining trend, driven by a plunge in Italian bank equity prices, whose big sovereign bond portfolios make them sensitive to political risk. This was after the Italian Government significantly widened its budget-deficit target for 2019 to 2.4% of GDP, which is three times higher than the number that the previous government had planned. The higher public spending could spark negative market reactions, given that Rome holds the second highest debt pile in the Eurozone after Greece, totalling EUR 2.3 tn (USD 2.7 tn), accounting for 131.8% of its GDP.
The ECB confirmed it will half its asset purchases to EUR 15.0 bn from EUR 30.0 bn per month as of October this year, and it’s on track to end the program by year end. Thereafter, it intends to reinvest the principal payments from maturing securities, so as to maintain favourable liquidity conditions and an ample degree of monetary accommodation.
In the medium term, we expect continued expansion of the Eurozone economy, which will be supported by (i) ECB’s very accommodative monetary policy stance, (ii) increased growth in lending to the private sector, spurred by low interest rates and favourable bank lending conditions, and (iii) lower deleveraging needs, which will drive private expenditure boosting domestic demand, the economy’s main growth driver.
China:
China’s economy grew by 1.8% q/q and 6.7% y/y in Q2’2018 compared to a 1.4 % expansion in Q1’2018. This was driven by (i) a pick-up in the pace of industrial production, (ii) an increase in private consumption, and (iii) increased investment in infrastructure. The economy is still expected to meet this year’s growth target of 6.5%, despite escalating trade tensions with the United States that worsened in September 2018. The U.S. President Donald Trump imposed a 10.0% tariff on USD 200.0 bn of Chinese imports, set to be increased to 25.0% on 1 January 2019, and China responded with duties of its own on USD 60.0 bn of U.S. products.
China's Consumer Price Index rose to a six-month high of 2.3% y/y in August of 2018 from 2.1% in the previous month and slightly above market consensus of 2.2%. The increase was driven by higher prices of food, clothing, rent, fuel and utilities, education, culture and recreation. However, it remained well below the Chinese Government’s target of around 3.0% for 2018. Annual average growth in industrial production, edged up from 6.4% in July to 6.5% in August. Despite the slight improvement in August, growth in industrial production remains sluggish and the trend could even worsen in the coming months when spill overs from the ongoing trade dispute with the United States start to kick in.
The Shanghai Composite Index retreated marginally by 0.9% during the quarter and declined by 15.6% on a YTD basis, the lowest level since 2014 amid trade policy uncertainty. This is due to the sustained effects of the ongoing trade wars with the United States. Downside risks to China’s economic outlook have increased amid escalating trade wars with the United States, a sudden slowdown in the property market and potential corporate defaults. However, the recent shift towards looser fiscal and monetary policy is expected to support domestic demand in the near term.
Commodities:
Global commodity prices declined by 2.5% y/y in August 2018 following July’s 7.3% decrease, representing the steepest fall in nearly 7-years. Prices for both Brent and WTI crude oil declined overall in August to USD 73.1 per barrel and USD 68.0 per barrel, respectively, from USD 74.4 per barrel and USD 70.8 per barrel, respectively, in July. This is attributable to the ongoing trade war between China and the U.S., and rising production by key producers including Russia and Saudi Arabia, after the relaxation of the agreed supply cuts. However, oil prices have risen steadily since mid-August following reports that Iranian oils exports had fallen ahead of the reintroduction of sanctions by the U.S., as well as concern regarding the adverse weather in the U.S.
Metals prices dropped throughout the summer by 3.0%, reflecting concerns about trade tensions and growth prospects in China. Agricultural prices fell in August by 1.8% due to ample supply for key commodities, including coffee and sugar. However, grains prices rose in August by 4.3%, driven by rising wheat prices, due to weather-hit harvests in Europe, Russia and some parts of Australia. Below is a chart showing the performance of select commodity price indices.
We expect the global economy to recover and post a better growth than that recorded in FY’2017, on account of improving commodity prices, increased income levels and by extension consumption levels. However, ongoing geopolitics are likely to dampen any growth prospects.
Regional Growth
Sub-Saharan Africa is estimated to have grown by 2.8% in Q2’2018, which was an increase from 2.6% in Q2’2017. The growth was driven by a supportive external environment and the robust global demand for key commodities. Growth dynamics were, however, far from uniform across the region’s two largest economies, Nigeria and South Africa, which are facing political tensions in the run to next year’s elections. Regional GDP is projected to grow at 3.2% in 2018, and increase to 3.5% in 2019 which will be supported by, (i) a healthy global economy, (ii) elevated commodity prices, (iii) improved agricultural output and (iv), solid government spending. However, the regional economy still faces downside risks of; (i) difficult business conditions and poor infrastructure, (ii) relatively small private sectors that have restrained the pace of the recovery, (iii) high levels of public debt in most economies in the region, and (iv) perennial security concerns which continue to negatively affect investments in the region.
Regional Currency Performance
Regional currencies registered mixed performances in Q3’2018, with majority of the currencies depreciating against the dollar. In the East African region, the Ugandan Shilling and Tanzanian Shilling depreciated by 5.9% and 2.1%, respectively, against the dollar driven by increased food imports during the drought period and increased oil imports as importers took advantage of the lower global oil prices that were expected to rise. Despite the expiry of the IMF precautionary stand-by arrangement during the quarter, the Kenyan shilling strengthened marginally by 0.1% to Kshs 101.0 from Kshs 1011.1 as at the end of Q2’2018, supported by strong dollar inflows from diaspora remittances coupled with thinner dollar demand from exporters. The Kenyan shilling however, had started declining at the tail-end of the quarter due to uncertainties regarding the IMF stand-by arrangement. Below is a table showing the performance of select African currencies:
|
Select Sub Saharan Africa Currency Performance vs USD |
|||||
|
Currency |
Sep-17 |
Dec-17 |
Sep-18 |
Last 12 months |
YTD change % |
|
Zambian Kwacha |
10.5 |
10.0 |
12.0 |
(14.4%) |
(20.4%) |
|
South African Rand |
13.5 |
12.4 |
14.2 |
(4.8%) |
(14.3%) |
|
Botswana Pula |
10.2 |
9.8 |
10.6 |
(3.8%) |
(7.7%) |
|
Mauritius Rupee |
34.0 |
33.6 |
34.4 |
(1.1%) |
(2.4%) |
|
Malawian Kwacha |
726.2 |
725.5 |
727.8 |
(0.2%) |
(0.3%) |
|
Ugandan Shilling |
3,603.0 |
3,643.3 |
3,816.6 |
(5.9%) |
(4.8%) |
|
Kenyan Shilling |
103.2 |
103.2 |
100.8 |
2.3% |
2.3% |
|
Tanzanian Shilling |
2,238.6 |
2,234.6 |
2,284.9 |
(2.1%) |
(2.3%) |
|
Nigerian Naira |
355.0 |
360.0 |
362.8 |
(2.2%) |
(0.8%) |
|
Ghanaian Cedi |
4.4 |
4.5 |
5.0 |
(12.9%) |
(9.8%) |
African Eurobonds
Yields on African Eurobonds have continued to rise in Q3’2018, attributed to the adjustments of global yields to normalisation of monetary policies in the advanced economies which saw the Federal Open Market Committee (FOMC) hiking the US bench mark rate by 0.25% points to a range of 2.0 % - 2.25% from 1.75%-2.0% set in June 2018. The ten-year tenor Eurobonds issued by Senegal, Ghana and Kenya ended the quarter at 6.0% and 15.7%, while the Kenyan Eurobond yield remained stable at 6.8% over the same period
Equities Markets
Majority of the SSA stock markets recorded negative returns during Q3’2018 a trend that was also replicated in most emerging markets attributed to uncertainties from the escalated trade disputes between world powers which saw deepening sell-off across emerging markets by investors to realize the gains made in various sectors. In the near term, we expect the markets to remain subdued due to the exit by offshore investors but will regain due to gains expected to be realized in full year results. Below is a summary of the performance of key bourses in SSA:
|
Equities Market Performance of selected indices( Dollarized) |
|||||||
|
Country |
Sep-17 |
Dec-17 |
June-2018 |
Sep-18 |
Last 12 Months |
YTD Change % |
Q/Q Change(%) |
|
Malawi |
27.4 |
29.8 |
42.4 |
42.3 |
54.3% |
42.1% |
(0.2%) |
|
Ghana |
518.9 |
569.7 |
600.9 |
580.5 |
11.9% |
1.9% |
(3.4%) |
|
Kenya |
1.6 |
1.7 |
1.7 |
1.5 |
(5.5%) |
(10.5%) |
(14.1%) |
|
Rwanda |
0.2 |
0.2 |
0.2 |
0.1 |
(5.0%) |
(5.4%) |
(1.6%) |
|
South Africa |
4,105.3 |
4,802.6 |
4,188.0 |
3,931.8 |
(4.2%) |
(18.1%) |
(6.1%) |
|
Uganda |
0.5 |
0.6 |
0.5 |
0.5 |
0.1% |
(13.5%) |
(11.4%) |
|
Zambia |
512.5 |
532.1 |
546.3 |
455.2 |
(11.2%) |
(14.4%) |
(16.7%) |
|
Tanzania |
0.9 |
1.1 |
1.0 |
0.9 |
(2.3%) |
(14.2%) |
(8.4%) |
|
Nigeria |
98.7 |
106.2 |
105.9 |
89.9 |
(9.0%) |
(15.4%) |
(15.1%) |
|
BRVM |
0.4 |
0.4 |
0.4 |
0.3 |
(16.3%) |
(23.0%) |
(13.0%) |
We are of the view that increased government spending on infrastructure development, improving commodity prices in the global markets, better weather conditions and relative political stability will be the key drivers for SSA growth in 2018
According to Kenya National Bureau of Statistics (KNBS), Kenya’s economy expanded by 6.3% in Q2’2018, higher than 4.7% in Q2’2017. This was due to (i) recovery of agricultural sector, which recorded a growth of 5.6% due to improved weather conditions, (ii) improved business and consumer confidence, and (iii) increased output in the real estate, manufacturing, and wholesale & retail trade sectors, which grew by 6.6%, 3.1% and 7.7% respectively. For a more comprehensive analysis see the Q2’2018 Quarterly GDP Review and Outlook note
During Q3’2018, we tracked Kenya’s GDP growth projections for FY’2018 released by 15 organizations, that comprised of research houses, global agencies, and government organizations. The average GDP growth, including our projection of 5.5% as at Q3’2018, came in at 5.5%, unchanged from average projections released in Q2’2018. The common view is that GDP growth will improve in 2018, from 4.9% in 2017, generally due to (i) recovery in the agriculture sector on the back of improved weather conditions, and (ii) improvement in the business environment following easing of political risk caused by the prolonged political impasse over the 2017 presidential elections.
|
Kenya 2018 Annual GDP Growth Outlook |
||||
|
No. |
Organization |
Q1'2018 |
Q2'2018 |
Q3’2018 |
|
1. |
Central Bank of Kenya |
6.2% |
6.2% |
6.2% |
|
2. |
Kenya National Treasury |
5.8% |
5.8% |
6.0% |
|
3. |
Oxford Economics |
5.7% |
5.7% |
5.7% |
|
4. |
African Development Bank (AfDB) |
5.6% |
5.6% |
5.6% |
|
5. |
Stanbic Bank |
5.6% |
5.6% |
5.6% |
|
6. |
Citibank |
5.6% |
5.6% |
5.6% |
|
7. |
International Monetary Fund (IMF) |
5.5% |
5.5% |
5.5% |
|
8. |
World Bank |
5.5% |
5.5% |
5.5% |
|
9. |
Fitch Ratings |
5.5% |
5.5% |
5.5% |
|
10. |
Barclays Africa Group Limited |
5.5% |
5.5% |
5.5% |
|
11. |
Cytonn Investments Management Plc |
5.4% |
5.5% |
5.5% |
|
12. |
Focus Economics |
5.3% |
5.3% |
5.3% |
|
13. |
BMI Research |
5.3% |
5.2% |
5.2% |
|
14. |
The Institute of Chartered Accountants in England and Wales |
5.6% |
5.6% |
5.6% |
|
15. |
Standard Chartered |
4.6% |
4.6% |
4.6% |
|
Average |
5.5% |
5.5% |
5.5% |
|
The Kenya Shilling:
The Kenya Shilling gained marginally against the US Dollar by 0.1% in Q3’2018 to close at Kshs 101.0 from Kshs 101.1 at the end of Q2’2018. This week, the Kenya Shilling depreciated by 0.2% against the dollar to close at Kshs 101.0 from Kshs 100.8 the previous week. In our view, the shilling should remain relatively stable to the dollar in the short term, supported by:
- The narrowing of the current account deficit to 5.8% in the 12-months to June 2018, from 6.3% in March 2018, attributed to improved agriculture exports, and lower capital goods imports following the completion of Phase I of the Standard Gauge Railway (SGR) project,
- Stronger inflows from principal exports, which include coffee, tea, and horticulture, which increased by 1.7% during the month of July to Kshs 24.7 bn from Kshs 24.3 bn in June, with the exports from horticulture improving by 9.1%,
- Improving diaspora remittances, which increased by 71.9% y/y to USD 266.2 mn in June 2018 from USD 154.9 mn in June 2017 and by 4.9% m/m, from USD 253.7 mn in May 2018, with the largest contributor being North America at USD 130.1 mn attributed to; (a) recovery of the global economy, (b) increased uptake of financial products by the diaspora due to financial services firms, particularly banks, targeting the diaspora, and (c) new partnerships between international money remittance providers and local commercial banks making the process more convenient, and
- High forex reserves, currently at USD 8.5 bn, equivalent to 5.6 months of import cover, compared to one-year average of 5.4 months.
Inflation:
The inflation rate declined significantly to an average of 4.4% YTD as compared to 9.0% in a similar period in 2017. However, inflation has been on an upward trend in Q3’2018 increasing to 5.7% in September from 4.0% in August 2018, which was in line with our expectations, with the m/m inflation increasing by 1.0% which was on account of; (i) a 0.4% increase in the Food and Non-Alcoholic Drinks Index driven by an increase in prices of some food basket items such as potatoes, sugar and cabbages outweighing decreases in others, (ii) an 8.0% increase in the Transport Index driven by a rise in the pump prices of petrol and diesel which triggered increase in prices of other transport components, and (iii) a 0.5% increase in the Housing, Water, Electricity, Gas and Other Fuels’ Index on account of the review of tariff structure for electricity.
|
Major Inflation Changes in the Month of September 2018 |
|||
|
Broad Commodity Group |
Price change m/m (Sep-18/Aug-18) |
Price change y/y (Sep-18/Sep-17) |
Reason |
|
Food & Non-Alcoholic Beverages |
0.4% |
0.5% |
This was due to increase |
|
Transport Cost |
8.0% |
17.3% |
This was on account of increase in the pump prices of petrol and diesel which triggered increase in prices of other transport components |
|
Housing, Water, Electricity, Gas and other Fuels |
0.5% |
17.4% |
This was on account of a review of the electricity tariff structure |
|
Overall Inflation |
1.0% |
5.7% |
The m/m increase was due to an 8.0% increase in the Transport Index and a 0.5% increase in the Housing, Water, Electricity, Gas and Other Fuels’ Index which have a CPI weight of 8.7 and 18.3 respectively |
Monetary Policy:
The Monetary Policy Committee (MPC) met twice in Q3’2018. In the July 30th meeting, the committee decided to lower the Central Bank Rate (CBR) to 9.0% from 9.5%, noting that inflation expectations were well anchored within the target range of 2.5% - 7.5%, and that economic growth prospects were improving. This was evidenced by; (i) a stable foreign exchange market, with the current account deficit narrowing to 5.8% in the 12 months to June 2018 from 6.3% in March, and (ii) a stable and resilient banking sector, with average liquidity and capital adequacy ratios at 48.0% and 18.0% respectively in June 2018. The committee also noted that economic output was below its potential level, and there was room for further accommodative monetary policy. In the September 25th meeting, the MPC retained the CBR at 9.0%, citing that inflation expectations remained well anchored within the target range largely due to lower food prices and that there was sustained optimism for stronger economic growth in 2018 as per the private sector market perception survey. This was mainly attributed to a rebound in agriculture, pick up in private sector economic activity, renewed business confidence due to the ongoing war against corruption and a stable macroeconomic environment. The MPC noted that there was, however, need to monitor the second-round inflationary effects arising from the VAT on petroleum products, and any perverse response to its previous decisions.
Q3’2018 Highlights:
- The National Assembly convened for special parliamentary sittings held on 18th September and 20th September to discuss the President’s reservations against the Finance Bill through his memorandum. The President rejected the Finance Bill 2018 received from the Speaker of the National Assembly, which had amendments as voted by the National Assembly such as (i) postponing the imposition of VAT on fuel by another 2-years to September 2020, citing that its implementation would lead to a rise in inflation, and (ii) retaining of the interest rate cap citing that there was no justification for the repeal. All the proposals as per the President’s memorandum tabled in parliament were passed despite a chaotic sitting, after which the president assented to the Finance Bill 2018 on 21st September 2018. The proposals included (i) deletion of the clause which sought to postpone the imposition of VAT on fuel by another 2 years to commence in September 2020 (ii) an increase on the excise duty charged on excisable value on telephone and internet data service to 15.0% from the earlier 10.0%, and (iii) a reduction in the taxation on winnings under the betting, lotteries and gaming Act to 15.0% from the earlier proposed 20.0%. Due to assent of the Finance Bill 2018, we are of the view that imposition of some of the tax measures as introduced in the Finance Bill raise concerns in the country’s economic growth, especially on corporate earnings this year with the main focus being on the Telecommunication and Financial services industry due to the increased excise tax on both money transfers and internet charges which could slow down consumption of these services. For more information, see our Cytonn Weekly #36/2018,
- During the special parliamentary sittings, the National Assembly also discussed the supplementary estimates for FY’2018/2019 presented by the Budget and Appropriations Committee, which proposed a reduction in the total budget estimate by Kshs 55.1 bn due to the expected shortfall in revenue arising from the amendments made in the Finance Bill 2018. The National Assembly however passed an expenditure reduction of Kshs 37.6 bn, which is to be achieved through a reduction in recurrent expenditure and capital expenditure for FY’2018/2019 by Kshs 9.1 bn and Kshs 28.5 bn, respectively coupled with a reinstatement of Kshs 1.5 bn to the judiciary,
- The International Monetary Fund (IMF) paid a visit to Kenya where discussions were held with the Kenyan Government on the second review under a precautionary Stand-By Arrangement (SBA), which was extended to Kenya on 14th March 2016. For more information, see our Cytonn Weekly #30/2018. The second review however was not completed, leading to the expiry of the precautionary stand-by facility granted to Kenya on 14th September 2018 as the National Treasury was not keen on seeking to renew the facility noting that the macro-economic fundamentals of the country have continued to stabilize despite the country not drawing on the facility. We believe that access to the facility would have been useful in cushioning the Kenyan Shilling from exogenous shocks as well as maintaining the country’s fiscal discipline due to the pre-set conditions that come attached to the facility, which effectively reduces the risk perception of countries while improving investor sentiments. However, the country faces no immediate adverse risks as the country’s external position is still strong, a view which the IMF has also affirmed through their local representative, as we have adequate forex reserves currently at USD 8.5 bn, equivalent to 5.6 months of import cover, compared to a one-year average of 5.4 months, and
- According to the Stanbic Bank’s Monthly Purchasing Manager’s Index (PMI), the business environment in the country expanded at a marked pace in August 2018. The seasonally adjusted PMI recovered to 54.6 in August from a 6-month low of 53.6 in July. A PMI reading of above 50 indicates improvements in the business environment, while a reading below 50 indicates a worsening outlook. Firms reported growth in value of outputs due to the continued rise in new orders, which rose for the 9thconsecutive month. This was despite high input costs attributed to raw material shortages. In response to increased output requirements, firms also raised their staffing levels during the month though at a modest rate. The private sector has remained resilient as the PMI is still above 50; we however expect the private sector to experience increased input costs going forward should the 16.0% VAT on petroleum products be maintained.
Kenya’s current account deficit improved during Q2’2018, coming in at Kshs 85.8 bn from Kshs 130.4 bn in Q2’2017, a decline of 34.2%, equivalent to 7.1% of GDP from 11.4% recorded in Q2’2017. This was mainly due to the 57.1% increase in the Secondary Income (Transfers) Balance, largely attributed to 56.9% increase in the diaspora inflows to Kshs 74.7 bn from Kshs 47.6 bn in Q2’2017. For a more comprehensive analysis see the Q2’2018 Quarterly Balance of Payments Note
Macroeconomic Indicators Table:
The table below summarizes the various macroeconomic indicators, the expectation at the beginning of 2018, the actual Q3’2018 experience, the impact of the same, and our expectations going forward:
|
Key Macro-Economic Indicators – Kenya |
||||||
|
Indicators |
Expectations at start of 2018/2019 Fiscal Year |
YTD 2018 Experience |
Going forward |
Outlook at the Beginning of the Year |
Current Outlook |
|
|
|
GDP growth projected to come in at between 5.4% - 5.6% |
Kenya’s economy expanded by 6.3% in Q2’2018, higher than 4.7% in Q2’2017. This was due to; i. recovery in agriculture, which recorded a growth of 5.6% due to improved weather conditions, ii. improved business and consumer confidence, increased output in the manufacturing and electricity & water supply sectors which grew by 3.1% and 8.6% respectively |
GDP growth is projected to come in between 5.4% - 5.6% in 2018 driven by recovery of growth in the agriculture sector, continued growth in the tourism, real estate and construction sectors, and growth in the manufacturing sector |
Positive |
Positive |
|
|
Interest Rates |
A stable outlook on interest rates in 2018 with the CBR maintained at 9.5% |
The Monetary Policy Committee (MPC) met on September 25th and maintained the Central Bank Rate (CBR) at 9.0% citing that there was need to monitor the second-round inflationary effects arising from the VAT on petroleum products, and any perverse response to its previous decisions. |
The interest rate environment is expected to remain relatively stable, with the CBK not accepting high yields on treasury securities with the CBR rate having been lowered twice and with the interest rate cap still in place |
Neutral |
Neutral |
|
|
Inflation |
To average within the government annual target of between 2.5% - 7.5% in 2017 |
Inflation has averaged 4.4% in the first 9 months of 2018. The year on year inflation rate for the month of September increased to 5.7% from 4.0% in August and the m/m inflation rose by 1.0% due to increases in housing, water, electricity ,gas and other fuels index, coupled with an increase in the transport index. |
Inflation in H2’2018 is expected to experience upward pressure due to the various tax amendments as per the Finance Bill 2018, but at a lower rate than earlier anticipated following the reduction of the VAT charge on fuel to 8.0% from 16.0% effective 21st September 2018, affirming our expectations on inflation for the year averaging within the government’s set target of 2.5%-7.5% |
Positive |
Positive |
|
|
Exchange rate |
To remain stable supported by dollar reserves |
The Shilling has appreciated by 2.2% against the USD YTD to 101.0. The current account deficit narrowed to 5.3% of GDP in the 12 months to July 2018 from 5.6% in June 2018. It is expected to narrow further to 5.4% of GDP in 2018, with strong growth of agricultural exports particularly tea and horticulture, resilient diaspora remittances, and improved tourism receipts. IMF Standby Credit Facility expired in September 2018 |
Kenya’s forex reserves currently stand at USD 8.5 bn (equivalent to 5.6 months of import cover), sufficient to cushion the economy from unforeseen short-term shocks. Kenya’s current account deficit has also improved to 5.8% of GDP in Q1’2018, from 11.3% recorded in Q1’2017. Despite the expiry of the IMF standby credit facility, we expect the currency to remain relatively stable against the dollar, supported by, (i) stronger horticulture export inflows driven by increasing production and improving global prices, (ii) improving diaspora remittances, and (iii) the ample forex reserves |
Neutral |
Neutral |
|
|
Corporate Earnings |
Corporate earnings growth of 8.0% in 2017 due to lower earnings for commercial banks attributed to the cap on interest rates |
Listed Banks have recorded a weighted average increase in core EPS of 19.0% in H1’2018 |
We expect corporate earnings to improve in 2018, |
Positive |
Positive |
|
|
Investor Sentiment |
Investor sentiment was expected to improve in 2018 given the now settling operating environment after conclusion of the 2017 elections |
The Kenya Eurobond was 7.0x oversubscribed partly showing the appetite for Kenyan securities by the foreign community, and investor confidence in Kenya’s stable and relatively diversified economy |
We still expect investor sentiment to improve in 2018 given; (i) the now settled operating environment after the conclusion of the long electioneering period in 2017, (ii) the expectation that long term investors will continue entering the market seeking to take advantage of the valuations which are still historically low, and (iii) expectations of a relatively stable shilling |
Positive |
Positive |
|
|
Security |
Security expected to be maintained in 2018, especially given the elections were concluded and the USA lifted its travel warning for Kenya, placing it in the 2nd highest tier of its new 4-level advisory program, indicating positive sentiments on security from the international community |
The political climate in the country has eased, with security maintained and business picking up. The hand shake between the president and the opposition leader served to calm any political tension. Kenya now has direct flights to and from the USA, a possible sign of improving security in the country |
We expect security to be maintained in 2018, especially given that there is relative calm, as the two principals work together towards combating corruption and promoting economic transformation agenda |
Positive |
Positive |
|
Of the 7 indicators we track, 5 are positive and 2 are neutral. The outlook of the 7 indicators has remained unchanged from H1’2018. From this, we maintain our positive outlook on the 2018 macroeconomic environment.
T-Bills & T-Bonds Primary Auction:
During the third quarter of 2018, T-bills auctions recorded an oversubscription attributed to improved liquidity levels, with the average subscription rate coming in at 133.3% compared to 162.7% in Q2’2018. Overall average subscription rates for the 91-day, 182-day, and 364-day papers in Q3’2018 came in at 99.4%, 91.8% and 188.4%, respectively, from 108.5%, 127.8%, 219.4% in Q2’2018. Yields on T-bills declined by 28 bps, 110 bps and 100 bps in Q3’2017, closing at 7.7%, 9.1%, and 10.0%, from 7.9%, 10.2%, and 11.0% for the 91, 182, and 364-day papers, respectively, as at end of Q2 2018, mainly due to the Central Bank of Kenya’s (CBK’s) efforts to keep rates low by rejecting expensive bids in the auction market.
During the week, T-bills were undersubscribed at a subscription rate of 85.9%, down from 123.9% recorded the previous week. The yields on the 91-day and 364-day papers remained unchanged at 7.6% and 9.7%, respectively while the yield on the 182-day paper declined to 8.6% from 8.7%, the previous week. The acceptance rate declined to 94.8% from 95.8% recorded the previous week, with the government accepting Kshs 19.5 bn of the Kshs 20.6 bn worth of bids received.
The yield on the 91-day T-bill is currently trading at a yield of 7.6%, below its 5-year average of 9.0%. The lower yield on the 91-day paper is mainly attributed to the low interest rate environment we have been experiencing, and we expect this to continue in the short-term because (i) the rate cap is still in place which will make it easier for the government to borrow from the domestic market, as institutions will continue channelling funds more actively towards government securities, which are deemed less risky, since the pricing of loans to the private sector is based on the Central Bank Rate as opposed to their risk profiles, and (ii) the government domestic borrowing requirement for the 2018/19 financial year has been reduced by 8.6%, with revenues expected to increase by 14.5% from the previous fiscal year.
|
No. |
Date |
Bond Auctioned |
Effective Tenor to Maturity (Years) |
Coupon |
Amount to be Raised (Kshs bn) |
Actual Amount Raised (Kshs bn) |
Average Accepted Yield |
Subscription Rate |
Acceptance Rate |
|
1 |
30/07/2018 |
FXD2/2018/20 |
20.0 |
13.2% |
40.0 |
10.5 |
13.4% |
34.7% |
75.8% |
|
2 |
27/08/2018 |
FXD1/2018/10 |
10.0 |
12.7% |
40.0 |
19.4 |
12.7% |
74.6% |
64.9% |
|
3 |
24/09/2018 |
FXD1/2018/10 (Reopen) |
10.0 |
12.7% |
40.0 |
21.2 |
12.7% |
81.2% |
81.8% |
|
FXD2/2018/20 (Re-open) |
20.0 |
12.9% |
5.3 |
12.9% |
Performance in the Primary T-bond auctions in Q3’2018 was varied between the various issues, with the subscription rate averaging 63.5%. The average acceptance rate in Q3’2018 came in at 74.2%, as the CBK continued to reject bids deemed expensive in order to maintain the rates at low levels.
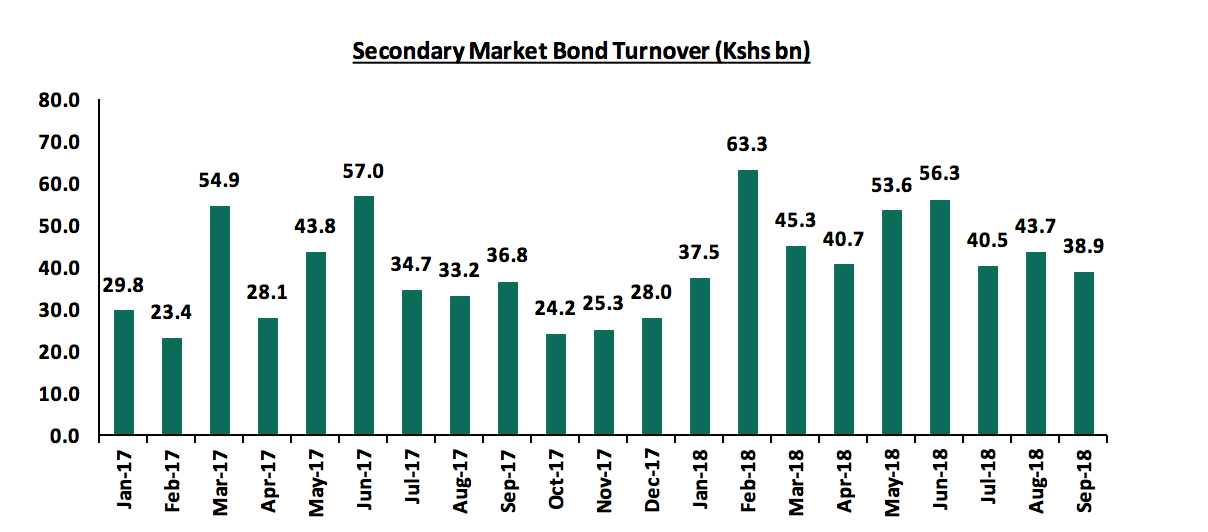
Secondary Bond Market Activity:
The NSE FTSE Bond Index gained by 3.2% during Q3’2018 while the secondary bonds market recorded reduced activity, with turnover decreasing by 22.2% to Kshs 123.2 bn from Kshs 150.6 bn recorded in Q2’2018.
Kenya Eurobonds:
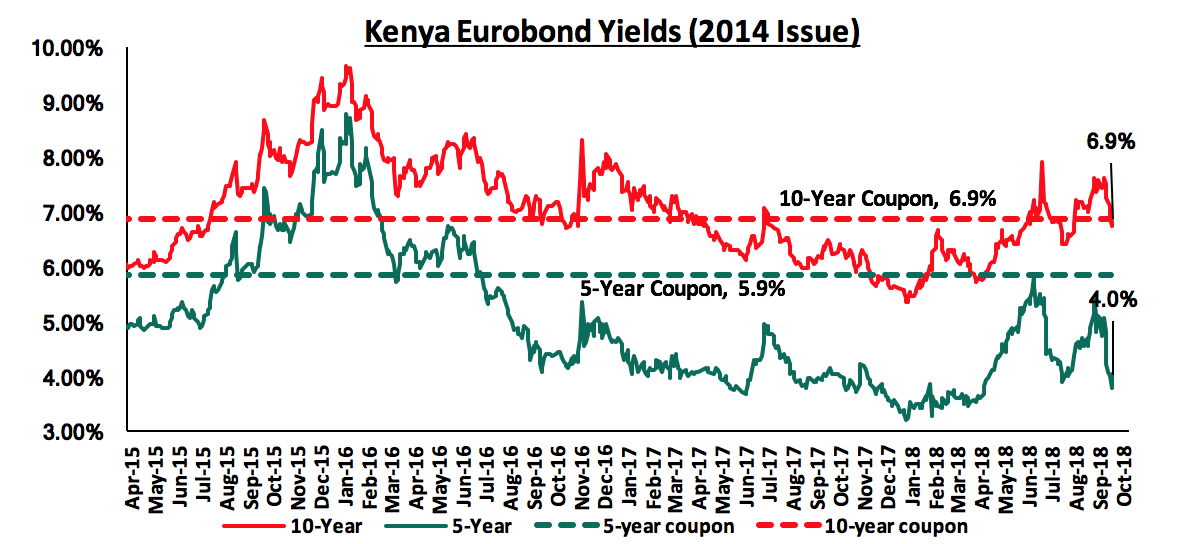
According to Bloomberg, the yield on the 5-year Eurobond issued in 2014 closed at 4.0%, a 1.3% points decline from 5.3% as at end of Q2’2018. Yield on the 10-year Eurobond closed at 6.9%, a 1.0%-point decline from 7.9% as at end of Q2’2018. By year-on-year comparison, yield on the 10-year has increased by 0.5% points from 6.4% as at end Q3’2017 while the 5- year has slightly declined by 0.1% points from 4.1% as at end of Q3’2017. Since the mid-January 2016 peak, yields on the Kenya Eurobonds have declined by 4.7% points and 2.6% points for the 5-year and 10-year Eurobonds, respectively, an indication of the relatively stable macroeconomic conditions in the country. Key to note is that these bonds have 0.8-years and 5.8-years to maturity for the 5-year and 10-year, respectively.
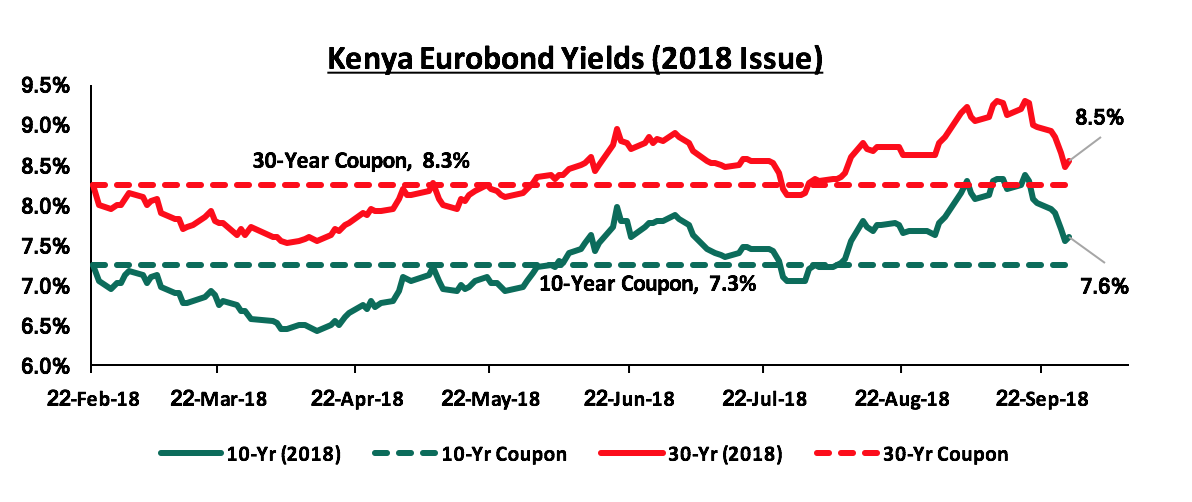
For the February 2018 Eurobond issue, the yields on the 10-year Eurobond and the 30-year Eurobond decreased by 0.2% points and 0.3% points to 7.6% and 8.5%, respectively in Q3’2018 from 7.8% and 8.8% as at end Q2’2018. Since the issue date, yields on the 10-year and 30-year Eurobonds have increased by 0.4% and 0.3% points respectively.
Rates in the fixed income market have been on a declining trend, as the government continues to reject expensive bids as it is currently 82.8% ahead of its pro-rated borrowing target for the current financial year, having borrowed Kshs 133.8 bn against a pro-rated target of Kshs 73.2 bn. The 2018/19 budget had given a domestic borrowing target of Kshs 271.9 bn, 8.6% lower than the 2017/2018 fiscal year’s target of Kshs 297.6 bn, which may result in reduced pressure on domestic borrowing. With the rate cap still in place, with the president having ascended to the Finance Bill 2018, we maintain our expectation of stability in the interest rate environment. With the expectation of a relatively stable interest rate environment, our view is that investors should be biased towards medium-term fixed-income instruments.
Market Performance:
During Q3’2018, the equities market was on a significant downward trend, with NASI, NSE 25 and NSE 20 declining by 14.2%, 15.6%, and 12.5%, respectively; taking their YTD performance as at the end of September to (12.6%), (22.5%), and (13.6%) for NASI, NSE 20 and NSE 25, respectively. The equities market performance during the quarter was shaped by declines in large caps such as NIC Group, Bamburi, Safaricom, and EABL by 31.0%, 18.5%, 16.2%, and 13.6%, respectively.
During the week, the equities market was on an upward trend with NASI, NSE 20 and NSE 25 gaining by 2.9%, 1.5% and 2.7%, respectively, due to gains in large cap stocks such as Co-operative Bank, EABL and KCB which gained by 9.4%, 5.6% and 5.3%, respectively. For the last twelve months (LTM), NASI, NSE 20 and NSE 25 have declined by 8.4%, 22.6% and 10.5%, respectively.
Equities turnover declined by 32.0% during the quarter to USD 319.5 mn from USD 469.8 mn in June, taking the YTD turnover to USD 1.4 bn. For this week, equities turnover rose by 50.5% to USD 41.0 mn from USD 27.2 mn in the previous week. Foreign investors remained net sellers this week, with a net selling position of USD 12.0 mn, which is a 48.1% increase from last week’s net selling position of USD 8.1 mn. We expect the market to remain subdued in the near-term as international investors exit the broader emerging markets due to the rising interest rates in the US, coupled with strengthening US dollar.
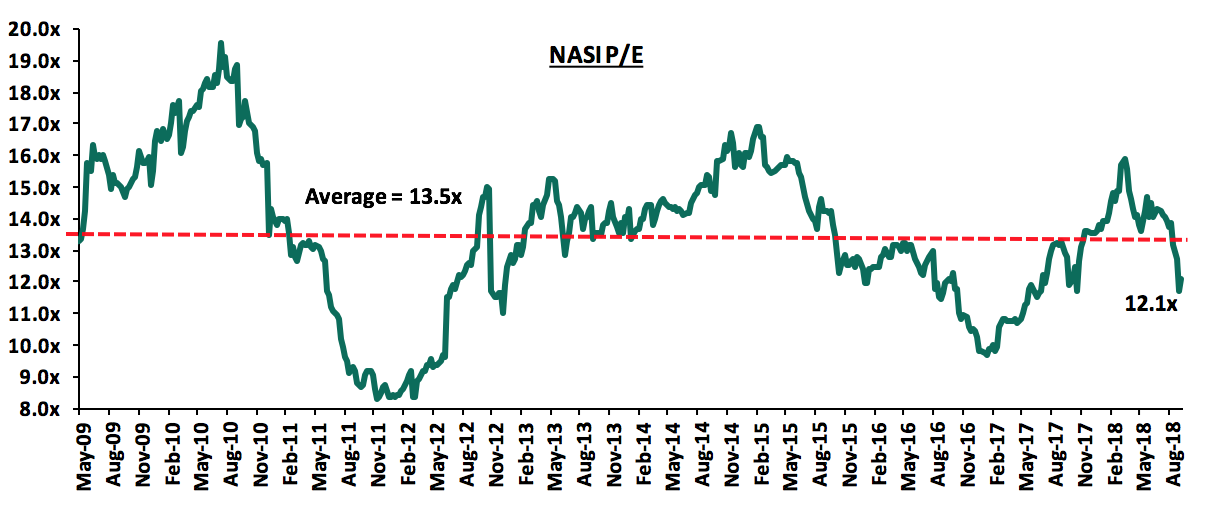
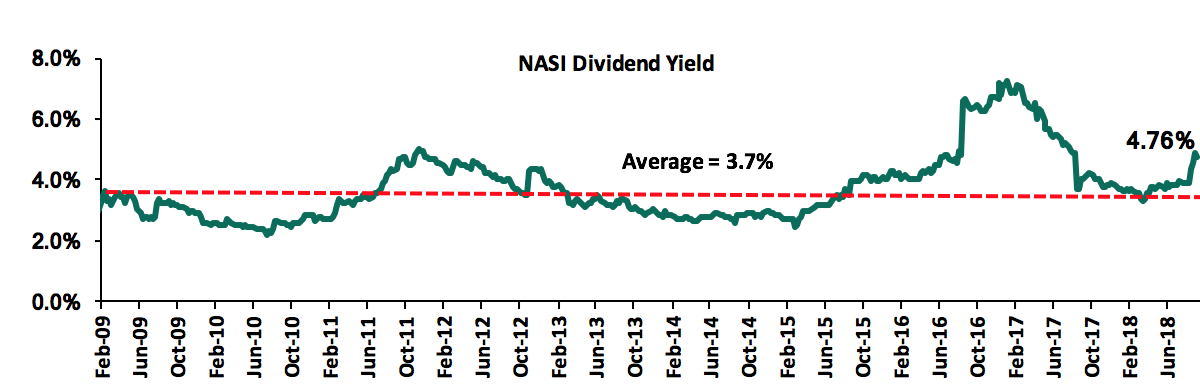
The market is currently trading at a price to earnings ratio (P/E) of 12.1x, 10.1% below the historical average of 13.5x, and a dividend yield of 4.8%, slightly above the historical average of 3.7%. Despite the current valuations being around the historical average, we believe there still exist pockets of value in the market. The current P/E valuation of 12.1x is 24.7% above the most recent trough valuation of 9.7x experienced in the first week of February 2017, and 45.6% above the previous trough valuation of 8.3x experienced in December 2011. The charts below indicate the historical P/E and dividend yields of the market.
Quarterly Highlights:
During the quarter;
- President Uhuru Kenyatta signed the Finance Bill, 2018 into law on Friday 21st September, 2018, after Members of Parliament passed the proposed amendments to the Bill as highlighted in our Cytonn Weekly #36/2018. Key to note is that the assented Finance Bill 2018 does away with the floor on deposit pricing, which was initially set at 70.0% of the Central Bank Rate (CBR) but retains the cap on loan pricing at 4.0% above the CBR. This gives lenders flexibility on deposit pricing, which may see banks reduce their cost of funds. We are of the view that the new legislation will mean increased net interest margins (NIM) for banks due to reduced interest expense on deposits going forward,
- The Central Bank of Kenya (CBK) proposed to introduce a Banking Sector Charter that will guide service provision in the sector as highlighted in our Cytonn Weekly #30/2018. The Charter aims to instill discipline in the banking sector in order to make it responsive to the needs of the banked population. The charter is expected to facilitate a market-driven transformation of the Kenyan-banking sector and bring about tangible benefits for Kenyans, specifically to increase access to affordable financial services for the unbanked and under-served population. We are of the view that, if adopted, the Banking Sector Charter will go a long way towards removing the existing opacity in loan prices and promote the adoption of the risk-based loan-pricing framework. However, we are even of the stronger view, as captured in our Focus Notes titled “Rate Cap Review Should Focus More on Stimulating Capital Markets” and Status of Rate Cap Review in Finance Bill, that the best way to bring discipline in the banking sector is to reduce banking sector dominance by promoting alternative sources of credit to the economy such as privately placed investments solutions,
- The Central Bank of Kenya (CBK) downgraded the banking sector rating to “satisfactory”, from a previous rating of “strong” in 2016 as highlighted in our Cytonn Weekly #32/2018. According to the Bank Supervision Annual Report 2017 released by the regulator, the downgrade was as a result of a decline in capital adequacy, as well as a deterioration in asset quality in the sector. Despite the decline in capital adequacy ratios, the banking sector remained well capitalized with sufficient buffers above the minimum required ratios. The deterioration in asset quality came as a result of a challenging business environment in 2017, occasioned by poor weather conditions, delayed payments from both private and public institutions and the upheavals due to the protracted electioneering period last year. The declining capital adequacy may be a signal of looming consolidation in the sector as weaker banks are absorbed by their larger, more stable counterparts in order to recapitalize as per the statutory requirements,
- KCB Group emerged as the only bidder for a stake in Imperial Bank Limited (IBL), which is under receivership, after Diamond Trust Bank (DTB), having also expressed interest, pulled out of the deal. IBL was put under receivership in August 2015, with a loan book of Kshs 41.0 bn and deposits of Kshs 58.0 bn. The Central Bank of Kenya (CBK) and KDIC is to engage KCB in discussions with the aim of maximizing the value for depositors. If successful, this would mark the second instance a bank is brought out of receivership, after the recently concluded deal that saw SBM Kenya complete the acquisition of certain assets and Liabilities of Chase Bank Limited (under Receivership). For more information, see our Cytonn Weekly #29/2018, and
- Barclays Africa Group Limited changed its name to Absa Group following the London-based Barclays Plc’s exit from the African market to concentrate on European and United States markets. Barclays Plc had acquired a majority stake of 56.4% in Absa Group in 2005, gradually increased its stake to 62.0% but reduced to 14.9% after selling to the large institutional investor Public Investment Corporation of South Africa (PIC). Its Kenyan subsidiary, however, is looking to complete the rebranding process by 2020 and will continue operating as Barclays Bank Kenya until then. We are of the view that with the exit of the London-based parent company, Barclays will be able to compete more favorably with its peers, as it plans to increase its market share in the region by 5 million customers by 2020. Thus, with more localized decision-making, the lender is well positioned to quickly exploit any opportunities that arise as well as build on their innovative profile that has seen the bank offer efficient services to its customers. For more information, see our Cytonn Weekly #27/2018.
Kenyan Listed Banks Results
During the quarter, listed banks in Kenya released their H1’2018 results, recording average core earnings growth of 19.0%. The table below highlights the performance of the banking sector, showing the performance using several metrics, and the key take-outs of the performance:
|
Listed Banking Sector Operating Metrics |
|||||||||||||||
|
Bank |
Core EPS Growth |
Interest Income Growth |
Interest Expense Growth |
Net Interest Income Growth |
Net Interest Margin |
Cost to Income Ratio |
Non-Funded Income (NFI) Growth |
NFI to Total Operating Income |
Growth in Total Fees & Commissions |
Deposit Growth |
Growth In Govt Securities |
Loan Growth |
LDR |
Cost of Funds |
Return on Average Equity |
|
Stanbic |
104.5% |
15.4% |
21.7% |
11.9% |
4.9% |
50.1% |
34.0% |
50.0% |
(4.2%) |
21.3% |
26.9% |
15.4% |
71.4% |
3.1% |
14.8% |
|
NBK |
39.3% |
(9.6%) |
(10.1%) |
(8.9%) |
6.9% |
95.6% |
(13.1%) |
28.8% |
(15.7%) |
(2.8%) |
9.8% |
(16.1%) |
49.8% |
3.0% |
(0.6%) |
|
StanChart |
30.3% |
7.9% |
8.8% |
7.5% |
8.0% |
61.0% |
12.2% |
32.9% |
36.2% |
2.8% |
3.5% |
(1.1%) |
48.4% |
3.6% |
18.0% |
|
KCB Group |
18.0% |
6.1% |
11.9% |
4.3% |
8.6% |
52.0% |
(0.1%) |
32.2% |
(6.0%) |
8.7% |
8.7% |
3.6% |
80.3% |
3.0% |
21.9% |
|
Equity Group |
17.6% |
10.2% |
14.0% |
9.1% |
8.8% |
52.8% |
1.5% |
40.2% |
(1.0%) |
8.5% |
18.7% |
3.8% |
69.9% |
2.7% |
23.9% |
|
I&M |
11.7% |
5.1% |
13.2% |
0.1% |
7.1% |
53.7% |
34.4% |
35.1% |
39.5% |
30.6% |
(28.3%) |
12.6% |
77.2% |
4.6% |
17.2% |
|
Co-op Bank |
7.6% |
7.9% |
2.2% |
10.4% |
8.6% |
54.9% |
(1.6%) |
32.1% |
(2.6%) |
3.9% |
12.0% |
(0.6%) |
84.6% |
3.9% |
18.0% |
|
Barclays |
6.2% |
7.6% |
22.4% |
4.0% |
9.0% |
66.3% |
6.9% |
30.0% |
1.9% |
14.9% |
33.6% |
7.5% |
81.2% |
2.60% |
17.5% |
|
DTB |
2.5% |
3.9% |
3.0% |
4.6% |
6.5% |
57.4% |
8.0% |
21.6% |
7.2% |
9.9% |
22.5% |
3.5% |
70.4% |
5.0% |
15.5% |
|
NIC Group |
(2.1%) |
8.6% |
30.0% |
(4.9%) |
6.0% |
60.9% |
7.0% |
29.5% |
(3.0%) |
10.5% |
25.7% |
(1.5%) |
78.2% |
5.4% |
12.8% |
|
Housing Finance |
(95.7%) |
(13.2%) |
(12.7%) |
(13.9%) |
4.9% |
99.3% |
38.2% |
30.4% |
7.2% |
(3.1%) |
17.3% |
(9.8%) |
131.4% |
7.0% |
(0.2%) |
|
Weighted Average H1'2018* |
19.0% |
7.9% |
12.0% |
6.4% |
8.1% |
55.7% |
6.9% |
34.3% |
4.6% |
10.0% |
13.7% |
3.8% |
73.8% |
3.4% |
19.5% |
|
Weighted Average H1'2017** |
(14.4%) |
(7.2%) |
(6.0%) |
(6.9%) |
8.0% |
59.2% |
5.1% |
34.0% |
12.5% |
9.4% |
21.5% |
7.3% |
77.9% |
3.4% |
17.9% |
|
* 31st August 2018 ** 31st August 2017 |
|||||||||||||||
Key takeaways from the table above include:
- The listed banks recorded a 19.0% average increase in core Earnings Per Share (EPS), compared to a decline of 14.4% in H1’2017. Only NIC Group and Housing Finance Group recorded declines in core EPS, registering declines of 2.1% and 95.7%, respectively. CFC Stanbic recorded the highest growth at 104.5% y/y, supported by 21.9% increase in total operating income, coupled with a 14.0% decrease in total operating expenses. HF Group recorded the biggest decline at 95.7%, on the back of a 13.9% decline in Net Interest Income (NII), and a high cost to income ratio of 99.3%;
- The sector recorded a relatively strong deposit growth, which came in at 10.0%. The strong deposit growth led to a 12.0% growth in the interest expenses. However, the cost of funds remained flat at 3.4%, an indication that the greater proportion of deposit accounts were non-interest bearing;
- Average loan growth was anomic coming in at 3.8%, which was lower than 7.3% recorded in H1’2017, indicating that there was an even slower credit extension in the economy, due to sustained effects of the interest rate cap. Government securities on the other hand recorded a growth of 13.7% y/y, which was faster compared to the loans, albeit slower than 21.5% recorded in H1’2017. This indicates that banks’ continued preference towards investing in government securities, which offer better risk-adjusted returns. Interest income increased by 7.2%, as banks adapted to the interest rate cap regime, with increased allocations in government securities. This, however, should be a point of concern as it points to a reduction in the banking sector’s primary function of intermediation between depositors and credit consumers, with the loan to deposit ratio declining to 73.8% from 77.9% in H1’2017. Reduced credit extension especially to the private sector comprised mainly of the MSMEs, curtails both the short and long-run economic growth;
- The average Net Interest Margin in the banking sector currently stands at 8.1%, a slight improvement from the 8.0% recorded in H1’2017. The improvement was mainly due to the increase in Net Interest Income by 6.4% y/y, aided by the 7.9% improvement in the interest income y/y; and
- Non-funded Income grew by 6.9% y/y, faster than 5.1% recorded in H1’2017. The growth included a total fee and commission’s growth of 4.6% although it was slower than 12.5% recorded in H1’2017. The growth in fee and commission income was however subdued by the slow loan growth, thus impacting the fee and commission income from loans. Banks have however been focusing on expanding the other fee and commission income, with increased focus on transactional income from alternative transaction channels. Banks have been shifting focus to this revenue space, by offering holistic banking services such as advisory. With increased focus on other NFI sources such as transaction income from mobile and online channels, bancassurance, money remittance, and payment services etc., banks will likely see expansion in NFI going forward as net interest income remains somewhat subdued under the current interest rate cap regime.
For more information on the Kenyan listed Banks H1’2018 results, see our Kenya H1’2018 Banking Sector Report.
Equities Universe of Coverage:
Below is our Equities Universe of Coverage:
|
Banks |
Price as at 29/06/2018 |
Price as at 21/09/2018 |
Price as at 28/09/2018 |
w/w change |
q/q change |
YTD Change |
LTM Change |
Target Price |
Dividend Yield |
Upside/ Downside |
||
|
NIC Bank |
35.5 |
26.5 |
25.3 |
(4.7%) |
(28.9%) |
(25.2%) |
(28.3%) |
48.8 |
4.0% |
97.2% |
||
|
Zenith Bank |
25 |
20.8 |
21.5 |
3.4% |
(14.0%) |
(16.1%) |
-7.70% |
33.3 |
12.6% |
67.5% |
||
|
Diamond Trust Bank |
199 |
172 |
174 |
1.2% |
(12.6%) |
(9.4%) |
(4.9%) |
283.7 |
1.5% |
64.5% |
||
|
Union Bank Plc |
6.1 |
5.8 |
5.1 |
(12.1%) |
(16.4%) |
(34.6%) |
(11.5%) |
8.2 |
0.0% |
59.8% |
||
|
KCB Group |
46.3 |
38 |
40.5 |
6.6% |
(12.4%) |
(5.30%) |
(1.8%) |
61.3 |
7.4% |
58.8% |
||
|
Ghana Commercial Bank |
5.2 |
5.3 |
5.4 |
0.8% |
3.9% |
5.9% |
29.5% |
7.7 |
7.1% |
51.4% |
||
|
Equity Group |
46.3 |
38.8 |
40 |
3.2% |
(13.5%) |
(0.6%) |
2.6% |
56.2 |
5.0% |
45.5% |
||
|
I&M Holdings |
115 |
90 |
99 |
10.0% |
(13.9%) |
(1.0%) |
(23.3%) |
138.6 |
3.5% |
43.5% |
||
|
UBA Bank |
10.5 |
8 |
8.4 |
5.0% |
(20.0%) |
(18.4%) |
(0.7%) |
10.7 |
10.1% |
37.5% |
||
|
Co-operative Bank |
17.5 |
13.9 |
15.2 |
9.7% |
(13.1%) |
(5.0%) |
(10.1%) |
19.9 |
5.3% |
36.2% |
||
|
Ecobank |
8.5 |
8.1 |
8 |
(1.6%) |
(5.3%) |
5.3% |
25.7% |
10.7 |
0.0% |
34.1% |
||
|
CRDB |
160 |
160 |
160 |
0.0% |
0.0% |
0.0% |
(8.6%) |
207.7 |
0.0% |
29.8% |
||
|
Barclays |
11.5 |
10.2 |
10.6 |
4.4% |
(7.4%) |
10.4% |
5.0% |
12.5 |
9.4% |
27.4% |
||
|
Access Bank |
10.4 |
8.2 |
8.2 |
0.00% |
(21.3%) |
(22.0%) |
(14.3%) |
9.5 |
4.9% |
21.5% |
||
|
HF Group |
8.5 |
6.7 |
5.8 |
(13.4%) |
(31.8%) |
(44.2%) |
(39.5%) |
6.6 |
6.0% |
19.8% |
||
|
CAL Bank |
1.3 |
1.2 |
1.2 |
(0.8%) |
(8.6%) |
8.3% |
33.7% |
1.4 |
0.0% |
19.7% |
||
|
Stanbic Bank Uganda |
32 |
33 |
33 |
0.0% |
3.1% |
21.1% |
20.0% |
36.3 |
3.5% |
13.5% |
||
|
Standard Chartered |
198 |
195 |
192 |
(1.5%) |
(3.0%) |
(7.7%) |
(16.2%) |
196.3 |
6.5% |
8.8% |
||
|
Guaranty Trust Bank |
40.5 |
34.7 |
36.4 |
4.8% |
(10.2%) |
(10.8%) |
(9.1%) |
37.1 |
6.6% |
8.7% |
||
|
Bank of Kigali |
286 |
290 |
289 |
(0.3%) |
1.0% |
(3.7%) |
3.20% |
299.9 |
4.8% |
8.6% |
||
|
Bank of Baroda |
150 |
126 |
126 |
0.0% |
(16.0%) |
11.5% |
14.5% |
130.6 |
2.0% |
5.6% |
||
|
SBM Holdings |
7.3 |
6.6 |
6.5 |
(0.9%) |
(10.7%) |
(13.3%) |
(17.7%) |
6.6 |
4.6% |
5.5% |
||
|
Stanbic Holdings |
91.5 |
90 |
90 |
0.0% |
(1.6%) |
11.1% |
13.9% |
92.6 |
2.5% |
5.4% |
||
|
National Bank |
6.3 |
5.5 |
5.8 |
6.4% |
(7.2%) |
(38.0%) |
(38.3%) |
4.9 |
0.0% |
(15.5%) |
||
|
Stanbic IBTC Holdings |
52 |
42 |
46 |
9.5% |
(11.5%) |
10.8% |
15.0% |
37 |
1.3% |
(18.3%) |
||
|
FBN Holdings |
10.6 |
8.6 |
8.9 |
3.5% |
(16.0%) |
1.1% |
62.7% |
6.6 |
2.8% |
(22.7%) |
||
|
Standard Chartered |
23.1 |
26 |
26.1 |
0.3% |
12.8% |
3.4% |
54.5% |
19.5 |
0.0% |
(25.4%) |
||
|
Ecobank Transnational |
20 |
18 |
17.9 |
(0.6%) |
(10.5%) |
5.3% |
1.1% |
9.3 |
0.0% |
(48.2%) |
||
|
*Target Price as per Cytonn Analyst estimates |
|
|||||||||||
|
**Upside / (Downside) is adjusted for Dividend Yield |
|
|||||||||||
|
***Banks in which Cytonn and/or its affiliates holds a stake. For full disclosure, Cytonn and/or its affiliates holds a significant stake in NIC Bank, ranking as the 5th largest shareholder |
||||||||||||
|
**** Stock prices are in respective country currency |
||||||||||||
We are “NEUTRAL” on equities for investors with a short-term investment horizon since the market has rallied and brought the market P/E slightly above its’ historical average. However, pockets of value exist, with a number of undervalued sectors like Financial Services, which provide an attractive entry point for long-term investors, and with expectations of higher corporate earnings this year, we are “POSITIVE” for investors with a long-term investment horizon.
Financial Services Sector:
Deals in the Financial Services sector during the quarter include;
- Kuramo Capital, a New York based investment management firm focused on alternative investments in frontier and emerging markets acquired an additional 17.5% stake in GenAfrica Asset Managers Ltd from the management and staff of GenAfrica Asset Managers for Kshs 554.2 mn, effectively valuing the company at Kshs 3.2 bn. The additional investment brings Kuramo’s total shareholding in GenAfrica to 90.8%, after Kuramo completed the purchase of a 73.4% stake from Centum Investments in August this year, with the remaining 9.2% remaining in the hands of management and staff of GenAfrica. Kuramo earlier in the year also completed a transaction to acquire a minority stake in Kenyan investment bank, Sterling Capital for an undisclosed amount. For more information, see our Cytonn Weekly #36/2018,
- Old Mutual, a UK based international financial services group providing investment and savings, insurance, asset management and retirement solutions, increased its stake in UAP - Old Mutual Holdings from 60.7% to 66.7%, in a deal to purchase a 6.0% stake in UAP-Old Mutual for GBP 24.0 mn (Kshs 3.1 bn). The transaction involved the acquisition of 12.7 mn shares of UAP-Old Mutual Holdings’ Chairman Joe Wanjui (9.8 mn shares) and Director James Muguiyi (2.9 mn shares) at a price of Kshs 245.6 per share. The acquisition was carried out at a P/B multiple of 2.7x. The transaction multiple of 2.7x is a 30.3% premium on the average insurance sector transaction P/B multiple of 2.1x over the last seven-years, and almost double the last insurance transaction - the 1.3x multiple that Swiss Re paid for the Britam stake. For more information, see our Cytonn Weekly #32/2018. The table below highlights the transaction multiples in Kenya’s insurance sector over the last seven years;
|
Insurance Sector Transaction Multiples over the Last Seven Years |
|||||||
|
No. |
Acquirer |
Insurance Acquired |
Book Value (Kshs bn) |
Transaction Stake |
Transaction Value (Kshs bn) |
P/B |
Date |
|
1. |
Africa Development Corporation |
Resolution Health East Africa |
N/A |
25.1% |
0.2 |
N/A |
Dec-10 |
|
2. |
Leapfrog Investments |
Apollo Investments |
0.3 |
26.9% |
1.1 |
15.6x |
Dec-11 |
|
3. |
Saham Finances |
Mercantile Insurance |
0.5 |
66.0% |
Undisclosed |
N/A |
Jan-13 |
|
4. |
Swedfund |
AAR |
0.4 |
20.0% |
0.4 |
5.4x |
May-13 |
|
5. |
BAAM |
Continental Re Kenya |
0.7 |
30.0% |
0.3 |
1.4x |
Apr-14 |
|
6. |
Union Insurance of Mauritius |
Phoenix of East Africa |
1.8 |
66.0% |
2.0 |
1.6x |
May-14 |
|
7. |
UK Prudential |
Shield Assurance |
0.1 |
100.0% |
1.5 |
10.2x |
Sep-14 |
|
8. |
Swiss Re |
Apollo Investments |
0.6 |
26.9% |
Undisclosed |
N/A |
Oct-14 |
|
9. |
Britam |
Real Insurance Company |
0.7 |
99.0% |
1.4 |
2.1x |
Nov-14 |
|
10. |
Leap Frog Investments |
Resolution Insurance |
0.2 |
61.2% |
1.6 |
11.7x |
Nov-14 |
|
11. |
Old Mutual Plc |
UAP Holdings |
9.6 |
60.7% |
20.8 |
3.6x** |
Jan-15 |
|
12. |
Old Mutual Plc |
UAP Holdings |
9.6 |
60.7% |
11.1 |
1.9x* |
Jan-15 |
|
13. |
MMI Holdings |
Cannon Assurance |
1.7 |
75.0% |
2.4 |
1.9x |
Jan-15 |
|
14. |
Pan Africa Insurance Holdings |
Gateway Insurance Company Ltd |
1.0 |
51.0% |
0.6 |
1.1x |
Mar-15 |
|
15. |
Barclays Africa |
First Assurance |
2.0 |
63.3% |
2.9 |
2.2x |
Jun-15 |
|
16. |
IFC |
Britam |
22.5 |
10.4% |
3.6 |
1.5x |
Mar-17 |
|
17. |
AfricInvest III |
Britam |
28.5 |
14.3% |
5.7 |
1.4x |
Sep-17 |
|
18. |
Swiss Re Asset Management |
Britam |
22.6 |
13.8% |
4.8 |
1.3x |
Jun-18 |
|
20 |
Old Mutual plc |
UAP Holdings (Wanjui & Muguiyi) |
19.0 |
6.0% |
3.1 |
2.7x** |
Aug-18 |
|
|
Harmonic Mean |
|
29.9% |
2.1x |
|||
|
|
Median |
|
55.9% |
1.9x |
|||
|
*-Proforma transaction multiple after goodwill impairment write-off **-Excluded in the harmonic mean and median |
|||||||
- Mauritius based African Rainbow Capital, an investment holding company that invests in financial service entities, agreed to acquire 90.0% stake in the Commonwealth Bank of South Africa Limited (CBSA), which trades as TymeDigital, from the Commonwealth Bank of Australia. African Rainbow Capital currently holds a 10.0% stake in TymeDigital, whilst the Commonwealth Bank of Australia holds the remaining 90.0%. For more information, see our Cytonn Weekly #30/2018, and
- Badoer Investments Limited, a Dubai-based investment firm, bought a 15.6% stake in Sumac Microfinance Bank for Kshs 100.0 mn (USD 1.0 mn). The deal values Sumac Microfinance Bank at Kshs 641.0 mn (USD 6.4 mn). The funding will be mainly used as capital as it looks to grow its loan book and for expansion with plans to open offices in Eldoret, Kisumu and Meru, as the Microfinance Institution (MFI) moves to tap into the agribusiness market in Kenya. Sumac raised Kshs 330.0 mn earlier this year through debt comprising of Kshs 153.0 mn financing from Mexican fund manager Triple Jump, Kshs 102.0 mn from the Regional MSME Investment Fund for sub-Saharan Africa, Kshs 45.0 mn from the Development Bank of Kenya and Kshs 30.0 mn from the Micro Enterprise Support Programme Trust. For more information, see our Cytonn Weekly #29/2018.
We expect that investors will continue to show interest in the financial services sector, motivated by attractive valuations, growth of financial inclusion and regulation that requires institutions to increase their capital requirements across the sector.
FinTech Sector:
Deals in the FinTech sector during the quarter include;
- Paystack Payments Limited, a Nigeria-based FinTech company that processes payments for businesses in Africa, raised USD 8.0 mn (Kshs 806.3 mn) in Series A funding, the first round of financing given to a new business after the initial capital, used to start the business. The investment is expected to facilitate the expansion of Paystack across Africa and scaling up of its engineering team. This was the second time the company received funding after it received seed capital of USD 1.3 mn (Kshs 131.0 mn) in 2016 from international investors Tencent, Comcast Ventures, and Singularity Investments. For more information, see our Cytonn Weekly #34/2018,
- Jamii Africa, an InsurTech (Insurance Technology) company based in Tanzania, received an equity investment of USD 0.7 mn (Kshs 70.6 mn) for an undisclosed stake from US-based entrepreneur, Patrick Munis, drawing the enterprise a step closer to its target of USD 2.0 mn (Kshs 201.7 mn), a benchmark set to facilitate its efforts to expand into Kenya. In February this year, The Groupe Spécial Mobile (GSM) Association, an association that represents the interests of mobile operators worldwide, through its Mobile for Development Team and as part of the GSMA Ecosystem Accelerator Innovation Fund, announced that it had granted Jamii an undisclosed amount of funding as part of its start-up portfolio. Jamii Africa also closed a USD 0.75 mn (Kshs 75.6 mn) round of seed funding in early 2017, split equally between grants and venture capital. For more information, see our Cytonn Weekly #31/2018,
- Lendable, a FinTech platform based in Kenya and the US, secured a Kshs 45.3 mn (USD 0.45 mn) convertible grant from the Dutch Government’s Micro and Small Enterprise Fund (MASSIF), managed by FMO, the Dutch Development Bank. This grant is expected to unlock an additional Kshs 452.7 mn (USD 4.5 mn) from commercial investors to fund alternative lenders. In October last year, the firm announced that it had raised Kshs 671.0 mn (USD 6.5 mn) in a Series A round of investment. In April last year, the firm also secured Kshs 56.6 mn (USD 0.55 mn) debt financing for Raj Ushanga House (RUH), the Kenya distributor for Azuri Technologies Ltd, a leading provider of Pay-as-you-go (PayGo) solar energy solutions. For more information, see our Cytonn Monthly – August 2018,
- German investment firm, GreenTec Capital Partners, invested an undisclosed amount for an undisclosed stake in Bismart Insurance, a Kenyan insurance aggregator start-up. The capital investment is expected to facilitate upscaling of Bismart’s digital platform to reach more clients and secure a strong foothold as the first Pan African blockchain - powered insurance aggregator. Founded in 2017, Bismart Insurance leverages cutting-edge technology to provide a digital interface to connect their customers to the best insurance services and investment solutions in the market. The company aims to provide transparency in the insurance process in a bid to increase the insurance penetration level in Kenya and across Africa. In April this year, the company received seed capital of Kshs 1.0 mn (USD 10,000.0) from Standard Chartered’s Women in Tech Program. For more information, see our Cytonn Weekly #28/2018,
- Branch International, a mobile-based microfinance institution headquartered in California, with operations in Kenya, Tanzania and Nigeria, raised Kshs 350.0 mn (USD 3.5 mn) in capital investment based on its second issued commercial paper in the Kenyan market. The capital investment arranged by Barium Capital, a capital-raising advisory firm owned by Centum Investments, is expected to grow Branch’s loan book and expand its financial services and lending products in Kenya. For more information, see our Cytonn Weekly #27/2018. Earlier in April this year, Branch International raised USD 70.0 mn in Series B funding, which combined USD 50.0 mn in debt and USD 20.0 mn in equity for an undisclosed stake. The funds will enable the mobile loan app company to expand its services beyond credit access, to savings and payments, and to start operations in India. For more information, see our Cytonn Weekly #15/2018,
- Musoni, a Kenyan microfinance institution, issued out Kshs 2.0 bn in debt notes with a tenor of 2-3 years and offering investors a chance to roll over funds instead of cashing in at maturity. The issue of the debt notes is to take place in four tranches of Kshs 500.0 mn each. The Kshs 2.0 bn debt note will be used to grow their loan book, which stood at Kshs 1.8 bn as at December 2017. For more information, see our Cytonn Weekly #26/2018,
- Jumo, an emerging market technology start-up that offers credit to individuals, small businesses and banks, announced the close of an equity funding round of USD 52.0 mn led by Goldman Sachs, with participation from other leading investors including Proparco, Finnfund, Vostock Emerging Finance, Gemcorp Capital, and LeapFrog Investments. The funds raised will be used to further Jumo’s growth and expansion into new markets. Founded in 2014, Jumo provides financial infrastructure and products designed to reach part of the population underserved or excluded from the traditional financial services. Jumo currently operates in Africa (Ghana, Kenya, Rwanda, South Africa, Tanzania, Uganda and Zambia), Asia (Pakistan and Singapore) and Europe (United Kingdom). In April this year, France-based Proparco, the private sector financing arm of the French Development Agency (Agence Française de Développement) announced an equity investment of USD 3.0 mn in JUMO as part of the Fintech firm’s strategy to expand into the Asian (Pakistan) market. For more information, see our Cytonn Weekly #14/2018.
We expect that investors will continue to show interest in the FinTech sector in Sub-Saharan Africa as more businesses seek to enhance efficiency and reduce costs by incorporating technology in their operations.
Education Sector
Deals in the Education sector during the quarter include;
- Fanisi Capital, a private equity and venture capital firm that focuses on healthcare, education, consumer goods, and agriculture, agreed to invest Kshs 400.0 mn in Kitengela International School (KISC), with an initial injection of Kshs 205.0 mn for an undisclosed stake. The school which opened its doors in January 2009, with an 8-4-4 curriculum, having both a mixed day and boarding primary school, and a girls’ high school, has an ambitious strategy to triple the number of students, which is currently 1,000 in its four institutions, and to open two more schools over the next five-years. In 2011, Fanisi Capital acquired a 55% stake in Hillcrest International School after settling the Kshs 620.0 mn debt the school owed to Barclays Bank of Kenya with a consortium of investors, making KISC their second investment in the education sector. For more information, see our Cytonn Weekly #35/2018, and
- Half year financial results released by Advtech Group, a private education provider listed on the Johannesburg Stock Exchange, indicate that the company acquired 71.0% of Makini School Limited from Schole Limited for a consideration of ZAR 130.8 mn (Kshs 1.0 bn). Earlier in April this year, Schole Limited, a London based education provider acquired 100.0% stake of Makini Schools for an undisclosed amount. The total value of the Makini School Limited buyout amounted to ZAR 184.2 mn (Kshs 1.5 bn) of which ZAR 157.7 mn (Kshs 1.3 bn) was goodwill accounting for 85.6% of the value. Property, plant and equipment was valued at ZAR 15.6 mn (Kshs 124.0 mn) accounting for 8.5% of the transaction value. For more information, see our Cytonn Weekly #34/2018.
We expect that investors will continue to show interest in the Education sector in Sub-Saharan Africa mainly as a result of the (i) increasing demand for quality and affordable education, with the Gross Enrolment Ratio (GER) having doubled in the last 10-years to 8.5% in 2016 from 4.5% in 2006 according to a report, “The Business of Education in Africa” by Caerus Capital, and (ii) support, such as ease of approvals, offered to investors in the education sector by governments looking to meet Sustainable Development Goals (SDGs) targets of universal access to tertiary education.
Private equity investments in Africa remains robust as evidenced by the increasing investor interest, which is attributed to; (i) rapid urbanization, a resilient and adapting middle class and increased consumerism, (ii) the attractive valuations in Sub Saharan Africa’s private markets compared to its public markets, (iii) the attractive valuations in Sub Saharan Africa’s markets compared to global markets, and (iv) better economic projections in Sub Sahara Africa compared to global markets. We remain bullish on PE as an asset class in Sub-Sahara Africa. Going forward, the increasing investor interest and stable macro-economic environment will continue to boost deal flow into African markets.
During Q3’2018, the real estate sector recorded an array of activities across all themes supported by (i) continued demand for investment property from multinational individuals and the growing middle class, (ii) Kenyan Government efforts towards enabling the environment for developers through key statutory reforms such as National Land Use Policy, and initiatives such as the National Housing Development Fund set to fund public-private partnerships in delivery of affordable homes, and for end users such as the proposed stamp duty exemption for first time home buyers, (iii) the expanding middle class, and (iv) continued infrastructural improvements.
The key challenges that continue to face developers and end users include: (i) Access to financing with private sector credit growth coming in at 4.3% as at June 2018 compared to a five-year average of 14.0% for the period 2013 to 2018, (ii) high land and construction costs, especially in Nairobi and its metropolis, and (iii) oversupply in selected sectors such as office and retail space with an oversupply of 5.7mn SQFT and 2.0mnSQFT, respectively.
- Industry Reports:
The Kenya National Bureau of Statistics (KNBS) released their Gross Domestic Report Q2'2018, where the key take-outs for the real estate sector were:
- The construction sector recorded slower performance growing by 6.1% in Q2’2018, 1.1% points lower than 7.2% in Q1’2018, and 3.4% points lower than 9.5% growth recorded in Q2’2017 while the consumption of cement dropped by 6.8% in Q2’2018. We attribute the decline to the reduction in development activity particularly in the commercial sector as developers await the absorption of the existing surplus stock of office and retail space with an oversupply of 4.7mn SQFT and 2.0mnSQFT, respectively according to Cytonn Research. Despite the slowed activities, the sector’s growth was supported by the ongoing construction of the second phase of the Standard Gauge Railway (SGR). The KNBS report highlighted a 12.4% increase in credit to the construction industry, a reflection that the sector remained vibrant during the quarter despite being 3.4% points slower than Q2’2017, and,
- The real estate sector grew by 6.6% in Q2’2018, 0.2% points lower than 6.8% in Q1’2018, and 0.6% points higher than the 6.0% growth recorded in Q2’2017, and we attribute the growth to renewed investor confidence, and thus investments in real estate following the improved macro-economic environment.
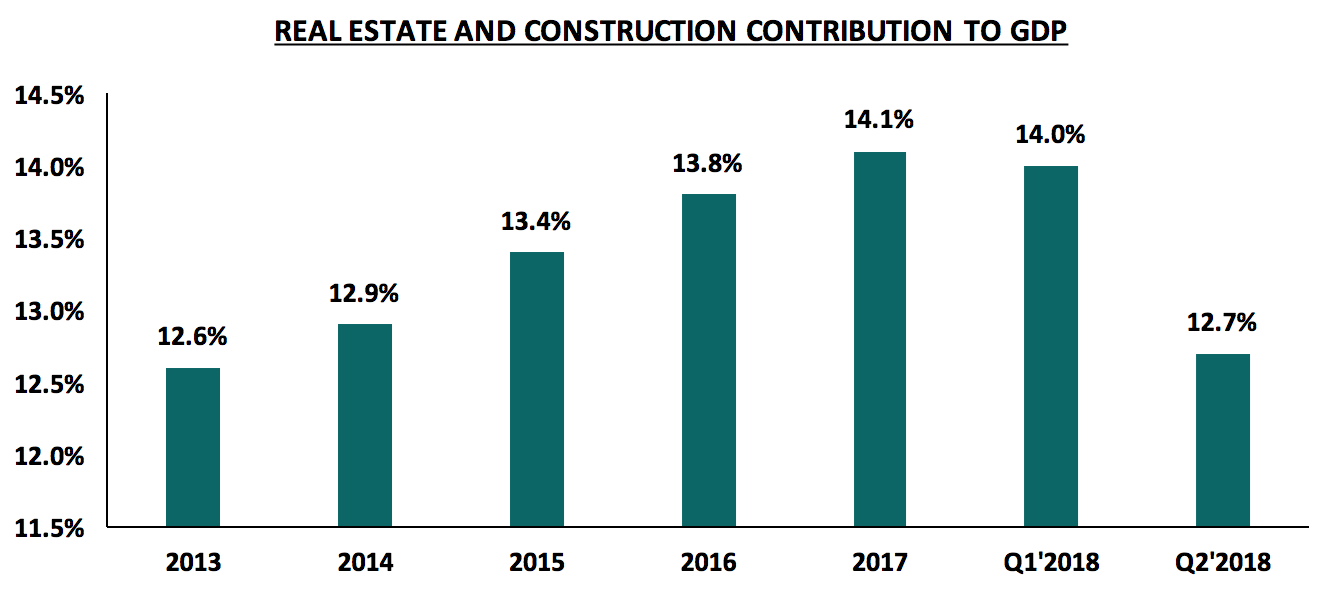
Source: KNBS
According to KNBS, the real estate and construction sectors contribution to GDP declined to 12.7% in Q2’2018 compared to 14.0% during Q1’2018. We attribute the decline mainly to the 3.4% points decline in activities in construction sector. We however expect the trend to reverse driven by; (i) economic recovery with the GDP growing at 6.3% in Q2’2018, higher than the 4.7% recorded in Q2’2017, and (ii) increased focus on affordable housing as part of the Big 4 Agenda with several projects set to be launched in various parts of the country in the coming months.
- Residential Sector:
The residential sector continued to record activity during Q3’2018, as we witnessed new developments especially in regard to the affordable housing initiative as part of the Kenya Government’s Big 4 Agenda. To this end, the key highlights included:
- The National Government invited bids from both international and local developers to build 1,500 affordable residential units at Nairobi’s Park Road estate situated in Ngara for low–income earners, expected to be delivered within 36-months. The government plans to achieve this through Public-Private Partnerships (PPP’s) where the government’s role is to provide the land while the developer is tasked with the role of designing, funding and constructing the units. For more information, please see Cytonn Weekly #34/2018,
- Nairobi Lands, Urban Renewal and Housing County Executive, Mr. Charles Kerich, announced that the implementation of the Nairobi Urban Regeneration Plan would start in September 2018 in Pangani Estate, where a developer known as Technofin was expected to break ground. However, of key to note is that this is yet to be actualized due to unclear and unsatisfactory methods of resettling the residents of Pangani. For more information, please see Cytonn Weekly #31/2018, and
- Co-operative Bank announced that it will invest Kshs 200.0 mn worth of share capital in the Kenya Mortgage Refinancing Company (KMRC), in support of the facility, which is aimed at boosting mortgage financing in Kenya by increasing liquidity for primary lenders. The facility is also expected to receive Kshs 15.1 bn seed funding from the World Bank, and Kshs 1.5 bn from the National Treasury. For more information, please see Cytonn Weekly #31/2018.
To support the affordable housing initiative, H.E. President Uhuru Kenyatta signed into law various bills with an aim of supplementing the budgetary needs of the affordable housing initiative and also boosting offtake for first-time home buyers and thus, increasing the rate of home ownership in Kenya (currently home ownership rate is 26.4% in urban areas and 89.5% in the rural areas, Kenya National Bureau of Standards). These include;
- The Financial Bill 2018, which includes a clause on employees’ contribution to the National Housing Development Fund, as proposed in the National Budget reading for 2018/2019. As per the clause, employees shall be contributing 1.5% of their gross salary to the fund, while employers top this up with a similar amount,
- The amendment of the Income Tax Act that will allow buyers get a 15.0% tax relief up to a maximum of Kshs 108,000 p.a., or Kshs 9,000 p.m., under the newly introduced Affordable Housing Relief section, and,
- The amendment of the Stamp Duty Act, which will now exempt first time home-buyers under the affordable housing scheme from paying the Stamp Duty Tax, normally set at 2.0% - 4.0% of the property value. For more information, please see CytonnWeekly#28/2018.
These advancements are commendable and in our view are a testament to the Kenyan Government’s commitment to delivering the promise of affordable homes to Kenyans, and we anticipate the launch of various projects especially in the Nairobi, Kiambu, Mombasa and Kisumu Counties in the coming months. However, we expect the lack of an attractive public-private partnership (PPP) package for private developers to remain as the biggest impediment to the delivery of the projects. This is due to the persistent challenges that hinder the success of PPPs in Kenya such as (i) persistent red tape during government approval processes, (ii) equivocal profit-sharing strategies for the private partners, and (iii) long and extended time-frames that tend to characterize PPP projects, thus making them unattractive to private developers.
In the mid and high-end market segment, investor appetite remains strong as we have continued to see more private developers coming into the market, such as (i) the recently launched Art Stone Valley project by Kenya-based firm, Capitaland, in partnership with Dubai-based investment firms, that is, Abu Dhabi Investments, Emirate Homes Group, Royal Investments Group; (ii) Double Win Company Limited, a real estate firm, which announced plans to put up a residential complex along Argwings Kodhek Road in Kilimani; while, (iii) Centum, an investment firm in Kenya, announced plans to break ground on Riverbank Apartments within their Two Rivers Mixed Use Development based in Runda. The summary of these projects is as below:
|
Various Private Residential Developments Launched in Q3'2018 |
||||
|
Project |
Developer |
Location |
Typology |
Total number of Units |
|
Art Stone Valley |
Capitaland |
Mang’u, Juja |
3 BR |
960 |
|
2 BR |
480 |
|||
|
1 BR |
60 |
|||
|
- |
Double Win Company Limited |
Kilimani, along Argwings Kodhek Road |
2 & 3 BR |
138 |
|
River Bank |
Centum Investments |
Runda, Along Limuru Road |
3 BR |
60 |
|
2 BR |
118 |
|||
|
1 BR |
18 |
|||
|
Total number of units |
|
|
|
1,834 |
Online Sources
In terms of performance, the sector recorded a 2.0% points decline in annualised total returns to 6.2% in Q3’2018 from 8.2% in Q2’2018. The decline in returns was as a result of slow price appreciation which came in at an average of 0.9% q/q, attributable to credit to the private sector which has been persistently low following the retention of the interest rates cap law. However, rental yields remained fairly flat declining marginally by 0.1% points to an average of 5.3% during the quarter under review from 5.4% in Q2’2018, as developers retain their rental rates in a bid to retain occupants. Apartments performed better compared to detached units with average q/q total returns coming in at 7.1% compared to the overall market’s average returns of 6.2%. This is as buyers continue to opt for the high rise units which tend to be more affordable than low rise units due to the realization of economies of scale through densification,
The summary of the sector is as shown below:
|
Residential Market Performance Summary Q3’2018 |
|||||||||
|
Segment |
Average Rental Yield Q3'2018 |
Average Price Appreciation Q3'2018 |
Average Total Returns Q3'2018 |
Average Rental Yield Q2'2018 |
Average Price Appreciation Q2'2018 |
Average Total Returns Q2'2018 (Annualized) |
Q/Q Change in Rental Yield |
Q/Q Change in Appreciation |
Q/Q Change in Total Returns |
|
Detached |
|||||||||
|
High End |
4.5% |
(0.4%) |
4.3% |
4.7% |
3.5% |
8.3% |
(0.2%) |
(3.9%) |
(4.0%) |
|
Upper Middle |
4.9% |
0.5% |
5.4% |
5.1% |
2.4% |
7.5% |
(0.2%) |
(1.9%) |
(2.1%) |
|
Lower Middle |
5.9% |
0.5% |
6.3% |
5.0% |
2.0% |
7.0% |
0.9% |
(1.5%) |
(0.7%) |
|
Average |
5.1% |
0.2% |
5.3% |
4.9% |
2.6% |
7.6% |
0.2% |
(2.4%) |
(2.3%) |
|
Apartments |
|||||||||
|
Lower Middle Satellite |
5.7% |
2.5% |
8.2% |
5.9% |
2.7% |
8.6% |
(0.2%) |
(0.2%) |
(0.4%) |
|
Lower Middle Suburbs |
5.3% |
1.0% |
6.3% |
5.6% |
3.2% |
8.8% |
(0.3%) |
(2.2%) |
(2.5%) |
|
Upper Middle |
5.3% |
1.5% |
6.8% |
6.0% |
2.9% |
8.9% |
(0.7%) |
(1.4%) |
(2.1%) |
|
Average |
5.4% |
1.6% |
7.1% |
5.8% |
2.9% |
8.8% |
(0.4%) |
(1.3%) |
(1.7%) |
|
Grand Market Average Q3’218 |
5.3% |
0.9% |
6.2% |
5.4% |
2.8% |
8.2% |
(0.1%) |
(1.8%) |
(2.0%) |
|
· Apartments recorded better performance with average total returns to investors of 7.1% in comparison to detached units which recorded average returns to investors of 5.3%. This is as buyers continue to opt for the high-rise units which tend to be more affordable than low rise units due to the realization of economies of scale through densification, · In addition, as low-rise areas such as Loresho and Ridgeways become more densified, low rise developments are losing their appeal to potential investors thus leading to slow price appreciation, which came in at 0.2% on average during the quarter while apartments recorded an average price appreciation of 1.6% |
|||||||||
Source: Cytonn Research
Detached units
Detached units recorded subdued performance during the quarter, with average returns to investors coming in at 5.3%, 0.9% points lower than market’s average of 6.2%, mainly a result of the continued interest in high rise developments in the wake of the huge housing gap for affordable housing. The performance is as shown below:
|
(All Values in Kshs Unless Stated Otherwise) |
||||||||
|
Top 5: Detached Market Performance Q3’2018 |
||||||||
|
Location |
Average of Price Per SQM Q3'2018 |
Average of Rent per SQM Q3'2018 |
Average of Uptake Q3’2018 |
Average of Rental Yield Q3'2018 |
Average of Price Appreciation Q3'2018 |
Average of Total Return Q3'2018 (q/q) |
Average of Total Return Q2’2018 (Annualized) |
Q/Q Change in Total Returns |
|
Runda Mumwe |
159,855.0 |
715.3 |
84.5% |
5.7% |
1.6% |
7.4% |
8.70% |
(1.3%) |
|
Ridgeways |
148,029.5 |
901.5 |
75.4% |
7.0% |
0.0% |
7.0% |
7.7% |
(0.7%) |
|
Runda |
211,684.5 |
846.7 |
86.4% |
5.0% |
1.5% |
6.5% |
5.8% |
0.7% |
|
Karen |
187,926.2 |
752.1 |
88.4% |
4.9% |
1.6% |
6.5% |
11.7% |
(5.2%) |
|
Lower Kabete |
176,137.4 |
490.7 |
81.9% |
3.8% |
2.7% |
6.5% |
8.70% |
(2.2%) |
|
Average |
176,726.5 |
741.3 |
83.3% |
5.3% |
1.5% |
6.8% |
8.5% |
(1.8%) |
|
· Runda Mumwe, Ridgeways, Runda, Karen, and Lower Kabete were the best performing markets in the detached market during the quarter, with average total returns to investors of 6.8% compared to the overall detached market average of 5.3% · Runda Mumwe was the best performing market with average total returns of 7.4% in comparison to the market average of 6.3%. This is attributable to the area’s association with the upscale Runda while offering affordable high-end developments thus attracting buyers · Ridgeways recorded a stagnation of prices, attributable to the area’s increased densification and thus losing its appeal to buyers. However, the area’s performance is boosted by the premium rental rates it attracts, which against flat prices boosts its rental yields |
||||||||
|
Source: Cytonn Research |
||||||||
Apartments
Apartments recorded the best returns to investors during the quarter with an average of 7.1% compared to detached units with 5.3%. Ruaka was the best performing market with average total returns to investors of 8.2%.
|
The performance is as below:
(All Values in Kshs Unless Stated Otherwise) |
||||||||
|
Top 5: Apartments Performance Q3’2018 |
||||||||
|
Location |
Average of Price Per SQM Q3' 2018 |
Average of Rent Per SQM Q3' 2018 |
Average of Uptake Q3' 2018 |
Average of Rental Yield Q3'2018 |
Average of Price Appreciation Q3'2018 |
Average of Total Return Q3'2018 (q/q) |
Total Returns Q2'2018 (Annualized) |
Q/Q Change in Total Returns |
|
Ruaka |
103,769.9 |
453.5 |
90.8% |
4.9% |
3.3% |
8.2% |
11.1% |
(5.6%) |
|
Thindigua |
103,645.2 |
447.1 |
91.5% |
5.0% |
3.0% |
8.1% |
11.2% |
(5.8%) |
|
Parklands |
120,364.9 |
565.5 |
85.0% |
5.1% |
2.4% |
7.4% |
5.9% |
(0.3%) |
|
Kikuyu |
77,218.3 |
344.8 |
73.2% |
5.3% |
1.7% |
7.1% |
8.1% |
(2.3%) |
|
Langata |
109,223.2 |
476.3 |
78.7% |
5.2% |
0.8% |
6.0% |
5.6% |
0.1% |
|
Average |
102,844.3 |
457.4 |
83.8% |
5.1% |
2.2% |
7.3% |
8.4% |
(2.8%) |
|
· Kikuyu, Langata, Parklands, Ruaka, and Thindigua were the best performing during the quarter with average total returns to investors of 7.3% q/q compared to the market average of 7.1%, · Ruaka was the best performing market with average returns to investors during the quarter coming in at 8.2% compared to the market average of 7.1%. The town has been increasingly attracting investors’ interest, attributable to the continued infrastructural improvements, proximity to upscale neighbourhoods such as Runda and Rosslyn, as well as presence of Two Rivers mall, thus making it attractive to home buyers · This was followed by Thindigua and Parklands, with average total returns of 8.1% and 7.4%. Parkland’s performance was boosted by a relative increase in price appreciation of 3.7% points q/q with q3 recording an average of 2.4% in comparison to the depreciation of 1.3% recorded in Q2’2018. This is as surrounding neighbourhoods such as Westlands and Riverside continuously become commercialized |
||||||||
|
Source: Cytonn Research |
||||||||
We expect the residential sector to continue recording activity in relation to affordable housing, while the market performance and uptake is likely to remain subdued due to factors hindering home purchasing such as the persistent lack of private sector credit growth amidst rising costs of living with investors’ returns sustained by rental yields.
- Commercial Office Sector:
During Q3’2018, the commercial office sector recorded a marginal improvement in performance with average rental yields of 9.5%, 0.2% points higher than Q2’2018, with 9.3%. This increase in rental yields is largely driven by the 2.7% points rise in occupancy rates coming at 87.3% in Q3’2018 compared to 84.6% in Q2’2018, which is an indication of increased uptake of office spaces as a result of i) political stability that has led to increased economic activities, and ii) entrance of multinationals such as Betmaster, a Russian betting company, that launched its presence into Nairobi as its first African destination in August affirming Nairobi’s position as a regional hub. We, however, note that rental rates during the period stagnated at an average of Kshs 102 per SQFT while asking prices dropped by 2.6% to Kshs 12,202 in Q3’2018 from Kshs 12,527 in Q2’2018. We attribute the stagnation in rents and drop in prices to the oversupply of 4.7 mn SQFT office space as at 2017, as per Cytonn Commercial Office Report 2018, which have created a bargaining chip for firms forcing developers to reduce or maintain prices and rents in order to remain competitive and attract occupants in their office spaces.
The table below highlights the performance of the commercial office sector in Nairobi in Q3’2018:
|
(All values in Kshs unless otherwise stated) |
||||||
|
Nairobi Commercial Office Performance Summary Over Time |
||||||
|
Year |
FY’2015 |
FY’2016 |
FY’2017 |
Q2 2018 |
Q3'2018 |
Q/Q ∆ 2018 |
|
Occupancy (%) |
89.0% |
88.0% |
83.2% |
84.6% |
87.3% |
2.7% |
|
Asking Rents (Kshs/SQFT) |
97 |
97 |
99 |
102 |
102 |
0.0 |
|
Average Prices (Kshs/SQFT) |
12,776 |
12,031 |
12,595 |
12,527 |
12,202 |
(2.6%) |
|
Average Rental Yields (%) |
9.3% |
9.3% |
9.2% |
9.3% |
9.5% |
0.2% |
|
· Occupancy rates in Q3’2018 grew by 2.7% points to 87.3% from 84.6% as at Q2’2018 an indication of increased demand for the office sector which in turn have boost rental yields by 0.2% points to 9.5% in Q3’2018 from 9.3% in Q2’2018. · Rental rate stagnated during the period Q2/Q3’ 2018 which we attributed oversupply of 4.7 mn SQFT office space in 2017 that has forced developers to reduce or maintain prices and rents in order to remain competitive and attract occupants in their office spaces |
||||||
Source: Cytonn Research
In the sub-market analysis, Karen and Westlands recorded the highest yields of 10.8% and 10.0%, respectively, as properties in these areas charge the highest asking rents of Kshs 117 and Kshs 111 per SQFT, respectively. This is because they are regarded as prime locations with Grade A and high quality Grade B offices thus enabling the developers to charge premium rates. Offices along Thika Road and Mombasa Road on the other hand, recorded the lowest rental yields at an average of 8.7% each, 0.9% points lower than the market average at 9.5%. This is owing to the areas offering low quality Grade B and C offices and are also affected by frequent traffic snarl ups that have made them generally unattractive to firms, thus they charge relatively low rental rates with Mombasa road having an average rent of Kshs 82 per SQFT, 24.4% lower than the market average at Kshs 102 whereas Thika road had an average rent of Kshs 85 per SQFT, 20.0% lower than the market average.
The table below shows the performance of the commercial office sector in Nairobi in Q3’2018:
|
(All values in Kshs unless otherwise stated) |
|||||||||||
|
Nairobi Commercial Office Performance by Nodes Q3’2018 |
|||||||||||
|
Nodes |
Price Kshs / SQFT Q3' 2018 |
Rent Kshs/SQFT Q3 2018 |
Occupancy (%) Q3 2018 |
Rental Yield (%) Q3 2018 |
Price Kshs / SQFT Q2 2018 |
Rent Kshs/SQFT Q2 2018 |
Occupancy (%) Q2 2018 |
Rental Yield (%) Q2 2018 |
Q/Q Δ in Rents (%) |
Q/Q Δ in Yields (%) |
Q/Q Δ in Occupancy (%) |
|
Karen |
12,888 |
117 |
89.0% |
10.8% |
13,776 |
118 |
87.2% |
10.2% |
(0.7%) |
0.6% |
1.8% |
|
Westlands |
10,667 |
111 |
89.0% |
10.0% |
12,567 |
109 |
84.7% |
9.7% |
2.0% |
0.3% |
4.3% |
|
Parklands |
12,208 |
103 |
86.0% |
9.8% |
12,433 |
103 |
85.6% |
9.8% |
0.0% |
0.0% |
0.4% |
|
Kilimani |
13,031 |
101 |
87.3% |
9.6% |
12,694 |
101 |
85.4% |
9.4% |
0.0% |
0.2% |
1.9% |
|
Nbi CBD |
11,333 |
88 |
92.1% |
9.1% |
11,750 |
87 |
92.1% |
8.7% |
1.3% |
0.4% |
0.0% |
|
UpperHill |
13,386 |
100 |
90.1% |
9.0% |
12,708 |
101 |
85.7% |
9.0% |
(1.0%) |
0.0% |
4.4% |
|
Msa Road |
11,750 |
82 |
71.0% |
8.7% |
11,770 |
83 |
68.0% |
8.6% |
(1.0%) |
0.1% |
3.0% |
|
Thika Road |
11,750 |
85 |
89.0% |
8.7% |
11,500 |
85 |
80.0% |
8.7% |
0.0% |
0.0% |
9.0% |
|
Grand Average |
12,202 |
102 |
87.3% |
9.5% |
12,527 |
102 |
84.6% |
9.3% |
0.1% |
0.2% |
3.1% |
|
· Karen generated the highest yields of 10.8%, as the area offers the highest asking rents of Kshs 117 attributable to it being a prime area with grade A and high quality grade B offices thus enabling the developers to charge premium rates · Thika Road and Mombasa Road recorded the least rental yields in the sector of 8.7% each, 0.9% points lower than the market average at 9.5%, driven by the low asking rents in the market of Kshs 82 and Kshs 85 attributable to the areas majorly offer low quality grade B and C offices and are also affected by high traffic snarl ups that have made them generally unattractive to firms · Nairobi CBD recorded the high occupancy rate of 92.1%, 4.8% points than the average at 87.3% since it is the centralized node for business in Kenya thus attracting occupants in the area |
|||||||||||
|
Source: Cytonn Research |
|||||||||||
We also analyzed performance in terms of office classes whereby Grade A offices outperformed other classes recording rental yields of 10.0% compared to Grade B and C with 9.4% and 9.0%, respectively. We attribute the better performance of Grade A offices to the high asking rents of Kshs 114 per SQFT on average, 11.8% higher than the market average at Kshs 102 per SQFT, whereas Grade B and C had Kshs 99 and Kshs 87, respectively. Grade B offices have been recording high occupancy rates throughout attaining 87.9% in Q3’2018, 0.6% points higher than the market average of 87.3% as they offer quality spaces for a relatively cheaper price, 15.2% cheaper than grade A offices.
The table below shows the performance of the different grades in the commercial office sector in Nairobi in Q3’2018:
|
(All values in Kshs unless otherwise stated) |
|||||||||||||
|
Nairobi Commercial Office Performance by Grade Q3’2018 |
|||||||||||||
|
Grade |
Price Q3 2018 |
Rent Q3 2018 |
Occupancy Q3 2018 |
Rental Yield Q3 2018 |
Price Q2 2018 |
Rent Q2 2018 |
Occupancy Q2 2018 |
Rental Yield Q2 2018 |
Q/Q Δ in Price (%) |
Q/Q Δ in Rents (%) |
Q/Q Δ in Rental Yields (% points) |
Q/Q Δ in Occupancy (% points) |
|
|
Grade A |
13,047 |
114 |
84.1% |
10.0% |
12,923 |
110 |
84.8% |
10.0% |
1.0% |
3.6% |
0.0% |
(0.7%) |
|
|
Grade B |
12,250 |
99 |
87.9% |
9.4% |
12,609 |
100 |
85.4% |
9.3% |
(2.8%) |
(0.7%) |
0.1% |
2.5% |
|
|
Grade C |
10,092 |
87 |
85.2% |
9.0% |
10,782 |
86 |
81.4% |
8.5% |
(6.4%) |
1.3% |
0.5% |
3.8% |
|
|
Grand Average |
12,202 |
102 |
87.3% |
9.5% |
12,527 |
102 |
84.6% |
9.3% |
(2.6%) |
0.00 |
0.1% |
2.7% |
|
|
· Grade A offices recorded the highest rental yields of 10.0% compared to Grade B and C with 9.4% and 9.0%, respectively attributable to the high asking rents of grade A office at Kshs 114, 11.8% higher than the market average at Kshs 102, whereas grade B and C with Kshs 99 and Kshs 87, 3.0% and 17.2% lower than the market average, respectively · Grade B offices have been recording high occupancy rates throughout attaining 87.9% in Q3’2018 as they offer quality spaces for a relatively cheaper price |
|||||||||||||
|
Source: Cytonn Research |
|||||||||||||
The main highlights in the commercial office sector during third quarter of the year included:
- Britam Tower, a 32-storey building, owned by British-American Investments Company (Britam), started letting in Upperhill in July. The building whose construction started in September 2013, brought into the Upperhill market a total of 350,000 SQFT of office space. For more information and analysis, please see the Cytonn Weekly #29/2018,
- The Anti-Corruption Agency announced plans to acquire the Integrity Centre Building, which hosts Ethics and Anti-Corruption Commission's (EACC) headquarters along Valley Road in Milimani, Nairobi. The National Land Commission (NLC) approved the acquisition of the building built on 1.2 acres from Tegus Limited at Kshs 1.5 bn that is expected to record a rental yield of 9.6%, in line with Kilimani office performance, against a Nairobi market average of 9.3%. For more information and analysis, please see the Cytonn Monthly – July 2018,
- Prism Towers, a 33–storey building of 133m in height, developed by Kings Developers Ltd officially opened for occupation in August. The building, situated in Upperhill, and whose construction began in 2014 and brought to the market a total of 250,000 SQFT of lettable office space. For additional information and analysis, please see the Cytonn Weekly #30/2018, and,
- Emperor Plaza, a family-owned commercial building located in Nairobi CBD, was set for sale at Kshs 750 mn, exclusive of purchase costs and VAT. The 5-floor building is located at the Junction of Kenyatta Avenue and Koinange Street, and currently hosts the Kenya Institute of Management (KIM) and other tenants. According to local dailies, the vendors value the building at Kshs 750 mn, that is a sale price of Kshs 17,847 per SQFT, with a resultant rental yield of 8.4%. For more information, please see the Cytonn Weekly #34/2018.
Our outlook for the sector remains negative despite the 0.2% improvement in performance as at Q3’ 2018 in Nairobi on the account of the oversupply in the sector that stood at 4.7 mn SQFT of office space as at 2017 and is expected to grow by 12.8% to 5.3 mn SQFT by the end of 2018 with the recent openings of Kings Prism and Britam Tower in Upperhill. In light of this, we are of the opinion that investments in the commercial office space should be aimed towards long term gains as we anticipate the market will have picked up in the next 3 to 5 years. We however recommend investments in differentiated concepts such as serviced offices which have low supply with a market share of just 0.35% and high returns with average rental yields of 13.4% compared to a market average of 9.5%.
- Retail Sector:
In Q3’2018, we witnessed an increase in activities in the retail sector as follows;
- Kiloran Development Group, a UK-based developer with an operational office in Nairobi together with ALL Design, a British architectural firm, announced plans of putting up a Mixed-Use Development (MUD) named, “The Beacon”, to be located off Uhuru Highway towards Bunyala Road roundabout. The MUD will be consisting of 261,563 SQFT of retail space and 45,208 SQFT of Grade A office space. For more details, see Cytonn Weekly#34/2018,
- Nairobi Kenya continues to rank as the East Africa regional commercial hub, with the Two Rivers mall located along Limuru road being awarded the best mixed-use development in Africa in the 9th Africa Property Investment (API) Summit and Expo 2018. The mall award was because of work-life and play experience the mall offers, integration of green technologies and intelligent building management systems for effective, sustainable resource usage, and,
- Increased uptake of retail space with several global and local retailers expanding or announcing plans to expand, as shown below:
|
Retailers Expansion Activities and Plans – Data as at Q3’2018 |
|||||
|
Name |
Country of Origin |
Type of Store |
Stores opened or announced in Q3’2018 |
No of Stores in Kenya |
Location of Stores in Kenya |
|
Carrefour |
French |
Supermarket |
1 at Nakumatt Mega space |
6 |
Two Rivers Mall, Thika Road Mall, The Hub Karen, Sarit Centre, The Junction Mall, Galleria Mall, Village Market |
|
Bosch |
German |
Electronics |
1 Opened at The Oval |
1 |
The Oval, Westlands |
|
Shoprite |
South Africa |
Supermarket |
1 at Mombasa City Mall |
0 |
Westgate Mall, Garden City, Mombasa City Mall, Waterfront mall and 3 undisclosed |
|
Subway |
United States |
Fast Food |
4 planned at CBD, Upperhill, Lavington, and Mombasa Road |
9 |
Junction Mall, Nairobi CBD, Thika Road Mall, Timau Plaza, Amee Arcade in Parklands, Westgate Mall, University Way, Village Market and The Hub in Karen |
|
Naivas |
Kenya |
Supermarket |
1 at Mwembe Tayari Mall |
46 |
Nairobi, Mombasa, Kisumu, Eldoret, Naivasha, Nyeri, Nakuru etc |
|
Massmart |
South Africa |
hardware |
Undisclosed |
0 |
Undisclosed |
|
Burger King |
United States |
Fast Food |
1 opened at Thika Road Mall (TRM) |
4 |
Thika Road Mall, Two Rivers mall, Nextgen Mall and The Hub |
|
LC Waikiki |
Turkey |
Clothing |
1 planned for opening at Thika Road Mall (TRM) |
3 |
Two Rivers mall, The Hub and Mombasa City mall |
|
Java Group |
Kenya |
Restaurant |
3 planned in Kigali, Rwanda |
64 |
Kenya – Nairobi, Kisumu, Mombasa, Nakuru and Eldoret, Rwanda and Uganda |
Source: Cytonn Research
The expansion of both local and international retailers into the country is being driven by (i) high economic growth rates with the GDP growth rate averaging at more than 5.0% p.a over the last 5-years thus boosting disposable incomes, and increasing purchasing power, (ii) Kenya’s growing position as a regional and continental hub hence witnessing an increase in multinationals operating in the country, (iii) huge opportunity in the retail sector, with Kenya having a formal retail penetration of 35% according to Oxford Business Group, compared to markets like South Africa with a penetration of 60%, (iv) provision of high-quality spaces in line with international standards as well as infrastructure, and (v) the exit of struggling local retailers, such as Nakumatt and Uchumi, leaving prime locations for occupation, creating an easy gap for the international retailer’s expansion.
In terms of Nairobi’s market performance in Q3’2018:
- Rental charges averaged at Kshs 178.9 per SQFT, which is a 5.8% q/q decline from Kshs 190.4 per SQFT in Q2’2018,
- occupancy rates averaged at 83.7%, a 1.0% points q/q increase from 82.7%, and,
- Average rental yield of 9.4%, a 0.3% points q/q decline from 9.7% in Q2’2018.
The overall softening of the performance is as result of an oversupply of mall space, currently at 2.0mn SQFT, hence the dynamics of supply and demand.
The retail sector’s performance during Q3’2018 is as shown below:
|
(all figures in Kshs unless stated otherwise) |
||||
|
Summary of Retail Market Performance in Nairobi Over Time |
||||
|
Item |
FY’2017 |
Q2'2018 |
Q3’2018 |
∆ Q3’2018 |
|
Asking Rents (Kshs/SQFT) |
185.0 |
190.4 |
178.9 |
(5.8%) |
|
Occupancy (%) |
80.3% |
82.7% |
83.7% |
1.0% |
|
Average Rental Yields |
9.6% |
9.7% |
9.4% |
(0.3%) |
|
· The retail sector rental yield records a 0.3% q/q points decline from 9.7% in Q2’2018 to 9.4% in Q3’2018 as a result of 5.8% decline in rental charges, attributable to an oversupply of mall space, currently at 2.0mn SQFT, hence price wars by developers in a bid to attract retailers and increase occupancy rates. |
||||
Source: Cytonn Research
In terms of performance by nodes, Westlands, Kilimani and Karen are the best performing retail suburbs in Nairobi with average rental yields of 12.4%, 11.8% and 10.8%, respectively, driven by upper-middle and high-end populations with a high purchasing power hence retailers are willing to pay more for retail space in these areas. The worst performing nodes are the Eastlands and Satellite Towns attributable to low rental charges and competition from informal retail space.
The table below shows the retail sector performance by nodes:
|
(all figures in Kshs unless stated otherwise) |
|||||||||
|
Nairobi Retail Sector Performance by Nodes Q3'2018 |
|||||||||
|
Location |
Average Rent Q3'2018 per SQFT per Month |
Average Occupancy Rate Q3'2018 |
Rental Yield Q3'2018 |
Rent Q2’2018 |
Occupancy Q2’2018 |
Rental Yield Q2’2018 |
Q3’2018 ∆ in Rent (%) |
Q3’2018 ∆ in Occupancy (%) |
Q3’2018 ∆ in Yield (%) |
|
Westlands |
218.8 |
90.2% |
12.4% |
231.0 |
90.8% |
12.4% |
(5.3%) |
(0.6%) |
0.0% |
|
Kilimani |
184.1 |
97.5% |
11.8% |
202.9 |
97.3% |
11.9% |
(9.3%) |
0.2% |
(0.1%) |
|
Karen |
212.8 |
96.0% |
10.8% |
209.5 |
95.0% |
10.4% |
1.6% |
1.0% |
0.4% |
|
Ngong Road |
170.5 |
94.4% |
10.1% |
187.9 |
93.7% |
10.2% |
(9.3%) |
0.7% |
(0.1%) |
|
Thika road |
194.3 |
76.5% |
8.8% |
204.3 |
76.5% |
9.8% |
(4.9%) |
0.0% |
(1.0%) |
|
Kiambu Road |
199.9 |
67.0% |
8.7% |
219.9 |
67.0% |
9.5% |
(9.1%) |
0.0% |
(0.8%) |
|
Mombasa Road |
156.2 |
74.4% |
7.8% |
171.8 |
74.4% |
8.6% |
(9.1%) |
0.0% |
(0.8%) |
|
Satellite Towns |
124.5 |
89.3% |
6.6% |
122.0 |
89.7% |
7.3% |
2.0% |
(0.4%) |
(0.7%) |
|
Eastlands |
149.1 |
68.2% |
7.0% |
164.0 |
60.0% |
7.0% |
(9.1%) |
8.2% |
0.0% |
|
Average |
178.9 |
83.7% |
9.4% |
190.4 |
82.7% |
9.7% |
(5.8%) |
1.0% |
(0.3%) |
|
· The performance softened, recording on average 0.3% points q/q decline in rental yields to 9.4% from 9.7% in H1'2018 as a result of 5.8% q/q decrease in rental charges, due to an oversupply of mall space, currently at 2.0mn SQFT, hence there are price wars among developers in a bid to attract retailers and increase occupancy rates |
|||||||||
|
· Westlands, Kilimani and Karen were the best performing retail suburbs in Nairobi with average rental yields of 12.4%, 11.8% and 10.8%, respectively, driven by high end neighbourhoods hosting most of Nairobi’s middle end and high-end populations with a high purchasing power hence retailers are willing to pay more for retail space in these areas |
|||||||||
|
· The worst performing nodes are the Eastlands and Satellite Towns attributable to low rental charges and competition from informal retail space |
|||||||||
Source: Cytonn Research
Despite the oversupply of retail space, we retain a positive outlook for the retail sector on the back of continued expansion by some local supermarkets and the entry of foreign brands, positive demographics and the improved macro-economic environment. For developers looking to enter the market, we recommend the county headquarters in some markets such as Mombasa and Mt. Kenya regions that have retail space demand of 0.3mn and 0.2mn SQFT, attractive yields at 8.3% and 9.9% and occupancy rates at 96.3% and 84.5%, respectively according to Cytonn’s Kenya retail Sector Report – 2018
- Hospitality Sector
The hospitality sector continued to attract investment from both local and global players during the third quarter of the year as follows;
- PrideInn Hotels announced plans to open a 3-star business hotel in Mombasa comprising of 40 rooms and conference facilities that can accommodate up to 500 people. For more information, please see our Cytonn Weekly#26/2018,
- Mediview Limited, a company based in Dublin, Ireland, announced plans to set up a 200-room, 7-storey, 5-star hotel along Limuru Road on 2.5 acres pending approvals from regulatory authorities such as the National Environmental Management Authority (NEMA). The company has since invited global hotel brands such as JW Marriot Hotel, Accor Hotels and Intercontinental Hotel Group to place bids for managing the facility that will encompass amenities such as a restaurant, meeting rooms, a business center, swimming pool, a gym and spa. For information, please see Cytonn Weekly#36/2018,
- Hospitality Chain, Hyatt Hotels Corporation announced plans to enter Kenya’s hospitality market, following an agreement with Kenyan real estate and construction company, Kanha Ltd. The hotel, set to be open in 2020, will be located in Westlands, Nairobi, and will comprise of 173 guestrooms, 60 apartments, 7,700 SQM of conference space, a restaurant and bar, and swimming pool. The corporation currently runs five hotels in Africa; Hyatt Regency Casablanca (Morocco), Hyatt Place Taghazout Bay (Morocco), Hyatt Regency Sharm el Sheikh (Egypt), Hyatt Regency Dar es Salaam (Tanzania) and Park Hyatt Zanzibar, and
- The owners of Sentrim Hotels and Lodges, the hotel chain that owns the Sentrim Hotels brand, put up the business for sale, consisting of a portfolio of eight hotels located in prime hospitality nodes across Kenya, at a price of Kshs 5.2 bn. The move is bound to benefit the purchasers in that, the business is relatively established in Kenya with over four decades of operations, thus, a solid customer base and goodwill, in addition to the land, which is over 190-acres, please see our Cytonn Weekly#35/2018 for more details on the hotel chain.
Airlines operating in Kenya continue to increase their flights frequency driven by increased tourist arrivals into the country, and we expect this to result in increased demand for accommodation and other hospitality services, and thus improved performance of the hospitality sector. During Q3’2018, the following airlines announced an increase in flight frequency;
|
Airline |
Route |
Previous Flight Frequency per Week |
New Flight Frequency per Week |
|
Fly Tristar |
Nairobi- Mombasa |
4 |
7 |
|
Air France |
Paris- Nairobi |
3 |
5 |
|
Jambojet |
Nairobi- Kisumu |
20 |
24 |
|
Qatar Airways |
Direct flights to Mombasa from Doha, Qatar |
0 |
4 |
Source: Cytonn Research
Three industry reports were released, indicating that the sector is expected to record improved performance in 2018 driven by factors such as; (i) increased international arrivals, (ii) continued marketing, (iii) increase in domestic tourism and (iv) international conferences. Key take-outs from the reports include:
- Jumia Hospitality Report- Kenya the hospitality sector contributed approximately 3.7% to the 2017 GDP, 0.6% points higher than the 3.1% in 2016, and this is expected to increase to 5.2% in 2018. The report also indicated that, hotel bed-nights occupancy rose by 11.0% to 7.2 mn in 2017 from 6.4 mn in 2016, and this is attributable to increased international arrivals, which stood at 1.4 mn in 2017, compared to 1.3 mn in 2016. For more information, please Cytonn Weekly#26/2018,
- PWC Hotel Outlook 2018- 2022 Hotel bed-nights occupancy rose by 11.0% to 7.2 mn in 2017 from 6.4 mn in 2016, and this is attributable to increased international arrivals, which stood at 1.4 mn in 2017, compared to 1.3 mn in 2016. The sectors performance was boosted by (i) new air routes such as direct flights to the United States of America by Kenya Airways, expected to commence in Q4’2018, (ii) increased tourist arrivals, and (iii) continued marketing of the country as a destination for experiences. For more information, please see CytonnWeekly#26/2018,
In terms of performance, we tracked the performance of serviced apartments in 7 nodes in Nairobi Metropolitan area and compared with the performance in Q3’2017. From our research, serviced apartments recorded improved performance with the average rental yield coming in at 6.4%, which is 0.9% points higher than 5.5% recorded in Q’3 2017, and this we attribute to the increased demand for accommodation, with occupancy coming in at an average of 74% compared from 72% during the same period in 2017.
The performance of the various nodes was as follows:
|
All values in Kshs unless stated otherwise |
||||||||||||||||||
|
|
Monthly Rates |
|
|
|
|
|
|
|
|
|
||||||||
|
Node |
Studio |
1 Bed |
2 Bed |
3 Bed |
Occupancy 2017 |
Occupancy 2018 |
Monthly Charge per SM 2017 |
Monthly Charge per SM 2018 |
∆ in Monthly Charge Per SQM |
Rental Yield 2017 |
Rental Yield 2018 |
∆ in Rental Yield |
||||||
|
Kilimani |
131,667 |
154,143 |
203,667 |
217,857 |
74% |
90% |
2,592 |
2,231 |
-14% |
7.2% |
7.9% |
0.7% |
||||||
|
Limuru Rd |
135,930 |
181,620 |
215,670 |
80% |
91% |
1,686 |
2,435 |
44% |
4.5% |
7.6% |
3.1% |
|||||||
|
Upperhill |
180,000 |
256,667 |
310,000 |
60% |
2,333 |
2,159 |
-7% |
6.6% |
7.4% |
0.8% |
||||||||
|
Westlands/Parklands* |
170,000 |
226,667 |
340,000 |
78% |
62% |
2,519 |
2,037 |
-19% |
7.3% |
7.0% |
-0.3% |
|||||||
|
Kileleshwa |
100,000 |
108,333 |
111,667 |
200,000 |
70% |
79% |
2,369 |
1,643 |
-31% |
7.0% |
5.7% |
-1.3% |
||||||
|
Thika Rd |
113,625 |
136,350 |
160,000 |
69% |
901 |
1,346 |
49% |
2.6% |
4.8% |
2.2% |
||||||||
|
Msa Road |
120,000 |
136,350 |
160,000 |
64% |
60% |
1,367 |
1,196 |
-12% |
3.1% |
4.3% |
1.2% |
|||||||
|
Average |
122,532 |
146,817 |
183,862 |
231,310 |
72% |
74% |
1,967 |
1,864 |
-5.2% |
5.5% |
6.4% |
0.9% |
||||||
|
High |
135,930 |
181,620 |
256,667 |
340,000 |
80% |
91% |
2,592 |
2,435 |
|
7.3% |
7.9% |
3.1% |
||||||
|
Low |
100,000 |
108,333 |
111,667 |
160,000 |
64% |
60% |
901 |
1,196 |
|
2.6% |
4.3% |
-1.3% |
||||||
|
*For Westlands we increased our comparable set to ensure wider coverage, thus the significant difference in occupancy *We have estimated an average developer cost of Kshs 200,000-Kshs 231,000 per SQM depending on land prices and allowable plot ratios in the covered nodes in order to calculate yield · Kilimani area was the best performing node recorded high occupancy rates of 90%, and rental yield of 7.9%, and this we attribute to its easy access from Nairobi Cbd and Jomo Kenyatta International Airport (JKIA), proximity to business nodes such as Westlands and Upperhill, presence of social amenities and also security being within the UN Blue zone and thus suitable for expatriates living · Mombasa Road recorded the lowest rental yield at 4.3% and this we attribute to; the area is not mapped as a Blue Zone thus not attractive to expatriates due to security concerns · On overall, the theme recorded higher occupancy coming in at 74% in Q’3 2018, from 72% recorded during the same period 2017. We attribute this to the stable political environment and improved security, which has continued to attract tourists into the country |
||||||||||||||||||
Source: Cytonn Research
We retain a positive outlook for the hospitality sector in Kenya driven by (i) increased demand for accommodation and other hospitality services by both local and international guests, with the number of international arrivals which increased by 0.9% to 443,950 by June 2018 compared to 439,807 during the same period in 2017, (iii) the revision of negative travel advisories, warning international citizens, e.g. from the United States against visiting Kenya, (iv) positive reviews from travel advisories such as Trip Advisor who ranked Nairobi as the 3rd best place to visit in 2018, (v) continued marketing efforts by the Kenya Tourism Board, (vi) Jomo Kenyatta International Airport (JKIA) ranking as the best airport in Africa and 38th globally according to Worldwide rankings by Airhelp, and (vii) improved flight operations and systems, which will make it easier and more convenient for travelers.
- Land Sector
During Q3’2018, the land sector recorded an overall capital appreciation of 4.4%, with high-rise areas recording, the highest price appreciation at 6.0% and this we attribute to the scarcity of development land and increased demand in these areas, as they are zoned for densification, thus high return on capital.
The table below show the performance of the sector during Q[3’2018:
|
Summary of the Nairobi Metropolitan Area Land Performance Across All regions |
|||
|
Q2’ 2018 |
Q3’ 2018 |
Q/Q Capital Appreciation |
|
|
Nairobi Suburbs- High Rise Residential Areas |
205,205,556 |
220,320,917 |
6.0% |
|
Nairobi Suburbs- Low Rise Residential Areas |
88,713,805 |
92,042,699 |
3.7% |
|
Nairobi Suburbs- Commercial Areas |
493,116,420 |
507,515,604 |
2.5% |
|
Satellite Towns |
20,113,779.9 |
21,016,857.56 |
5.3% |
|
Average |
4.4% |
||
|
· High-rise areas recording, the highest price appreciation at 6.0% and this we attribute to the scarcity of development land and increased demand of the same in these areas, as they are zoned for densification, thus high return on capital. |
|||
Source: Cytonn Research
- The high-rise residential areas such as Kileleshwa, Kasarani and Dagoretti, recorded a capital appreciation of 8.7%, 7.1% and 5.2% respectively, with Kileleshwa recording the highest, attributable to increase demand for property in the area, while Embakasi recorded the lowest appreciation of 4.3% attributable to congestion on trunk infrastructure making it unattractive for settlement and thus reduced development activity and demand for land,
- Nairobi low-rise residential areas such as Karen, Spring Valley, Runda, and Kitisuru recorded a capital appreciation of 7.1%, 5.2%,4.3% and 3.5% respectively, with an average land price of Kshs 92.0mn in Q3’ 2018 from Kshs 88.7mn as at Q2’ 2018. Karen recorded the highest capital appreciation rates of 7.1% against a submarket average of 3.7%, attributed to its affordability as compared to other low-rise residential nodes, with an average capital per acre of land in Karen being Kshs 63mn against a market average of Kshs 92mn for the low-rise residential nodes,
- Commercial zones recorded a capital appreciation of 2.5% in Q’3 2017, lower than both the high rise and low rise residential zones which recorded quarterly increments of 6.0% and 3.7%, respectively, attributable to decreased demand for commercial property given the existing oversupply of 4.7mn SQFT of office space. Nairobi CBD, Riverside and Kilimani recorded the highest capital appreciation, among the commercial zones, at 8.7%, 1.2% and 1.1% respectively, attributable to the high plot ratios allowing for densification of developments, hence high demand due to attractive returns on investment after development and also due to the increased migration of firms to commercial nodes away from the CBD creating demand in areas such as Riverside and Kilimani. In addition, the unavailability of development land in the CBD has resulted in the high capital appreciation recorded in the area. Upperhill recorded the lowest capital appreciation at 0.7%, and this we attribute to decreased demand for commercial property in the area, given the existing oversupply of office space, which currently stands at 4.7 mn SQFT,
- Land in satellite towns such as Ruai, Thika, Ngong, Ruiru and Ruaka recorded a capital appreciation of 9.2%, 8.1%, 5.0% and 2.4% respectively, in Q3’ 2018. On overall, the areas recorded a capital appreciation of 5.3%, and we attribute this increase to the growing demand for development land in such areas as Thika, Ruai and Ruaka, which are fairly priced compared to land in suburbs, at an average land price of Kshs 21.0 mn per acre
The opportunity in the sector lies in the high-rise residential areas such as Kileleshwa, and Kasarani, which recorded a capital appreciation rates of 8.7% and 7.1% respectively and satellite towns such as Ruai, Thika and Ngong which are the best performing areas with a capital appreciation of 9.2%, 8.1%% and 8.1%, respectively in Q3’2018.
Other highlights during the quarter;
- Encroachment of land set for the phase 2 of the Standard Gauge Railway, which is set transverse through Narok, Kajiado and Nakuru Counties, is likely to result in delay of the implementation of the same. According to Abigail Mbagaya, the chairperson of the National Land Commission, relocation of the families has become a challenge as there has been no compensation made to the families.
We retain a positive outlook for the land sector backed by: i) improved demographics evidenced by the growth of middle income population who have an increasing purchasing power indicating sustained demand, ii) an enabling macro-economic environment shown by the waiver of land title search fees, iii) improved infrastructure that exposes areas for investment and iv) the relaxation of zoning regulations that facilitates optimal land use.
- Infrastructure Sector:
In the infrastructure sector, the government continues to increase its investments in order to boost the country’s economic growth through; i) revenue generation, ii) increased employment opportunities, iii) betterment of services and facilities, and iv) improving the ease of doing business in Kenya. Below is a table highlighting infrastructural projects across the country that were announced during Q3’2018:
|
Infrastructural Project announced for development in Kenya in Q3’2018 |
|||||
|
|
Name of Project |
Type |
Length (Kms) |
County |
Project Value |
|
1. |
Lamu – Isiolo Road |
Road |
530 km |
Lamu/Isiolo |
Kshs 62.0 bn |
|
2. |
Gilgil to Njoro Road |
Road |
23 km |
Nakuru |
Kshs 1.4 bn |
|
3. |
Sewerage systems in Murang’a County |
Sewer system |
|
Muranga |
Kshs 4.0 bn |
|
4. |
Konza City Infrastructure |
Road, fiber cable connectivity and electricity reticulation |
40 km |
Machakos |
Kshs 40.0 bn |
|
5. |
Konza City Infractructure |
Data center |
|
Machakos |
Kshs 17.0 bn |
|
6. |
Industrial area’s Enterprise Road to the City Centre flyover |
Flyover |
2.0km |
Nairobi |
Plans underway |
|
7 |
Miritini passenger terminus to Mombasa CBD train station |
Railway |
22km |
Mombasa |
undisclosed |
|
8 |
Garissa Road – Thika Super Highway Bypass |
Roads |
10km |
Kiambu |
Kshs.1.5 bn |
|
9 |
Garissa Road – Kenyatta Highway |
Roads |
15km |
Kiambu |
Kshs. 1.5 bn |
|
10 |
Nairobi Satellite Towns Water and Sanitation Development Programme Project |
Water |
|
Kiambu – (Ruiru – Juja) & Kajiado (Kiserian – Ongata) |
Kshs. 3.6 bn |
|
11 |
Standard Gauge Railway (SGR) Phase 2B |
Railway |
262km |
Nakuru & Kisumu |
Kshs 380 bn |
|
12 |
Kitengela sewer line |
Sewer |
45km |
Kajiado |
Kshs. 1.4bn |
|
13 |
Extension of the Olkaria 1 units 4 & 5 geothermal power |
Power plant |
83 MW |
Nakuru |
Undisclosed |
|
|
*Total disclosed projects value |
|
|
|
Kshs. 512.4 bn |
Source: Cytonn Research
In our view, the increased investment in infrastructure is an indication that the government is committed to its developmental agenda and guarantees overall growth of the Kenyan economy. If successfully completed and implemented, the State’s infrastructural initiatives would have a positive effect on the real estate sector in Kenya, since infrastructure helps open up more areas for real estate development increasing accessibility and access to essential services such as water, electricity and a sewerage system.
- Listed Real Estate:
- The Fahari I- REIT, Kenya
Stanlib Fahari I-REIT released their H1’2018 earnings, registering a 16.3% y/y decline in earnings to Kshs 0.36 per unit from Kshs 0.43 per unit in H1’2017, attributable to 7.7% decline in operating income outpacing the 0.9% decline in operating expenses. The operating income decline is attributable to an 18.1% decline in interest income to Kshs 41.9 mn from Kshs 51.1 mn in H1’2017, coupled with a 2.1% decline in rental income to Kshs 135.1 mn from Kshs 138.0 mn in H1’2017. The company, however, noted that the decline in rental income is attributable to a temporary increase in vacancies, coupled with some tenants bargaining for reduced rentals upon the renewal of leases, despite the additional 1-month rental income contribution by their newly acquired property, which is 67 Gitanga Place, which was acquired in May 2018. For example, one of the properties owned by the REIT, the Greenspan Mall had an occupancy of 74.0% in H1’2018 from 90.0% in 2017, which is 5.5% points lower than the Nairobi retail market average at 83.7%. The I-REIT recorded a dividend yield of 5.7%, based on Kshs 10.5 market price per share as at 1st August 2018, assuming the dividend pay-out ratio remains at 91.0%, similar to the FY’2017 pay-out. The yield is relatively low compared to brick and mortar assets with commercial retail and office achieving rates of 9.4% and 9.5% in Q3’2018, respectively, as shown below. While the stagnation of the REIT market is generally blamed on the lack of investor education, the fact is that investors are better off investing in government bonds or commercial buildings than in REITS given the substandard yields offering by listed REITs;
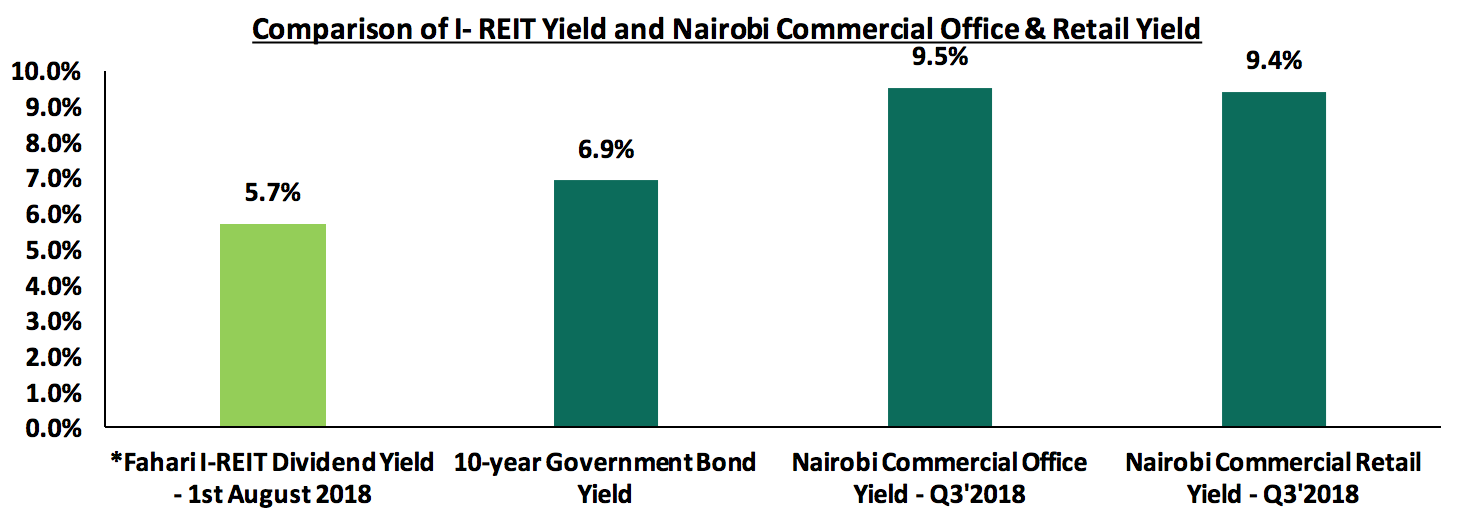
Source: Cytonn Research 2018
For a more comprehensive analysis on the REIT H1’2018 performance, see our Stanlib Fahari I-REIT Earnings Note.
On the bourse, during Q3’2018, Stanlib’s Fahari I-REIT price declined by 9.7%, closing at Kshs 10.2 per share from Kshs 11.3 per share at the end of June 2018, but still trading at a 48.9% discount from its listing price of Kshs 20.0 in November 2015. In addition, Fahari I-REIT is trading at a discount of 48.6% to its Net Asset Value per share, which currently stands at Kshs 19.9 as per H1’2018 reporting. The prices for the instrument have remained low averaging at Kshs 10.2 in Q3’2018 largely due to: i) opacity of the exact returns from the underlying assets, ii) the negative sentiments currently engulfing the sector given the poor performance of Fahari and Fusion REIT (FRED), iii) inadequate investor knowledge, and iv) lack of institutional support for REITs. We expect the REIT to continue trading at low prices and in low volumes.
The graph below shows the REIT’s performance in Q3’2018;
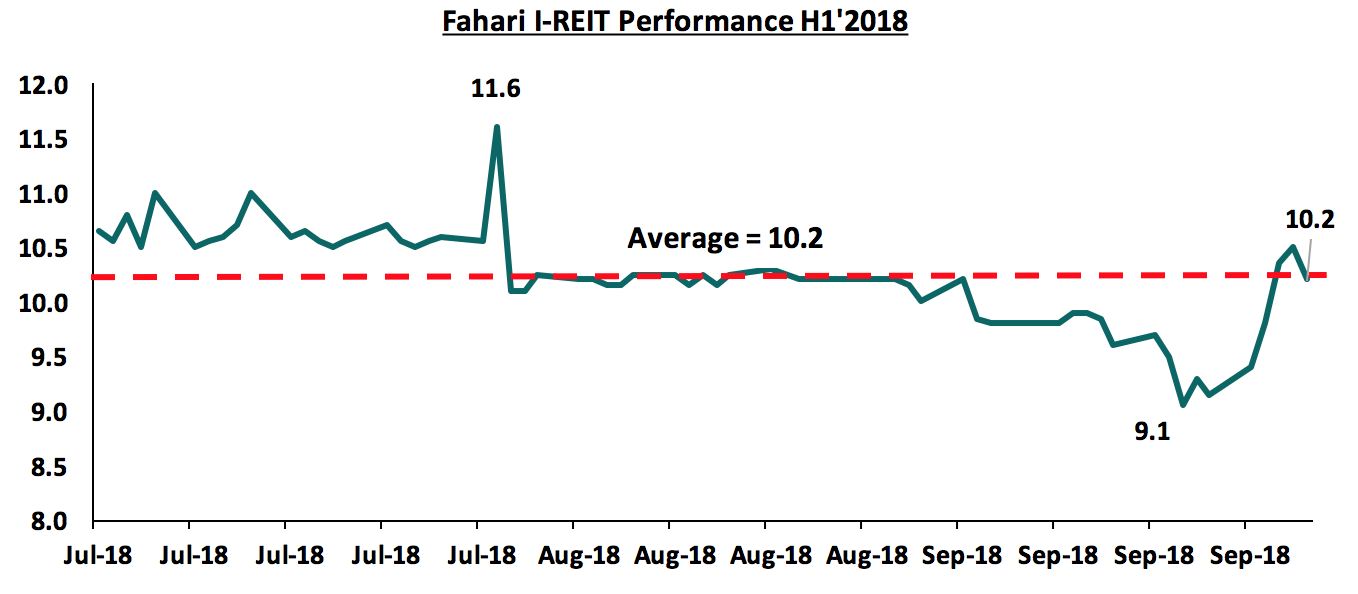
- REITS on the Nigeria Stock Exchange
In Nigeria, the REITs market continued to remain flat in Q3’2018. Of the three REITs we cover, two, that is, Union Home and Skye Shelter’s prices, remained unchanged, while the UPDC REIT declined by 10.0% to NGN 9 from NGN 10 at the end of June 2018. Nigeria’s REITs market has plateaued indicating a stalled demand for the past couple of years which is attributable to shallow investor knowledge, poor market regulation amidst a high-interest rate environment; and therefore, we expect the performance to continue on this trend for the long term.
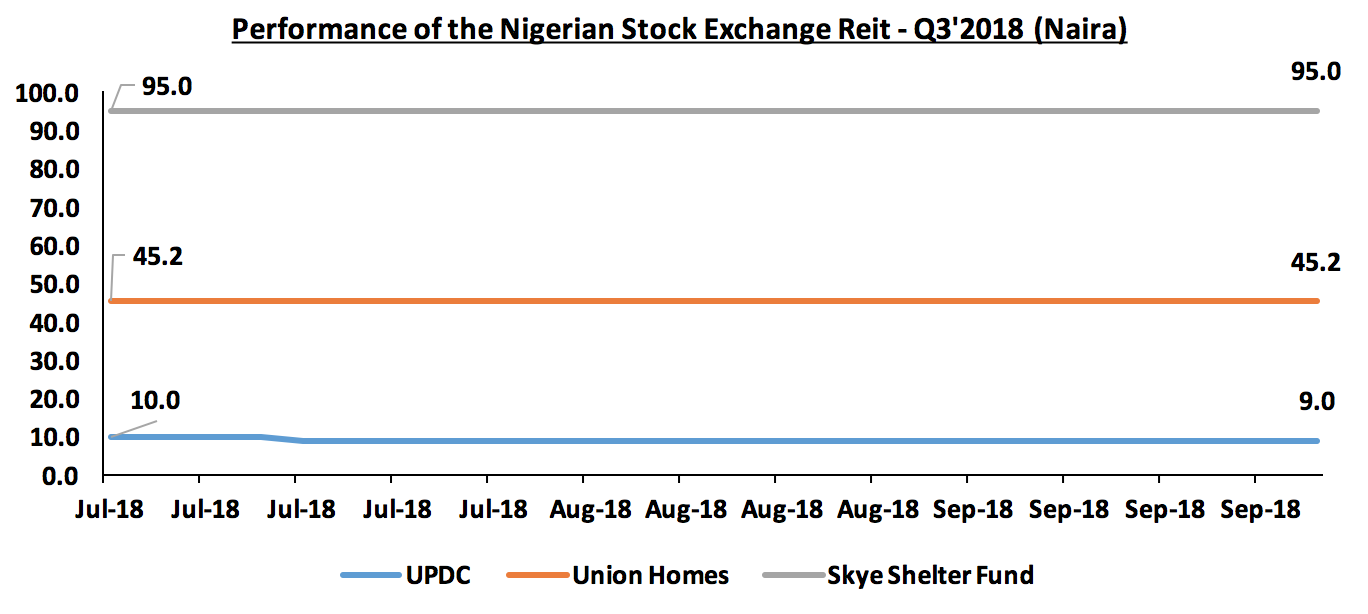
We retain a negative outlook for the listed real estate sector mainly due to market structures and poor market sentiment, however, attempts by key real estate industry players in the region such as East Africa Forum for Structured products and REITs association of Kenya to improve the market sentiment on REITs and other alternative investments and need for capital by developers is expected to drive uptake of the REIT.
We remain optimistic about the positive performance of the real estate sector driven by: positive demographic trends such as: rapid urbanization that currently stands at 4.4% against a global average of 2.1%, rapid population growth rates of 2.6% against a global average of 1.2%, sustained infrastructural development, with the government set to build 10,000 kms of road networks in the next 5-years which will open up areas for real estate development and a better operating environment due improved macro-economic environment, as well as sustained investor appetite.
Disclaimer: The views expressed in this publication, are those of the writers where particulars are not warranted. This publication, which is in compliance with Section 2 of the Capital Markets Authority Act Cap 485A, is meant for general information only, and is not a warranty, representation, advice or solicitation of any nature. Readers are advised in all circumstances to seek the advice of a registered investment advisor.

- Talk to us
- Kenya
- P.O Box 20695 - 00200, Nairobi, Kenya
- Cell +254709101200
- Tel +254709101200
- WhatsApp +254741676635
- United States
- +254709101200
- DOWNLOAD OUR APP
-


- Kenya
- 8th Floor, Pinetree Plaza, Kaburu Drive, Ngong Road, Nairobi, Kenya
- USA
- Suite 1150, 1775 Eye Street NW, USA, Washington DC 20006, USA
- Investments
- High Yield
- Private Equity
- Real Estate
- Real Estate
- RiverRun Estates
- Cytonn Towers
- The Ridge
- Taraji Heights
- The Alma