Nairobi Metropolitan Area Serviced Apartments Report - 2018, & Cytonn Weekly #47/2018
By Cytonn Research Team, Dec 9, 2018
Executive Summary
Fixed Income
T-bills were under-subscribed during the week, with the overall subscription rate coming in at 46.0%, down from 94.7% recorded the previous week, attributable to the tight liquidity in the inter-bank markets. The yields on the 91-day, 182-day and 364-day remained unchanged at 7.3%, 8.2%, and 9.6%, respectively. According to Stanbic Bank’s Monthly Purchasing Manager’s Index (PMI), the business environment in the country recorded continued improvement in November, although at a slower pace compared to the month of October. The seasonally adjusted PMI recorded a decline to 53.1 from 54.0 recorded in October;
Equities
During the week, the equities market recorded mixed performances with NSE 20 gaining by 0.8% while NASI and NSE 25 declined by 1.4% and 0.7%, respectively, taking their YTD performance to declines of 24.1%, 15.9% and 13.9%, for NASI, NSE 20 and NSE 25, respectively. NIC Group and Commercial Bank of Africa (CBA) issued a joint statement indicating that the two banks will hold talks on a potential merger subject to due diligence processes and approval from shareholders, regulators such as the Capital Markets Authority (CMA) and the Central Bank of Kenya (CBK), and other stakeholders;
Private Equity
In the financial services sector, Kenyan Microfinance Institution (MFI) Sumac received a USD 2.0 mn (Kshs 204.9 mn) loan from US-based Social Investment Managers & Advisors (SIMA) to boost its loan portfolio in areas such as off-grid solar products. African Private Equity and Venture Capital Association (AVCA) released their 2018 Annual Limited Partner (LP) Survey, which highlights institutional investor views and expectations about private equity in Africa. According to the report, LPs’ appetite for African PE has remained steady, with 53% of LPs planning to increase their PE allocation on the continent over the next three years. The report also highlighted Kenya as among the most attractive private equity destinations in Africa second only to Nigeria;
Real Estate
The Central Bank of Kenya (CBK) released their Kenya Quarterly Economic Review, April - June 2018, highlighting that the real estate sector recorded the highest q/q increase in Non-Performing Loans (NPLs) at 15.8% to Kshs. 44.4 bn from Kshs 38.3 bn in Q1’2018 followed by the manufacturing, trade and financial services sectors at 11.7%, 7.3% and 2.7%, respectively, while the African Development Bank (AfDB), the African Union Commission (AUC), and the World Economic Forum Global Agenda Council on Africa released the 2018 Africa Visa Openness Report, which ranked Kenya at position #9, up from position #15 in 2017, and position #16 in 2016, due to the country’s simple process for short term visas and open visa-on-arrival policy for all African countries;
Focus of the Week
Serviced apartments are fully furnished apartments that are available for short, mid or long-term stay, and provide hotel-like resources such as housekeeping, room service, fitness centers and restaurants. They provide home comforts such as a private kitchen and are generally less costly to travellers compared to hotels and have thus become a welcome alternative for holiday guests who are travelling as families and for business travellers looking for mid to long-term accommodation. This week we take a look at the performance of serviced apartments in the Nairobi Metropolitan Area, where we start with an overview of the hospitality sector in Kenya, then cover the supply of serviced apartments in Nairobi, the rates, occupancy and rental yields by location and by typology in 2018 and conclude by giving our outlook for the real estate theme.
- Patricia Wanjama, Executive Director and Company Secretary was on KBC Channel 1 to discuss her professional journey and Women at the Forefront. Watch her here
- Cytonn Real Estate, the development affiliate of Cytonn Investments Management Plc appreciated site workers and celebrated the festive season by serving lunch to over 50 workers at their development, The Ridge, at Ridgeways. See full EN here
- The Ridge, a comprehensive lifestyle development at Ridgeways in Nairobi County by Cytonn Real Estate offers a live work play environment. It offers a prime real estate development opportunity. To view show house images click here. The site is open to clients all week long.
- We continue to hold weekly workshops and site visits on how to build wealth through real estate investments. The weekly workshops and site visits target both investors looking to invest in real estate directly and those interested in high yield investment products to familiarize themselves with how we support our high yields. Watch progress videos and pictures of The Alma, Amara Ridge, The Ridge, and Taraji Heights. Key to note is that our cost of capital is priced off the loan markets, where all-in pricing ranges from 16.0% to 20.0%, and our yield on real estate developments ranges from 23.0% to 25.0%, hence our top-line gross spread is about 6.0%. If interested in attending the site visits, kindly register here;
- We continue to see very strong interest in our weekly Private Wealth Management Training (largely covering financial planning and structured products). The training is at no cost and is open only to pre-screened participants. We also continue to see institutions and investment groups interested in the training for their teams. The Wealth Management Training is run by the Cytonn Foundation under its financial literacy pillar. If interested in our Private Wealth Management Training for your employees or investment group, please get in touch with us through wmt@cytonn.com. To view the Wealth Management Training topics, click here;
- For recent news about the company, see our news section here;
- We have 10 investment-ready projects, offering attractive development and buyer targeted returns of around 23.0% to 25.0% p.a. See further details here: Summary of Investment-Ready Projects; and
- We continue to beef up the team with ongoing hires for Financial and Real Estate Advisors for our offices in Nairobi, Nakuru, Kisumu, and Nyeri. Visit the Careers section on our website to apply.
- Cytonn Centre for Affordable Housing (CCFAH) is looking for a 2-acre land parcel for a joint venture or to buy in; Kiambu County (Ruiru, Kikuyu, Lower Kabete), Nairobi County and its environs. The parcel should be; i) fronting a main road, or not more than 800 metres from the main road and ii) priced at Kshs 20mn per acre or below. For more information or leads email us at affordablehousing@cytonn.com
T-Bills & T-Bonds Primary Auction:
T-bills were under-subscribed during the week, with the overall subscription rate coming in at 46.0%, down from 94.7% recorded the previous week. The under-subscription was attributable to the tight liquidity in the inter-bank markets evidenced by the rise in the inter-bank rate, which recorded a high of 8.2% as at 7th December 2018, the highest since August 2018, with the average interbank rate for the week coming in at 7.5%, up from 5.9% recorded the previous week. The subscription rate for the 91-day and 182-day papers declined to 172.8% and 9.9%, from 269.8% and 48.2%, recorded the previous week, respectively. Subscription rate for the 364-day paper however improved to 31.5% from 26.1%, recorded the previous week. The yields on the 91-day, 182-day and 364-day remained unchanged at 7.3%, 8.2% and 9.6%. The acceptance rate rose to 96.2% from 94.7% recorded the previous week, with the government accepting Kshs 10.6 bn of the Kshs 11.0 bn worth of bids received.
For the month of December, the Kenyan Government has issued a new bond; issue no FXD 2/2018/10, with 10.0-years to maturity, and a market determined coupon rate. The government will be seeking to raise Kshs 40.0 bn for budgetary support. The issuing of the medium and long-term bonds are in a bid to lengthen the average time to maturity for the Kenyan Government’s debt portfolio and mitigate the potential rollover risks. The issuance of medium to long-term securities has however continued to have a lacklustre performance, which we attribute to the saturation of long end offers, with the last relatively shorter paper with a 5-year tenor having been offered in March, leading to a relatively flat yield curve on the long-end. The period of sale is from 04/12/2018 to 11/12/2018. Given that the Treasury bonds with the same tenor are currently trading at a yield of 12.4%, we expect bids to come in at between 12.4% and 12.6%.
Liquidity:
The average interbank rate increased to 7.5% from 5.9% the previous week, while the average volumes traded in the interbank market decreased by 42.3% to Kshs 13.0 bn, from Kshs 22.6 bn the previous week. The higher interbank rate points to tighter liquidity, mainly attributed to aggressive activities by the Central Bank of Kenya (CBK) to mop up liquidity through its open market operations, in a bid to protect the shilling.
Kenya Eurobonds:
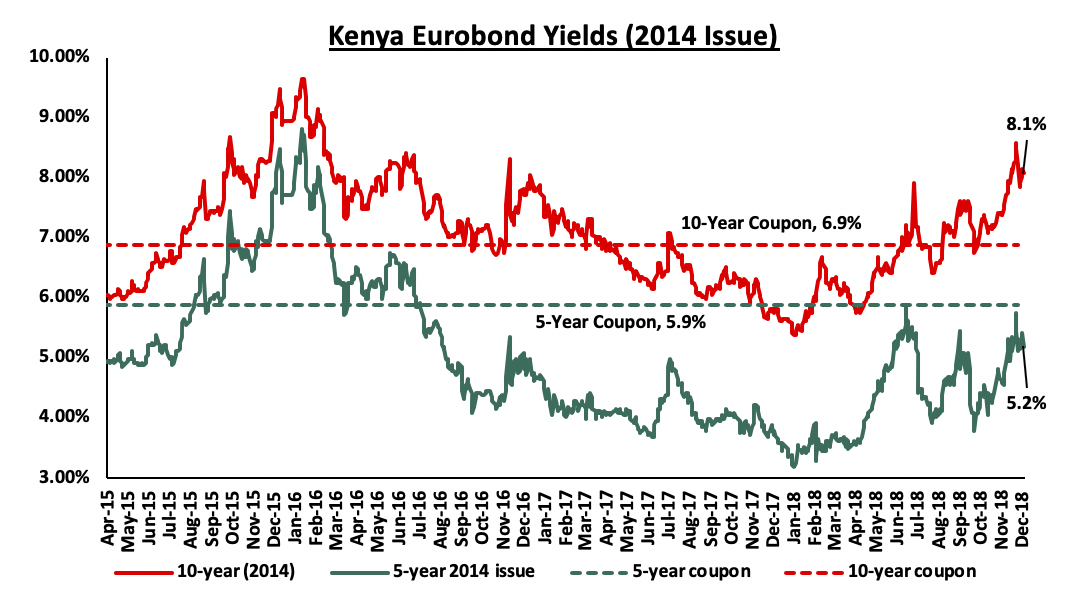
According to Bloomberg, the yields on the 5-year and 10-year Eurobonds issued in 2014 both declined by 0.1% points to 5.2% and 8.1%, from 5.3% and 8.2% recorded the previous week, respectively. Since the mid-January 2016 peak, yields on the Kenyan Eurobonds have declined by 1.5% points and 3.6% points for the 10-year and 5-year Eurobonds, respectively, an indication of the relatively stable macroeconomic conditions in the country. Key to note is that these bonds have 0.5-years and 5.6-years to maturity for the 5-year and 10-year, respectively.
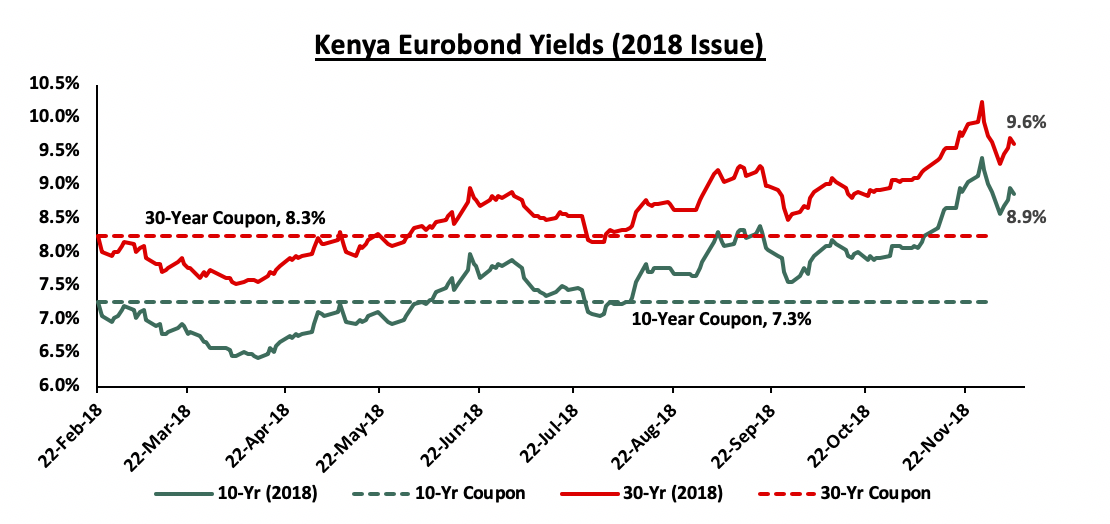
For the February 2018 Eurobond issue, during the week, the yields on both the 10-year and 30-year Eurobonds remained unchanged at 8.9% and 9.6%, respectively. Since the issue date, the yields on the 10-year and 30-year Eurobonds have both increased by 1.6% and 1.3% points, respectively.
Key to note however, yields in Eurobonds issued in the Sub-Saharan Region have been on the rise on a Year to date basis, signalling higher risk perception by investors. This has partly been attributed to the increment in the Federal Rate twice this year, currently at 2.0% - 2.25% which has led to market correction in Eurobond yields in the emerging markets in the wake of rising US treasury yields and a stronger dollar.
Kenya Shilling:
During the week, the Kenya Shilling depreciated by 0.1% against the US Dollar to close at Kshs 102.6 from Kshs 102.5, recorded the previous week, attributed to demand from oil and merchant importers buying dollars ahead of the holiday season exceeding dollar inflows. The Kenya Shilling has however, appreciated by 0.6% year to date, and in our view the shilling should remain relatively stable to the dollar in the short term, supported by:
- The narrowing of the current account deficit to 5.3% in the 12-months to September 2018, from 6.5% in September 2017, attributed to improved agriculture exports, increased diaspora remittances, strong receipts from tourism, and lower food and SGR-related equipment relative to 2017,
- Improving diaspora remittances, which increased by 6.9% m/m growth in diaspora remittances in the month of October 2018 to USD 219.2 mn from USD 205.1 mn recorded in September. The y/y growth came in at 18.2% from USD 185.5 mn recorded in October 2017. Cumulatively, total diaspora remittances rose by 39.5% in the 12 months to October 2018 to USD 2.6 bn from USD 1.9 bn recorded in a similar period in 2017, attributed to; (a) recovery of the global economy, (b) increased uptake of financial products by the diaspora due to financial services firms, particularly banks, targeting the diaspora, and (c) new partnerships between international money remittance providers and local commercial banks making the process more convenient, For more analysis on this see our October diaspora remittances note,
- CBK’s activities in the money market, such as repurchase agreements and selling of dollars, and,
- High levels of forex reserves, currently at USD 8.0 bn, equivalent to 5.3-months of import cover, compared to the one-year average of 5.1 months, as highlighted below:
Highlight of the Week:
According to Stanbic Bank’s Monthly Purchasing Manager’s Index (PMI), the business environment in the country continued to improve during the month of November, although at a slower pace than what was recorded in October. The seasonally adjusted PMI recorded a decline to 53.1 from 54.0 recorded in October. A PMI reading of above 50 indicates improvements in the business environment, while a reading below 50 indicates a worsening outlook. The rate of expansion in new orders was slower than October, with export demand falling to its weakest in 10 months. Output growth also recorded a slowdown, in response to the slower rate of expansion in new orders, which effectively saw staffing levels grow at a gradual pace compared to the solid growth recorded in October, which was a 6-month high. Output prices continued to rise partly due to a rise in material costs coupled with high fuel prices attributed to the effects of the 8.0% VAT on fuel as well as an increase in the landing costs. The business environment in the country has remained resilient with the PMI having averaged 54.4 in the 11 months to November, compared to 46.0 in a similar period in 2017. Going forward we expect output prices to decline, following a decline in the international prices of oil. The decline in oil prices, however, is expected to be curtailed by the recent depreciation of the Kenyan shilling.
Rates in the fixed income market have been on a declining trend, as the government continues to reject expensive bids, as it is currently 0.1% behind its pro-rated domestic borrowing target for the current financial year, having borrowed Kshs 125.3 bn against a pro-rated target of Kshs 125.5 bn. The 2018/19 budget had given a domestic borrowing target of Kshs 271.9 bn, 8.6% lower than the 2017/2018 fiscal year’s target of Kshs 297.6 bn, which may result in reduced pressure on domestic borrowing. With the rate cap still in place, we maintain our expectation of stability in the interest rate environment. With the expectation of a relatively stable interest rate environment, our view is that investors should be biased towards medium-term fixed-income instrument.
Market Performance
During the week, the equities market recorded mixed performances with NSE 20 gaining by 0.8% while NASI and NSE 25 declined by 1.4% and 0.7%, respectively, taking their YTD performance to declines of 24.1%, 15.9% and 13.9%, for NASI, NSE 20 and NSE 25, respectively. The decline in the NASI was driven by declines in large cap stocks such as British American Tobacco (BAT), Safaricom, Bamburi and Co-operative Bank, which declined by 14.8%, 3.2%, 2.2% and 2.0%, respectively.
Equities turnover declined by 54.1% during the week to USD 14.2 mn from USD 31.0 mn the previous week, taking the YTD turnover to USD 1.7 bn. Foreign investors remained net sellers for the week, with a net selling position of USD 2.8 mn, a 21.9% increase from last week’s net selling position of USD 2.3 mn. We expect the market to remain subdued in the near-term as international investors exit the broader emerging markets due to the expectation of rising US interest rates coupled with the strengthening of the US Dollar.
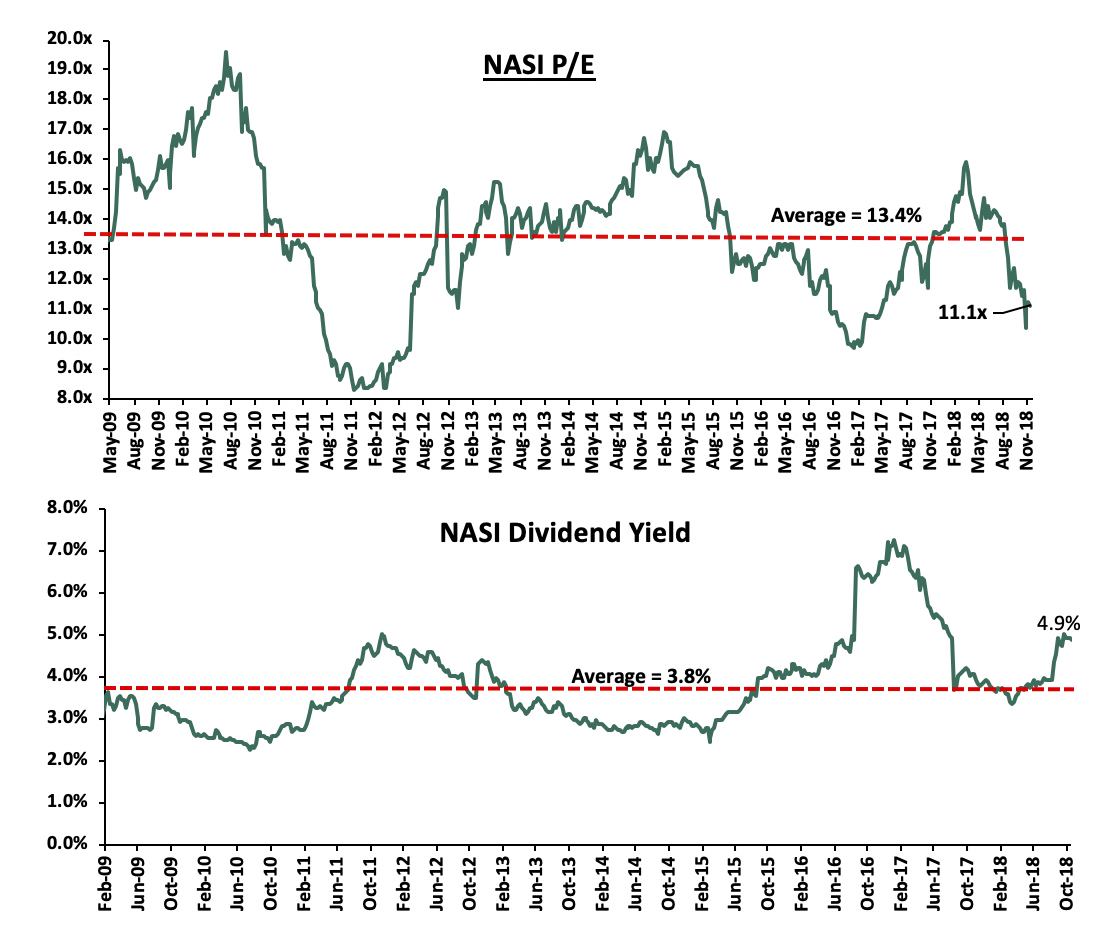
The market is currently trading at a price to earnings ratio (P/E) of 11.1x, 20.7% below the historical average of 13.4x, and a dividend yield of 4.9%, above the historical average of 3.8%. With the market trading at valuations below the historical average, we believe there is value in the market. The current P/E valuation of 11.1x is 14.4% above the most recent trough valuation of 9.7x experienced in the first week of February 2017, and 33.7% above the previous trough valuation of 8.3x experienced in December 2011. The charts below indicate the historical P/E and dividend yields of the market.
Weekly Highlights
NIC Group and Commercial Bank of Africa (CBA) issued a joint statement indicating that the two banks will hold talks on a potential merger subject to due diligence processes and approval from shareholders, the regulators such as the Capital Markets Authority (CMA) and Central Bank of Kenya (CBK), and other stakeholders. CBA is a Tier 1 bank with an asset base of Kshs 242.6 bn while NIC is a Tier 2 Bank with an asset base of Kshs 201.0 bn as of Q3’2018.
The potential merger aims at achieving the following outcomes;
- Enhance growth of the new entity in various aspects of banking and wealth management by consolidation of CBA’s strength retail banking given that it has approximately 21.5 mn accounts, and NIC’s corporate banking expertise, with the banking having approximately 116,000 accounts,
- Leverage on the new entity’s sturdy balance sheet brought about by capital consolidation and strong liquidity, to capture strategic growth opportunities, providing the capability to undertake large transactions,
Below is an analysis of the two bank’s Q3’2018 financial performance:
|
Bank Metrics Comparison – Q3’2018 |
|||
|
CBA |
NIC Group |
||
|
Balance Sheet |
|||
|
Net Loans and Advances |
115.1 |
114.9 |
|
|
Government Securities |
77.3 |
60.2 |
|
|
Total Assets |
242.6 |
201.8 |
|
|
Customer Deposits |
191.3 |
145.0 |
|
|
Borrowings |
8.2 |
15.8 |
|
|
Total Liabilities |
212.0 |
167.9 |
|
|
Shareholders’ Equity |
31.0 |
33.5 |
|
|
Income Statement |
|||
|
Net Interest income |
7.2 |
7.6 |
|
|
Non-Funded Income |
8.3 |
3.4 |
|
|
Total Operating Income |
15.5 |
11.0 |
|
|
Total Operating Expenses |
(10.5) |
(6.6) |
|
|
Net Income |
3.4 |
3.2 |
|
|
Key Ratios |
|||
|
Yield on Interest Earning Assets |
4.9% |
10.8% |
|
|
Cost of Funds |
3.0% |
5.6% |
|
|
NIM |
4.9% |
5.8% |
|
|
NFI % Total Operating Income |
53.4% |
29.9% |
|
|
Cost to Income Ratio |
67.6% |
60.6% |
|
|
Cost of Risk |
14.3% |
14.6% |
|
|
NPL Ratio |
9.9% |
13.3% |
|
|
NPL Coverage |
67.7% |
51.4% |
|
|
RoAE |
26.1% |
12.1% |
|
|
RoAA |
3.2% |
2.0% |
|
Below is the combined proforma financials;
|
Combined Proforma Financials – Q3’2018 |
|||
|
Balance Sheet |
CBA (Kshs bn) |
NIC Group (Kshs bn) |
Combined Metrics (Kshs bn) |
|
Net Loans and Advances |
115.1 |
114.9 |
230 |
|
Government Securities |
77.3 |
60.2 |
137.5 |
|
Total Assets |
242.6 |
201.8 |
444.4 |
|
Customer Deposits |
191.3 |
145 |
336.3 |
|
Borrowings |
8.2 |
15.8 |
24 |
|
Total Liabilities |
212 |
167.9 |
379.9 |
|
Shareholders’ Equity |
31 |
33.5 |
64.5 |
- CBA’s total assets stood at Kshs 242.6 bn as at Q3’2018 compared to NIC’s Kshs 201bn indicating that both banks have a strong asset base. Net loans and advances stood at Kshs 115.1 bn for CBA and Kshs 114.9 bn for NIC during the same period while investment in government securities was at Kshs 77.3 bn and Kshs 60.2 bn respectively. However, NIC seems to be generating higher interest income than CBA as indicated by the higher yield on its interest earning assets of 10.8% compared to CBA’s 4.9%, and consequently a higher Net Interest Margin (NIM) of 5.8% compared to CBA’s 4.9%.
- CBA has a higher deposits mobilization capacity compared to NIC, with customer deposits coming in at Kshs 191.3 bn and 145.0 bn as of Q3’2018, respectively, which is mainly attributable to CBA’s mobile application platform M-Shwari. Data from the Central Bank of Kenya (CBK) shows that CBA had about 21.5 mn deposit accounts in the period ending September 2018, compared to NIC’s 116,000 accounts during the same period. The merger is likely to lower the new entity’s cost of funds due to availability of cheaper funding and greatly benefit NIC whose cost of funds stood at 5.6% in Q3’2018 higher than the industry average of 3.1%.
- NIC had a poorer asset quality with the ratio of non-performing loans coming in at 13.3% in Q3’2018 compared to CBA’s 9.9% over the same period. NIC also had a lower NPL coverage ratio of 51.4% compared to CBA’s 67.7% indicating that the bank was less positioned to write off bad loans. The potential merger is therefore likely to improve the new entity’s asset quality by employment of better credit profiling capabilities possessed by CBA.
- CBA had a higher total operating income of Kshs 15.5 bn versus NIC’s Kshs 11.0 bn mainly driven by a higher proportion of non-funded income of Kshs 8.3bn equivalent to 53.4% of total operating income compared to Kshs 3.4 bn generated by NIC, equivalent to 29.9% of total operating income in Q3’2018. We expect the merger to diversify and strengthen the revenue streams of the new entity backed by NIC’s strong returns from its loan book and CBA’s operational capabilities to generate non-funded income, thereby resulting in a higher bottom line.
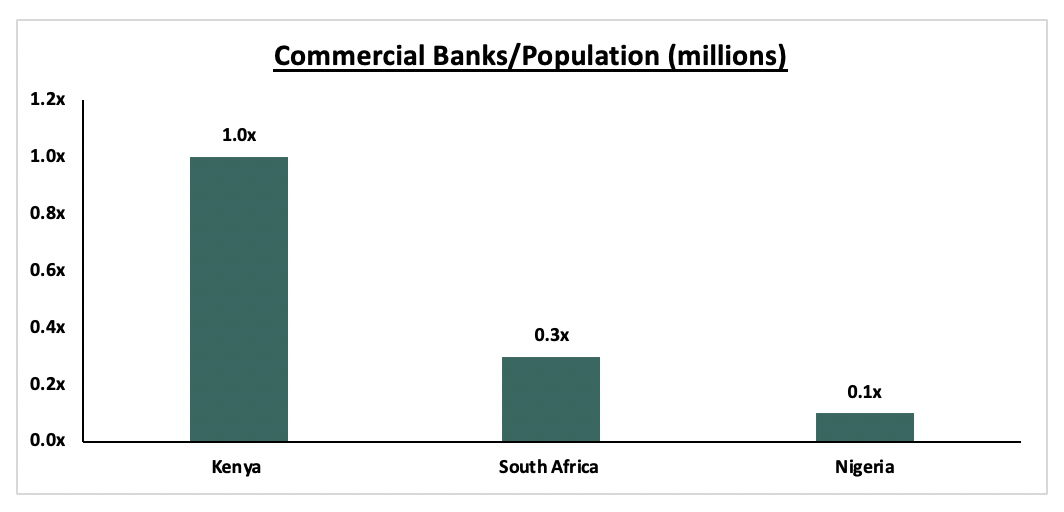
In conclusion, we expect that the merger will provide an opportunity for the new entity to grow by tapping into both retail and corporate banking. With a potential combined market share of 10.9% by total deposits, the new entity upon merger would be the second largest by market share, second only from KCB Bank that commands approximately 14.7% market share as per the Central Bank of Kenya’s (CBK) Banking Supervision Report 2017. This would place the new entity on a strong position to play an important role in the Kenyan banking sector. We are of the view that the industry should and will see more consolidation, as smaller banks with depleted capital positions are acquired as their performance deteriorates due to the sustained effects of the Banking (Amendment) Act 2015. We note that the industry needs fewer but stronger players to ensure the sector remains stable. We expect consolidation to continue in the near term in Kenya’s banking sector, and as per the chart below, the Kenyan market remains highly overbanked:
Source: Cytonn Investments
A report on African banks by global rating agency Moody’s has shown that Kenyan banks have the highest proportion of bad loans among major economies in Africa. Kenya was rated fourth out of 11 countries, with the highest non-performing loans ratio being Angola’s at 25.0%. Kenya ranked after Angola, Ghana and Democratic Republic of Congo (Congo) that had NPLs ratios of about 25.0%, 22.0% and 18.0%, respectively. Data from the Central Bank of Kenya shows that bad loans grew by 25.4% to Ksh 326.0 bn for the first nine months of the year from Kshs 260.0 bn in a similar period last year, and by 8.3% to Kshs 326.0 bn in the third quarter from Kshs 301.0 bn in the second quarter. The rising bad loans were mainly attributable to increased defaults by small business owners and taxi operators. The ratio of non-performing loans to total loans issued in October however reduced by 0.4% points to 12.3% in October from 12.7% in August mainly as a result of improved performance of trade and household sectors.
The number of bad loans are expected to increase in the near term, as the government continues to delay payments to contractors and sub-contractors of government projects thereby hurting their loan repayment capacity.
Universe of Coverage
Below is a summary of our SSA universe of coverage:
|
Banks |
Price as at 30/11/2018 |
Price as at 7/12/2018 |
w/w change |
YTD Change |
Target Price* |
Dividend Yield |
Upside/Downside** |
P/TBv Multiple |
|
Ghana Commercial Bank*** |
4.8 |
4.8 |
0.0% |
(5.0%) |
7.7 |
0.1 |
68.8% |
1.1x |
|
UBA Bank |
7.5 |
7.5 |
0.0% |
(27.2%) |
10.7 |
0.1 |
54.0% |
0.5x |
|
Zenith Bank*** |
23.2 |
23.6 |
1.5% |
(8.2%) |
33.3 |
0.1 |
53.0% |
1.1x |
|
Union Bank Plc |
5.2 |
5.4 |
3.9% |
(31.4%) |
8.2 |
0.0 |
52.3% |
0.6x |
|
Ecobank |
7.5 |
7.5 |
0.0% |
(1.3%) |
10.7 |
0.0 |
43.1% |
1.6x |
|
CAL Bank |
1.0 |
1.0 |
2.1% |
(9.3%) |
1.4 |
0.0 |
42.9% |
0.8x |
|
CRDB |
150.0 |
150.0 |
0.0% |
(6.3%) |
207.7 |
0.0 |
38.5% |
0.5x |
|
Access Bank |
7.8 |
7.5 |
(3.9%) |
(28.7%) |
9.5 |
0.1 |
32.9% |
0.5x |
|
Barclays |
10.8 |
10.8 |
0.0% |
12.0% |
12.5 |
0.1 |
25.6% |
1.5x |
|
Stanbic Bank Uganda |
31.0 |
30.5 |
(1.6%) |
11.9% |
36.3 |
0.0 |
22.8% |
2.2x |
|
SBM Holdings |
6.1 |
6.0 |
(2.0%) |
(20.0%) |
6.6 |
0.1 |
14.3% |
0.9x |
|
Guaranty Trust Bank |
34.4 |
34.9 |
1.6% |
(14.4%) |
37.1 |
0.1 |
13.2% |
2.2x |
|
Bank of Kigali |
290.0 |
290.0 |
0.0% |
(3.3%) |
299.9 |
0.0 |
8.2% |
1.6x |
|
Standard Chartered |
193.0 |
194.0 |
0.5% |
(6.7%) |
196.3 |
0.1 |
7.6% |
1.6x |
|
Bank of Baroda |
139.0 |
128.5 |
(7.6%) |
13.7% |
130.6 |
0.0 |
3.6% |
1.1x |
|
FBN Holdings |
7.1 |
7.6 |
7.0% |
(13.6%) |
6.6 |
0.0 |
(9.5%) |
0.4x |
|
Stanbic IBTC Holdings |
48.0 |
46.5 |
(3.1%) |
12.0% |
37.0 |
0.0 |
(19.1%) |
2.4x |
|
Ecobank Transnational |
16.0 |
15.5 |
(2.8%) |
(8.8%) |
9.3 |
0.0 |
(40.1%) |
0.6x |
*Target Price as per Cytonn Analyst estimates
**Upside / (Downside) is adjusted for Dividend Yield
***Banks in which Cytonn and/or its affiliates holds a stake. For full disclosure, Cytonn and/or its affiliates holds a significant stake in NIC Bank, ranking as the 5th largest shareholder
****Stock prices indicated in respective country currencies
*****Kenyan banks placed under review
We are “NEUTRAL” on equities for investors with a short investment horizon. However, pockets of value exist, with a number of undervalued sectors like Financial Services, which provide an attractive entry point for medium to long-term investors, and with expectations of higher corporate earnings supported by sectors such as banking sector, we are “POSITIVE” for investors with a long-term investment horizon.
Kenyan Microfinance Institution (MFI) Sumac received a USD 2.0 mn (Kshs 204.9) loan from US-based Social Investment Managers & Advisors (SIMA) to boost its loan portfolio in areas such as off-grid solar products. The loan will help the lender to break its financial constraints and expand the loan book to reach new customers. SIMA is a social asset manager focused on offering commercial capital and appropriate advisory to bottom of the pyramid clients.
The loan continues Sumac’s recent funds mobilization:
- In July 2018, Badoer Investments Limited, a Dubai-based investment firm, bought a 15.6% stake in Sumac for Kshs 100.0 mn (USD 1.0 mn). The deal valued the MFI at Kshs 641.0 mn (USD 6.4 mn) as analyzed in our Cytonn Weekly #29/2018, and,
- In February 2018 Sumac mobilized Kshs 375.0 mn in debt financing (Kshs 153.0 mn from Mexican fund manager Triple Jump, Kshs 102.0 mn from the Regional MSME Investment Fund for Sub-Saharan Africa, Kshs 45.0 mn from the Development Bank of Kenya, and Kshs 30.0 mn from the Micro Enterprise Support Programme Trust).
This funding boost is set to support Sumac’s expansion, which has seen market share increase from 0.9% in 2013 to 1.7% in 2017 according to the CBK Banking Survey. Net loans have grown by 205.0% to Kshs 623.0 mn, from Kshs 204.0 mn over the same period.
The transaction highlights global capital interest in micro lending in sub Saharan Africa. Increase in credit lending agencies in Kenya, especially the digital platforms, have diversified the source of funds in the country, which has enabled borrowers to tap into alternative avenues of funding that are more flexible and pocket friendly. Bank funding in Kenya consists of 95.5% of all credit to the private sector with 40.0% being the developed economies average, highlighting the need to diversify funding sources to alternative channels. The interest rate cap has made it even more difficult for risky clients especially SMEs to acquire funding (the current private sector credit growth is at 2.8%, against a 5-year average of 14.0%) thus driving more clients from commercial banks to Microfinance Institutions.
African Private Equity and Venture Capital Association (AVCA) released their 2018 Annual Limited Partner Survey. The study looks into the plans, views, preferences, expectations and evolving attitudes of 60 Limited Partners (LPs) from Africa, Asia, Europe and North America regarding Private Equity (PE) in Africa. LPs’ appetite for African PE has remained steady, with 53% of LPs planning to increase their PE allocation on the continent over the next three years.
In terms of exposure, 53% of LP’s plan to increase their allocation to African PE over the next three years. Of these, 97% are currently invested in PE funds in Africa, and are mainly Development Finance Institutions (33%) and Fund-of-funds (20%). By location, whilst only 44% of non-African LPs plan to increase their African PE allocation, 65% of African LPs plan to increase their exposure to African PE over the next three years. Overall, 76% of LPs plan to increase or maintain their allocation to African PE. Only 5% of survey respondents say that they will decrease their allocation to PE in Africa. In terms of destination, Nigeria is viewed as the most attractive country in Africa with an attractiveness index score of 58% followed by Kenya at 40% and Egypt in third place with a score of 31%. By sector, Financial services was identified as the most attractive sector with a score of 51%.
The findings of the survey are in line with our view on investor sentiments regarding the private equity space in Africa. We expect continuous growth in private equity deals going forward.
Despite the recent slowdown in growth, we maintain a positive outlook on private equity investments in Africa as evidenced by the increasing investor interest, which is attributed to; (i) Economic growth, which is projected to improve in Africa’s most developed PE markets, (ii) the attractive valuations in Sub Saharan Africa’s private markets compared to its public markets, and, (iii) the attractive valuations in Sub Saharan Africa’s markets compared to global markets. Going forward, the increasing investor interest, stable macro-economic and political environment will continue to boost deal flow into African markets.
- Industry Reports
The Central Bank of Kenya (CBK) released their Kenya Quarterly Economic Review, April - June 2018, which highlights among other things the state of the banking sector including the performance of loans issued to various sectors such as the real estate sector. According to the report, on a 12-month basis, private sector credit growth increased to 4.3% in Q2’2018, from 2.0% in Q1’2018, due to strong economic growth experienced during the year, with 6.3% GDP growth in Q2’2018 compared to 5.7% in Q1’2018, and an improved business environment. However, the report notes, credit risk remains high with the ratio of Non-Performing Loans (NPLs) to Gross Loans coming in at 11.9% in Q2’2018, compared to 11.8% in Q1’2018. The key take-outs from the report with respect to the real estate sector include:
- The real estate sector grew by 6.6% in Q2’2018, compared to 6.0% in Q2’2017, attributable to the Kenyan Government investment in infrastructure, and increased uptake of bank credit and availability of alternative financing options,
- The construction sector grew by 8.6% in Q2’2018, compared to 6.0% in Q2’2017, supported by the increase in credit supply to the sector, the ongoing construction of the Second Phase of SGR, and other major public infrastructure projects,
- The real estate sector recorded the highest q/q increase in NPLs at 15.8% to Kshs. 44.4 bn in Q2’2018 from Kshs 38.3bn in Q1’2018, followed by the manufacturing, trade and financial services at 11.7%, 7.3% and 2.7% respectively. This increase is attributed to slow uptake of housing units, and as such developers are unable to service their debt with the banking sector, and
- Credit supply to the real estate sector increased by 0.8% to Kshs 369.4 bn in Q2’2018, from Kshs 366.6 bn in Q1’2018, attributable to increased access to finance and lower cost of credit, while credit supply to the building and construction sector recorded 0.1% increase from Kshs 114.2 bn Q1’2018, to Kshs 114.4 bn in Q2’2018.
From the above we can see the continued growth of the real estate and construction sectors indicating sustained investor interest. The increased NPLs, on the other hand, can be attributed to the subdued performance in the residential and commercial sectors, affected by slow uptake and oversupply. According to Cytonn Research, the residential sector recorded a 0.3% points and 1.0% points decline in annual uptake and price appreciation, respectively, from 23.6% and 3.8% in 2017, to 23.3% and 2.8% in 2018, while the office and retail sectors recorded an oversupply of 5.7mn SQFT and 2.0mn SQFT, respectively, leading to a 4.8% points decline in occupancy rates in office sector to 83.2% in 2018, from 88.0% in 2017 and 0.2% points decline in rental yield in retail sector to 9.4% in 2018 from 9.6% in 2017. Going forward, we expect that the market will adjust through response to market forces of demand and supply.
During the week, the International Finance Corporation (IFC) released its Climate Investment Opportunities in the Cities Report 2018. The report aims at estimating the scale of investment opportunity associated with fully achieving cities’ currently stated sector-specific mitigation goals to 2030, by considering renewable energy, waste management, climate-smart water, public transportation and green building. It covered cities based in East Asia Pacific, Middle East & North Africa, South Asia Europe & Central Asia, Latin America & Caribbean and Sub-Saharan Africa, which included Kenya covering Nairobi City. According to the report, the largest share of the investment opportunity is in green buildings ($24.7 trillion), covering new constructions, as cities race to accommodate their growing populations. Narrowing down to Nairobi City, the following were the key take-outs;
- Priority sectors for investment in Nairobi include green buildings, electric vehicles and waste water management,
- Nairobi is expected to witness a sharp rise in housing construction, following the announcement of affordable housing initiative, as well as the centrality of Nairobi as a commercial hub in the region, leading to an investment opportunity of over USD 1 bn (Kshs 102.6 bn) in construction of buildings,
- Meeting the city’s non-motorized and sustainable transport goals will create an investment opportunity of USD 1.6 bn (Kshs 164.2 bn) in infrastructure including bike lanes, a bus rapid transit system, and commuter rail, with a further USD 5 billion (Kshs 513.0 bn) to catalyze citywide electric vehicle adoption, and,
- Nairobi’s water demand is expected to more than double by 2035, contributing to the USD 0.4 bn (Kshs 41.0 bn) investment opportunity in the water and wastewater sector.
Access to affordable housing and adequate infrastructure continue to be key issues facing the country, and mainly in Nairobi to sustain the increasing urban population, growing at 4.4% compared to world urbanization rate at 2.1%, according to World Bank data. This highlights the need for more efforts by both the public and the private sector towards provision of affordable housing and infrastructure in order to achieve the 2030 goals. Already, we are seeing works towards this, with i) the affordable housing initiative by the Kenyan Government under the Big 4 Agenda, and ii) the Kenyan Government’s dedication to improving the state of infrastructure in Kenya, especially in transport, as part of its efforts to elevate the country to upper middle-class status by 2030. For instance, according to the KNBS Economic Survey 2018, the development expenditure on roads is set to grow by 19.2% to Kshs 134.9 bn in 2017/18, from Kshs 109.0 bn in 2016/17.
- Retail Sector
In the retail sector, Vivo Energy, the company behind the Shell brand, opened its latest service station in Lavington, Nairobi. The service station will host a number of retail outlets including Java House, fast food outlet KFC, Safe Dose Pharmacy and White Rose Drycleaners. The retail sector continues to record increased supply of retail space within Nairobi with an 8-year CAGR of 15.9%, from 2.0 mn SQFT in 2010 to 6.5 mn SQFT in 2018. This has, however, resulted in an oversupply of 2.0 mn SQFT space as at Q3’2018, hence the need for developers to differentiate their retail space offering to attract tenants. We expect the performance of the service station in Lavington to be boosted by:
- The combination of petrol station and retail spaces as the differentiation with the mixed uses complementing each other, and,
- The retail sector in Kilimani (Kilimani, Kileleshwa and Lavington) outperforms other suburbs in Nairobi with average rental yields of 11.8%, 2.4% points above the market at 9.4%, due to the fact that it hosts Nairobi’s middle-end and high-end populations with higher purchasing power.
Below is a summary of retail space performance in various nodes in Nairobi metropolitan area.
(all values in Kshs unless stated otherwise)
|
Summary of Nairobi’s Retail Market Performance by Nodes 2018 |
||||||||
|
Node |
Average Rent/SQFT /Month 2018 |
Average Occupancy Rate 2018 |
Rental Yield 2018 |
Average Rent/SQFT/ Month 2017 |
Average Occupancy Rate 2017 |
Rental Yield 2017 |
Y/Y |
Y/Y Change in Yield |
|
Westlands |
218.8 |
90.2% |
12.4% |
234.7 |
91.0% |
13.5% |
(0.8%) |
(1.1%) |
|
Kilimani |
184.1 |
97.5% |
11.8% |
181.0 |
87.0% |
10.3% |
10.5% |
1.5% |
|
Karen |
212.8 |
96.0% |
10.8% |
206.2 |
96.3% |
11.2% |
(0.3%) |
(0.4%) |
|
Ngong Road |
170.5 |
94.4% |
10.1% |
170.7 |
81.8% |
8.7% |
12.6% |
1.4% |
|
Thika road |
194.3 |
76.5% |
8.8% |
199.2 |
75.3% |
8.7% |
1.3% |
0.1% |
|
Kiambu Road |
199.9 |
67.0% |
8.7% |
216.1 |
78.2% |
10.6% |
(11.2%) |
(1.9%) |
|
Mombasa road |
156.2 |
74.4% |
7.8% |
180.4 |
68.8% |
8.3% |
5.7% |
(0.5%) |
|
Eastlands |
149.1 |
68.2% |
7.0% |
148.9 |
61.8% |
6.1% |
6.5% |
1.0% |
|
Satellite Towns |
124.5 |
89.3% |
6.6% |
130.1 |
82.5% |
7.7% |
6.8% |
(1.0%) |
|
Grand Total |
178.9 |
83.7% |
9.4% |
185.3 |
80.3% |
9.6% |
3.4% |
(0.2%) |
|
· Kilimani, Ngong Road and Nairobi Eastlands recorded the largest increase in rental yields y/y of 1.5%, 1.4% and 1.0% points, respectively, attributable to increase in occupancy levels of 10.1%, 12.6% and 6.5% points, for Kilimani, Ngong Road and Nairobi Eastlands, respectively |
||||||||
Source: Cytonn Research
Other highlights from the sector is that the struggling retailer Uchumi closed its flagship Ngong Hypermat, along Ngong Road Nairobi, bringing in the total number of its operational branches to 5; (i) Langata Hypermat, along Langata Road Nairobi, (ii) Adams Arcade Branch, (iii) Jogoo Road Branch, (iv) Nairobi West Branch, and (v) Meru. Uchumi has been struggling with heavy debts and cash flows, which has resulted in delayed payment to its staff, suppliers and landlords, and thus, the closing down of some of its branches is part of its cost-cutting strategy.
- Hospitality
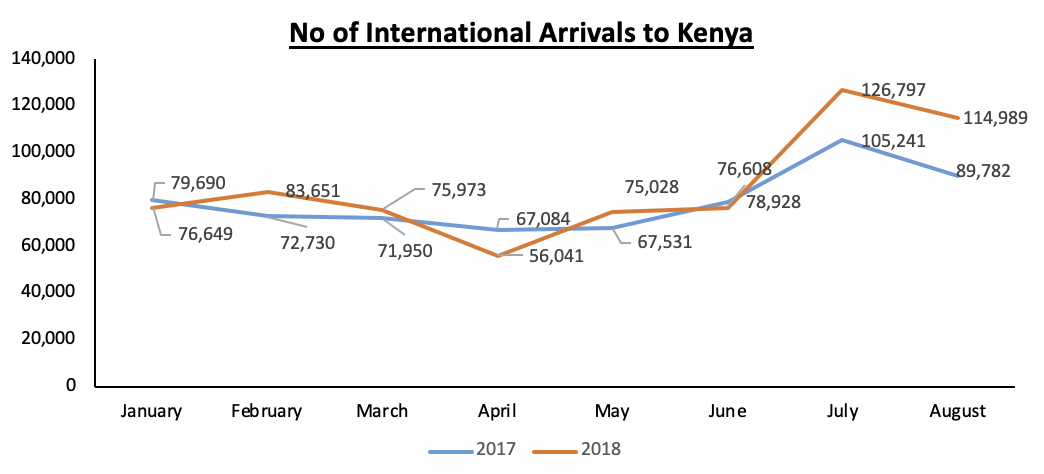
The African Development Bank (AfDB), the African Union Commission (AUC), and the World Economic Forum Global Agenda Council on Africa released the 2018 Africa Visa Openness Report, that measures how open African countries are when it comes to visas by looking at what they require from citizens from other countries in Africa when they travel. The report ranked Kenya at Position #9, up from Position #15 in 2017 and Position #16 in 2016, attributed to the country’s simple process for short term visas and open visa-on arrival policy for all Africans, which was announced by the Kenyan President on November 2017. The increased visa openness is expected to impact Kenya’s hospitality and tourism sector positively. The impact is being witnessed through an average 8.3% increase in international arrivals, through the Jomo Kenyatta International Airport (JKIA) and Moi International Airport (MIA) for the first 8-months of 2018, reaching 685,736 persons in comparison to the same period in 2017, which came in at 632,936 as shown below.
Source: Kenya National Bureau of Statistics
Also, during the week, five of Kenya’s beaches, namely Diani, Mombasa, Watamu, Chale Island and Shela were featured in the Top 50 African Beaches Category by FlightNetwork.com, an online travel publication. The publication ranked 400 of the world's top beaches with the help of 1,000 of the industry's leading travel professionals. The ranking will facilitate the performance of the hospitality sector in coastal region by attracting more tourists. We attribute this recognition to continued marketing efforts by the Kenya Tourism Board and enhanced security within the country. We therefore expect the hospitality sector to remain on its upward trajectory supported by increased international tourist arrivals and support from the government in the form of international marketing, increased entry of international hotel brands, and enhanced security within the country.
- Industrial Sector
During the week the Logistics firm Bwala Africa announced its plans to construct warehouses on a 5,000-acre land in Kitengela, Kajiado County. The move by the firm is informed by:
- Kenya’s high demand of warehouses at 23.7 mn SQFT, compared to supply at 6.9 mn SQFT according to Grit Real Estate Income Group, which indicates an existence of a market niche that requires to be filled,
- Increased focus by the government on manufacturing, with the sector being included among the governments Big Four Agenda of focus for the next 4-years,
- Improved infrastructure that has opened up areas such as Kitengela, Ruiru, and Athi River, as well as Kenyan Counties for development of industrial parks, and,
- Improved performance of the industrial sector recording a rental yield increase by 0.7% points from 5.4% as at 2017, to 6.1% in 2018, as a result of an 11.8% increase in occupancy levels driven by an increase in demand.
The warehouse will be set up in Kitengela, with areas along Mombasa Road recording an average rental yield of 6.6%, compared to market average at 6.1%, attributable to the nodes’ proximity to the airport and being the main route to Kenya’s main port and hence we expect the warehouse to perform in accordance to market trends. We retain a positive outlook for the industrial sector in Nairobi and expect the sector to continue witnessing increased investments.
- Statutory Reviews
The High Court in a landmark ruling held that Value Added Tax is not payable on transactions for the sale or purchase of land regardless of whether the buildings constructed on the land are residential or commercial. The decision was made following a case filed by David Ndegwa against the Kenya Revenue Authority (KRA) challenging the charge of VAT on the purchase of land with a commercial building. Justice Kasango declared that the charge of VAT on commercial land was in contravention of Clause 8 of Section B of the Value Added Tax Act, which exempted the sale, renting, leasing, hiring, and letting of land or residential premises from VAT. The Court relied on the constitutional definition of land which includes what is on the surface of land and in the air space above the land in determining that buildings are exempt from VAT.
This ruling shall be very beneficial for buyers of commercial buildings who shall no longer be subject to VAT and may lead to the loss of millions of shillings for KRA as buyers are likely to claim for a refund of VAT paid. This relief to the buyers may be short lived as KRA has filed an appeal against the ruling.
We expect continued increase in activities in the real estate sector driven by; i) positive demographics such as a high population growth rate of 2.6%, 1.4% point higher than global averages of 1.2%, and the relatively high urbanization rate in Kenya at 4.4% compared to the global average of 2.1%, necessitating the need for adequate housing in the urban areas, and ii) government initiatives such as focus on affordable housing and manufacturing, with the sectors being included among the governments Big Four Agenda for the next four years.
Last year, we released the Nairobi Metropolitan Area Hospitality Report 2017, which covered the performance of hotels and serviced apartments during that year. According to the report, the hospitality sector was temporarily affected by political tension during the electioneering period, and thus serviced apartments recorded 9.8% points decline in occupancy to an average of 72.0% in 2017, compared to 81.8% in 2016. Given the conclusion of the elections, the improved political environment in 2018 and increased marketing efforts by the Kenyan Government, we have seen an 8.3% growth in international arrivals into the country during the first 8-months of the year, and this is expected to positively impact on the hospitality sector. This week we therefore update our report findings on serviced apartments by covering the following;
- Overview of the Kenyan Hospitality Sector,
- Introduction to Serviced Apartments,
- What they are
- Factors driving the growth of serviced apartments
- Challenges facing serviced apartments
- Supply and distribution of serviced apartments in the Nairobi Metropolitan Area,
- Performance of Serviced Apartments in the Nairobi Metropolitan Area, and,
- Investment Recommendations and Conclusion.
- Overview of the Kenyan Hospitality Sector
Kenya’s hospitality sector has been on a recovery path since 2016, recording a growth of 13.3% from accommodation and food services in 2016, a 14.7% in 2017, 13.5% in Q1’2018, and 15.7% in Q2’2018, according to the Kenya National Bureau of Statistics (KNBS), up from the 5-year slump caused by insecurity challenges between 2011 and 2015. The sector has seen continued investment by both local and international players looking to provide 4 main products; a) accommodation, b) foods and beverages, c) meetings and conferencing space, and d) leisure and entertainment. As a result, we have seen an increase in development of hotels, serviced apartments and other accommodation facilities such as holiday homes, as investors race to meet the rising demand for hospitality services fueled mainly by the growth of business and travel tourism. According to KNBS, the number of international arrivals grew by 8.0%, from 1.3 mn in 2016 to 1.4 mn in 2017 and have grown by 8.3% between January and August 2018 to 685.7 mn, compared to 632.9 mn during the same period in 2017. Mirroring this growth, the total number of hotel bed nights grew by 11.3%, to 7.2 mn in 2017, from 6.4 mn in 2016.
In our view, the key factors driving the sector include:
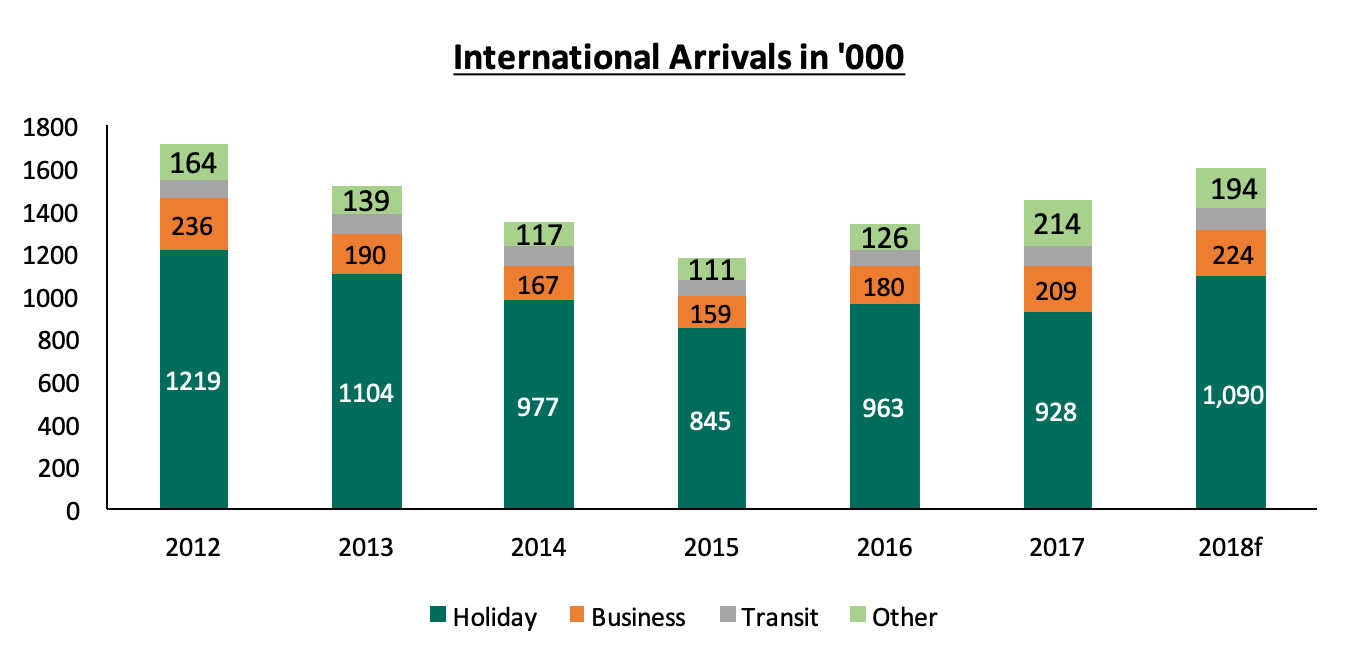
- Travel Tourism - Holiday travelers are the main drivers of Kenya’s hospitality sector, accounting for 70.5% of international arrivals over the last 5-years, attracted mostly by features such as wildlife, coastal beaches and natural sceneries. Between 2015 and 2016, holiday travelers increased by 14.0% to 0.9 mn, from 0.8 mn persons in 2015, as shown below, thus creating demand for accommodation and other hospitality services. Despite the 3.7% drop noted in 2017, mainly due to traveler wariness over the political tension in the country, holiday travelers remained to be most at 64.0% out of the total international arrivals.
Source: Kenya National Bureau of Statistics
- Meetings, Incentives, Conferences and Exhibitions Tourism (MICE) – MICE tourism has continued to drive the hospitality sector, evidenced by the 2.4% and 17.1% increase in local conferences and delegates, respectively, with 3,844 conferences in 2017, from 3,755 recorded in 2016, while the number of delegates came in at 623,749 in 2017, up from 536,674 in 2016, according to the KNBS Economic Survey 2018. This increase was attributed to political strategy activities held during the year. The number of international conferences and delegates declined by 15.9% and 36.8%, respectively, in 2017, with 191 conferences from 227 conferences held in 2016, while the number of delegates came in at 64,167 in 2017, up from 101,599 in 2016. The decline was attributed to the prolonged electioneering period in addition to travel advisories by some countries such as the United States. However, with the return of political calm in 2018, there has been increased conferencing with the hosting of international events such as the East Africa Property Investment Summit (EAPI) earlier in the year,
- Political Stability and Improved Security - The country has continued to enjoy political calm, following the completion of the prolonged electioneering period, and this has been evidenced by the number of international arrivals, which we expected to come in at 1.6 mn in 2018, compared to 1.4 mn in 2017,
- Recognition of Nairobi as a Regional Hub - This has put Kenya on the map as a business destination and is evidenced by the hosting of international events such as the East Africa Property Investment Summit (EAPI) in April this year, the Sustainable Blue Economy Conference in November, in addition to multinational companies setting up offices in the country. This has resulted in continued demand for short and mid-term accommodation, as evidenced by the number of business travelers, who accounted for 14.4% of international arrivals in Kenya in 2017, having grown by 16.3% to 0.21 mn in 2017 from 0.18 mn in 2016,
- Increased Air Connectivity - Airlines operating in Kenya continue to increase their flights frequency with the most recent ones being: i) Air France, which increased its flights from Paris-Nairobi from 3 per week to 5, ii) Jambo Jet, which increased its Nairobi-Kisumu flights from 20 to 24 per week, and iii) the introduction of direct flights from Kenya to the United States. This has enhanced convenience in travel thus boosting business and holiday travel, and consequently boosting the hospitality sector,
- Positive Reviews and Accolades - Positive reviews from travel advisories such as Trip Advisor. who ranked Nairobi as the 3rd best place to visit in 2018, the ranking of Jomo Kenyatta International Airport (JKIA) as the best airport in Africa and 38th globally according to Worldwide rankings by Airhelp, and issuance of global awards to local hotels for best facilities and service excellence such as DusitD2, a 5-star hotel in Riverside, Nairobi, being ranked the best luxury business hotel in East Africa in 2018, are likely to boost confidence and attract more guests into the country, both for business and holiday. In March this year, the Executive Residency by Best Western, a serviced apartments development in Riverside, was awarded the prize for Best Property 21 to 70 units improving recognition for the brand.
Despite the resilience of the sector, some of the setbacks include:
- Negative Publicity of Some Parts of Kenya - Despite improved security in Kenya and restoration of political calm following the end of the electioneering period, some parts of Kenya such as Mandera, Wajir, Lamu and Eastleigh in Nairobi continue to suffer negative publicity due to instances of terrorist attacks and this has continued to hamper tourism in these areas, and,
- Slow Infrastructural Development and Delays in the Completion of the Same - This continues to cripple the opening up of areas for development and access. For instance, the expansion of the JKIA runway. The Kshs 21.9 bn project, set to be financed by the African Development Bank (AfDB), has been put on hold by the Ministry of Transport as they re-evaluate its economic value. The project, which is yet to kick off, was intended to meet the needs of the increasing number of passengers passing through Kenya’s main airport and attract global airlines.
- Introduction to Serviced Apartments
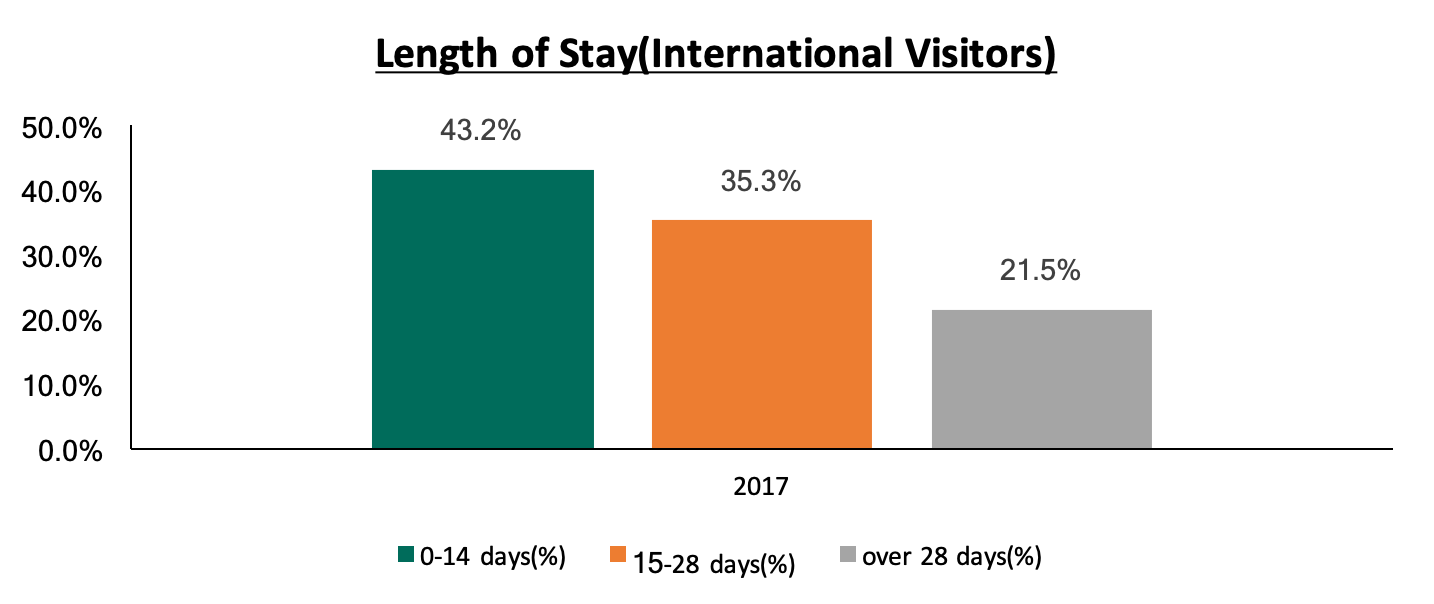
Over the past few years we have seen the growing popularity of serviced apartments as an alternative to hotel accommodation, especially for guests looking for an extended stay. These are fully furnished apartments that provide hotel-like resources such as housekeeping, room service, fitness centres, and restaurants. They have home comforts such as a personal kitchenette, a living room and a dining room. Serviced apartments, unlike hotel rooms, bear close resemblance to apartment-style living and are therefore preferred by guests who want a homely feel or who travel as families. Demand for serviced apartments has been on the rise and thus they record relatively high occupancy rates of above 70.0%, compared to hotels in Nairobi at 35.5%, according to Kenya National Bureau of Statistics Statistical Abstract 2018, and this we attribute to the large number of international guests who stay for more than 2-weeks in the country. According to the KNBS statistics, while 43.2% of international visitors in 2017 stayed for less than 14-days, 56.8% of the international guests to Kenya in 2017, stayed for at least 15-days.
The concept of serviced apartments has continued to become increasingly popular in the market, with the Nairobi Metropolitan Area having approximately 3,414 serviced apartments as at 2015, and an additional 1,174 set to be complete by 2020. In our view, investment in serviced apartments has been fueled by:
- The Higher Demand - As firms aim to optimize their travel budgets, more travelers are choosing to stay at serviced apartments as they are less expensive in the long-run, resulting in the high demand and thus high occupancy rates at above 70.0% in Nairobi,
- Lower Operating Expenses as Compared to Hotels - Operating serviced apartments requires less number of staff and lower ancillary costs for amenities and foodstuffs, and are thus cheaper to run compared to hotels,
- Convertibility - Serviced apartments can be easily converted to normal apartments, in the case where the former is not performing well, and,
- Relatively Longer Tenancy Compared to Hotels - The clientele for serviced apartments are mainly on long-term stays as compared to those who prefer hotel rooms, and thus the guarantee of a more stable income.
In addition to the growth in supply, the demand for serviced apartments has continued to increase evidenced by the 8.0% points increase in occupancy levels in 2018 to an average of 80.0%, from 72.0% in 2017, supported by benefits that come with the theme such as:
- Bigger Spaces Compared to Hotels - Serviced apartments often have bigger room sizes than hotels. For instance, in Nairobi, while the standard hotel room size is 30-50 SQM, the average size of serviced apartments is 75 SQM for 1-bedroom units, 110 SQM for 2-bedroom units, and 140 SQM for 3-bedroom units,
- Lower Rates - Serviced apartments are considered more affordable given their relatively lower charges compared to hotels. For instance, a standard 3-star hotel in Nairobi charges on average Kshs 14,000 per night for a suite, while a studio serviced apartments charges on average Kshs 8,000 per night and a 1-bedroom apartment charges on average Kshs 11,000 per night,
- Home Away from Home Feel - Unlike a hotel, a serviced apartment can easily accommodate a family, in addition to allowing someone to cook and hence creating the home away from home experience that is sought after by many long-term travelers, and,
- Easy Integration- Serviced apartments are located within or in close proximity to other residential developments, hence guests are able to integrate with the community.
Challenges facing Serviced Apartments
Despite the growing popularity of serviced apartments, the main challenge facing the theme is competition from well-known international hotel brands such as Movenpick, Kempinski and Park-Inn by Radisson that are preferred for accommodation by visitors given their track record on service excellence, whereas there is only one internationally branded serviced apartments development in Kenya, the Executive Residency by Best Western. Going forward, serviced apartments are also likely to compete with the growing Airbnb accommodation, which is found to be even more affordable and is increasingly attracting the millennial generation. Managers of serviced apartments will therefore have to set themselves apart through strategies such as hiring of professional personnel, providing extra amenities, and better security mechanisms compared to Airbnb.
Supply and Distribution of Serviced Apartments in the Nairobi Metropolitan Area
Nairobi’s hospitality sector has seen an increase in development of serviced apartments, with supply increasing with a 23.6% CAGR between 2011 and 2015 to 3,414 apartments from 1,462 apartments in 2011. In the last 2-years there has been completion of at least 86 additional units, including; The Executive Residency by Best Western, a 48-unit project in Westlands, and the 38-unit Gem Suites development also situated in Westlands, off Riverside Lane.
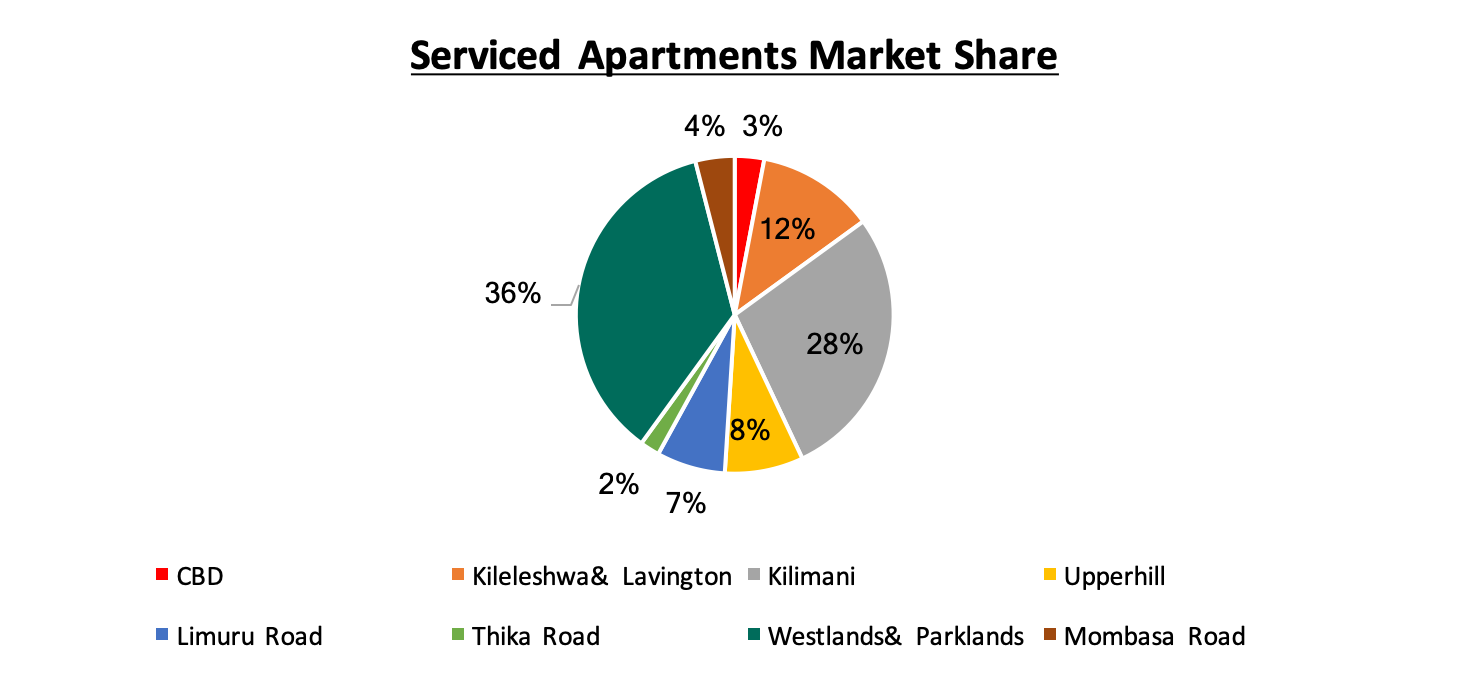
In terms of distribution in the Nairobi Metropolitan Area, Westlands and Kilimani have the highest supply of serviced apartments at 36.0% and 28.0%, respectively, of the total developments, attributed to their close proximity to commercial nodes and the expatriate community who constitute the majority of serviced apartments’ clientele. On the other hand, locations within the Thika Road node, namely Muthaiga North, Mirema and Garden Estate have the least supply, with a market share of only 2.0%, as they are predominantly residential areas located approximately 15-km Nairobi’s commercial zone, in addition to not being mapped within the UN Blue Zone, thus not preferred by expatriates.
Source: Cytonn Research
Currently, there are at least 1,189 apartments in the development pipeline set for completion by 2020, with most being constructed in Westlands and Kilimani. Important to note is that there is currently only 1 internationally branded serviced apartments development, the Executive Residency by Best Western, thus highlighting the opportunity for entry of more global brands.
Some of developments in the pipeline include:
|
Serviced Apartments Development Pipeline |
||||
|
Name |
Developer |
Location |
Number of Units |
Completion Year |
|
Skynest |
Elegant Properties |
Westlands |
250 |
2019 |
|
Britam |
Britam |
Kilimani |
163 |
2020 |
|
Habitat |
Ekco Investments |
Kilimani |
160 |
2020 |
|
Montave |
Green-Field |
Upperhill |
147 |
2020 |
|
Radisson Blu Residency |
Carlson Rezidor |
Kileleshwa |
123 |
2019 |
|
9 Oak |
Mifta Holdings |
Kilimani |
120 |
2019 |
|
Soho |
Soho |
Kilimani |
88 |
2019 |
|
Avic |
Avic |
Westlands |
50 |
2020 |
|
Elsie Ridge |
Intime Group |
Spring Valley |
40 |
2020 |
|
Ariana |
Trianum |
Westlands |
28 |
2019 |
|
Ole Sereni |
Ole sereni |
Mombasa Road |
20 |
2019 |
|
Hilton (Pinnacle Towers) |
Hass Petroleum |
Upperhill |
Undisclosed |
2020 |
|
Total |
1,189 |
|||
|
· There are approximately 1,189 serviced apartment units in the pipeline, set for completion by 2020, with majority of the expected supply being in Westlands and Kilimani |
||||
Source: Cytonn Research
- Performance of Serviced Apartments in the Nairobi Metropolitan Area
We tracked the performance of serviced apartments in 8 nodes in the Nairobi Metropolitan Area and compared this to the performance in 2017. The key metrics we looked at include:
- Charged Rates: This is the amount guests pay for an apartment in a specific market, on a daily basis, weekly and/or monthly. It informs potential investors on the rental income they are likely to gain from investing in serviced apartments,
- Occupancy Rates: This measures the number of apartments that are let out of the total available, in order to inform on the expected rental yield of the developments, and,
- Rental Yields: This refers to the measure of return on the real estate investment, from the rental income collected annually. The rental yield informs potential investors on the return they are likely to get from a property and hence the time it will take an investor to get back the money invested. To calculate this, we have estimated annual income from monthly revenues having deducted operational costs assumed to be at 40% of revenues. To estimate the investment value, we have calculated development cost per SQM by factoring in land costs based on the location, construction costs, equipping costs, professional fees and other development-related costs. The formula to calculate rental yield is as follows;
Rental Yield= Monthly Rent per SQM x Occupancy Rate x (1-40% operational cost) x 12 months
Development Cost per SQM
*Important to note, however, is that depending on the actual incurred land cost, plot ratios, the level of finishing and equipping, investors will generally incur varying costs.
In our analysis of the serviced apartments market performance in 2018, we will start by covering the performance by node, compare this with 2017 performance, then cover the performance by typology.
Serviced Apartments Performance by Node
From our research, in overall, serviced apartments recorded improved performance with the average rental yield coming in at 7.4%, which is 2.1% points higher than 5.3% recorded in 2017, and this we attribute to the increased demand, which has triggered an increase in charge rates, as well as increased occupancy rates with an average of 80.0% in 2018, compared to 72.0% in 2017. We attribute the improved performance to the stable political environment and improved security, making Nairobi an ideal destination for both business and holiday travelers.
In 2018, Kilimani area was the best performing node recording high occupancy rates of 86%, and a rental yield of 10.9%, and this we attribute to its easy access from Jomo Kenyatta International Airport (JKIA), proximity to business nodes such as Westlands and Upperhill, and the good transport network thus ease of accessibility. Developments in the Thika Road node (Muthaiga North, Mirema and Garden Estate) recorded the lowest rental yield at 4.4%, and this we attribute to its unpopularity, given the distance from main commercial zones, the lack of modern and quality serviced apartments, in addition to not being mapped within the UN Blue Zone, thus not attractive to expatriates due to security concerns.
(all values in Kshs unless stated otherwise)
|
2018 Serviced Apartments Performance |
||||||||||||
|
|
Sizes(SQM) |
Monthly Rates 2018 |
||||||||||
|
Node |
Studio |
1-Bed |
2-Bed |
3-Bed |
Studio |
1-Bed |
2-Bed |
3-Bed |
Occupancy 2018 |
Monthly Charge per SM |
Devt Cost per SM |
Rental Yield |
|
Kilimani |
39 |
69 |
110 |
149 |
197,850 |
266,915 |
319,304 |
361,421 |
86% |
3,567 |
202,662 |
10.9% |
|
Westlands& Parklands |
33 |
85 |
115 |
177 |
282,938 |
260,928 |
300,492 |
340,000 |
76% |
4,044 |
209,902 |
10.6% |
|
Limuru Road |
51 |
137 |
107,438 |
193,621 |
84% |
3,685 |
231,715 |
9.7% |
||||
|
Kileleshwa& Lavington |
38 |
70 |
134 |
100,000 |
231,000 |
285,750 |
337,000 |
83% |
2,686 |
206,132 |
7.8% |
|
|
Nairobi CBD |
51 |
90 |
115 |
137 |
120,000 |
199,500 |
294,917 |
320,000 |
74% |
2,374 |
224,571 |
5.7% |
|
Upperhill |
75 |
110 |
156 |
274,680 |
300,492 |
310,000 |
60% |
2,580 |
209,902 |
5.3% |
||
|
Msa Road |
34 |
90 |
107 |
151 |
114,912 |
120,000 |
201,096 |
258,552 |
85% |
1,642 |
200,757 |
5.0% |
|
Thika Road |
70 |
100 |
144 |
100,646 |
128,375 |
90% |
1,361 |
200,757 |
4.4% |
|||
|
Average |
39 |
75 |
116 |
152 |
153,856 |
205,911 |
261,489 |
321,162 |
80% |
2,742 |
210,800 |
7.4% |
|
High |
51 |
90 |
137 |
177 |
282,938 |
274,680 |
319,304 |
361,421 |
90% |
4,044 |
231,715 |
10.9% |
|
Low |
33 |
51.11 |
100 |
137 |
100,000 |
100,646 |
128,375 |
258,552 |
60% |
1,361 |
200,757 |
4.4% |
|
· Serviced apartments recorded an 80% occupancy rate in 2018, compared to 72% recorded in 2017, and this we attribute to the improved security and political stability · Kilimani recorded the highest rental yields at 10.9%, and this we attribute to increased demand for accommodation in the area, supported by the proximity to key amenities such as the Jomo Kenyatta International Airport, the Nairobi CBD and business nodes such as Westlands and Upperhill, and the good transport network thus ease of accessibility · Thika Road node (Muthaiga North, Mirema and Garden Estate) recorded the lowest rental yield at 4.4%, and this we attribute to its unpopularity, given the distance from main commercial zones, the lack of modern and quality serviced apartments, in addition to not being mapped within the UN Blue Zone thus not attractive to expatriates due to security concerns |
||||||||||||
Source: Cytonn Research
2017/2018 Comparative Analysis
Compared to 2017, serviced apartments performed better in 2018, with the rental yields coming at 7.4%, compared to 5.3% in 2017, in addition to 8.0% points increase in occupancy rates to 80.0% in 2018, from 72.0% in 2017, and this is attributable to a better political climate in 2018, resulting in increased international arrivals thus higher demand for accommodation.
All values in Kshs unless stated otherwise
|
2017/2018 Comparative Analysis |
||||||||||
|
Node |
Occupancy 2017 |
Occupancy 2018 |
Occupancy rates ∆ |
Monthly Charge per SQM 2017 |
Monthly Charge per SM 2018 |
∆ in Monthly Charge Per SQM |
Devt Cost per SM |
Rental Yield 2017 |
Rental Yield 2018 |
∆ in Rental Yield |
|
Kilimani |
74% |
86% |
12% |
2,592 |
3,567 |
37.6% |
202,662 |
7.2% |
10.9% |
3.7% |
|
Westlands& Parklands |
78% |
76% |
(1%) |
2,519 |
4,044 |
60.6% |
209,902 |
7.3% |
10.6% |
3.3% |
|
Limuru Road |
80% |
84% |
4% |
1,686 |
3,685 |
118.6% |
231,715 |
4.5% |
9.7% |
5.2% |
|
Kileleshwa& Lavington |
70% |
83% |
13% |
2,369 |
2,686 |
13.4% |
206,132 |
7.0% |
7.8% |
0.8% |
|
Nairobi CBD |
70% |
74% |
4% |
1,684 |
2,374 |
40.9% |
224,571 |
4.2% |
5.7% |
1.5% |
|
Upperhill |
60% |
2,333 |
2,580 |
10.6% |
209,902 |
6.6% |
5.3% |
-1.3% |
||
|
Msa Road |
64% |
85% |
21% |
1,367 |
1,642 |
20.1% |
200,757 |
3.1% |
5.0% |
1.9% |
|
Thika Road |
69% |
90% |
21% |
901 |
1,361 |
51.0% |
200,757 |
2.6% |
4.4% |
1.8% |
|
Average |
72% |
80% |
11% |
1,931 |
2,742 |
44.1% |
210,800 |
5.3% |
7.4% |
2.1% |
|
High |
80% |
86% |
6% |
2,592 |
4,044 |
231,715 |
7.3% |
10.9% |
5.2% |
|
|
Low |
64% |
60% |
-4% |
1,367 |
1,642 |
200,757 |
3.1% |
5.0% |
-1.3% |
|
|
· In 2018, the rental yields increased by 2.1% points to 7.4% from 5.3% recorded in 2017, and this we attribute to the political stability, increased popularity of the serviced apartments concept, thus an increase in the occupancy · The monthly charges recorded a 44.1% increase to Kshs 2,742 per SQM from Kshs 1,931 per SQM in 2017, and this we attribute to the increased popularity of serviced apartments evidenced by the significant increase in occupancies by 8.0% points to 80.0% in 2018, from 72.0% in 2017 |
||||||||||
Source: Cytonn Research
Performance Per Typology
We also compared the performance of the different typologies offered in the market, and from our research, studios recorded the highest monthly charges at Kshs 3,965 per SQM, thus a resultant relatively high yield of 13.5%, while 3-bedroom units recorded the lowest at Kshs 2,109 per SQM and an average rental yield of 7.2%. In terms of occupancy, the studio recorded the highest occupancy rates of 82.0%, and this we attribute to the low supply of the typology in the market.
|
Serviced Apartments Performance Per Typology - 2018 |
||||
|
Typology |
Average Size (SQM) |
Monthly Charges per SQM (Kshs) |
Occupancy |
Rental Yield |
|
Studio |
39 |
3,965 |
82% |
13.5% |
|
1-bedroom |
75 |
2,745 |
79% |
9.4% |
|
2-bedroom |
116 |
2,253 |
73% |
7.7% |
|
3-bedroom |
152 |
2,109 |
66% |
7.2% |
|
Average |
2,768 |
75% |
9.5% |
|
|
· Studios recorded the highest rental yield at 13.5%, and this we attribute to the relatively high monthly charges per SQM compared to other typologies · The studio recorded the highest occupancy rates of 82.0%, and this we attribute to the low supply of the typology in the market. |
||||
Source: Cytonn Research
- Recommendations and Conclusion
|
Measure |
Sentiment |
Outlook |
|
Serviced Apartments Performance |
Serviced apartments recorded relatively high occupancy at 80.0% in 2018, 8.0% points increase from 72.0% recorded in 2017. Given the growing popularity of the concept, and recovery following the end of the prolonged electioneering period that spilled over to H1’ 2018, we expect the theme to continue recording improved performance going forward |
Positive |
|
Supply |
There were approximately 3,414 serviced apartment units in Nairobi as at 2015 with an additional 1,189 apartments set for completion by 2020, thus increased competition especially in areas such as Westlands and Kilimani which have the majority of the units in the pipeline |
Negative |
|
International Tourism |
International arrivals grew by 8.0% in 2017 and is expected to increase by 10.8% in 2018 given improved security, increased air connectivity, the increased marketing efforts by the government and the industry players and the introduction of free visa on arrival policy for all Africans |
Positive |
|
MICE Tourism |
MICE tourism has been on an upward trajectory, with the number of conferences recording a 1.3% increase from 3,982 conferences (both local and international) in 2016, to 4,035 conferences recorded in 2017. However, with the return of political calm in 2018, there has been increased conferencing with the hosting of international events such as the East Africa Property Investment Summit (EAPI) earlier in the year, and several others expected in 2019 thus we expect continued growth of the MICE tourism |
Positive |
Based on the above metrics, we had 3 positive factors and only 1 negative factor, thus our overall outlook for the serviced apartments theme is positive, with the investment opportunity lying in Kilimani and Westlands, which are the best performing areas with average rental yields of above 10.0%.
Disclaimer: The Cytonn Weekly is a market commentary published by Cytonn Asset Managers Limited, “CAML”, CAML is regulated by the Capital Markets Authority. However, the views expressed in this publication are those of the writers where particulars are not warranted. This publication, which is in compliance with Section 2 of the Capital Markets Authority Act Cap 485A, is meant for general information only and is not a warranty, representation, advice or solicitation of any nature. Readers are advised in all circumstances to seek the advice of a registered investment advisor.

- Talk to us
- Kenya
- P.O Box 20695 - 00200, Nairobi, Kenya
- Cell +254709101200
- Tel +254709101200
- WhatsApp +254741676635
- United States
- +254709101200
- DOWNLOAD OUR APP
-


- Kenya
- 8th Floor, Pinetree Plaza, Kaburu Drive, Ngong Road, Nairobi, Kenya
- USA
- Suite 1150, 1775 Eye Street NW, USA, Washington DC 20006, USA
- Investments
- High Yield
- Private Equity
- Real Estate
- Real Estate
- RiverRun Estates
- Cytonn Towers
- The Ridge
- Taraji Heights
- The Alma