Why Stock Indices Performance Differ; A Case Study of NASI vs NSE 20, & Cytonn Weekly 04/2018
By Cytonn Research Team, Jan 28, 2018
Executive Summary
Fixed Income
Treasury bills were oversubscribed during the week, with the overall subscription rate coming in at 116.8%, compared to 79.9% recorded the previous week. Yields on the 91 and 182-day papers remained unchanged at 8.0% and 10.6%, respectively, while yield on the 364-day paper rose to 11.2%, from 11.1% the previous week. We are projecting the inflation rate for the month of January to rise to a range of between 4.9% - 5.2%, from 4.5% in December, driven by an increase in food prices as government subsidy on maize flour ended at the end of December 2017;
Equities
During the week, the equities market recorded mixed performance, with NASI and NSE 25 gaining 0.8% and 0.3%, respectively, while NSE 20 lost 0.2%, taking their YTD performance to 6.1%, 5.4% and 0.4% for NASI, NSE 25 and NSE 20, respectively. Kenya telecommunication firms, Airtel and Safaricom, begun the trials for mobile money interoperability, which will allow cross network money transfers, a move which is expected to be part of the solution to the concerns raised over Safaricom’s dominance;
Private Equity
Kuramo Capital, a New-York based private equity firm, has completed a transaction to acquire a minority stake in Kenyan investment bank Sterling Capital for an undisclosed amount. The acquisition follows the reinstatement of Sterling’s investment banking license in October 2017, after it was downgraded to stockbroker level in 2011, after it failed to meet CMA’s revised minimum capital limit for market players;
Real Estate
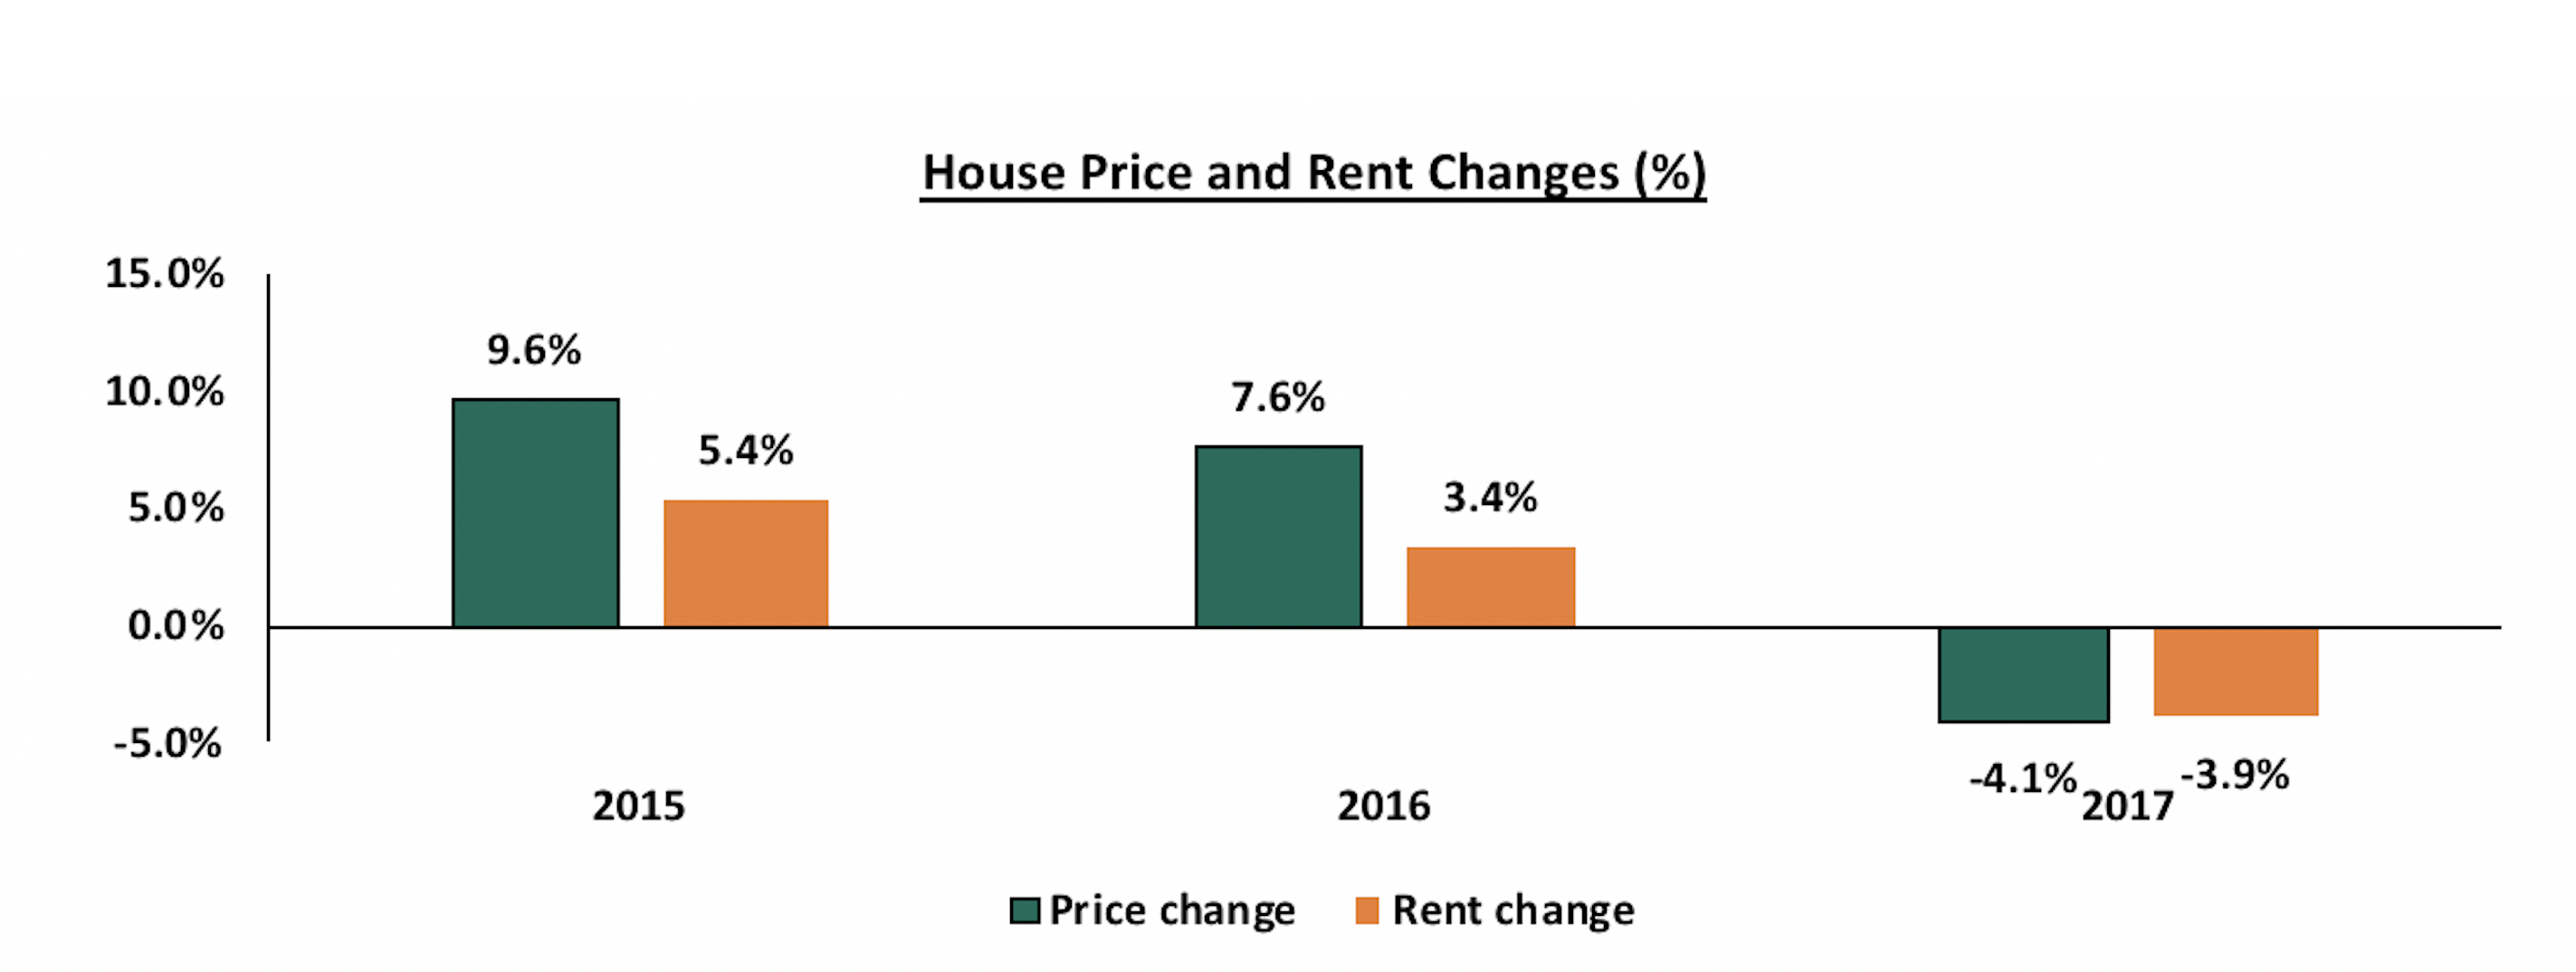
During the week, Hass Consult released their Q4’2017 report on land and house prices, highlighting that performance in 2017 slowed down, with asking prices for residential property sales declining by 4.1% y/y in 2017 despite the 1.0% q/q increases, while asking rents declined by 3.9% y/y and 1.2% q/q. In the retail sector, some players continue to perform well, with Carrefour benefiting from the problems faced by the others as they saw high sales with revenues at Kshs 1.5 bn in the first seven-months of operations in Kenya.
Focus of the Week
There has been mixed performances by the two indices that are largely used to measure the market performance of the Kenyan stock market, that is, NSE 20 and NASI. In 2017, NASI had a return of 28.4%, bringing it closer to its most recent peak of 177.5 recorded on 25th February 2015, while NSE 20 index returned 16.5% over the same period. In this write-up, we seek to determine the cause of such a discrepancy between the indices that track the performance of the same market by looking at the composition and calculation methodology for each index. We conclude by indicating which index is a better representation of the investable market, and hence a suitable portfolio benchmark for investors and portfolio managers to use in performance evaluation.
- On Saturday, 28th January 2018, part of our team visited Christ Chapel Children’s Home in Huruma, a non-profit making organization initiated in 2002 to offer an institution for holistic child development. The Cytonn team engaged children under the home in team building activities that included playing games and group discussions, and later donated foodstuffs and books to the children. See event note here
- Our Senior Manager, Regional Markets, Johnson Denge, discussed the operating environment in 2017 and its effect on real estate, as well as the opportunities in the property market in 2018. Watch Johnson on Citizen TV here
- The Q4’2017 Sharp Cents, a quarterly publication by Cytonn Investments is now available. You can download the online version here
- We recently launched a technology driven newsletter, which showcases Cytonn Technologies products and achievements. You can download the Newsletter here
- We continue to hold weekly workshops and site visits on how to build wealth through real estate investments. The weekly workshops and site visits target both investors looking to invest in real estate directly and those interested in high yield investment products to familiarize themselves with how we support our high yields. Watch progress videos and pictures of The Alma, Amara Ridge, The Ridge, and Taraji Heights. Key to note is that our cost of capital is priced off the loan markets, where all-in pricing ranges from 16.0% to 20.0% and our yield on real estate developments ranges from 23.0% to 25.0%, hence our top-line gross spread is about 6.0%. If interested in attending the site visits, kindly register here
- We continue to see very strong interest in our weekly Private Wealth Management Training (largely covering financial planning and structured products). The training is at no cost and is open only to pre-screened participants. We also continue to see institutions and investment groups interested in the trainings for their teams. The Wealth Management Trainings are run by the Cytonn Foundation under its financial literacy pillar. If interested in our Private Wealth Management Training for your employees or investment group please get in touch with us through clientservices@cytonn.comor book through this link Wealth Management Training. To view the Wealth Management Training topics, click here
- For recent news about the company, see our news section here
- We have 10 investment-ready projects, offering attractive development and buyer targeted returns of around 23.0% to 25.0% p.a. See further details here: Summary of Investment-Ready Projects
- To invest in any of our current or upcoming real estate projects, please visit Cytonn Real Estate:
- Cytonn Towers, where we are only selling residential units in the first phase of residential apartments, is currently about 20.0% sold. See Cytonn Towers
- The Alma phase one which is 55.0% sold. See The Alma
- Amara Ridge has currently 100.0% uptake. See Amara Ridge
- Situ Village is currently 22.0% sold. See Situ Village
- The Ridge (Phase 1) is currently 31.0% sold. See The Ridge
- Taraji Heights is currently 14.0% sold. See Taraji Heights
- RiverRun Estates (Phase 1) is currently 11.0% sold. See RiverRun Estates
- With over 10 investment ready projects worth over Kshs 82.0 billon of project value, we shall be very selective on new real estate projects going forward, only focusing on Joint Ventures and real estate opportunities with deep value. We are increasingly focused on private equity deals. Should you have any deals in banking, insurance, education, hospitality and technology sectors, kindly email a teaser to PE@cytonn.com.
- Cytonn Education Services, Cytonn’s affiliate for making investments into the education sector, is looking for locations to set a Technical College, under the brand name Cytonn Technical College. We are therefore looking for a stand-alone unit in Nairobi that sits on at least 1 to 2-acres of land and is accessible via public means available for let to host the Technical College. Incase you have any information regarding a unit that fits the above description you can reach us at rdo@cytonn.com or call us on 0709-101000.
- We continue to beef up the team with ongoing hires for a Senior IT Engineer, and Lecturers - Cytonn Technical College, among others. Visit our website Careers at Cytonn to apply.
Treasury bills were oversubscribed during the week, with the overall subscription rate coming in at 116.8%, compared to 79.9% recorded the previous week. The subscription rates for the 91, 182 and 364-day papers came in at 99.6%, 138.1%, and 102.4% compared to 42.4%, 99.4%, and 75.4%, respectively, the previous week. Yields on the 91 and 182-day papers remained unchanged at 8.0% and 10.6%, respectively, while the yield on the 364-day paper rose to 11.2% from 11.1%, the previous week. The overall acceptance rate rose to 91.5% compared to 84.9%, the previous week, with the government accepting a total of Kshs 25.6 bn of the Kshs 28.0 bn worth of bids received, against the Kshs 24.0 bn on offer. The government is still behind its domestic borrowing target for the current fiscal year, having borrowed Kshs 135.1 bn, against a target of Kshs 236.7 bn (assuming a pro-rated borrowing target throughout the financial year of Kshs 410.2 bn). If the domestic borrowing target is revised downwards to Kshs 293.8 bn as per the 2018 Budget Policy Statement (BPS), the pro-rated target comes in at Kshs 169.5 bn, meaning the government will still be behind on its borrowing target but marginally. The move to cut domestic borrowing could be aimed at reducing pressure on interest rates from investors in the domestic market who are bidding for higher yields, and instead increase borrowing from the foreign market. The usage of the Central Bank overdraft facility remains high as it stands at Kshs 47.0 bn compared to a nil overdraft at the beginning of this fiscal year.
The average interbank rate rose to 6.6% from 6.1% recorded the previous week, while the average volumes traded in the interbank market rose by 31.2% to Kshs 15.0 bn from Kshs 11.5 bn the previous week, indicating uneven distribution of liquidity in the market.
Last week, the Kenyan Government issued a 15-year amortized Infrastructure Bond (IFB 1/2018/15), with an effective tenor of 13.0 years, and a coupon of 12.5%, in a bid to raise Kshs 40.0 bn to fund infrastructural projects in the current fiscal year. The overall subscription rate for the bond issue came in at 139.4%, with the market average bid rate coming in at 13.0%, way above the average accepted rate of 12.5%. This indicates that the government continues to reject expensive bids in the auction market in order to maintain a low-levelled interest rate environment. The government accepted only Kshs 5.0 bn out of the Kshs 55.8 bn worth of bids received, translating to an acceptance rate of 9.0%. In our view, the rates have been kept artificially low by the government through their rejection of bids they deem expensive, despite pressure from investors who are demanding higher rates, and thus rates on government papers could be misleading in reflecting the accurate risk-free rate for the Kenyan economy.
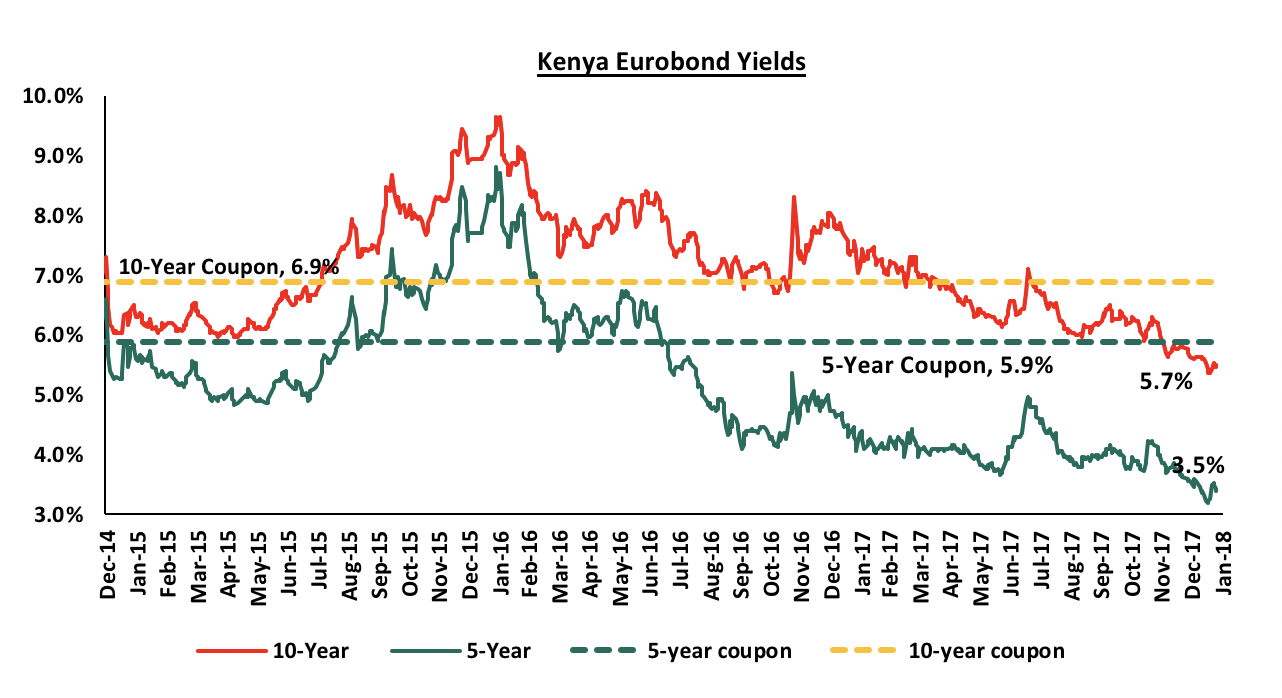
According to Bloomberg, yield on the 5-year Eurobond remained unchanged while yield on the 10-year Eurobond rose by 20 bps to close at 5.7% from 5.5%, respectively, the previous week. Since the mid-January 2016 peak, yields on the Kenya Eurobonds have declined by 5.3% points and 4.1% points for the 5-year and 10-year Eurobonds, respectively, due to the relatively stable macroeconomic conditions in the country. The declining Eurobond yields and stable rating by Standard & Poor (S&P) are indications that Kenya’s macro-economic environment remains stable and hence an attractive investment destination. However, concerns from Moody’s and the International Monetary Fund (IMF) around Kenya’s rising debt to GDP levels may see Kenya receive a downgraded sovereign credit rating if high debt levels persist.
The Kenya Shilling appreciated by 0.6% against the US Dollar during the week to a 1-year high of Kshs 102.3, from Kshs 102.9 the previous week, due to continued global weakening of the US Dollar. In our view, the shilling should remain relatively stable against the dollar in the short term, supported by:
- The calm political environment following the conclusion of the presidential elections,
- Weakening of the USD in the global markets as indicated by the US Dollar Index, which shed 9.9% in 2017, and has already lost 3.3% YTD thus hitting a 3-year low, and,
- CBK’s intervention activities, as they have sufficient forex reserves, currently at USD 7.0 bn (equivalent to 4.7 months of import cover). Of note is that the forex reserves have been on a slight declining trend.
We are projecting the inflation rate for the month of January to rise to a range of between 4.9% - 5.2%, from 4.5% in December, mainly due to (i) an increase in food prices as government subsidy on maize flour ended in December 2017, (ii) an increase in fuel prices, which rose 3.7% m/m due to higher import prices for petroleum products, as global oil prices rose 5.5% to USD 70.5 per barrel during the month, and (iii) an increase in electricity prices, owing to an increase in the forex levy charge by 20.7% m/m in January. In addition, global oil prices are expected to rise due to a supply cap enforced by the Oil Producing and Export Countries (OPEC), which will lead to increased cost of transport and electricity production implying higher cost of living for Kenyan households. We expect inflation to average 7.5% over the course of the year down from 8.0% in 2017, which is within the government target range of 2.5% - 7.5%.
The Monetary Policy Committee (MPC) met this week, on Monday 22nd January 2018, to review the prevailing macroeconomic conditions and give direction on the Central Bank Rate (CBR). The MPC maintained the CBR at 10.0%, which was in line with our expectations as per our MPC Note. The Committee indicated that the decision was on the back of a relatively stable macroeconomic environment, given:
- Decrease in inflation to 4.5% in December, from 4.7% in November, primarily due to reduced food prices, which offset the increases in fuel and electricity prices,
- The foreign exchange market remained relatively stable supported by resilient tea and horticultural exports, diaspora remittances, and strong recovery in tourism,
- Sufficient foreign reserves at USD 7.0 bn, translating to 4.7 months of import cover, with a standby facility of USD 1.5 bn from the IMF, which provides an adequate buffer for short term pressure on the shilling, and,
- A resilient banking sector, with the average commercial banks liquidity ratio and capital adequacy ratio at 43.7% and 18.5%, against statutory limits of 20.0% and 14.5%, respectively, as at December 2017, with the gross NPL ratio unchanged at 10.6% from October.
See the CBK release.
Key to note is that private sector credit growth improved marginally to 2.4% in December, from 2.0% in October; however, this remains way below the government set annual target of 18.3%.
The National Treasury released the 2018 Budget Policy Statement (BPS) for comments from the relevant stakeholders before presentation to the Cabinet and the Parliament. The BPS sets out the broad strategic priorities and policy goals that will guide the National Government and the County Governments in preparing their budgets both for the following financial year and over the medium term, while also highlighting some changes in the current fiscal year budget. Key take-outs from the BPS include:
- The Treasury expects the current account deficit, which stood at 7.0% in Q3’2017 to narrow to 6.5% of the GDP by December 2017 as bulk of the Standard Gauge Railway (SGR) related imports are complete, while favourable weather conditions are expected to support food production and agricultural exports,
- Medium term economic growth is expected to come in at 7.0% supported by (i) increase in the share of manufacturing sector to GDP to 15.0% by 2022 from the current 8.9%, (ii) improvement in food security through enhanced agricultural production, (iii) expansion of universal health coverage, and (iv) delivery of at least 500,000 affordable housing units,
- Net foreign borrowing target is set to increase by 16.6% to Kshs 323.2 bn from Kshs 277.3 bn as per the budget, while net domestic borrowing is set to decrease by 28.4% to Kshs 293.8 bn from Kshs 410.2 bn that Cabinet approved in 2017. As indicated earlier, the move to cut domestic borrowing could be aimed at reducing pressure on interest rates from investors in the domestic market who are bidding for higher yields, and instead increase borrowing from the foreign market,
- The overall fiscal deficit is projected to decline from 8.9% of GDP in FY 2016/17 to 7.2% of GDP in FY 2017/18, 6.0% in FY 2018/19 and further to 3.0% of GDP by FY 2021/22 driven by the projected completion of key infrastructural projects being implemented by the Kenyan Government, enhanced revenue collection, and prudent public spending.
The BPS, if approved, will set a good step towards fiscal policy streamlining and ensuring that the budget is in line with the government goals for the fiscal year and thus supporting economic growth. The government needs to focus on fiscal discipline, as there is still a lot of criticism on the rising debt levels from the key global and regional institutions. The move to cut domestic borrowing is welcome, and could be aimed at reducing pressure on interest rates, however, the increase in foreign borrowing increases the country’s exposure to global risks. This comes as the Central Bank of Kenya (CBK) issued their economic growth projections for Kenya, underlining that they expect the economy to expand by 6.2% in 2018, on the back of positive fiscal policy, review of the interest cap legislation, strengthening of the banking sector, and an improvement in the ease of doing business. However, CBK has warned the National Treasury on the rising levels of debt as they are unsustainable and could have an adverse impact on economic growth. We shall be releasing our macroeconomic outlook report for Kenya highlighting our expectations for the year on 4th February, 2018.
Rates in the fixed income market have remained stable, and we expect this to continue in the short-term as the government rejects expensive bids despite being behind their borrowing target. However, a budget deficit that is likely to result from depressed revenue collection creates uncertainty in the interest rate environment as any additional borrowing in the domestic market to plug the deficit could lead to an upward pressure on interest rates. Consequently, our view is that investors should be biased towards short- term fixed income instruments to reduce duration risk.
During the week, the equities market recorded mixed performance, with NASI and NSE 25 gaining 0.8% and 0.3%, respectively, while NSE 20 lost 0.2%, taking their YTD performance to 6.1%, 5.4% and 0.4% for NASI, NSE 25 and NSE 20, respectively. For the last 12-months, NASI, NSE 25 and NSE 20 have gained 48.4%, 42.8% and 32.0%, respectively. This week’s performance was mainly driven by gains in Safaricom, which gained 1.7%, but was weighed down by losses in large cap banking stocks such as KCB Group, Co-operative Bank and Equity Group, which lost 3.3%, 1.5% and 1.1%, respectively. Since the February 2015 peak, the market has gained 2.4% for NASI and lost 32.2% for NSE 20.
Equities turnover decreased by 48.5% to USD 40.6 mn from USD 78.9 mn the previous week. Foreign investors turned net sellers with a net outflow of USD 7.6 mn compared to a net inflow of USD 1.9 mn recorded the previous week. We expect the market to remain supported by improved investor sentiment this year, as investors take advantage of the attractive stock valuations in some of the stocks.
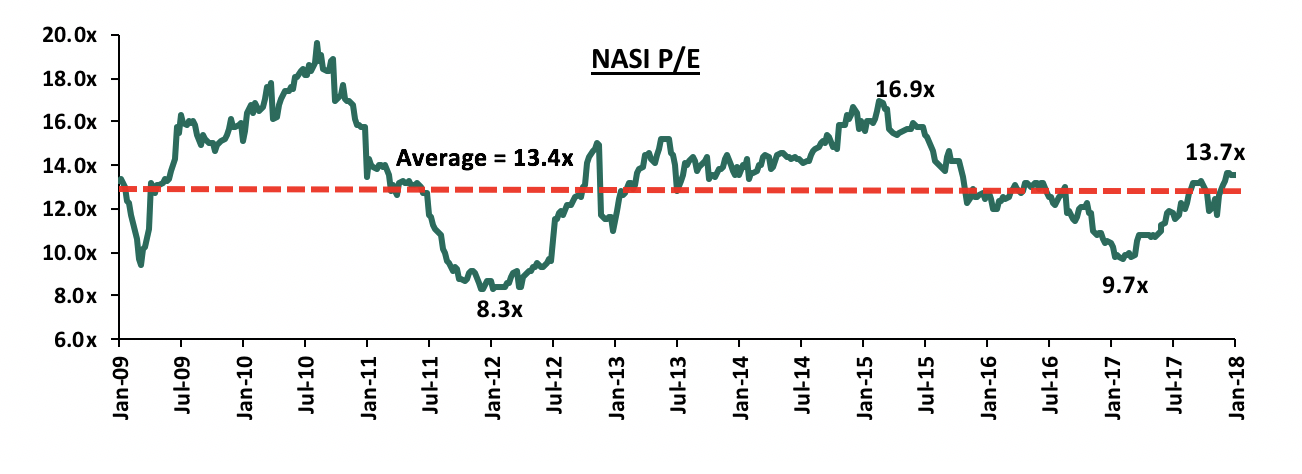
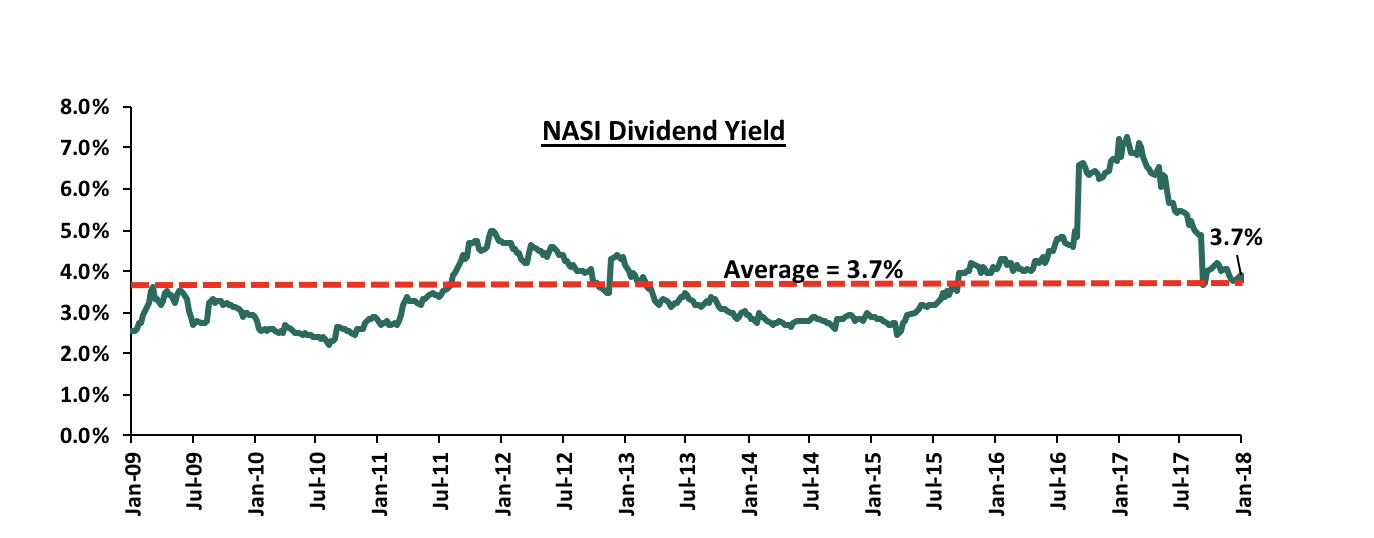
The market is currently trading at a price to earnings ratio (P/E) of 13.7x, which is 1.8% above the historical average of 13.4x, and a dividend yield of 3.7%, same as the historical average of 3.7%. The current P/E valuation of 13.7x is 40.7% above the most recent trough valuation of 9.7x experienced in the first week of February 2017, and 64.3% above the previous trough valuation of 8.3x experienced in December 2011. In our view, there still exists pockets of value in the market, with the current P/E valuation being 19.3% below the most recent peak of 16.9x in February 2015. The charts below indicate the historical P/E and dividend yields of the market.
The Central Bank of Kenya (CBK) has renewed its push for a repeal of the law on interest rate capping, which it says is having a negative effect on the economy. This is evidenced by a declining private sector credit growth, which declined to an 8-year low of 1.4% in July 2017, attributable to the fact that banks preferred not to lend to consumers or businesses but invest in risk-free treasuries, which offer better returns on a risk-adjusted basis. CBK had expressed interest to have this law reversed and go back to a regime where interest rates are freely determined, but in a disciplined commercial banking environment. However, given that CBK has in the past failed in ensuring that there is discipline in the market, it would be unwise to expect banks to voluntarily become disciplined. We therefore maintain our view that a reversal of the rate caps regime should be accompanied with specific actions around consumer protection and improved competition to ensure banks remain disciplined in pricing of loans. This can be done by (i) establishment of a strong consumer protection agency to specifically develop and enforce a consumer protection framework for the financial services sector, (ii) establishment of a specialized tribunal that shall specifically handle consumer financial services matters and complaints, and (iii) development of capital markets and alternative sources of funding to bring down business funding dominance by banks in Kenya, in order to spur private sector credit growth. In a normal developed economy, 40% of business funding comes from the banking sector, with 60% coming from non-bank institutional funding. In Kenya, 95% of all business funding comes from bank funding, and only 5% from non-bank institutional funding, showing that the economy is over reliant on bank lending and should have more alternative and capital markets products funding businesses. This was highlighted in our Cytonn Weekly #02/2018.
During the week, Kenyan telecommunication firms, Airtel and Safaricom, begun trials for mobile money interoperability, which allows for cross network money transfers. Lack of interoperability has been highlighted as a major barrier to the development of the mobile money market and thus this move is expected to be part of the solution to concerns over Safaricom’s dominance. During the period ending September 2017, M-Pesa dominated the mobile money transfer service, where it commanded the largest market share of 80.8% followed by Equitel Money, which posted a market share of 6.8%. Mobikash, Airtel Money and Mobipay posted market shares of 6.3%, 5.8% and 0.3%, respectively. Interoperability will increase convenience for customers as well as improve access and efficiency in the industry, as it will boost competitiveness among the Telcos. We view this as a positive move as it will transform the mobile money transfer process, given that the consumers will be able to send and receive money across all networks, seamlessly. It will also contribute to the growth of the market as industry providers will be more competitive by paying keen attention to significant determinants for their success such as quality of service, agent quality and liquidity.
Below is our Equities Universe of Coverage:
|
all prices in Kshs unless stated otherwise |
|||||||||||
|
No. |
Company |
Price as at 19/01/18 |
Price as at 26/01/18 |
w/w Change |
YTD Change |
Target Price* |
Dividend Yield |
Upside/ (Downside)** |
|||
|
1. |
NIC*** |
37.0 |
36.0 |
(2.7%) |
6.7% |
61.4 |
3.5% |
74.1% |
|||
|
2. |
KCB Group |
45.3 |
43.8 |
(3.3%) |
2.3% |
59.7 |
6.8% |
43.2% |
|||
|
3. |
DTBK |
200.0 |
202.0 |
1.0% |
5.2% |
281.7 |
1.4% |
40.8% |
|||
|
4. |
I&M Holdings |
116.0 |
116.0 |
0.0% |
(8.7%) |
150.4 |
2.5% |
32.2% |
|||
|
5. |
Barclays |
10.8 |
10.5 |
(2.8%) |
9.4% |
12.8 |
10.2% |
32.1% |
|||
|
6. |
Kenya Re |
19.6 |
19.8 |
1.0% |
9.1% |
24.4 |
3.8% |
27.4% |
|||
|
7. |
Liberty Holdings |
13.2 |
13.2 |
0.4% |
8.2% |
16.4 |
0.0% |
24.2% |
|||
|
8. |
Co-op Bank |
16.8 |
16.5 |
(1.5%) |
3.1% |
18.6 |
5.6% |
18.3% |
|||
|
9. |
Britam |
13.2 |
13.1 |
(0.4%) |
(1.9%) |
15.2 |
1.8% |
17.8% |
|||
|
10. |
Jubilee Insurance |
505.0 |
500.0 |
(1.0%) |
0.2% |
575.4 |
1.7% |
16.8% |
|||
|
11. |
Sanlam Kenya |
27.0 |
27.8 |
2.8% |
0.0% |
31.4 |
1.1% |
14.1% |
|||
|
12. |
HF Group*** |
11.0 |
10.6 |
(3.7%) |
1.4% |
11.7 |
0.9% |
12.0% |
|||
|
13. |
CIC Group |
5.6 |
5.7 |
1.8% |
1.8% |
6.2 |
1.8% |
10.6% |
|||
|
14. |
Stanbic Holdings |
81.0 |
81.0 |
0.0% |
0.0% |
79.0 |
5.1% |
2.6% |
|||
|
15. |
Stanchart |
205.0 |
206.0 |
0.5% |
(1.0%) |
201.1 |
4.3% |
1.9% |
|||
|
16. |
Equity Group |
44.0 |
43.5 |
(1.1%) |
9.4% |
42.3 |
4.3% |
1.6% |
|||
|
17. |
NBK |
9.0 |
9.1 |
1.1% |
(3.2%) |
5.6 |
0.0% |
(38.5%) |
|||
|
*Target Price as per Cytonn Analyst estimates |
|||||||||||
|
**Upside / (Downside) is adjusted for Dividend Yield |
|||||||||||
|
***Banks in which Cytonn and/or its affiliates holds a stake |
|||||||||||
|
For full disclosure, Cytonn and/or its affiliates holds a significant stake in NIC Bank, ranking as the 9th largest shareholder
|
|||||||||||
We remain neutral on equities for investors with short-term investment horizon, but are positive for investors with a long-term investment horizon since, despite the lower earnings growth prospects for 2017, the market has rallied and brought the market P/E closer to its historical average. Pockets of value exist, with a number of undervalued sectors like Financial Services, which provide an attractive entry point for long-term investors.
Kuramo Capital, a New-York based private equity firm has completed a transaction to acquire a minority stake in Kenyan investment bank Sterling Capital for an undisclosed amount. The transaction will see Kuramo and Sterling’s other two principal shareholders, Stanley Ngaine who is a non-Executive director, and Reithfield (K) Limited, inject Kshs 200.0 mn into the business. The acquisition follows the reinstatement of Sterling’s investment banking license in October 2017, after it was downgraded to stockbroker level in 2011, for failing to meet CMA’s revised minimum capital limit that required investment banks to raise their minimum capital to Kshs 250.0 mn from Kshs 30.0 mn, while stockbrokers were required to increase their capital to Kshs 50.0 mn, up from Kshs 5.0 mn. The deal will facilitate Sterling’s regional expansion and also increase Kuramo’s footprint in Africa, where it currently manages a portfolio of Kshs 30.9 bn across 21 other investments in various countries including Kenya and Nigeria. Similar transactions that have been carried out in the past include the acquisition 100% of ApexAfrica Capital by Axis a Mauritian private equity fund in 2015 for Kshs 470.0 mn, translating to a transaction multiple of 40.2x on a P/E basis. The acquisition by Kuramo is strategic, given (i) the expected growth of the equities market in Kenya and Sub Saharan Africa, driven by product diversification, new listings, and continued investor interest fueled by existing low valuations in sections in the market such as the financial services, and (ii) the increasing number of private equity deals in the region leading to a growing need for transaction advisors and valuation services.
Private equity investments in Africa remains robust as evidenced by the growing number of successful exits. The increasing investor interest is attributed to (i) rapid urbanization, a resilient and adapting middle class and increased consumerism, (ii) the attractive valuations in Sub Saharan Africa’s private markets compared to its public markets, (iii) the attractive valuations in Sub Saharan Africa’s markets compared to global markets, and (iv) better economic projections in Sub Saharan Africa compared to global markets. We remain bullish on PE as an asset class in Sub-Sahara Africa. Going forward, the increasing investor interest and stable macro-economic environment will continue to boost deal flow into African markets.
During the week, Hass Consult released their Q4’2017 and FY’2017 Land and House Price Indices Report. According to the reports, the real estate market performance in 2017 significantly slowed down with asking prices for residential property sales declining by 4.1% y/y in 2017, despite the 1.0% q/q increases and the asking rents declining by 3.9% y/y and 1.2% q/q. However, land recorded modest gains of 3.3% y/y compared to 5.1% y/y in 2016. The decline in performance has been attributed to (i) a sluggish property market with the slowdown in enquiries resulting from the protracted electioneering process, and (ii) limited financing following the implementation of the Banking Amendment Act 2015, which saw credit growth decline to 2.4% as at October 2017.
In terms of specific locations, for housing prices in Nairobi suburbs, Muthaiga was the best performing suburb recording a sales price appreciation of 10.7% y/y attributable to the exclusivity guaranteed by its location, since it is zoned for low density and also its proximity to the CBD. Kileleshwa was the worst performing suburb with sales prices declining in the market by 5.9% y/y. This is attributable to the continued oversupply in the area. For the satellite towns, Limuru was the best performing satellite town recording a sales price appreciation of 14.1% y/y attributable to the area’s infrastructural development such as the proposed Western Bypass and the rehabilitation of Ruaka-Banana-Limuru and Ngecha-Kabuku Roads, that are driving demand for real estate in the area. Juja was the worst performing with asking sales prices declining by 4.8% y/y, attributable to the slowdown in enquiries backed by low demand. Semi-detached units were the best performing typologies in the market recording an annual sale price appreciation of 1.8% and 3.4% q/q, which is a different scenario from what we have seen in the past where apartments have been the best performing typologies. The good performance of the semi-detached units is attributed to the high demand for the same as the high-end products remained pricey and thus, out of reach.
The rental markets performance was in tandem with the sales market with asking rentals across all property types declining by 3.9% in 2017 and 1.2% q/q. For suburbs, the best performing was Eastleigh with a 7.7% y/y increase in the rental prices in 2017 attributed to the high demand for affordable housing in the area, while the worst was Langata recording a 9.0% negative y/y change in rental prices attributed to competition from high end units in its neighborhood such as Karen. For satellite towns, the best performing was Limuru with a 12.3% y/y change in rental prices, attributed to the infrastructural development in the area, while the worst was Kitengela with the rental prices declining by 7.3% y/y attributed to its location in the outskirts of Nairobi that prove to be unattractive to potential clients.
The highest rental rates drop for semi-detached houses was recorded in Upperhill at 9.4% in Q4 and 11.7% annually, owing to its continuously growing commercial nature, while the highest rental rates decline for apartments was in Lavington and Kileleshwa, whose rates declined by 14.4% and 13.2%, respectively, attributable to increased supply.
These findings are similar to our research in which we note that for 2017 the residential market slowed down with the total returns (yield + capital appreciation) declining by 2.6% points to 10.3% in 2017 from an average of 12.9% in 2016. Despite the slowdown in 2017, we expect the residential market to pick up in 2018 with (i) better performance continuing to be recorded in the mid and low-mid end segments as investor appetite for the same continues in a bid to curtail the housing deficit, (ii) the market gaining further impetus from the expected government’s affordable housing initiative, and (iii) increased exploration of alternative funding by investors to spur development. We expect to witness increased investment and thus better performance for some suburbs in the high end market such as Spring Valley, Kyuna, Loresho and Lavington due to the proposed review of zoning regulations in these areas to make them high density residential areas.
Source: Hass Consult
For the land price index, the following were the key take outs;
- Land asking prices softened, recording an annual price appreciation of 4.4% y/y in 2017 from 13.5% in 2016 due to the prolonged electioneering period that poised a high political risk, hence decreasing the economic activities;
- Land price appreciation in Nairobi suburbs softened, appreciating by 3.3% in 2017 from 5.1% in 2016, with the appreciation in satellite towns being 5.4% in 2017 from 21.8% in 2016. This is attributable to the protracted electioneering period in Kenya;
- For suburbs, Donholm was the best increasing by 12.2% y/y due to the opening up of the area following completion of the Outer Ring Road, while Ridgeways was the worst performing with an asking price drop of 0.8% y/y;
- For satellite towns, Kitengela was the best performing town increasing by 16.6% y/y, driven by the expansion of infrastructure projects, such as proposed connection to sewer line and accessibility through Namanga Road, while Thika performed worst recording a drop in asking prices of 4.1% y/y;
- In Nairobi, Upperhill still remains the most expensive suburb with the asking price for an acre now standing at Kshs 551 million. We attribute the increase in prices to the increased demand for land in the high-end areas. However, for the decrease, we attribute this to the uncertain political environment that resulted in slowed down in activities in the real estate sector.
This is in line with Cytonn research findings in which we noted that annual capital appreciation in Nairobi Metropolitan Area decreased to 6.5% in 2017 from 18.0% in 2016, mainly as a result of the political uncertainty brought about by the extended electioneering period and lack of investor confidence in the market following political headwinds.
|
Hass Consult Land Price Index Summary 2016-2017 |
|||
|
|
Annual 2015 |
Annual 2016 |
Annual 2017 |
|
Nairobi Suburbs |
9.0% |
5.1% |
3.3% |
|
Nairobi Satellite Towns |
7.5% |
21.8% |
5.4% |
|
Average |
8.3% |
13.5% |
4.4% |
|
Land recorded a positive annual price growth of 4.4%, with Nairobi suburbs recording a 3.3% annual growth in asking prices while satellite towns recorded a 5.4% growth rate. This indicates softening of the land asking prices due to the prolonged electioneering period that poised a high risk hence decreasing the economic activities in 2017 |
|||
Source: Hass Consult
In the retail sector, Carrefour’s Karen outlet hit Kshs 1.5 bn in revenue in the first seven-months of operations in Kenya. The retail store has three more stores - at Two Rivers Mall, Thika Road Mall and the Junction Mall. Despite the retailer’s good performance, it faces competition from local supermarkets Tuskys, Naivas, Quickmart, and international brands Choppies and Game, which have also been opening new outlets. According to Nielsen, a global information, data, and measurement company, shifting consumer trends have driven growth in formal retail, with 30.0% of Kenyans now shopping in formal retail establishments compared to 4.0% in Ghana and 2.0% in Cameroon and Nigeria. This is the second highest in Sub-Saharan Africa after South Africa, which stands at 60.0%.
However, it is not all rosy for other retailers such as Nakumatt and Uchumi, which have been struggling financially. For example, Uchumi, in a bid to restore its profitability, is set to close its prime Capital Centre branch and also the Ruaraka branch. These branches are said to be poorly performing as a result of tough competition from their neighboring retailers Carrefour and Game located at Thika Road Mall and Garden City Mall, respectively.
Despite the troubles faced by some retailers, the retail sector outlook remains positive given the continued expansion of local supermarkets and the entry of foreign brands.
Other highlights for the week were;
- In Kisumu, the Kshs 2.4 bn Lake Basin Mall is set to be opened next month despite Tuskys, initially the anchor tenant, pulling out. The 27,000 SQFT mall is located 3.5 kilometers from the town centre. According to the Lake Basin Development Authority Managing Director, Dr. Atera, the entire mixed-use will also have a 3-star hotel, retail stores, a resource centre and three office blocks. Kisumu has several malls with an approximate total size of 870,000 SQFT. This include The West End Shopping Mall, Mega City, Tuff Foam, Mega Plaza, United Mall and the Lake Basin Mall;
- In the hospitality sector, Kenya Airways and KLM expanded their sales cooperation agreement to cover more European-Eastern Africa routes, unlike the previous deal, which limited their alliance on the London and Amsterdam routes into Nairobi, with the aim of creating more value for their customers. We expect this to result in more tourist arrivals into the country moving forward. As at 2017, the number of international arrivals stood at 1.4 mn, attracting a 49.2% hotel room occupancy in Nairobi.
We expect the real estate sector to fully recover and experience a spur of activities across the themes following (i) the completion of the electioneering period, and (ii) increased investor confidence in the market following stability of the economy enhanced by political calmness and thus increased economic activity.
During the year 2017, the Kenyan equities market recorded strong performance with NASI, NSE 25 and NSE 20 gaining by 28.4%, 21.3% and 16.5%, respectively. This performance was driven by gains in large caps such as DTB, KCB Group, Safaricom, Equity Group and Co-operative Bank, which gained 62.7%, 48.7%, 39.7%, 32.5% and 21.2%, respectively. Looking at these indices an investor then wonders which among them is the right measure of the market performance. In this write-up, we seek to lay out what causes the discrepancies in returns and then conclude by pointing out what really is the best benchmark for investors to use when measuring performance.
Introduction: An index is a statistical indicator or a measure of performance. According to FTSE Russell, a stock index is a group of securities chosen to track a particular investment scheme such as a market, asset class, sector, industry, or even a strategy. The collection of securities that make up the index are known as the basket, with each item contributing a certain weight. An index is basically supposed to be a representation of the performance of its constituents, as it would be difficult to track the performance of each individual component on an ongoing basis, especially in a case where the constituents are many. Below are some of the uses of an Index:
- To show the general performance of the market at a particular point in time and over a given period of time,
- Used by portfolio managers as a benchmark, hence measures the performance, and can help determine whether an active or a passive strategy is the right way to go,
- Indices are used as a foundation for developing investment products such as Exchange Traded Funds, which is a marketable security that tracks an index, a bond or a commodity, and,
- To assess the risk of investing in a certain stock, for instance, the risk of investing in a stock listed on NSE is calculated from the variance of the stock’s performance from the index’s performance.
While constructing an index, a couple of things need to be agreed upon in advance:
- Weighting methodology:
Below are the various methods used in weighting an index;
- Market-Capitalization Weighted Index: This index weights constituent securities by market capitalization, “Market - Cap”, which is the number of outstanding shares multiplied by the share price. Most of the indices are market-cap weighted, and include Nairobi Securities Exchange All Share Index (NASI), and FTSE 100. The performance of a market-cap weighted index is mainly influenced by large-cap securities, as is the case for NASI where Safaricom significantly influences the index’s performance. As highlighted in our topical on Safaricom’s 44% of NSE Market Capitalization and Portfolio Construction, Safaricom’s size and stability anchors the value of local equities given that it contributed to 54.7% of the performance of NSE in 2017. The main advantage of a market-cap weighted index is that it actually reflects the behavior of the entire market. However, its main downside is the assumption that all outstanding shares are available for trading, which makes this index not a good benchmark for portfolio managers because the entire market is not investable. Due to this, portfolio managers normally adjust the market-cap weighted index for free float to reflect the shares available for trading. Some of the Market-Capitalization Weighted Index adjusted for Free Float are S&P 500 and MSCI,
- Price-Weighted Index: The weights of each component in the basket is based on the current stock price, implying that securities trading at higher prices account for a higher weight in the index, irrespective of the number of shares outstanding. The advantage of this method of pricing an index is that it is relatively easier, but its disadvantage is that it does not represent the total value of a security and it also ignores the investability of a security hence is not a good representative. Price-weighted indices are not as widely used as market-cap weighted indices. Example of such indices are the Kenyan NSE 20 and the Dow Jones Industrial Average in New York Stock Exchange (NYSE),
- Equally-Weighted Index: In this index, all securities are assigned an equal weight therefore enhancing diversification in the portfolio, which is not easily achieved in the market-cap weighted and price-weighted indices. The main disadvantage of these indices is that substantial investment in the illiquid stocks may cause movements in the market, therefore affecting the ability of the index to reflect performance of the market,
- Risk-Weighted Index: This index assigns weight to a security based on the amount of risk associated with the specific security. In this case, risk is defined as a measure of the volatility of the stock. Therefore, stocks that have recorded more volatility historically get assigned a smaller weight as they are perceived riskier, while those with minimal price movements account for higher weight in the index, and,
- Fundamentally-Weighted Index: This index assigns weight to securities based on the financial condition of a company, which is an assessment of financial performance of the company to determine its intrinsic value. Companies that are more financially stable based on assessment of individual analysts are assigned higher weights. Therefore, a main con with this method is the subjectivity present in determining the intrinsic value of a firm.
- Compositions and Rebalancing:
Given that the market changes occasionally, it warrants changes in the composition of an index, especially where the index does not have all the qualifying components. Most indices have a rebalancing cycle, which stipulates how often stocks are included or excluded from the index. For the NSE 20, the criteria for inclusion of a company is; (i) must have a least 20% of its free float available for trading at the NSE, (ii) must have been continuously quoted for a least 1 year, (iii) must have a minimum market capitalization of Kshs 50.0 mn, (iv) should ideally be a “blue chip” (a blue chip is a company with a track record of superior earnings and a dividend record, hence strong investor sentiments, which makes it highly priced), and (iv) company shares must have their primary listing on the NSE. The all share index, NASI, main changes are based on key corporate actions like splits etc. For both indices, the rebalancing is done on a quarterly basis.
- Calculation methodology:
There are two ways of calculating the value of an index:
- Arithmetic Mean: In this method, the value of an index is obtained by dividing the sum of all market capitalization by the base. This method is simple and easy to apply. The NSE all share index (NASI) applies this method in calculating returns,
- Geometric Mean: This method uses the compounding methodology and is therefore slightly complicated. The geometric mean is calculated by multiplying all the sum of initial capital and returns (Initial capital (1) + returns), taking the n-th root, where n is the period of investment, and subtracting the initial capital (1). The NSE 20 share index uses the Geometric mean to calculate returns.
Usually in most cases, returns obtained using the geometric mean methodology are lower than those obtained using the arithmetic mean methodology.
Having discussed the various ways in which indices are differentiated, we have identified the following characteristics as ideal for a good investable index (benchmark);
- Capped Weighting - Indices should have a cap, above which a particular stock should not exceed in order to maintain diversification and reduce the risk posed by one dominant stock. For example, in our topical, Safaricom’s 44% of NSE Market Capitalization and Portfolio Construction, we identified the Capped Shareholders Weighted Index (SWIX), which rebalances every quarter to cap stocks at 10% of the index, creating less single-stock concentration,
- Free Float Adjustment – Some stocks, despite having a significant weighting, may not be practical for investing as they have very few shares available for trading. The ideal index should factor this in its various constituent.
Below is a comparison of the two indices, NSE 20 and NASI, whose performance necessitated this write-up:
|
Comparison of NASI and NSE 20 |
||
|
Metric |
NASI |
NSE 20 |
|
Constituents |
Consists of all the stocks listed on the Nairobi Securities Exchange (NSE). Currently NSE has 62 listed companies divided into the following sectors: · Telecommunication and Technology (1), · Banking (11), · Manufacturing and Allied (9) · Insurance (6), · Energy and Petroleum (5), · Construction and Allied (5), · Commercial and Services (10), · Investment (5), · Agricultural (6), · Automobiles and Accessories (3), and · Investment Services (1) |
Consists of 20 of the NSE listed companies, which are selected based on the above mentioned criteria and include; · Telecommunication and Technology (1), · Banking (6), · Manufacturing and Allied (2) · Insurance (1), · Energy and Petroleum (3), · Construction and Allied (2), · Commercial and Services (3), · Investment (1), and · Agricultural (1) |
|
Pricing |
NASI is market-cap weighted, implying that stocks with a higher market value account for a higher weight in the index, hence they are the market drivers. This is always true for NASI with Safaricom and banking stocks controlling about 67.5% of the index |
NSE 20 is price-weighted, implying that stocks with higher prices are assigned a higher weight. In this case, BAT and EABL are the performance drivers of the index due to their high prices, while large-caps like Safaricom account for less weight due to lower stock price |
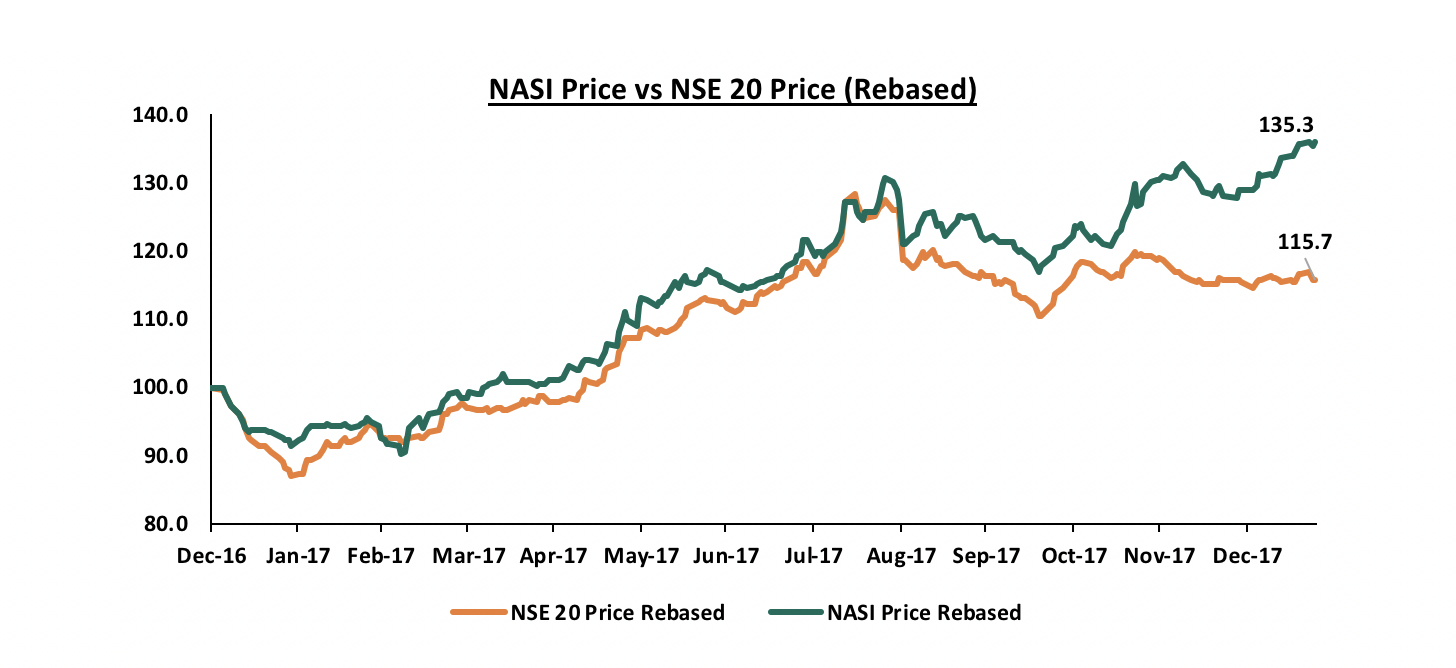
Having defined what both indices are and what they represent, we now need to determine the cause of disparity in the performance of the indices. As highlighted earlier, during the year 2017, NASI and NSE 20 gained by 28.4% and 16.5%, respectively, to close the year at 133.3 and 3,186.2 for NASI and NSE 20, respectively. The chart below highlights the performance of NASI and NSE 20 during the year. The figures are different from the actual indices figures at peak since the data series is rebased to have a common starting point (100) for easier comparison of the two indices.
The discrepancy in the performance of the two indices can be attributed to the dominance of particular stocks in these indices. The table below show the performance for 2017 of stocks that constituted approximately 80% of both NSE 20 and NASI at the beginning of 2017, and their weightings in both NASI and NSE 20;
|
Performance of Select Common Stocks in NASI and NSE 20 |
||||||
|
Stock |
Price as at 31st Dec 2016 |
Price as at 31/12/2017 |
Price change |
Price-weight as at Dec 2016 |
Market cap as at Dec 2016 |
Market cap weight as at Dec 2016 |
|
BAT |
909.0 |
760.0 |
(16.4%) |
53.0% |
90,900.0 |
5.6% |
|
EABL |
244.0 |
238.0 |
(2.5%) |
14.2% |
192,955.2 |
11.8% |
|
Bamburi |
160.0 |
180.0 |
12.5% |
9.3% |
58,080.0 |
3.6% |
|
KCB |
28.8 |
42.8 |
48.7% |
1.7% |
88,150.4 |
5.4% |
|
Equity |
30.0 |
39.8 |
32.5% |
1.7% |
113,211.0 |
6.9% |
|
Safaricom |
19.2 |
26.8 |
39.7% |
1.1% |
767,252.4 |
46.9% |
|
Total |
1,390.9 |
1,287.3 |
81.1% |
1,310,549.0 |
80.1% |
|
|
Weighted Performance |
|
|
|
(6.0%) |
|
22.7% |
Key take-out from the above table is:
- Performance attribution by index weighting methodology – Using price-weighted methodology, the index would have recorded a weighted loss of 6.0%. On the other hand, using the market-cap weighted methodology, an index composed of these stocks would have recorded a gain of 22.7%. The underperformance by NSE 20 is as a result of the minimal weight assigned to Safaricom by price-weighted methodology, which makes its significant gain of 39.7% in 2017 less impactful on the index. The performance of NSE 20 is also undermined by losses recorded by stocks assigned higher weights in the index such as BAT and EABL, which both recorded losses.
In view of the above, it is clear that NASI and NSE 20 do not have the characteristics of a good index, and are impractical to track as a benchmark. In our assessment, the dominance of the stocks highlighted above, drive the performance of these indices and having them in your portfolio, has a major effect on your final performance. The table below summarises suitability of all indices on the NSE as measured against the above mentioned ideal characteristics of an index:
|
Index |
Capped Weighting |
Free Float Adjustment |
|
NASI |
X |
X |
|
NSE 20 |
X |
√ |
|
NSE 25 |
X |
√ |
|
FTSE 15 |
X |
√ |
|
FTSE 25 |
X |
√ |
The above table shows that the NSE currently has no index that possess all the above mentioned qualities of a good benchmark. However, the exchange made an effort in addressing the inefficiencies of both NASI and NSE 20 by introducing NSE 25 index in October 2015. The NSE 25 includes blue-chip companies that have a market capitalization of at least Kshs 1.0 bn, and have at least 20% of their shares available for trading. The index is therefore an improvement of NASI as it makes a provision for the shares available for trading and it has taken into account that the entire market is not investable. Despite this, most portfolio managers still prefer to benchmark with NASI, which could be attributed to the fact that the index has only been in use for 2-years, and may be an indication that public awareness has not been effective, as is the case with other recently introduced exchange products. A main downside for NSE 25 is that weighting is not capped, which may result in dominance of some stocks on the index. This necessitates re-invention of the existing indices by the exchange and the Capital Markets Authority to create benchmarks in which portfolio managers can invest in practically. For instance, the MSCI is constructed by market cap weighting but with the weights adjusted for free float. However, since a portfolio manager cannot practically invest in all stocks that are liquid, the MSCI capped indices were created, which constrain weights of constituents by sector, geography or by just setting a maximum weight, and they include MSCI 10/40, MSCI 25/50, MSCI 20/20, and MSCI 20/35.
In conclusion, we view the following as key actionable areas that can be implemented to make the already existing indices more relevant as portfolio benchmarks:
- Introduce capped weighting in indices similar to MSCI or Capped SWIX in South Africa: Evidently, Safaricom being the highest by market value will have a dominant weight in every market-cap weighted index and will therefore influence the performance of the index, making other constituents irrelevant. As highlighted in our Cytonn Weekly #50/2017, where we discussed the impact of Safaricom’s market dominance in portfolio construction, we also saw a good example of an index that reduces single-stock concentration. In South Africa, Naspers, which is broad-based multinational internet and media group, accounts for 20.5% of the FTSE/JSE All Share Index, 24.5% of the Top 40 Index and 24.8% of the Shareholders Weighted Index (SWIX), which are the top 3 indices used as benchmarks for investors. To maintain diversification and address the dominance by Naspers, portfolio managers in South Africa are now shifting their benchmark to the Capped SWIX, which was introduced in November 2016. This variation rebalances every quarter to cap stocks at 10% of the index, creating less single-stock concentration. Such a capped index, which could be the Capped NASI, Capped NSE 20 or Capped NSE 25, or another Capped Index, would also provide the adequate rebalancing to ensure indices in Kenya are reflective of movements in the entire market,
- Introduce indices that are based on industries or sectors: Some portfolio managers chose to invest in select sectors of the market especially because they understand this part of the market. Sector-based indices will therefore serve as good benchmarks as they are practical as an active strategy,
- Have forum groups to engage on index construction: These would be forums where all stakeholders in the market engage to provide options towards developing an index that can be fully representative of market movements and used as a benchmark when measuring performance,
- Generally, avail more information to the public: There is little public information available on the indices in the Nairobi Securities Exchange. The NSE does not release reports once an index is rebalanced hence the use of these indices by investors and portfolio managers to measure performance may be biased. More information on the NSE 25 and the advantages of using it as a benchmark index would go a long way in increased consumer education. Additionally, lack of a clear reporting framework, such as quarterly or annual reports on performance of the indices makes it hard to improve on what we already have.
Disclaimer: The views expressed in this publication are those of the writers where particulars are not warranted. This publication, which is in compliance with Section 2 of the Capital Markets Authority Act Cap 485A, is meant for general information only, and is not a warranty, representation, advice or solicitation of any nature. Readers are advised in all circumstances to seek the advice of a registered investment advisor.

- Talk to us
- Kenya
- P.O Box 20695 - 00200, Nairobi, Kenya
- Cell +254709101200
- Tel +254709101200
- WhatsApp +254741676635
- United States
- +254709101200
- DOWNLOAD OUR APP
-


- Kenya
- 8th Floor, Pinetree Plaza, Kaburu Drive, Ngong Road, Nairobi, Kenya
- USA
- Suite 1150, 1775 Eye Street NW, USA, Washington DC 20006, USA
- Investments
- High Yield
- Private Equity
- Real Estate
- Real Estate
- RiverRun Estates
- Cytonn Towers
- The Ridge
- Taraji Heights
- The Alma