National Housing Development Fund (NHDF), & Cytonn Weekly #21/2019
By Cytonn Research, May 26, 2019
Executive Summary
Fixed Income
T-bills were oversubscribed during the week, with the overall subscription rate increasing to 131.4%, from 92.3% recorded the previous week. The improved subscription is attributable to improved liquidity in the market supported by government payments. The Monetary Policy Committee (MPC) is set to meet on Monday, 27th May 2019, to review the prevailing macroeconomic conditions and decide on the direction of the Central Bank Rate (CBR). In their previous meeting held on 27th March 2019, the MPC maintained the CBR at 9.0%, citing that the economy was operating close to its potential and inflation expectations remained anchored within the target range. We believe that the MPC will maintain the current policy stance, given the macroeconomic environment is still relatively stable. We therefore expect the MPC to hold the CBR at 9.0%. We are projecting the y/y inflation rate for the month of May to come in within the range of 5.8% - 6.2%, compared to 6.6% recorded in April. The inflation for the month of May is expected to remain elevated due to a rise in the transport index, following the 5.1% and 2.2% rise in petrol and diesel prices, respectively, and a 2.3% rise in kerosene prices;
Equities
During the week, the equities market recorded a mixed performance with NASI and NSE 25 gaining by 0.3% and 0.4%, respectively, while NSE 20 declined by 0.9%, taking their YTD performance to gains/ (losses) of 3.8%, (6.8%) and (0.3%), for NASI, NSE 20 and NSE 25, respectively. During the week, Standard Chartered Bank of Kenya, KCB Group and Co-operative Bank released their financial results recording core earnings per share growths of 31.2%, 11.4% and 4.4%, to Kshs 7.3, Kshs 1.9, and Kshs 0.6, respectively;
Private Equity
During the week, Generation Investment Management, a Pan-African focused sustainable investment firm, based in San Francisco, USA, has announced the closing of a USD 1.0 bn (Kshs 101.3 bn) growth equity fund that will target start-up companies with a focus on financial inclusion, healthcare and environmental solutions. Kasada Capital Management, a Sub-Saharan hospitality investment platform, reached a close on its first fund, Kasada Hospitality Fund LP, having secured USD 500.0 mn (Kshs 50.6 bn) of equity commitments from Katara Hospitality and Accor Group, a French-based hospitality operator;
Real Estate
During the week, the National Treasury launched the Kenya Mortgage Refinancing Company (KMRC), a non-bank financial institution, incorporated to provide affordable long-term funding and capital market access to primary mortgage lenders. In the residential sector, the Kenyan Government announced plans to build a 3,060-unit residential development along Ngong Road, and Kings Developers Limited (KDL), the development affiliate of Royal Group of Companies, announced its plan to develop a 720-unit 10-block residential apartment in Ongata Rongai, Kajiado County;
Focus of the Week
Last month, we published the Kenya Mortgage Refinancing Company Note, which focused on how funding for the end user will be achieved by funding primary mortgage lenders by leveraging on capital markets. This week, we shift the focus to the National Housing Development Fund (NHDF), which looks into funding of the end user through a housing levy. The fund was established under the Housing Act 2018 Section 6 (1), under the control of National Housing Corporation (NHC) as provided for in the Housing Act Cap 117, and is intended to collect approximately Kshs 55 bn annually, which will be raised through remittances by both employees and employers where the former will contribute to the Fund 1.5% of their gross income per month, to a maximum of Kshs 5,000 per month, with the latter matching this amount. However, the housing levy is yet to be implemented, pending the hearing of a case filed by various parties that include, Central Organization of Trade Unions (COTU), Trade Union Congress of Kenya, Consumers Federation of Kenya (CoFeK) and the Federation of Kenyan Employers (FKE) challenging the levy.
- In line with increasing the product offering to our clients, we are happy to announce that Cytonn Asset Managers has received two more licenses to offer personal retirement benefit schemes with a monthly payment platform from the Retirement Benefits Authority (RBA). The licenses allow Cytonn Asset Managers to; manage segregated funds, personal pension funds and the income drawdown fund. https://bit.ly/2K6xs6u. For more information on the pension products, email us at pensions@cytonn.com;
- Interested in learning about real estate investments in a relaxing environment? Be sure to stop by our stand at Sarit Centre next weekend, on the 1st and 2nd June, 2019, from 9:00 am - 6:00 pm and start your investments journey;
- Ian Kagiri - Investments Analyst was on CNBC to discuss the impact of the tax amnesty by KRA on the remittances. Watch Ian here;
- Following the completion and handover of Amara Ridge in Karen, we have now launched our next Karen project, dubbed Applewood, a Kshs 2.5 bn residential development located in Miotoni, Karen. This signature development shall comprise luxury homes, each sitting on 1/2 acre. We invite you to the exhibition of Applewood which is ongoing at the Amara Ridge Clubhouse (Location pin: https://goo.gl/maps/B3GVnu8pHyn) or at the Applewood Sales Centre on Miotoni Road (Location pin: https://goo.gl/maps/ZfABuGjFo1z) from 9:00 am to 5:00 pm daily. Call 0709 101 000 or email resales@cytonn.com to reserve a villa! See Video here;
- We continue to hold weekly workshops and site visits on how to build wealth through real estate investments. The weekly workshops and site visits target both investors looking to invest in real estate directly and those interested in high yield investment products to familiarize themselves with how we support our high yields. Watch progress videos and pictures of The Alma, Amara Ridge, and The Ridge;
- We continue to see very strong interest in our weekly Private Wealth Management Training (largely covering financial planning and structured products). The training is at no cost and is open only to pre-screened participants. We also continue to see institutions and investment groups interested in the training for their teams. Cytonn Foundation, under its financial literacy pillar, runs the Wealth Management Training. If interested in our Private Wealth Management Training for your employees or investment group, please get in touch with us through wmt@cytonn.com. To view the Wealth Management Training topics, click here;
- For recent news about the company, see our news section here;
- We have 10 investment-ready projects, offering attractive development and buyer targeted returns. See further details here: Summary of Investment-Ready Projects;
T-Bills & T-Bonds Primary Auction:
T-bills were oversubscribed during the week, with the overall subscription rate increasing to 131.4%, from 92.3% recorded the previous week. The improved subscription was attributable to improved liquidity in the market supported by government payments. The yields on the 91-day and 182-day papers declined by 7.5 bps and 7.6 bps to 7.1% and 7.7%, from 7.2% and 7.8%, respectively, while the yield on the 364-day paper remained unchanged at 9.3%. The acceptance rate rose to 91.9%, from 75.0% recorded the previous week, with the government accepting a total of Kshs 29.0 bn of the Kshs 31.5 bn worth of bids received, higher than the weekly quantum of Kshs 24.0 bn. Investors’ participation remained skewed towards the longer dated paper, with the 364-day recording improved subscription to 210.5%, from 193.0% the previous week, while the subscription rates for the 91-day and 182-day papers rose to 146.1% and 46.4%, from 49.8% and 8.0% recorded the previous week, respectively.
Liquidity:
During the week, the average interbank rate declined to 5.4%, from 5.7% recorded the previous week, pointing to improved liquidity conditions in the money market, supported by government payments. The average volumes traded in the interbank market declined by 14.6% to Kshs 17.0 bn, from Kshs 20.0 bn the previous week.
Kenya Eurobonds:
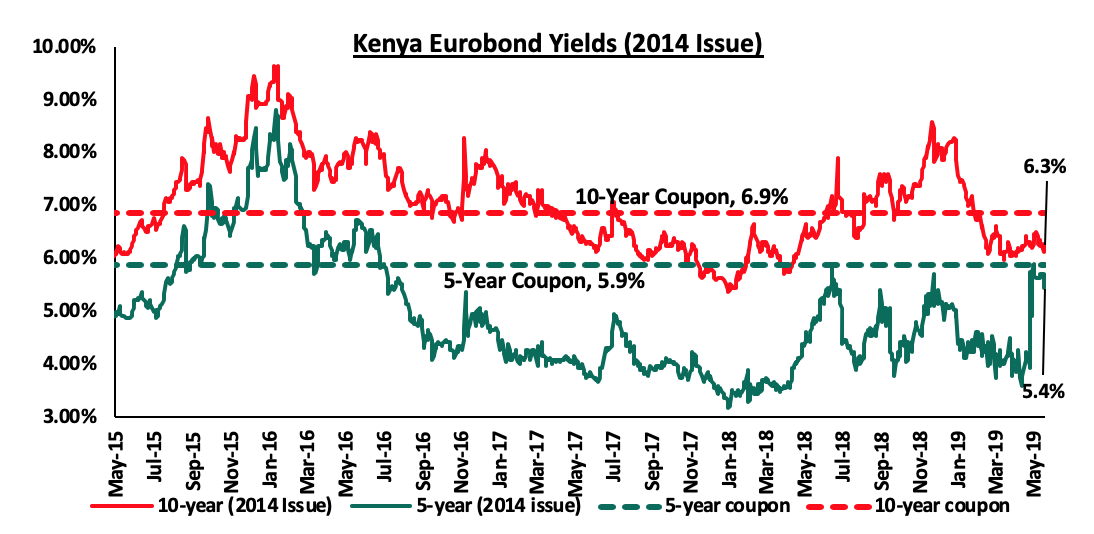
According to Reuters, the yield on the 10-year Eurobond issued in 2014 declined by 0.1% points to 6.3%, from 6.4% the previous week, while that of the 5-year declined by 0.3% points to 5.4%, from 5.7% the previous week. Key to note is that these bonds have 1.0-month and 5.1-years to maturity for the 5-year and 10-year, respectively.
For the February 2018 Eurobond issue, yields on the 10-year Eurobond remained unchanged at 7.5%, while the yield on the 30-year Eurobond rose by 0.1% points to 8.6% from 8.5% the previous week. Since the issue date, the yields on both the 10-year Eurobond has increased by 0.1% points while the yields on the 30-year Eurobond has increased by 0.2% points.
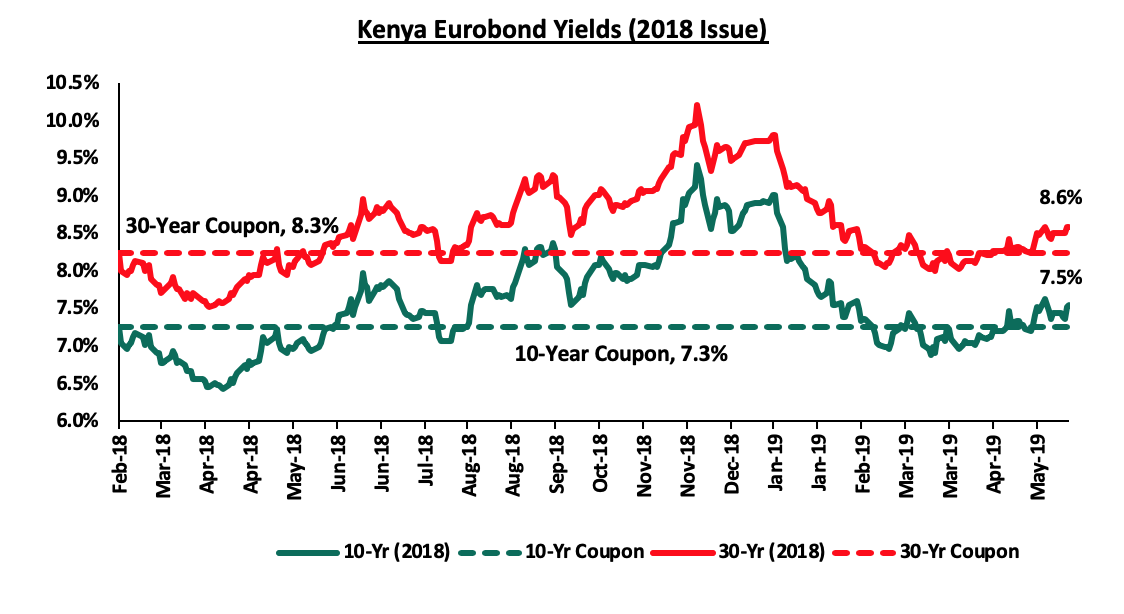
The newly issued dual-tranche Eurobond with 7-Years and 12-years tenor, priced at 7.0% for the 7-year tenor and 8.0% for the 12-year tenor, respectively, started trading on 17th May 2019. The yield on the 7- year bond and 12-year bonds have risen by 0.1% point and 0.2% points to 7.1% and 8.1%, from 7.0% and 7.9%, respectively, as at the close of 17th May 2019.
The Kenya Shilling:
During the week, the Kenyan Shilling depreciated by 0.1% against the US Dollar to close at Kshs 101.2, from Kshs 101.1 the previous week, due to increased dollar demand from merchandise and oil importers buying dollars to meet their end-month obligations. The Kenya Shilling has appreciated by 0.6% year to date in addition to the 1.3% appreciation in 2018, and in our view, the shilling should remain relatively stable to the dollar in the short term, supported by:
- The narrowing of the current account deficit with preliminary data on balance of payments indicating continued narrowing to 4.7% of GDP in the 12-months to February 2019, from 5.5% recorded in February 2018. The decline has been attributed to improved agriculture exports, increased diaspora remittances, strong receipts from tourism, and lower food and SGR-related equipment relative to 2017,
- Improving diaspora remittances, which have increased cumulatively by 3.8% in the Q1’2019 to USD 665.6 mn, from USD 641.5 mn recorded in a similar period of review in 2018. The rise is due to:
- Increased uptake of financial products by the diaspora due to financial services firms, particularly banks, targeting the diaspora, and,
- New partnerships between international money remittance providers and local commercial banks making the process more convenient,
- CBK’s supportive activities in the money market, such as repurchase agreements and selling of dollars, and,
- High levels of forex reserves, currently at USD 8.0 bn (equivalent to 5.2-months of import cover), above the statutory requirement of maintaining at least 4-months of import cover, and the EAC region’s convergence criteria of 4.5-months of import cover.
Highlights of the Week
The Monetary Policy Committee (MPC) is set to meet on Monday, 27th May 2019, to review the prevailing macro-economic conditions and decide on the direction of the Central Bank Rate (CBR). In their previous meeting held on 27th March 2019, the MPC maintained the CBR at 9.0%, citing that the economy was operating close to its potential and inflation expectations remained anchored within the target range thus the prevailing monetary policy stance remained appropriate. This was in line with our expectations as per our MPC Note, informed by the country’s macroeconomic fundamentals, which had remained stable as well as sustained optimism on the economic growth prospects, as evidenced by:
- Inflation expectations, which had remained well anchored, within the target range, declining to 4.1% in February 2019, from 4.7% recorded in January 2019, mainly driven by a 0.5% m/m decline in the transport index attributable to a decline in pump prices of petrol and diesel, and,
- Increased private sector optimism as per the MPC Private Sector Market Perception Survey conducted in March 2019, which indicated that the private sector was optimistic about local economic prospects. The private sector expects stronger economic growth in 2019, continued infrastructure development, expectations of adequate agricultural production despite the delayed onset of the long rains in most parts of the country and a stable macroeconomic environment.
The Monetary Policy Committee also noted that the current account deficit had narrowed to 4.7% in the 12-months to February 2019 compared to 5.5% in February 2018, supported by strong growth of agricultural exports particularly tea and horticulture, improved diaspora remittances, and tourism receipts. The decline was also partly supported by the slower growth in imports due to lower imports of food and machinery.
We believe that the MPC will maintain the current policy stance, given the macro-economic environment is still relatively stable. We therefore expect the MPC to hold the CBR at 9.0% with their decision being supported by:
- Expectations of easing of the recent inflationary pressures, which had mainly been driven by food supply shocks specifically grain prices with maize recording a 26.1% rise m/m leading to a 29.8% rise in the prices of maize flour. The surge in prices is however expected to be mitigated by the current measures being undertaken by the Kenyan Government, key of which being the release of 3 million bags of maize from the strategic food reserves that has eased the grains shortage curbing rising flour prices,
- The stability of the Kenyan Shilling having already gained by 0.7% YTD in 2019 and recording a 4-year high of Kshs 99.7 against the dollar during the year, reflecting a more stable economic environment, and,
- Considering the heavy domestic debt maturities, which currently stand at Kshs 1.0 tn for 2019, we believe the MPC will maintain the CBR at the current rate, in order for the government to continue accessing domestic debt at cheaper rates. This however might have adverse effects of further crowding out of the private sector.
The key concern continues to be the weak private sector credit growth, which was at 3.4% y/y in February 2019, lower than the 5-year average of 11.9%, with the highest growth in lending being recorded in consumer durables at 16.2%, finance and insurance at 13.1%, manufacturing at 7.7%, and trade at 6.4%. This was a decline from 3.0% recorded in November, and below the 3.3% average recorded in 2018. Despite the 100-bps cut of the policy rate in 2018, no significant change has been recorded in private sector credit growth which remains anaemic due to the effects of the interest rate cap. On this front we have seen various measures being put in place to address the low private sector credit growth with the recent initiative being the launch of Stawi, a mobile loan product led by five commercial Banks targeting micro, small and medium scale enterprises. As a result, the Central Bank of Kenya has continued to express concern over the effectiveness of monetary policy with the interest rate cap still in place. The Monetary Policy Committee through its assessment of the impacts of the interest rate cap noted that it has weakened the transmission of monetary policy. In particular, the transmission of changes in the CBR to growth and inflation takes longer compared to the period before implementation of the interest rate cap.
For our detailed MPC analysis, please see our MPC Note for the 27th May, 2019, meeting here.
Inflation projections
We are projecting the y/y inflation rate for the month of May to come in within the range of 5.8% - 6.2%, compared to 6.6% recorded in April. The inflation for the month of May is expected to remain elevated due to the following factors:
- A rise in the transport index, which has a weight of 8.7%, with petrol prices having increased by 5.1% to Kshs 112.0, from Kshs 106.6 per litre previously, while diesel recorded a 2.2% rise to Kshs 104.4, from Kshs 102.1 per litre previously, and,
- A rise in the housing, water, electricity, gas and other fuels index, following the 2.3% rise in kerosene prices to Kshs 104.6 per litre, from Kshs 102.2 per litre previously.
Inflation is however expected to be mitigated by a marginal decline in the food and non-alcoholic beverages index, which has a weighting of 36.0%, mainly driven by a decline in food prices such as tomatoes and maize flour following the release of 3 million bags of maize from the strategic food reserves that has eased the grains shortage, hence curbing rising flour prices.
Rates in the fixed income market have remained relatively stable as the government rejects expensive bids as they are currently 15.5% ahead of its domestic borrowing target for the current financial year, having borrowed Kshs 330.6 bn against a pro-rated target of Kshs 286.2 bn. A budget deficit is likely to result from depressed revenue collection, creating uncertainty in the interest rate environment as additional borrowing from the domestic market goes to plug the deficit. Despite this, we do not expect upward pressure on interest rates due to increased demand for government securities, driven by improved liquidity in the market owing to the relatively high debt maturities. Our view is that investors should be biased towards medium-term fixed income instruments to reduce duration risk associated with long-term debt, coupled with the relatively flat yield curve on the long-end due to saturation of long-term bonds.
Market Performance:
During the week, the equities market recorded a mixed performance with NASI and NSE 25 gaining by 0.3% and 0.4%, respectively, while NSE 20 declined by 0.9%, taking their YTD performance to gains/ (losses) of 3.8%, (6.8%) and (0.3%), for NASI, NSE 20 and NSE 25, respectively. The performance of NASI was driven by gains in large cap stocks such as KCB, Standard Chartered Bank of Kenya, and Safaricom, which recorded gains of 7.4%, 2.9% and 1.7%, respectively. The gain in the NASI was however weighed down by declines in NIC Group, Bamburi, EABL and Co-operative Bank, which recorded declines of 5.1%, 4.9%, 3.4% and 3.4%, respectively.
Equities turnover declined by 22.9% during the week to USD 24.9 mn, from USD 32.3 mn the previous week, taking the YTD turnover to USD 629.5 mn. Foreign investors remained net buyers for the week, with a net buying position of USD 5.2 mn, a 37.0% increase from a net buying position of USD 3.8 mn last week.
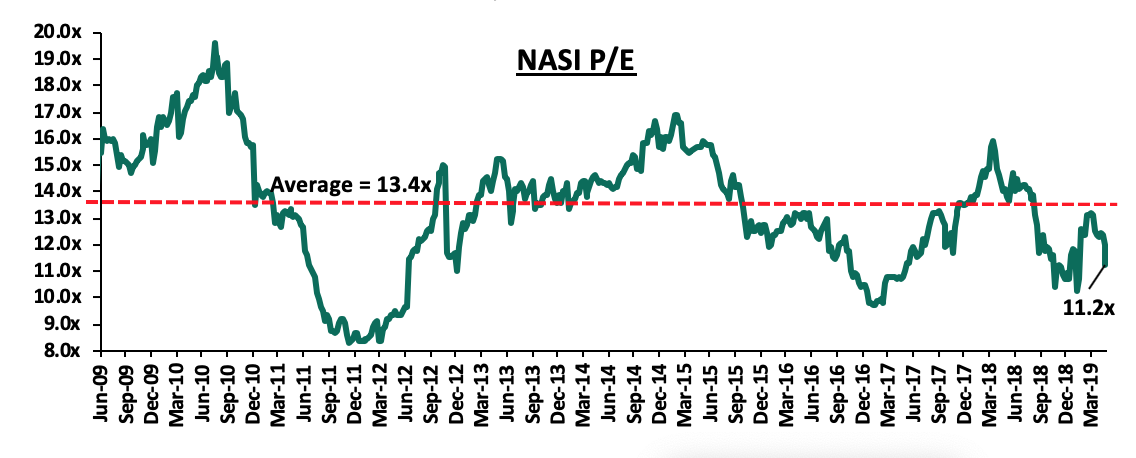
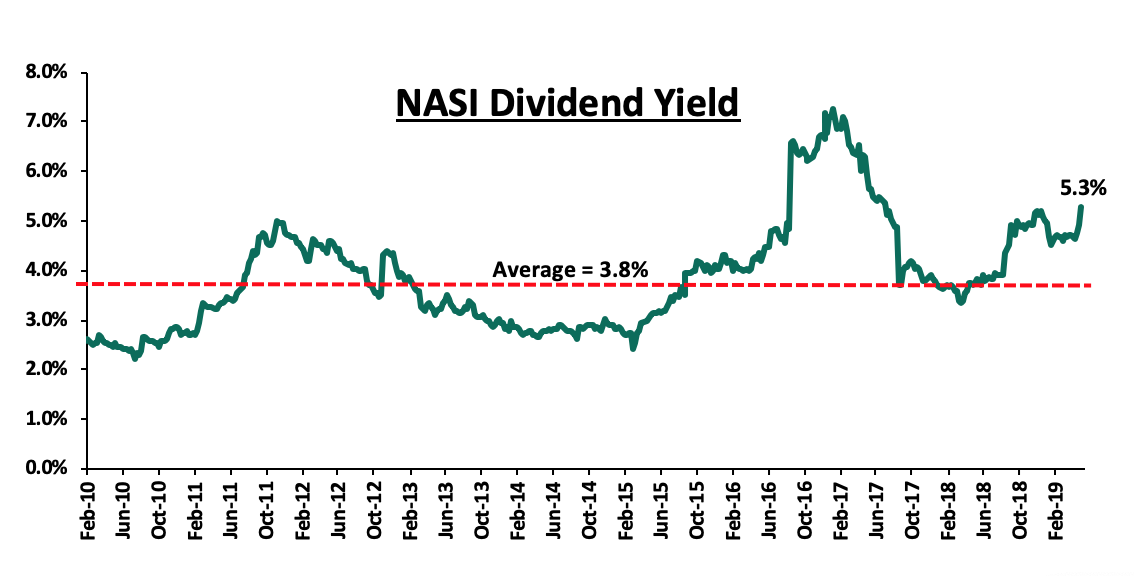
The market is currently trading at a price to earnings ratio (P/E) of 11.2x, 16.0% below the historical average of 13.4x, and a dividend yield of 5.3%, above the historical average of 3.8%. With the market trading at valuations below the historical average, we believe there is value in the market. The current P/E valuation of 11.2x is 15.7% above the most recent trough valuation of 9.7x experienced in the first week of February 2017, and 35.2% above the previous trough valuation of 8.3x experienced in December 2011. The charts below indicate the historical P/E and dividend yields of the market.
Earnings Releases
Co-operative Bank Kenya released their Q1’2019 financial results
Co-operative Bank released their financial results with core earnings per share increasing by 4.4% to Kshs 0.61, from Kshs 0.59 in Q1’2018, in line with our projections. The performance was driven by a 1.7% increase in total operating income, coupled with a 1.2% decline in total operating expenses. Total operating income increased by 1.7% to Kshs 11.1 bn, from Kshs 10.9 bn in Q1’2018. This was driven by a 19.1% increase in Non-Funded Income (NFI) to Kshs 4.2 bn, from Kshs 3.5 bn in Q1’2018, which outpaced the 6.5% decline in Net Interest Income (NII) to Kshs 6.9 bn, from Kshs 7.4 bn in Q1’2018.
- Interest income declined by 2.9% to Kshs 10.1 bn, from Kshs 10.4 bn in Q1’2018. This was caused by a 14.1% decline in interest income from loans and advances to Kshs 7.2 bn, from Kshs 8.4 bn in Q1’2018, which outweighed the 39.6% increase in interest income from government securities to Kshs 2.8 bn from Kshs 2.0 bn in Q1’2018, and the 267.6% increase in interest income from placement assets to Kshs 0.1 bn from Kshs 0.03 bn in Q1’2018. The yield on interest-earning assets thus declined to 11.9%, from 12.3% in Q1’2018,
- Interest expense rose by 6.2% to Kshs 3.2 bn, from Kshs 3.0 bn in Q1’2018, largely due to the 4.1% increase in the interest expense on customer deposits to Kshs 2.8 bn, from Kshs 2.7 bn in Q1’2018, coupled with a 30.0% increase in other interest expenses to Kshs 0.4 bn, from Kshs 0.3 bn in Q1’2018. However, interest expenses on placement liabilities declined by 82.2% to Kshs 3.2 mn, from Kshs 17.8 mn in Q1’2018. The cost of funds declined to 3.7%, from 4.0% in Q1’2018, owing to a 7.1% increase in interest bearing liabilities to Kshs 343.7 bn, from Kshs 320.6 bn in Q1’2018, which grew faster than the 6.2% increase in interest expense. As a result, the Net Interest Margin (NIM) rose to 8.7%, from 8.6% in Q1’2018,
- Non-Funded Income rose by 19.1 % to Kshs 4.2 bn, from Kshs 3.5 bn in Q1’2018. The increase was mainly driven by the 33.6% increase in total fees and commissions to Kshs 3.4 bn, from Kshs 2.6 bn in Q1’2018, which management attributed to increased usage of the firm’s alternative transaction channels. The improvement in NFI was however weighed down by the 15.3% decline in forex trading income to Kshs 0.6 bn, from Kshs 0.8 bn in Q1’2018, and the 35.5% decline in other income to Kshs 0.1 bn, from Kshs 0.2 bn in Q1’2018. As a consequence, the revenue mix shifted to 62:38, from 68:32 in Q1’2018 owing to the fast growth in NFI coupled with the decline in NII,
- Total operating expenses declined by 1.2% to Kshs 6.0 bn, from Kshs 6.1 bn in Q1’2018, largely driven by the 34.3% decrease in Loan Loss Provisions (LLP) to Kshs 0.5 bn from Kshs 0.8 bn in Q1’2018, which outpaced the 1.5% increase in other operating expenses to Kshs 2.74 bn, from Kshs 2.70 bn in Q1’2018, and the 5.6% increase in staff costs to Kshs 2.8 bn, from Kshs 2.6 bn in Q1’2018,
- The Cost to Income Ratio (CIR) improved to 54.2%, from 55.8% in Q1’2018. Without LLP, the cost to income ratio deteriorated to 49.7% from 48.8% in Q1’2018, highlighting the decline cost of risk to 4.5% from 7.0% in Q1’2018, implying a lower provisioning amount relative to the total operating income,
- Profit before tax increased by 4.4% to Kshs 5.1 bn, up from Kshs 4.9 bn in Q1’2018. Profit after tax grew by 4.4% to Kshs 3.6 bn in Q1’2019, from Kshs 3.4 bn in Q1’2018,
- The balance sheet recorded an expansion as total assets increased by 7.0% to Kshs 425.7 bn, from Kshs 397.8 bn in Q1’2018. Growth was supported by a 33.1% growth in government securities to Kshs 103.9 bn, from Kshs 78.1 bn, coupled with the 10.1% increase in other assets to Kshs 18.8 bn from Kshs 17.1 bn in Q1’2018,
- The loan book shrunk by 0.5% to Kshs 251.6 bn, from 252.8 bn in Q1’2018, which management attributed to the repayment of a Kshs 10.0 bn loan by a single client,
- Total liabilities rose by 6.8% to Kshs 351.5 bn from Kshs 329.1 bn in Q1’2018, driven by a 7.4% increase in customer deposits to Kshs 317.8 bn, from Kshs 295.9 bn in Q1’2018. Deposits per branch increased by 7.4% to Kshs 2.1 bn from Kshs 1.9 bn in Q1’2018, as the number of branches remained unchanged,
- Borrowings rose by 14.9% to Kshs 23.7 bn from Kshs 20.7 bn in Q1’2018,
- The fast growth in deposits coupled with the decline in loans, led to a decline in the loan to deposit ratio to 79.2%, from 85.4% in Q1’2018,
- Gross Non-Performing Loans (NPLs) increased by 4.8% to Kshs 29.7 bn in Q1’2019, from Kshs 28.4 bn in Q1’2018. The NPL ratio thus deteriorated to 11.1% in Q1’2019, from 10.9% in Q1’2018. Management attributed the deterioration in asset quality to players in the manufacturing sector, agriculture and trade sectors. General Loan Loss Provisions increased by 37.6% to Kshs 10.9 bn, from Kshs 7.9 bn in Q1’2018. Thus, the NPL coverage improved to 52.2% in Q1’2019 from 30.6% in Q1’2018,
- Shareholders’ funds increased by 7.1% to Kshs 72.8 bn in Q1’2019 from Kshs 67.9 bn in Q1’2018, supported by a 4.7% increase in the retained earnings to Kshs 58.5 bn, from Kshs 55.9 bn, and the increase in the statutory loan loss reserve to Kshs 0.9 bn from a zero balance in Q1’2018,
- Co-operative Bank remains sufficiently capitalized with a core capital to risk-weighted assets ratio of 15.6%, 5.1% points above the statutory requirement of 10.5%. In addition, the total capital to risk-weighted assets ratio came in at 15.9%, exceeding the statutory requirement of 14.5% by 1.4% points. Adjusting for IFRS 9, the core capital to risk weighted assets stood at 16.1%, while total capital to risk-weighted assets came in at 16.5%, and,
- The bank currently has a Return on Average Assets (ROaA) of 3.2%, and a Return on Average Equity (ROaE) of 18.3%.
Key Take-Outs:
- The bank’s asset quality deteriorated, with the NPL ratio deteriorating to 11.1%, from 10.9% in Q1’2018. The main sectors that contributed to the NPLs were manufacturing, agriculture, trade, and building & construction, which contributed 46.0%, 20.0%, 23.0% and 19.0% of the NPLs, respectively. We note that the bank has maintained its stringent credit standards, with management noting that they continue to cherry pick loans to issue, in a bid to tame the rising NPLs. This consequently affected the associated interest income. Furthermore, the bank shifted its focus to government security investments, which recoded a 33.1% growth y/y. The increase however failed to mitigate declines in funded income, largely due to the decline in yields on government securities, and,
- The bank recorded a strong NFI growth y/y, supported by an improvement in the fee and commission income. Transactional income segment recorded an improvement aided by a 5.6% increase in the number of agency banking transactions to 11.3 mn from 10.7mn in Q1’2018, which lead to an 8.7% increase in revenue to 125.0 mn from 115.0 mn. The bank’s mobile banking platform recorded a 25.0% increase in the number of transactions to 10.0 mn from 8.0 mn, and as a consequence, commission income increased by 98.9% to Kshs 744.0 mn, from Kshs 374.0 mn in Q1’2018.
For more information, please see our Co-operative Bank Q1’2019 Earnings Note
During the week, KCB Group released the Q1’2019 financial results
KCB group released their financial results with core earnings per share increasing by 11.4% to Kshs 1.9, from Kshs 1.7 in Q1’2018, in line with our expectations. The performance was driven by a 10.6% increase in total operating income to Kshs 18.8 bn, from Kshs 17.0 bn in Q1’2018, which outpaced the 8.2% increase in total operating expenses to Kshs 10.3 bn, from Kshs 9.5 bn in Q1’2018.
- Total operating income increased by 10.6% to Kshs 18.8 bn from Kshs 17.0 bn in Q1’2018. This was due to an 11.2% increase in Net Interest Income (NII) to Kshs 12.7 bn from Kshs 11.4 bn in Q1’2018, coupled with the 9.2% increase in Non-Funded Income (NFI) to Kshs 6.0 bn, from Kshs 5.5 bn in Q1’2018,
- Interest income increased by 7.1% to Kshs 16.8 bn, from Kshs 15.7 bn in Q1’2018. This was driven by a 7.3% growth in interest income from government securities to Kshs 3.2 bn from Kshs 3.0 bn in Q1’2018, and a 6.4% increase in interest income on loans and advances to Kshs 13.4 bn, from Kshs 12.6 bn in Q1’2018. The yield on interest-earning assets however declined to 11.4% from 11.8% in Q1’2018 attributed to a decline in yields on government securities as well as a decline in lending rates due to the 100 bps CBR cuts last year,
- Interest expenses declined by 4.1% to Kshs 4.1 bn, from Kshs 4.2 bn in Q1’2018, following a 5.9% decline in the interest expense on customer deposits to Kshs 3.6 bn, from Kshs 3.8 bn in Q1’2018, which outpaced the 12.0% rise in interest expense on placement liabilities to Kshs 493.9 mn, from Kshs 440.9 mn in Q1’2018. The cost of funds however remained unchanged at 3.1%. The Net Interest Margin (NIM) declined to 8.5%, from 8.9% in Q1’2018,
- Non-Funded Income (NFI) increased by 9.2% to Kshs 6.0 bn, from Kshs 5.5 bn in Q1’2018. The increase was mainly driven by an 11.6% rise in total fees and commissions income to Kshs 4.0 bn, from Kshs 3.6 bn in Q1’2018. The growth was however weighed down by the 5.4% decline in forex trading income to Kshs 0.98, from Kshs 1.03 bn in Q1’2018. As a result, the revenue mix shifted to 68:32 from 67:33, due to the faster growth in NII compared to NFI,
- Total operating expenses increased by 8.2% to Kshs 10.3 bn, from Kshs 9.5 bn, largely driven by a 93.8% rise in Loan Loss Provisions (LLP) to Kshs 1.2 bn in Q1’2019, from Kshs 0.6 bn in Q1’2018, coupled with a 4.1% rise in staff costs to Kshs 4.6 bn in Q1’2019, from Kshs 4.5 bn in Q1’2018,
- Due to the faster growth of total operating income that outpaced the growth in operating expenses, Cost to Income Ratio (CIR) improved to 54.7%, from 55.9% in Q1’2018. Without LLP, the cost to income ratio also improved, to 48.5%, from 52.4% in Q1’2018,
- Profit before tax increased by 13.5% to Kshs 8.5 bn, up from Kshs 7.5 bn in Q1’2018. Profit after tax grew by 11.4% to Kshs 5.8 bn in Q1’2019, from Kshs 5.2 bn in Q1’2018 as the effective tax rate increased to 32.0% from 30.7% in Q1’2018,
- The balance sheet recorded an expansion as total assets increased by 12.1% to Kshs 725.7 bn, from Kshs 647.5 bn in Q1’2018. This growth was largely driven by a 19.0% increase in investment in government and other securities to Kshs 133.3 bn, from Kshs 112.1 bn in Q1’2018, coupled with a 10.9% increase in their loan book to Kshs 464.3 bn, from Kshs 418.6 bn in Q1’2018,
- Total liabilities rose by 10.7% to Kshs 606.2 bn, from Kshs 547.8 bn in Q1’2018, driven by an 11.2% increase in deposits to Kshs 552.2 bn, from Kshs 496.4 bn in Q1’2018. Deposits per branch increased by 13.4% to Kshs 2.1 bn from Kshs 1.9 bn in Q1’2018, with the number of branches having reduced to 258 from 263 in Q1’2018,
- The faster growth in deposits as compared to loans led to a decline in the loan to deposit ratio to 84.1% from 84.3% in Q1’2018,
- Gross Non-Performing Loans (NPLs) declined by 11.3% to Kshs 38.8 bn in Q1’2019 from Kshs 43.8 bn in Q1’2018. The NPL ratio thus improved to 8.0% from 9.9% in Q1’2018. General Loan Loss Provisions declined by 26.1% to Kshs 15.2 bn, from Kshs 14.4 bn in Q1’2018. The NPL coverage consequently declined to 51.0% in from 58.6% in Q1’2018,
- Shareholders’ funds increased by 19.9% to Kshs 119.5 bn in Q1’2019, from Kshs 99.6 bn in Q1’2018, as retained earnings grew by 35.1% y/y to Kshs 91.0 bn, from Kshs 67.3 bn in Q1’2018,
- KCB Group is currently sufficiently capitalized with a core capital to risk-weighted assets ratio of 18.6%, 8.1% above the statutory requirement. In addition, the total capital to risk-weighted assets ratio was 20.0%, exceeding the statutory requirement by 5.5%. Adjusting for IFRS 9, the core capital to risk weighted assets stood at 19.3%, while total capital to risk-weighted assets came in at 20.8%, and,
- The bank currently has a Return on Average Assets (ROaA) of 3.6%, and a Return on Average Equity (ROaE) of 22.4%.
Key Take-Outs:
- The bank’s asset quality improved, with the NPL ratio improving to 8.0% from 9.9% in Q1’2018. The improved NPL ratio was mainly attributed to an improvement in the corporate loan book’s NPL ratio to 10.5% in Q1’2019 from in 14.8% in Q1’2018, as well as the SME and Micro loan book, which improved to 15.6% in Q1’2019, down from 16.3% in Q1’2018, respectively, and,
- There was an improvement in operational efficiency as evidenced by the improvement in the Cost to Income Ratio (CIR) to 54.7%, from 55.9% in Q1’2018 and to 48.5% from 52.4% in Q1’2018. This has mainly been driven by increased innovation and digitization has seen with 91% of total transactions performed outside the branch comprising of 56.0% on mobile, 27.0% on agency, internet and POS and 8.0% on the ATM which has facilitated the faster growth of transactional income outpacing the growth in operating expenses.
For more information please see our KCB Group Q1’2019 Earnings Note
Standard Chartered Bank Kenya released their Q1’2019 financial results
Standard Chartered Bank of Kenya released their financial results with core earnings per share increasing by 31.0% to Kshs 7.0 from Kshs 5.3 in Q1’2018, which was in line with our expectation of a 30.0% increase to Kshs 6.9. The performance was driven by a 3.7% increase in total operating income, coupled with an 11.8% decline in total operating expenses.
- Total operating income increased by 3.7% to Kshs 7.4 bn, from Kshs 7.1 bn in Q1’2018. The rise was due to a 5.6% increase in Non-Funded Income (NFI) to Kshs 2.4 bn, from Kshs 2.3 bn in Q1’2018, coupled with a 2.8% increase in Net Interest Income (NII) to Kshs 5.0 bn, from Kshs 4.8 bn in Q1’2018,
- Interest income declined by 6.4% to Kshs 6.4 bn, from Kshs 6.8 bn in Q1’2018. This was driven by a 12.4% decline in interest income from government securities to Kshs 2.7 bn, from Kshs 3.1 bn in Q1’2018. Interest on loans and advances however remained unchanged at Kshs 3.4 bn. Consequently, the yield on interest-earning assets declined to 10.6%, from 11.4% in Q1’2018,
- Interest expense declined by 28.8% to Kshs 1.4 bn, from Kshs 2.0 bn in Q1’2018, following a 23.3% decline in interest expense on customer deposits to Kshs 1.3 bn, from Kshs 1.7 bn in Q1’2018. Consequently, cost of funds declined to 3.4%, from 3.6% in Q1’2018, with the Net Interest Margin (NIM) also declining to 7.8%, from 8.0% in Q1’2018,
- Non-Funded Income (NFI) increased by 5.6% to Kshs 2.4 bn, from Kshs 2.3 bn in Q1’2018. The increase was mainly driven by a 37.2% rise in foreign exchange trading income to Kshs 817.8 mn, from Kshs 595.9 mn, coupled with a 5.8% rise in fees and commissions on loans and advances to Kshs 76.4 mn, from Kshs 72.2 mn. The revenue mix remained unchanged at to 68:32 funded to non-funded income,
- Total operating expenses declined by 11.8% to Kshs 3.8 bn, from Kshs 4.3 bn, largely driven by a 61.0% decline in loan loss provisions to Kshs 415.1 mn, from Kshs 1.1 bn in Q1’2018. The large decline in loan loss provisions was however mitigated by a 14.3% rise in staff costs to Kshs 1.8 bn, from Kshs 1.6 bn in Q1’2018,
- The Cost to Income Ratio (CIR) improved to 51.9%, from 61.0% in Q1’2018. Without LLP, the cost to income deteriorated albeit maginally to 46.3%, from 46.0% in Q1’2018,
- Profit before tax increased by 27.8% to Kshs 3.5 bn, from Kshs 2.8 bn in Q1’2018. Profit after tax grew by 31.2% to Kshs 2.4 bn in Q1’2019, from Kshs 1.8 bn in Q1’2018, as the effective tax rate declined to 31.6% from 33.7% in Q1’2018,
- The balance sheet recorded an expansion as total assets increased by 2.5% to Kshs 301.4 bn, from Kshs 294.0 bn in Q1’2018. Growth was supported by a 13.9% growth in government securities to Kshs 142.3 bn, from Kshs 125.0 bn, coupled with the 3.3% increase in loan book to Kshs 117.6 bn, from Kshs 113.8 bn in Q1’2018,
- Total liabilities rose by 1.8% to Kshs 252.2 bn from Kshs 247.7 bn in Q1’2018, driven by the 0.3% increase in customer deposits to Kshs 232.8 bn from Kshs 232.0 bn in Q1’2018. Deposits per branch increased by 6.2% to Kshs 6.9 bn from Kshs 6.4 bn in Q1’2018, as the number of branches declined by 2 to 34 from 36 in Q1’2018. The bank does not have any borrowings,
- The fast growth in loans compared to the deposits loans led to a rise in the loan to deposit ratio to 50.5% from 49.1% in Q1’2018,
- Gross Non-Performing Loans (NPLs) increased by 19.2% to Kshs 21.2 bn in Q1’2019, from Kshs 17.8 bn in Q1’2018. The NPL ratio thus deteriorated to 15.9% in Q1’2019, from 14.0% in Q1’2018. Management attributed the deterioration in asset quality to players in the manufacturing sector, real estate and trade sectors. General Loan Loss Provisions increased by 15.6% to Kshs 8.0 bn, from Kshs 6.9 bn in Q1’2018. The NPL coverage however improved to 76.5% in Q1’2019, from 75.2% in Q1’2018, as the interest in suspense rose by 27.5% to Kshs 8.2 bn, from Kshs 6.4 bn in Q1’2018,
- Shareholders’ funds increased by 6.2% to Kshs 49.1 bn in Q1’2019, from Kshs 46.3 bn in Q1’2018, supported by a 7.3% increase in retained earnings to Kshs 30.3 bn, from Kshs 28.3 bn,
- Standard Chartered Bank Kenya remains sufficiently capitalized with a core capital to risk-weighted assets ratio of 16.1%, 5.6% points above the statutory requirement. In addition, the total capital to risk-weighted assets ratio came in at 18.8%, exceeding the statutory requirement by 4.3% points. Adjusting for IFRS 9, the core capital to risk weighted assets stood at 16.1%, while total capital to risk-weighted assets came in at 19.0%, and,
- The bank currently has a Return on Average Assets (ROaA) of 2.9%, and a Return on Average Equity (ROaE) of 18.2%.
Key Take-Outs:
- There was a decline in the bank’s operating efficiency as the cost to income ratio without LLP deteriorated to 46.3%, from 46.0% in Q1’2018. The deterioration was largely attributable to a 14.3% rise in staff costs to Kshs 1.8 bn, from Kshs 1.6 bn in Q1’2018, as the bank incurred a one-off expense in its staff layoff program, and,
- The bank’s asset quality deteriorated, with the NPL ratio rising to 15.9% from 14.0% in Q1’2018. The deteriorating NPL ratio is attributable to a 19.2% rise in gross non-performing loans to Kshs 21.2 bn from Kshs 17.8 bn in Q1’2018 due to recovery problems of loans made to key troubled sectors such as real estate and manufacturing. The bank’s increased allocation to government securities did not seem to bear fruit, as interest income from government securities declined by 12.4%, affected by the decline in government yields. The bank’s funded income recorded a growth, largely supported by the faster decline in interest expenses, with the bank presumably adjusting interest payable on deposits after a removal of the minimum payable amount in the Finance Act 2018.
For more information, please see our Standard Chartered Bank of Kenya Q1’2019 Earnings Note
Key Take-Outs:
The table below highlights the performance of the banks that have released so far, showing the performance using several metrics, and the key take-outs of the performance.
|
Bank |
Core EPS Growth |
Interest Income Growth |
Interest Expense Growth |
Net Interest Income Growth |
Net Interest Margin |
Non-funded income Growth |
NFI to Total Operating Income |
Growth in Total Fee and Commissions |
Deposit Growth |
Growth in Govt Securities |
Cost to Income |
Loan to Deposit ratio |
Loan Growth |
Cost of Funds |
Return on average equity |
|
Stanbic |
N/A |
12.9% |
2.2% |
19.3% |
4.9% |
17.7% |
49.0% |
61.5% |
29.0% |
(8.8%) |
53.0% |
75.9% |
12.6% |
3.2% |
14.3% |
|
SCBK |
31.2% |
(6.4%) |
(28.8%) |
2.8% |
7.8% |
5.6% |
32.4% |
(10.0%) |
0.3% |
13.9% |
51.9% |
50.5% |
3.3% |
3.4% |
18.2% |
|
KCB |
11.4% |
7.1% |
(4.1%) |
11.2% |
8.5% |
9.2% |
32.3% |
11.6% |
11.2% |
18.9% |
54.7% |
84.1% |
10.9% |
3.1% |
22.4% |
|
Equity |
4.9% |
6.5% |
7.4% |
6.3% |
8.6% |
6.9% |
40.8% |
3.2% |
12.1% |
13.0% |
49.8% |
71.3% |
12.7% |
2.6% |
22.8% |
|
Co-op |
4.4% |
(2.9%) |
6.2% |
(6.5%) |
8.7% |
19.1% |
37.7% |
33.6% |
7.4% |
33.1% |
54.2% |
79.2% |
(0.5%) |
3.7% |
18.3% |
|
NIC |
(4.3%) |
1.3% |
(7.9%) |
9.4% |
5.9% |
7.2% |
29.1% |
6.2% |
5.0% |
10.3% |
65.2% |
78.3% |
2.1% |
5.1% |
12.2% |
|
Q1'2019 Mkt cap Weighted Average |
7.3% |
3.1% |
(3.2%) |
6.7% |
7.7% |
9.6% |
35.4% |
11.6% |
9.3% |
15.0% |
55.4% |
74.4% |
7.0% |
3.6% |
18.6% |
|
Q1'2018 Mkt cap Weighted Average |
14.4% |
9.3% |
11.4% |
8.1% |
8.1% |
9.5% |
37.1% |
12.2% |
9.4% |
25.0% |
56.6% |
76.8% |
6.1% |
3.6% |
18.4% |
Key takeaways from the table above include:
- Six banks have released their Q1’2019 financial results, recording a 7.3% average increase in core Earnings Per Share (EPS), compared to a growth of 14.4% in Q1’2018 for the entire banking sector,
- The banks that have released results have recorded a deposit growth of 9.3%, marginally slower than the 9.4% growth recorded in Q1’2018. Despite the relatively fast deposit growth, interest expenses declined by 3.2%, indicating that banks have been mobilizing relatively cheaper deposits. Furthermore, in September 2018, an implementation of the Finance Act 2018 saw the removal of the minimum interest rate payable on deposits, which stood at 70.0% of the Central Bank Rate (CBR). This helped mitigate high increments in interest expense, despite the relatively fast deposit growth,
- Average loan growth came in at 7.0%, which was faster than the 6.1% recorded in Q1’2018, indicating that there was an improvement in credit extension, with banks targeting select segments such as corporate entities and Small and Medium Enterprises (SMEs). Government securities on the other hand recorded a growth of 15.0% y/y, which was faster compared to the loans, albeit slower than 25.0% recorded in Q1’2018. This highlights banks’ continued preference towards investing in government securities, which offer better risk-adjusted returns. Interest income increased by 3.1%, compared to a growth of 9.3% recorded in Q1’2018. The slower growth in interest income despite the increased allocations to both loans and government securities may be attributable to the decline in yields on loans owing to the 100-bps decline in the CBR, and the decline in yields on government securities, and consequently, the Net Interest Margin (NIM) declined to 7.7% from 8.1% in Q1’2018, and,
- Non-Funded Income grew by 9.6% y/y, faster than 9.5% recorded in Q1’2018. The growth in NFI was supported by the 11.6% average increase in total fee and commission income, albeit slower than the 12.2% growth recorded in Q1’2018. The fee and commission income were however subdued by the implementation of the Effective Interest Rate (EIR) model under IFRS 9 in 2018, which requires banks to amortize the fees and commissions on loans, over the tenor of the loan.
Weekly Highlights
The Central Bank of Kenya (CBK), in conjunction with five commercial banks (NIC Group, KCB Group, Diamond Trust Bank Kenya (DTBK), Co-operative Bank Kenya and Commercial Bank of Africa (CBA)), have come up with a mobile loan facility targeting Micro Small and Medium Enterprises (MSMEs). The facility dubbed “Stawi” targets small business owners who don’t have access to formal credit because of the informal nature of their businesses and lack of collateral. The amounts available to the users will range from Kshs 30,000 to Kshs 250,000, with a repayment period of between 1 – 12 months. The facility will attract an interest rate of 9.0%, per annum and other charges such as a 4.0% facilitation, a 0.7% insurance fee of the disbursed amount, and an excise duty of 20% on the facilitation fee. The pilot phase of the facility will run for 2-weeks, and will involve 3,500 traders registered by Stawi agents. We expect that an increased uptake of the facility would be beneficial to the banks funding the facility, as they would be able to ring in additional interest and fee income. The facility is expected to enable MSMEs that find it difficult to access funding from banks, to access financing, even those that do not have formal banking. Since the inception of the Banking (Amendment) Act 2015 MSMEs have found it difficult to access funding with banks citing inability to price them within the set margins. We however expect uptake of the facility to be strong, as it has been the case for other micro-lending platforms.
Universe of Coverage
Below is a summary of our SSA universe of coverage:
|
Banks |
Price as at 17/05/2019 |
Price as at 24/05/2019 |
w/w change |
YTD Change |
Target Price* |
Dividend Yield |
Upside/Downside** |
P/TBv Multiple |
Recommendation |
|
UBA Bank |
6.0 |
5.8 |
(4.2%) |
(25.3%) |
10.7 |
14.8% |
100.9% |
0.4x |
Buy |
|
Diamond Trust Bank |
121.0 |
122.0 |
0.8% |
(22.0%) |
241.5 |
2.1% |
100.1% |
0.6x |
Buy |
|
Zenith Bank |
19.6 |
19.0 |
(3.1%) |
(17.6%) |
33.3 |
14.2% |
89.6% |
0.8x |
Buy |
|
CRDB |
120.0 |
120.0 |
0.0% |
(20.0%) |
207.7 |
0.0% |
73.1% |
0.4x |
Buy |
|
CAL Bank |
0.8 |
0.8 |
0.0% |
(16.3%) |
1.4 |
0.0% |
70.7% |
0.7x |
Buy |
|
Access Bank |
6.5 |
5.8 |
(10.1%) |
(14.7%) |
9.5 |
6.9% |
70.7% |
0.4x |
Buy |
|
Co-operative Bank |
11.9 |
11.5 |
(3.4%) |
(19.6%) |
18.5 |
8.7% |
69.6% |
1.0x |
Buy |
|
NIC Group |
31.6 |
30.0 |
(5.1%) |
7.9% |
48.8 |
3.3% |
66.0% |
0.8x |
Buy |
|
Equity Group |
36.4 |
36.5 |
0.1% |
4.6% |
58.1 |
5.5% |
64.9% |
1.6x |
Buy |
|
KCB Group*** |
36.3 |
39.0 |
7.4% |
4.1% |
60.0 |
9.0% |
62.8% |
1.0x |
Buy |
|
GCB Bank |
5.0 |
5.0 |
0.2% |
9.1% |
7.7 |
7.6% |
61.4% |
1.2x |
Buy |
|
Ecobank |
6.8 |
7.2 |
5.9% |
(4.0%) |
10.7 |
0.0% |
49.0% |
1.6x |
Buy |
|
I&M Holdings |
60.0 |
60.0 |
0.0% |
(29.4%) |
83.9 |
5.8% |
45.6% |
0.6x |
Buy |
|
Barclays Bank |
10.5 |
10.4 |
(1.0%) |
(5.0%) |
13.1 |
10.6% |
36.5% |
1.4x |
Buy |
|
National Bank |
3.9 |
4.0 |
1.5% |
(24.8%) |
5.2 |
0.0% |
30.0% |
0.3x |
Buy |
|
Guaranty Trust Bank |
30.6 |
31.1 |
1.6% |
(9.7%) |
37.1 |
7.7% |
27.0% |
1.9x |
Buy |
|
Stanbic Bank Uganda |
30.0 |
30.0 |
(0.0%) |
(3.3%) |
36.3 |
3.9% |
24.8% |
2.1x |
Buy |
|
Stanbic Holdings |
97.5 |
100.0 |
2.6% |
10.2% |
115.6 |
5.9% |
21.5% |
1.0x |
Buy |
|
Union Bank Plc |
7.0 |
7.0 |
0.0% |
25.0% |
8.2 |
0.0% |
16.4% |
0.7x |
Accumulate |
|
Standard Chartered |
181.3 |
186.5 |
2.9% |
(4.1%) |
203.8 |
6.7% |
16.0% |
1.4x |
Accumulate |
|
SBM Holdings |
5.9 |
6.0 |
1.4% |
0.0% |
6.6 |
5.0% |
15.1% |
0.9x |
Accumulate |
|
Bank of Kigali |
274.0 |
276.0 |
0.7% |
(8.0%) |
299.9 |
5.0% |
13.7% |
1.5x |
Accumulate |
|
Bank of Baroda |
129.0 |
130.0 |
0.8% |
(7.1%) |
130.6 |
1.9% |
2.4% |
1.1x |
Lighten |
|
FBN Holdings |
7.0 |
7.1 |
0.7% |
(11.3%) |
6.6 |
3.5% |
(2.4%) |
0.4x |
Sell |
|
Ecobank Transnational |
10.0 |
10.1 |
0.5% |
(40.9%) |
9.3 |
0.0% |
(7.7%) |
0.4x |
Sell |
|
Stanbic IBTC Holdings |
44.1 |
42.1 |
(4.5%) |
(12.3%) |
37.0 |
1.4% |
(10.6%) |
2.2x |
Sell |
|
Standard Chartered |
21.8 |
21.8 |
0.0% |
3.8% |
19.5 |
0.0% |
(10.7%) |
2.7x |
Sell |
|
HF Group |
4.4 |
4.2 |
(4.5%) |
(24.2%) |
2.9 |
8.3% |
(22.6%) |
0.2x |
Sell |
|
*Target Price as per Cytonn Analyst estimates **Upside / (Downside) is adjusted for Dividend Yield ***Banks in which Cytonn and/or its affiliates holds a stake. ****Stock prices indicated in respective country currencies |
|||||||||
We are Positive on equities for investors as the sustained price declines has seen the market P/E decline to below its historical average. We expect increased market activity, and possibly increased inflows from foreign investors, as they take advantage of the attractive valuations, to support the positive performance.
Generation Investment Management, a Pan-African focused sustainable investment firm, based in San Francisco, USA, has announced the closing of a USD 1.0 bn (Kshs 101.3 bn) growth equity fund, Generation Sustainable Solutions Fund III. The fund will be the third raised by the firm, after Generation Climate Solutions Fund II, which raised USD 683.0 mn (Kshs 69.1 bn) in 2014 and Global Equity Strategy Fund, which raised USD 2.2 bn (Kshs 222.7 bn) in 2008, and seeks to target start-up companies with a focus on financial inclusion, healthcare and environmental solutions.
The fund, even before closure, made 2 investments, one in Andela, a Nigeria-based software development service provider, where it invested an undisclosed amount into the firm’s Series D funding, whose target was to raise USD 100.0 mn (Kshs 10.1 bn), as well Sophia Genetics, a healthcare technology company based in Washington, USA, where it invested an undisclosed amount. The fund will make investments of between USD 50.0 mn (Kshs 5.1 bn) and USD 150.0 mn (Kshs 15.2 bn).
Kasada Capital Management, a Sub-Saharan hospitality investment platform, reached a close on its first fund, Kasada Hospitality Fund LP, having secured equity commitments of over USD 500.0 mn (Kshs 50.6 bn), with the commitments being raised from Katara Hospitality, a hotel developer based in Qatar, and Accor Group, a French-based hospitality operator, who invested USD 350.0 mn (Kshs 35.4 bn) and USD 150.0 mn (Kshs 15.2 bn), respectively. The funds will be targeting brownfield and greenfield projects within Sub-Saharan Africa, and is aimed at allowing international investors to tap into the high-growth hospitality sector in the region. Kasada is looking to partner with local partners, with the aim of supporting the entire value chain, from contractors and developers to suppliers in the industry, in order to expand local businesses and create jobs.
Kasada is looking to leverage this investment by Accor and Katara to boost efforts to raise additional capital, both from local banks as well as international financial institutions, given their strong brand presence as well as operational track record in investing in hospitality in the region. This comes less than a month after Accor announced its intentions to ramp up its operations in the region, with a keen focus on Kenya and Tanzania in East Africa, as evidenced by its expanding footprint in Nairobi, where it took over the operation of Ibis Styles Hotel, in addition to acquisition of 100% stake in Mövenpick Hotels & Resorts. The group intends to open 35 hotels in Africa by 2020, and has set a target of signing 15 to 20 projects each year between now and 2025.
We maintain a positive outlook on private equity investments in Africa as evidenced by the increasing investor interest, which is attributed to; (i) economic growth, which is projected to improve in Africa’s most developed PE markets, (ii) attractive valuations in Sub Saharan Africa’s private markets compared to its public markets, and (iii) attractive valuations in Sub Saharan Africa’s markets compared to global markets. Going forward, the increasing investor interest, stable macro-economic and political environment will continue to boost deal flow into African markets.
- Residential Sector
During the week, the National Treasury launched the Kenya Mortgage Refinancing Company (KMRC). The KMRC is a non-bank financial institution, incorporated as a limited liability company to provide affordable long-term funding and capital market access to primary mortgage lenders such as banks and financial co-operatives. KMRC has so far mobilized Kshs 37.2 bn, meeting the minimum core capital requirement of at least Kshs 1.0 bn for operation according to the Central Bank of Kenya (Mortgage Refinance Companies) Regulations 2019. The facility has received funding support of Kshs 25bn from the World Bank, Kshs 10 bn from the African Development Bank (AfDB), and Kshs 200 mn from Shelter Afrique. These funds will be applied towards enhancing access to affordable housing finance, strengthening KMRC balance sheet, and providing requisite credit enhancements to support KMRC issuance of mortgage-backed bonds in the capital market.
In our view, the launch of the KMRC is a positive step towards addressing the housing finance shortage in Kenya, which has been a key challenge in the housing sector. Successful implementation of KMRC will, therefore, boost the Kenyan mortgage market and increase home ownership among Kenyans. For more information on KMRC, see our topical, Kenya Mortgage Refinancing Company Update.
The Kenyan Government announced plans to build a residential development on Ngong Road consisting of 3,060 apartments on a 5.1-hectares (12.6-acres) piece of land. The development will comprise of fifteen, 34-story blocks consisting of 285 1-bed, 1,768 2-bed, 1,007 3-bed units, and three levels of basement parking (the unit sizes and selling prices are yet to be disclosed). The project is part of the Kenyan Government’s affordable housing projects under the Big Four Agenda. This marks the third low-cost housing project by the National Government with other launched projects within the Nairobi Metropolitan Area being the Park Road Estate in Ngara, comprising of 1,500 units and Pangani Estate comprising of 1,000 residential units. Other planned projects in the pipeline are Uhuru Estates, Suna Road and Old Ngara. The continued launch of affordable housing projects by the government is in a bid to meet the existing housing deficit in Kenya of approximately 2.0 mn houses according to the National Housing Corporation.
Some of the initiatives and incentives introduced by the government to drive the affordable housing initiative include:
- Introduction of partnerships with private developers by availing public land for development,
- Introduction of the 15.0% tax rate on the resulting profits, instead of the normal 30.0% for developers who provide at least 100 low – cost housing units p.a,
- Setting up of the Kenya Mortgage Refinancing Company (KMRC) to enable longer-term mortgages at affordable rates,
- Establishment of the National Housing Development Fund (NHDF) aimed at enabling potential homebuyers to save towards homeownership and consequently offer offtake for housing developments, and,
- Establishment of a land bank whereby excess land will be gathered together in a bid to address the challenges faced by investors and developers seeking to acquire land.
We expect these measures to enhance the development of affordable housing units in the country by both the private and public sectors.
Kings Developers Limited (KDL), the development affiliate under Royal Group of Companies, announced their plan to develop 720-unit, 10-block residential apartment in Ongata Rongai, Kajiado County. The project dubbed, ‘Kings Serenity’ is set on eight acres and will comprise of 93 SQM 2-bed units selling at Kshs 3.2 mn each translating to a price per SQM of Kshs 34,409 per SQM. Ongata Rongai as an investment location has been particularly ideal for residential development due to high urbanization rate hence acting as dormitory area for persons working in the Nairobi Metropolitan area (NMA), availability of large tracts of affordable land at Kshs 11.4 mn per acre compared to Kshs 188.6 mn per acre in the Nairobi Metropolitan area (NMA), allowing for affordable development projects and improved infrastructure in the area.
Satellite towns have previously performed below the industry average attributable to inadequate infrastructure and distance from the major commercial nodes. According to our Cytonn Q1’2019 Markets Review, Satellite towns recorded occupancy rates and total returns of 75.8% and 4.8%, respectively, 6.6% and 0.1% points less than the market average of 82.4% and 4.9%, respectively. However, Satellite towns are preferable to the majority of Nairobi’s population consisting of low middle income due to their affordability of homes which cost Kshs 82,274 per SQM and rental rates of Kshs 392 per SQM compared to the market average at Kshs 101,922 and Kshs 510 respectively.
The table below shows a summary of residential - apartments performance in Nairobi Metropolitan Area.
All Values in Kshs, unless stated otherwise
|
Residential - Apartments Performance in Nairobi Metropolitan Area – Q1’2019 |
|||||||
|
Location |
Price Per SQM Q1'2019 |
Rent Per SQM Q1'2019 |
Annual Uptake Q1'2019 |
Occupancy 2019 |
Rental Yield Q1'2019 |
Price Appreciation Q1'2019 |
Total Returns Q1'2019 |
|
Satellite Towns |
82,274 |
392 |
16.8% |
75.8% |
4.3% |
0.5% |
4.8% |
|
Upper-Mid Surburbs |
133,910 |
693 |
23.1% |
84.1% |
4.8% |
(0.1%) |
4.8% |
|
Lower-Mid Surburbs |
89,582 |
446 |
25.4% |
87.4% |
5.5% |
(0.2%) |
5.3% |
|
Average |
101,922 |
510 |
21.8% |
82.4% |
4.9% |
0.1% |
4.9% |
Source: Cytonn Research 2019
We expect continued activity by developers in lower mid-end markets owing to increased demand and uptake as home buyers seek affordability.
Other highlights during the week include:
The Employment and Labour Relations Court suspended the implementation of the 1.5% housing levy until May 27th May 2019, pending the hearing of a case by a number of petitioners including Consumers Federation of Kenya (CoFeK) and the Central Organization of Trade Unions (COTU), challenging the implementation of the Finance Act 2018. The further delay was due to the request by the court to have the applications consolidated for hearing.
With the increased National Government support towards the development of affordable housing and launch of the KMRC, we expect to see continued focus on the provision of affordable housing for the lower and middle-income segment of the market.
Kenya has a huge housing deficit of approximately 2.0 mn units, growing by 200,000 units p.a., according to National Housing Corporation. To tackle this, the National Government established the Affordable Housing Initiative, as one of its Big Four pillars to promote long-term economic development, focused on delivering 500,000 housing units for the lower and middle-income population segments by 2022, with a price range of Kshs 0.6 mn – Kshs 3.0 mn per house. (However in our analysis, prices for affordable housing would need to range at Kshs 3.6 mn and below at prevailing market conditions, as per the Cytonn Affordable Housing Note.)
The housing initiative composed of the following components:
- Formation of the Kenya Mortgage Refinancing Company (KMRC) whose main function is enhancing mortgage affordability by enabling long-term loans at attractive market rates through provision of affordable long-term funding and capital market access to primary mortgage lenders such as banks and financial co-operatives. It is noteworthy that the Kenyan Government has made great progress on this particular component,
- Introduction of incentives by the National Government such as exemption from stamp duty tax for first time home buyers, and 15.0% corporate tax rate relief (half the statutory 30%) for developers who provide at least 100 low – cost housing units per annum,
- Establishment of the National Housing Development Fund (NHDF), which includes a 1.5% levy on employee’s monthly basic salaries up to Kshs. 5,000 and the employer expected to match the same amount that will be channelled into the fund. The contribution is expected to act as a saving for employees aimed towards house ownership; informal and self-employed citizens contributing Kshs. 100 towards NHDF.
Last month, we published the Kenya Mortgage Refinancing Company Note, which focused on how funding the end user would be achieved through provision of affordable long-term funding and capital market access to primary mortgage lenders. This week, we shift our focus to the National Housing Development Fund (NHDF), which looks into funding of the end user through a housing levy. Here we will look into;
- The State of the Housing Sector in Kenya,
- Introduction to the National Housing Development Fund (NHDF)
- Formation and Operationalization of the NHDF
- Benefits and Challenges Facing the NHDF
- Case Study: Nigeria National Housing Fund
- Recommendations on the Structure of NHDF
- The State of the Housing Sector in Kenya
The housing deficit in Kenya remains high at approximately 2.0mn units, with an annual demand of 200,000 units according to National Housing Corporation, driven by a rapid population growth rate at 2.5% p.a. and a high urbanisation rate at 4.3%, compared to 1.2% and 2.0% globally, respectively. Developers are unable to meet this demand due to inadequate credit supply, high cost of funding, low uptake due to low purchasing power of Kenyans, hence supplying only 50,000 units annually into the market thus leading to an annual deficit of 200,000 units across Kenya. According to the World Bank, 83.0% of the existing housing supply is for the high income and upper-middle-income segments, with only 15.0% for the lower-middle and 2.0% for the low-income population. This is as a result of developers seeking higher returns from high end developments targeting high net worth buyers who have high disposable income thus providing more demand for the houses, resulting in higher uptake.
Since independence, housing has been a key area of focus for the government. Over the years, several policies and strategies have been put in place to ensure provision of adequate housing for all, such as;
- In 1953 the Colonial Government of Kenya created a Central Housing Board through the Housing Ordinance to promote development of housing for Africans,
- Policies & Legal Framework of 1966/67 that advocated for slum clearance and housing development through aided self-help and co-operative efforts,
- The National Housing Strategy for Kenya 1987-2000: aimed to produce a concrete action plan for public and private sector players to improve housing situation in Kenya,
- Inception of site and service schemes, with developments such as the Dandora scheme consisting of 6,000 units and the Makongeni scheme in Thika consisting of 1,200 units in late 1970s and 1980s,
- Introduction of Housing Cooperatives in 1980s, with the formation of the National Cooperative Housing Union (NACHU) which was formed by the Central Organization of Trade Unions, as well as private sector funded estates on mortgages like Buru Buru, Lang’ata, Ngumo and Kenyatta,
- The National Plan of Action on Shelter and Human Settlements of 1995 & The National Housing Policy Sessional Paper of 2004 that sought to facilitate the provision of adequate shelter and a healthy living environment at an affordable cost to all socio-economic groups in Kenya,
- In 1996, the government enacted the physical planning act of 1996 to provide for the formulation of national, regional and local physical planning guidelines, policies and strategies, in addition to the National Plan of Action on Shelter and Human Settlements of 1995,
- The Vision 2030 Medium Term Strategic Plan for 2008-2012, aimed at improving housing through various initiatives such as facilitation of production of 200,000 housing units per annum, review and formulation of National Urban Development Policy, development of affordable, quality houses for lower income Kenyans and implementation of Kenya Informal Settlement Improvement Programme among other initiatives,
- The government measures to improve informal settlements in 1990s and 2000s, including the Mathare 4A project started in 1992 through the joint effort of the Kenyan and the German Governments and implemented by the Amani Housing Trust. The Kibera Slum Upgrading Programme started in 2004 as well as the Lang’ata Phase IV and V Programmes started in 2010 and completed in 2012, funded through a partnership between the Kenya Commercial Bank (KCB) and the National Housing Corporation (NHC),
- In 2010, the government promulgated the new Constitution 2010, which recognized the right to accessible and adequate housing, and to reasonable standards of sanitation. Adequate housing is therefore entrenched in the constitution as a right to every Kenyan, thus compelling the Kenyan Government to put in more effort in achieving decent housing for all citizens.
Government initiatives however have not been successful in sustainably tackling the housing problem in Kenya due to excessive bureaucracy in state departments, corruption, political interference and most importantly, lack of long-term sustainable frameworks.
In late 2000s to 2016, the real estate sector in Kenya enjoyed a boom with the sector’s contribution to GDP growing from 4.8% in 2010 to 8.4% in 2016, driven by entry of private developers. During this period, real estate became fully established, characterized by increased institutional developers in the sector, modern high-end designs and an increase in gated communities. The value of properties rose rapidly, with rental rates increasing by 200% between 2007-2017 according to the Hass Consult Rental Index. According to the Hass Price Index, the average value of a detached house in Nairobi has risen by 330% from Kshs. 7.1 mn in 2000, to Kshs. 30.1 mn in 2017, with the average price for 1, 2 and 3-bedroom detached units currently at Kshs. 13.7 mn, and the average prices for 4, 5 and 6 bedroomed detached units at Kshs. 40.1 mn.
However, provision and access to affordable housing still remains a challenge to not only the home buyers but also those involved in the supply end due to the following;
-
- Low Income Levels
Majority of Kenyans earn relatively low incomes and are thus unable to afford decent housing. For instance, for one to purchase a standard 3-bedroom affordable housing unit costing Kshs. 3 mn using a mortgage at the current average rates of 13.6% and a tenure of 12-years, they have to earn a minimum income of Kshs. 106,000 per month in order to be able to pay the monthly payments of Kshs. 42,359. However, according to data from the KNBS 2017, 74.5% of employees in the formal sector earn less than Kshs. 50,000 per month, thus mortgages are out of reach for most people. In addition, 83.4% of total employment is in the informal sector, which is characterized by small scale activities, relatively unpredictable incomes and limited job security and thus they are unable to afford a house.
-
- Increasing Property Prices
Prices of properties are continuously escalating, attributed to increased demand for housing due to the high urbanization rate of 4.3% and a population growth rate of 2.5%, thus locking out a majority of Kenyans who are unable to afford them. Land acquisition and construction costs have also been increasing, with developers mostly passing on the extra costs incurred to home buyers thus high prices of housing units, making the units unaffordable. Case in point, house prices in Nairobi have been growing at a 5.1% 4-year CAGR between 2014 and 2018, land prices at a 5.3% and 11.2% 4-year CAGR in Nairobi’s suburbs and Satellite Towns, respectively, in the same period.
-
- Inadequate and High Costs of Funds
Real estate development is capital-intensive, and thus developers have to explore alternative sources of capital, with current capital such as senior debt at a high cost, ranging from interest rates of 14% - 18% per annum to the Kenya Shilling. However, with the implementation of the interest rate cap at 4.0% above the Central Bank Rate (currently at 9.0%), banks have reduced credit advancement to private sector due to tightened underwriting standards, hence private sector credit growth came in at 3.4% in February, compared to a 5-year (2014-2019) average of 11.4%. Despite the capping of interest rates, the actual cost of credit is still high, averaging at 18.0% due to additional administration fees, which then raise the cost of development, thus making development expensive.
-
- Inadequate Infrastructure
Poor planning and inadequate funding have led to lack of adequate infrastructural development, such as proper access roads, mains power and sewerage services in several parts of Kenya. Developers are thus forced to incur these costs in order to improve the marketability of their units, which are then passed on to the end buyer decreasing the affordability of the units. According to research conducted by the Centre for Affordable Housing Finance Africa in 2015 and 2016, infrastructure contributes to approximately 15% of the total development costs.
- Introduction to the National Housing Development Fund (NHDF)
Having looked at the housing state in Kenya, the key challenges towards affordable housing, and why we need affordable housing finance, in this section we will look at what NHDF is, its formation, its operationalization and key benefits and challenges facing the fund.
-
- Formation and Operationalization of the NHDF
The Housing Fund was established under the Housing Act 2018 Section 6 (1), under the control of National Housing Corporation (NHC) as provided for in the Housing Act Cap 117.
Essentially, the Housing Fund is expected to bridge the gap for affordable housing in Kenya by:
- De-risking private developers by guaranteeing offtake for the incoming supply under the affordable housing initiative, which is to be done through signing of Offtake Agreements,
- Enabling end-buyer uptake by providing affordable finance solutions such as the anticipated nationwide Tenant Purchase Scheme (TPS), and
- It will also allow mortgage and cash buyers to save towards the purchase of an affordable home through the affordable housing Home Ownership Savings Plan (HOSP).
The success of the Housing Fund will be anchored on its funding structure, as discussed below;
Financial Structure
The funding structure will consist of stable mandatory contributions from employees, approximately 2.5 million and growing, as provided in the Finance Act 2018. It is of paramount importance that the Housing Fund funds itself in the most efficient and cost-effective manner. The key sources of capital shall include:
- Public Statutory Contributions: With a target of 2.5 million employees in the formal sector, the fund expects to collect Kshs 55 bn annually, which is set to increase onwards. This means the fund expects to collect from each employee an average of Kshs 22,000 per annum or Kshs 1,833 per month (note that 50.0% of this will be from the employer). As provided in the Employment Act, employees will contribute to the Fund 1.5% of their gross income per month, to a maximum of Kshs 5,000 per month, with employers matching this amount.
The funds will be accumulated in the Housing Fund and credited to each employee’s individual Housing Fund account. It is important to note that contributors are also free to contribute more if they so wish and this will reflect in their accounts. Informal sector workers are also allowed to make contributions at a minimum of Kshs 100 per month. All contributions to the fund, mandatory and voluntary, will only be accessible after retirement, and will not include the employers’ deduction. Each member shall receive from the Housing Fund, at the end of every financial year, an annual benefit statement indicating the summary of the member's Housing Fund Account.
However, despite the contributions, the Housing Scheme will only be available to first time home buyers. According to NHC, for contributors who are not eligible for the affordable houses, their contributions will be either transferred to their pension scheme registered with Retirement Benefits Authority (RBA), or refunded as cash to themselves or their dependents. The contributors eligible for affordable housing scheme will access the funds through a tenant purchase scheme or mortgages depending on income bracket.
- Debt and Borrowings: These shall include short-term capital from local banks and Development Finance Institutions (DFIs) in the form of credit lines. Additionally, the Housing Fund will in the later years issue mortgage backed securities (MBS) in the local capital markets on a regular basis backed by the affordable housing units and the tenant purchase certificates issued to home owners. The MBS will be designed to maximize the tenor of the securities issued and lower the aggregate funding costs to the Tenant Purchase Scheme (TPS) home owners. The MBS will be issued in the following classes, (i) Short-term/money market notes (0 – 5 years): Targeted to money market funds and short-term investors and banks, (ii) Medium-term notes (5 – 10 years): Targeted to banks, insurance companies and fund managers, (iii) Long-term notes (10 – 20 years): Targeted to pension funds and life insurance funds, and (iv) Equity and residual investments (20 – 25 years): Retained by Housing Fund.
Other sources of income will be rental revenue from completed stock, grants and donations and returns from the Fund’s investments.
To achieve its mandate, the Housing Fund will have two major roles:
-
- Financing Demand Side
National Housing Corporation established an online housing portal, Boma Yangu, where all stakeholders in the housing sector, including end-buyers and investors, interact with the Housing Fund. The portal will serve as evidence of aggregating demand from potential home buyers to developers and other investors in the affordable housing initiative, while also serving as a platform for prequalifying eligible individuals for the affordable homes under development. As per the affordable housing development framework, the various income group categories are as follows:
- Social Housing: (individuals earning up to Kshs 19,999),
- Low-Cost Housing: (Kshs 20,000 – Kshs 49,999),
- Mortgage Gap: (Kshs 50,000 – Kshs 149,999).
In the Housing Fund scheme, those who fall under social and low-cost housing categories will acquire homes through Tenant Purchase Schemes while those earning above Kshs 50,000 will purchase through low interest rate mortgage loans. The government’s strategy aims for interest rates of between 3.0% - 7.0% home loans advanced to end-buyers through the National Housing Corporation, which has been running a Tenant Purchase Scheme in its various projects.
Each year, the state will then run a lottery to allocate the houses available among the contributors paying for the houses. This is to allow for equal distribution and prevent the contributors with a stronger financial muscle from acquiring all the houses available and subsequently renting them out.
Eligible candidates will require:
- A full Boma Yangu Portal profile,
- Regular contributions to the Housing Fund for at least 6-months, and,
- Accumulated at least 2.5% of the home value they intend to purchase.
Through the Housing Fund’s Affordable Housing Home Ownership Savings Plan (HOSP) employers, employees and self-employed individuals will be able to make tax-advantaged savings/contributions, which will act as a down payment in the purchase of an affordable home whereas NHC will also be able to run a national Tenant Purchase Scheme (TPS) that will provide affordable long-term financing to homeowners.
The table below shows a summary of tenant purchase scheme and expected monthly payments on social housing (To see the price estimations for the mortgage gap units, please see our recent Kenya Mortgage Refinancing Company Note);
|
Tenant Purchase Scheme |
||||||
|
Typology |
Category |
Maximum Selling Price per unit |
*Interest Rate p.a. |
Tenure |
Monthly Payments |
**Gross Monthly Income |
|
1 BR |
Social Housing |
0.6m |
3%-7% |
25 Years |
3,508 |
8,769 |
|
2 BR |
Social Housing |
1.0m |
3%-7% |
25 Years |
5,846 |
14,615 |
|
*To calculate monthly payments, we have used an interest rate of 5.0% (average of 3-7%) **Assuming monthly payments are 40.0% of the monthly gross income |
||||||
|
·The social housing gap will comprise of 1 and 2-bedroom units with maximum price points of Kshs 0.6 mn and Kshs 1.0 mn, respectively. According to State Housing and Urban Development, individuals will be acquiring the units through a rent-to-own model with monthly payments at an interest rate of 3.0%-7.0% p.a. Key to note is that, the National Housing Corporation has implemented the model in the Slum Upgrading Initiative where individuals rent towards ownership at interest rates of 3.0% for a tenure of 25 years |
||||||
-
- De-risking and Financing Supply side
With a target of at least 2,000 homes in each of the 47 counties in the first phase, the Housing Fund will provide developers with offtake agreements to purchase qualifying affordable housing units as a de-risking measure. This is expected to create confidence on the developers’ side due to the guarantee of uptake for their projects. The Offtake Agreement will be effected 12-months following the completion of a development to allow for a sufficient contractor defects liability period, after which the National Housing Corporation will make payments for the units, which in turn will provide more construction finance for more developments. To make the housing affordable, developers are expected to use alternative construction methods that the State Department of Housing and Urban Development projects will cut construction costs by at least 30.0%. To reduce the Fund’s liability, the maximum amount of guarantees the fund will offer in any year will be proposed by the management as part of its yearly budget process and ratified by the board. The Fund’s management will only be able to offer guarantees to the extent that has been ratified by the board. In addition, the regulations operationalizing Housing Fund will prohibit the Fund from having outstanding guarantees of more than 150.0% of the Fund’s equity capital at any time.
-
- Benefits and Challenges Facing the NHDF
With its financial capacity and support from the government, the Housing Fund will have the following benefits to the housing sector stakeholders:
- Provide offtake undertaking to developers to catalyse the development of affordable housing units in scale. This will allow for the development of larger and more affordable housing projects while also attracting more private sector developers to affordable housing development due to the Housing Fund’s ability to absorb the project market risk,
- The Fund is expected to effectively mobilize private and public sector resources to deliver affordable housing to Kenyans,
- The Housing Fund is expected to fund the development of large-scale housing projects which are bound to attract economies of scale thus bringing down the construction costs, and,
- It will allow potential home buyers to save towards the purchase and payment of an affordable home in a tax-advantaged way through the National Affordable Housing Home Ownership Savings Plan (HOSP) while also allowing employers to participate in the provision of Housing as per section 31 of the Employment Act.
However, since its inception, the National Housing Development Fund has continuously faced legal hurdles, and also the fact that it has received heavy opposition from the Kenyan public, all of which have derailed its operationalization process. The key issues being raised include:
- Perceived burden on those who already own homes or are currently servicing a mortgage,
- Increased wage bill for employers,
- Imposition on the formal sector alone, and not the whole public,
- Lack of broad-based public support for the initiative, and,
- The ballot-based system means not all contributors will benefit from the scheme. The government aims to deliver 500,000 homes against at least 2.5 mn contributing Kenyans, therefore leaving 2.0 mn out of the affordable housing programme.
The housing shortage in Kenya has partly been due to developers shying away from the market due to relatively high costs of capital which ultimately lead to home prices that are out of reach for most Kenyans while buyers’ biggest challenge has been availability of affordable home financing. The Housing Fund will help the market handle these obstacles by providing capital at affordable rates while the state master developer, NHC, will be developers’ point of contact from the end-buyers side thereby ensuring they recoup their investments.
- Case Study: Nigeria National Housing Fund
There have been several housing funds in Africa, aimed at enhancing housing ownership. The funds differ mainly in terms of the structure as some are solely funded by the target beneficiaries usually through a levy, while others are also funded by the government and/or institutions such as banks, insurance companies and pension fund administrators. Some of the housing funds in Africa include;
- Cameroon Housing Fund established in 1977,
- Mchenga Housing Fund in Malawi, founded in 2003,
- The proposed Ghana National Housing Fund which was recently introduced though the National Housing Policy and is expected to be established during the year (2019), and
- The Nigeria National Housing Fund established through the NHF Act of 1992.
For our case study, we will focus on the Nigeria National Housing Fund mainly because of its similarity in structure to Kenya’s National Housing and Development Fund. In both cases, funds are mainly raised through a housing levy, and the same act as a saving for employees aimed towards house ownership.
Introduction: Nigeria National Housing Fund
It is estimated that Nigeria has a deficit of 17 mn to 20 mn houses as of 2018, according to a report by Housing Finance Africa against a national population of 190.9 mn (2017). Formal housing production is at approximately 100,000 units p.a. and this is highly inadequate as at least 1,000,000 units are needed annually to bridge the existing housing deficit by government’s target date of 2033. The major issues that continue to affect housing in Nigeria include; constraints related to the high cost of securing and registering secure land title, inadequate access to finance, slow administrative procedures, and the high cost of land. The mortgage finance industry in Nigeria is still in its infancy stages, targeting primarily high-income earners and largely excluding middle and low-income earners. In addition, for the majority of Nigerians, mortgage finance is not an option due to the lack of a robust land tenure and financial system, and because loan repayment costs remain high.
The National Housing Fund (NHF) was established through the NHF Act of 1992 with the aim of facilitating the provision of affordable housing for Nigerians. Under the NHF law, every Nigerian earning a minimum wage of N 30,000 (Kshs 8,392.3, USD 83.0) or more per month was required to contribute 2.5% of their monthly basic salary to the NHF. The funds mobilized would be made available to home-buyers at affordable interest rates of 6.0% compared to average cost of credit of 16.0%- 28.0% to finance home purchases. With the aim of providing additional sources of funding for the financing of housing development in Nigeria, the act was repealed, and the National Assembly passed the National Housing Fund (Establishment) Act 2018. Act, Cap N45.
According to the new law;
- individuals earning from the minimum wage mark contribute 2.5% of their monthly income,
- banks, insurance companies and pension fund administrators contribute 10.0% annual profit before tax to a poll for affordable housing building,
- the revised version also introduced a sustainable development levy to be paid on locally produced and imported cement, that is a 2.5% tax on every bag of cement,
- the funds mobilized are made available to contributors at affordable interest rates to build homes,
- just like the pension and personal income tax contributions, the National Housing Fund is compulsory for a public worker, a private worker or self-employed individuals earning above minimum wage,
- Non-compliance attracts a penalty of N100 million (Kshs 28.1 mn) for corporates and N10m (Kshs 2.8 mn) for individuals. Sanctions include cancellation of operating licenses of banks, insurance companies and PFAs for violations, and,
- Withdrawal of funds is allowed for contributors who have attained the age of 60 years or 35 years of service at interest rate of 2.0% per annum. Key to note, the Fund and any refund of contributions are exempted from payment of taxes.
The Funds are managed and administered by the Federal Mortgage Bank of Nigeria, which ensures that (a) the proceeds from the Fund are utilized to finance the housing sector of the economy through wholesale mortgage lending to primary mortgage institutions, and (b) the aims, objectives and functions of the Fund are effectively carried out by the bank and mortgage institutions.
The aims and objectives of the Fund include:
- To facilitate the mobilization of the Fund for the provision of houses for Nigerians at affordable prices,
- ensure the constant supply of loans to Nigerians for the purpose of building, purchasing and improvement of residential houses,
- providing incentives for the capital market to invest in property development,
- encourage the development of specific programs that would ensure effective financing of housing development, in particular low-cost housing for low income workers,
- Provide proper policy control over the allocation of resources and funds between the housing sector and other sectors of the Nigerian economy, and
- Provide long-term loans to mortgage institutions for on-lending to contributors to the Fund.
Shortcomings of the Nigeria NHF
The Fund has faced various problems making the purpose of the programme unachievable in addition to making it less credible to the Nigerian population.
Some these shortcomings include;
- Non-compliance by intended contributors (corporate and individual) and non-remittance of the deductions made by employers,
- Reduced assistance by the government towards the Fund- other than the earlier equity contribution, the government has not allocated any finances to the fund. In addition, it has also failed to help enforce compliance of its laws and compel contributions from persons and institutions,
- Less profits for shareholders- the requirement to have commercial/merchant banks, insurance companies, and Pension Fund Associations (PFAs) invest 10.0% of their gross profits in the Fund, means that the expenses of these companies will increase thus leading to a lower net profit and in turn, lead to less returns for shareholders,
- Lack of transparency in the management of the Fund and constraints to access by the intending applicants- The problems of the Fund have revolved around credibility that arise from Nigerians not believing in its objectives and the perceived possible maladministration of contributions by the managers, The Federal Mortgage Bank of Nigeria. The Fund has generally not been successful in its 27 years of operations in spite of the contributions it has received from the public and has failed to rise to the challenge of aiding Nigerians to own their own accommodation,
- Its failure to resolve issues on land ownership and titles as Nigeria lacks readily available and accurate data describing property boundaries and ownership, and,
- Counter-Intuitive Approach to the affordable housing initiative by introducing a 2.5% tax on a bag of cement, thus increasing housing development costs.
Conclusion on the Nigerian National Housing Fund
While the formation of the NHF was well intentioned, availability of funds alone will not solve the myriad of challenges facing the housing sector, which centre mostly on policies and regulations. Through the National Policy on Housing (2006) the Nigeria Federal Government intended to provide 1.0 mn affordable housing units per annum to address the housing deficit. However, as at January 2015, only 60,000 housing units had been provided despite average monthly contribution of N2.4 bn (Kshs. 675 mn, USD 6.7 mn) by its over 4.0 mn subscribers representing only about 1.5% penetration, according to online sources. Therefore, the main objective of NHF should not be just to make funding available for housing, but to create an environment that makes affordable housing possible. To achieve this, Nigeria and other developing countries, must adopt a holistic approach to the challenges facing the sector of which financing is only a component. The fact that there is no marked progress to show for the 27-years of establishing the NHF is proof that Nigeria’s housing problem cannot be solved by simply throwing more money at the problem.
- Recommendations on the Structure of NHDF
Drawn from the structure and operationalization of the Nigeria NHF, there are several issues that need to be looked into for the Kenya National Housing Development Fund (NHDF) to be fruitful. We therefore recommend the following action points:
- Compliance: To ensure the fund is successful and achieves the set objectives, it is important that the government puts into place systems or policies to enhance compliance for the realization of the pool of funds. This especially applies to the private sector where employers are likely to avoid making the contributions which would then mean their employees do not get to benefit from the initiative. In the case of Nigeria, one of the main challenges facing the initial NHF was non-compliance by intended contributors (corporate and individual) and non-remittance of the deductions made by employers. However, the revised bill introduced penalties and suctions with the aim of driving compliance,
- Creation of Awareness: The NHDF should ensure there is sufficient knowledge on the fund among the target contributors. Without adequate knowledge, the fund is likely to face resistance by the target contributors and thus low compliance and eventually inability of the fund to raise the targeted pool of funds. Currently the fund is facing legal hurdles in its implementation following petition against the housing levy by worker’s unions such as Central Organization of Trade Unions (COTU) and Federation of Kenya Employers (FKE), in addition to opposition from the Kenyan public, all of which have derailed its operationalization process,
- Proper Fund Management: Kenya’s NHDF should put into place well outlined management strategy for the funds aimed at enhancing transparency especially during the allocation of the houses and refund of the funds for contributors who will not be allocated houses. In addition, the fund should ensure that the funds are made accessible to the contributors as planned without constrain as with the Nigeria NHF where there was alleged poor record keeping by the Federal Mortgage Bank of Nigeria (FMBN) and the authority charged for the sole responsibility and cumbersome bureaucratic bottlenecks of getting a loan from it. Despite having received contributions from the public for 27-years, the Nigeria National Housing Fund has generally not been successful, with the key problems being lack of credibility by Nigerians not believing in its objectives and perceived possible maladministration of contributions by the managers, The Federal Mortgage Bank of Nigeria. While NHDF is ready to collect funds were it not for the court order, the fund does not yet have in place the typical fund management structures such as the Board of Trustee or a corporate trustee, a custodian, and administrator. Without a proper governance structure, the fund can easily run into the challenges that Nigeria ran into,
- Equitable Access to Benefits: The fund needs to come up with a more equitable or rational way to access the benefits, as one of the features that has really put off the Kenyan public is the access through a lottery system,
- Working on Enhancing Private Sector Funding to Supplement Government Funding: So far, most of the efforts for capital formation have been mainly around public sector funding through taxation. The government should also enhance policies that will catalyse private sector fund formation through real estate sector unit trust funds, development REITs and real estate asset back securities. Private capital markets have an important role to play; we need to focus on how to bring on board private sector funds into the initiative.
In conclusion, we are of the view that the Kenya National Housing and Development Fund is a great move by the government towards the actualization of provision of affordable housing in Kenya. If well governed and implemented, we expect the fund to be successful in raising the targeted funds and the same channelled to facilitating housing in the country. However, the fact that there is no marked progress to show for the 27-years of establishing the Nigeria NHF is proof that a country’s housing problem cannot be solved by simply enhancing financial affordability and availability. Therefore, like in Nigeria, it is important that the Kenyan government review applicable regulations and policies, and provides the right environment for private sector investment to supplement the government initiatives. With proper engagement of key stakeholders, Kenya is likely to fix its housing policies and regulatory framework.
Disclaimer: The views expressed in this publication are those of the writers where particulars are not warranted. This publication, which is in compliance with Section 2 of the Capital Markets Authority Act Cap 485A, is meant for general information only and is not a warranty, representation, advice or solicitation of any nature. Readers are advised in all circumstances to seek the advice of a registered investment advisor.

- Talk to us
- Kenya
- P.O Box 20695 - 00200, Nairobi, Kenya
- Cell +254709101200
- Tel +254709101200
- WhatsApp +254741676635
- United States
- +254709101200
- DOWNLOAD OUR APP
-


- Kenya
- 8th Floor, Pinetree Plaza, Kaburu Drive, Ngong Road, Nairobi, Kenya
- USA
- Suite 1150, 1775 Eye Street NW, USA, Washington DC 20006, USA
- Investments
- High Yield
- Private Equity
- Real Estate
- Real Estate
- RiverRun Estates
- Cytonn Towers
- The Ridge
- Taraji Heights
- The Alma