Performance by Retirement Benefits Schemes in Kenya & Cytonn Weekly #10_2019
By Cytonn Research Team, Mar 10, 2019
Executive Summary
Fixed Income
T-bills were undersubscribed during the week, with the overall subscription rate coming in at 90.9%, a rise from 78.2% recorded the previous week. The continued undersubscription is attributable to the relative tight liquidity conditions in the money market during the week due to tax payments, with Pay As You Earn (PAYE) due on the 9th of every month. The yields on the 91-day, 182-day, and 364-day papers remained unchanged at 6.9%, 8.3%, and 9.5%, respectively. According to the Stanbic Bank’s Monthly Purchasing Manager’s Index (PMI), the business environment in the country improved at a slower rate in February 2019. The seasonally adjusted PMI came in at 51.2 in February, a decline from 53.2 recorded in January. A PMI reading of above 50 indicates improvements in the business environment, while a reading below 50 indicates a worsening outlook;
Equities
During the week, the equities market recorded mixed performances, with NASI and NSE 25 gaining by 2.1% and 2.2%, respectively, while NSE 20 remained flat, taking their YTD performance to gains of 8.8%, 2.0% and 7.6%, for NASI, NSE 20 and NSE 25, respectively. KCB Group released their FY’2018 financial results, recording a 21.8% growth in core earnings per share to Kshs 7.8, from Kshs 6.4 in FY’2017;
Private Equity
In the financial services sector, Sidian Bank, a Kenyan Tier 3 bank, has received a USD 12.0 mn (Kshs 1.2 bn) Tier II capital injection from the Investment Fund for Developing Countries (IFU), a Danish Development Finance Institution (DFI). The funds are expected to boost the bank’s regulatory capital ratios as it works towards achieving its strategic objective of becoming a Tier 2 bank by 2022. The bank’s total capital to total risk-weighted assets ratio was 14.0% as at Q3’2018, which is below the minimum statutory requirement of 14.5% for banks. The funds will also enable the bank further its mission to empower entrepreneurs through the strategic growth of its loan book with a key focus on SMEs;
Real Estate
During the week, Knight Frank released the Wealth Report 2019, highlighting investment trends of High Net-Worth Individuals (HNWIs) in 2018, and the performance of luxury properties in 100 cities through the Prime International Residential Index (PIRI 100). In the residential sector, Actis, a private equity firm with a key focus on Africa, and Shapoorji Pallonji Real Estate (SPRE), an Indian real estate firm, announced a joint venture to build affordable and middle-income homes in Kenya, while in the retail sector, Bata Shoe Company opened an outlet at The Hub Mall in Karen;
Focus of the Week
The Retirement Benefits Industry in Kenya has registered significant growth in its Assets Under Management (AUM) to Kshs 1.2 tn in June 2018, from Kshs 287.7 bn in 2008. This growth has been driven by increased membership into various Retirement Benefits Schemes as a result of the Retirement Benefits Authority’s initiatives to increase pension penetration, currently at 15.0% of the adult population, by educating the public on the importance of saving for retirement, combined with increased contributions by members as the investing population continues to grow. Part of this growth has also been attributed to the positive performance by Fund Managers, as investments returns are accrued to the schemes for the benefit of members. In this week’s focus note, we will analyze the 2018 performance by Fund Managers of Retirement Benefits Schemes, following reports released by Zamara (Formerly Alexander Forbes), and Actserve (Actuarial Services Company) on the 2018 returns declared by Fund Managers.
- This week on Monday, Cytonn Asset Managers Limited, CAML, our regulated affiliate, will formally launch its operations into the regulated products market, having received all key approvals - the CMA Fund Manager License, the RBA Pensions Fund Manager License and the CMA REIT Manager license. CAML will also launch the Cytonn Money Market Fund into the Market on Monday;
- Patricia Wachira – Research Associate, was on KTN News to discuss the Government’s housing agenda and its viability. Watch Patricia here;
- Joyce Wacu Mbugua – Research Assistant, was on KBC to discuss affordable housing agenda by the Kenyan Government. Watch Joyce here;
- For an exclusive tour of the developments, visit: Sharp Investor’s Tour and for more information, email us at sales@cytonn.com;
- Following the recent approval by Retirement Benefits Authority (RBA), for Cytonn Asset Managers to manage pension funds, we are looking for business development consultants and agents with networks in the pensions industry to build our pensions business at very attractive commissions. If interested in being an agent or know someone who can be an agent, kindly contact us at pensions@cytonn.com;
- In an effort to continue to expand our distribution reach, we are looking for Independent Financial Advisors / Independent Sales Agents for the following towns: Mombasa, Eldoret, Thika, Meru, Nanyuki, Nakuru, Kisumu and Machakos. If you are interested or know someone who is interested, kindly email us at ifa@cytonn.com.
- Following the completion and handover of Amara Ridge in Karen, we have now launched our next Karen project, dubbed Applewood, a Kshs 2.5 bn residential development located in Miotoni, Karen. This signature development shall comprise luxury homes, each sitting on 1/2 acre. We invite you to the exhibition of Applewood which is ongoing at the Amara Ridge Clubhouse (Location pin: https://goo.gl/maps/B3GVnu8pHyn) from 9:00 am to 5:00 pm daily. Call 0709 101 000 or email resales@cytonn.com to reserve a villa! See Video here;
- We continue to hold weekly workshops and site visits on how to build wealth through real estate investments. The weekly workshops and site visits target both investors looking to invest in real estate directly and those interested in high yield investment products to familiarize themselves with how we support our high yields. Watch progress videos and pictures of The Alma, Amara Ridge, and The Ridge. Key to note is that our cost of capital is priced off the loan markets, where all-in pricing ranges from 16.0% to 20.0%, and our returns on real estate developments ranges from 23.0% to 25.0%, hence our top-line gross spread is about 6.0%. If interested in attending the site visits, kindly register here;
- We continue to see very strong interest in our weekly Private Wealth Management Training (largely covering financial planning and structured products). The training is at no cost and is open only to pre-screened participants. We also continue to see institutions and investment groups interested in the training for their teams. Cytonn Foundation, under its financial literacy pillar, runs the Wealth Management Training. If interested in our Private Wealth Management Training for your employees or investment group, please get in touch with us through wmt@cytonn.com. To view the Wealth Management Training topics, click here;
- For recent news about the company, see our news section here;
- We have 10 investment-ready projects, offering attractive development and buyer targeted returns of around 23.0% to 25.0% p.a. See further details here: Summary of Investment-Ready Projects;
- We continue to beef up the team with ongoing hires for Financial and Real Estate Advisors for our offices in Nairobi, Nakuru, Kisumu, and Nyeri. Visit the Careers Section on our website to apply.
T-Bills & T-Bonds Primary Auction:
T-bills were undersubscribed during the week, with the overall subscription rate coming in at 90.9%, a rise from 78.2% recorded the previous week. The continued under subscription is attributable to the relatively tight liquidity conditions in the money market during the week due to tax payments, with Pay As You Earn (PAYE) due on the 9th of every month. The yields on the 91-day, 182-day, and 364-day papers remained unchanged at 6.9%, 8.3%, and 9.5%, respectively. The acceptance rate for T-bills dropped to 89.4%, from 90.0% the previous week, with the government accepting Kshs 19.5 bn of the Kshs 21.8 bn worth of bids received. The subscription rate for the 91-day paper and 182-day paper declined to 16.9% and 61.4%, from 73.4% and 77.6% recorded the previous week, respectively, while the subscription rate for the 364-day paper gained to 149.9%, from 80.8% recorded the previous week, with investors’ participation being skewed towards the longer dated paper.
Liquidity:
The average interbank rate decreased to 3.8%, from 4.4% the previous week, pointing to improved liquidity in the market, while the average volumes traded in the interbank market decreased by 45.6% to Kshs 10.3 bn, from Kshs 18.9 bn the previous week. Despite the slight improvement from the previous week, liquidity conditions remained tight attributable to tax payments with PAYE due during the week.
Kenya Eurobonds:
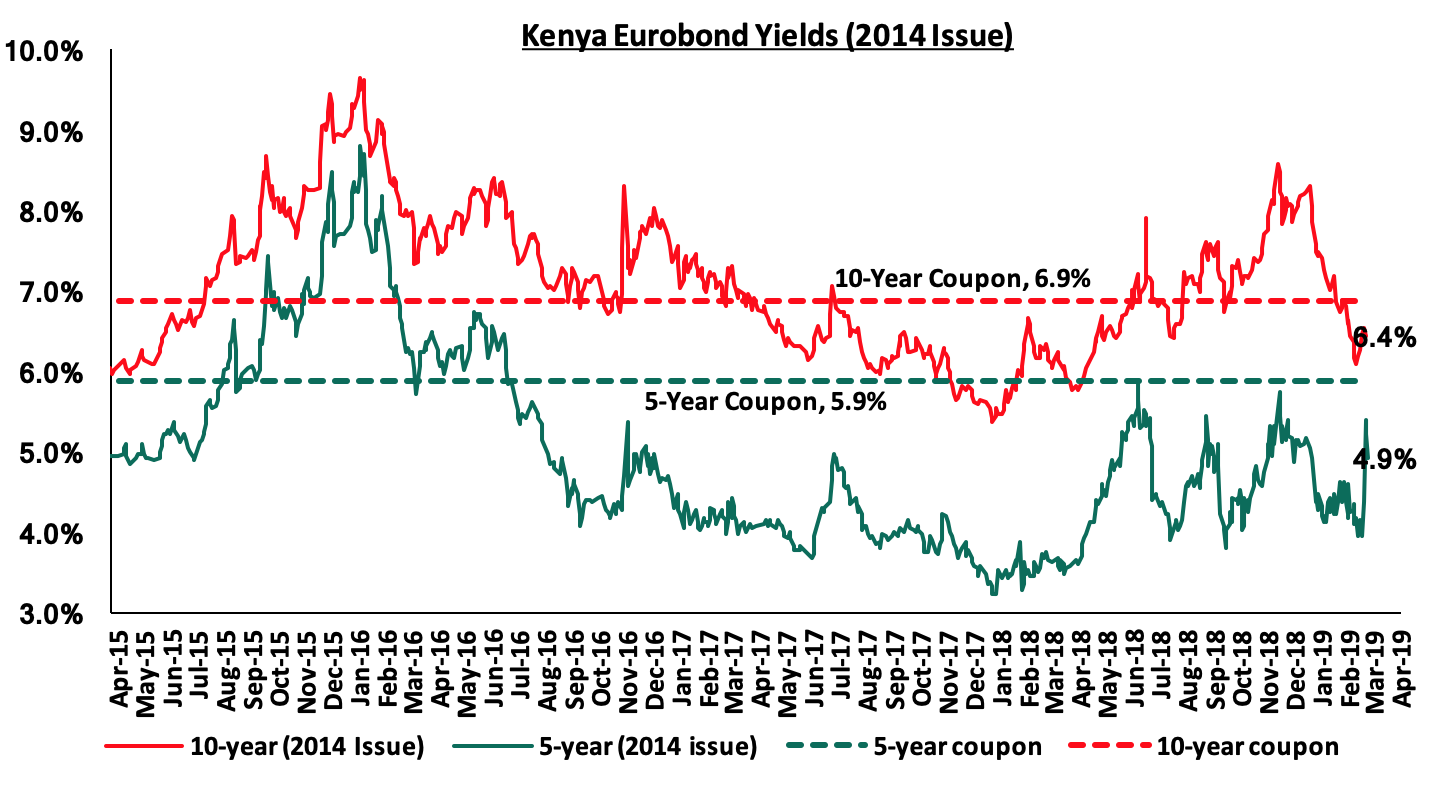
According to Bloomberg, the yield on the 10-year and 5-year Eurobonds issued in 2014 gained by 0.1% points and 0.9% point to 6.4% and 4.9% from 6.3% and 4.0%, the previous week, respectively. Since the mid-January 2016 peak, yields on the Kenyan Eurobonds have declined by 3.9% points and 3.2% points for the 5-year and 10-year Eurobonds, respectively, an indication of the relatively stable macroeconomic conditions in the country. Key to note is that these bonds have 0.7-years and 5.7-years to maturity for the 5-year and 10-year, respectively.
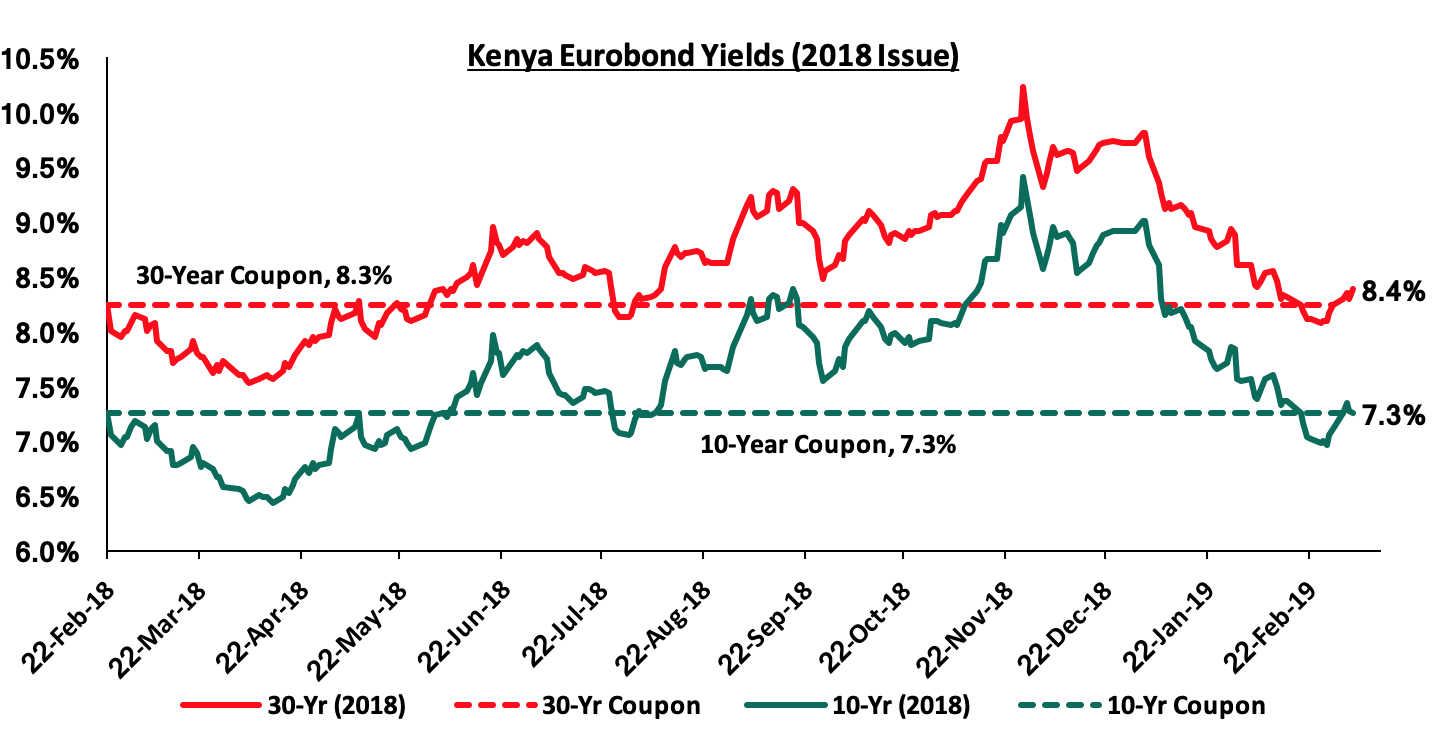
For the February 2018, Eurobond issue, during the week, the yields on both the 10-year and 30-year Eurobonds gained by 0.2% points to 7.3% and 8.4%, from 7.1% and 8.2% the previous week, respectively. Since the issue date, the yield on the 10-year Eurobond has remained constant while the yield for the 30-year Eurobond has increased by 0.1% points.
The Kenya Shilling:
During the week, the Kenya Shilling gained by 0.3% against the US Dollar to Kshs 99.7, the strongest level since 3rd July 2015, from Kshs 100.0 the previous week. The Kenya Shilling’s performance was supported by ample dollar supply from offshore portfolio investors buying government debt amid weak dollar demand from the energy sector. The Kenya Shilling has appreciated by 2.1% year to date, and in our view the shilling should remain relatively stable to the dollar in the short term, supported by:
- The narrowing of the current account deficit to 5.1% in the 12-months to November 2018, from 6.5% in November 2017, attributed to improved agriculture exports, increased diaspora remittances, strong receipts from tourism, and lower food and SGR-related equipment relative to 2017,
- Improving diaspora remittances, which increased by 38.6% in 2018 to USD 2.7 bn, from USD 1.9 bn recorded in 2017. The rise is due to;
- Increased uptake of financial products by the diaspora due to financial services firms, particularly banks, targeting the diaspora, and,
- New partnerships between international money remittance providers and local commercial banks making the process more convenient,
- CBK’s activities in the money market, such as repurchase agreements and selling of dollars, and,
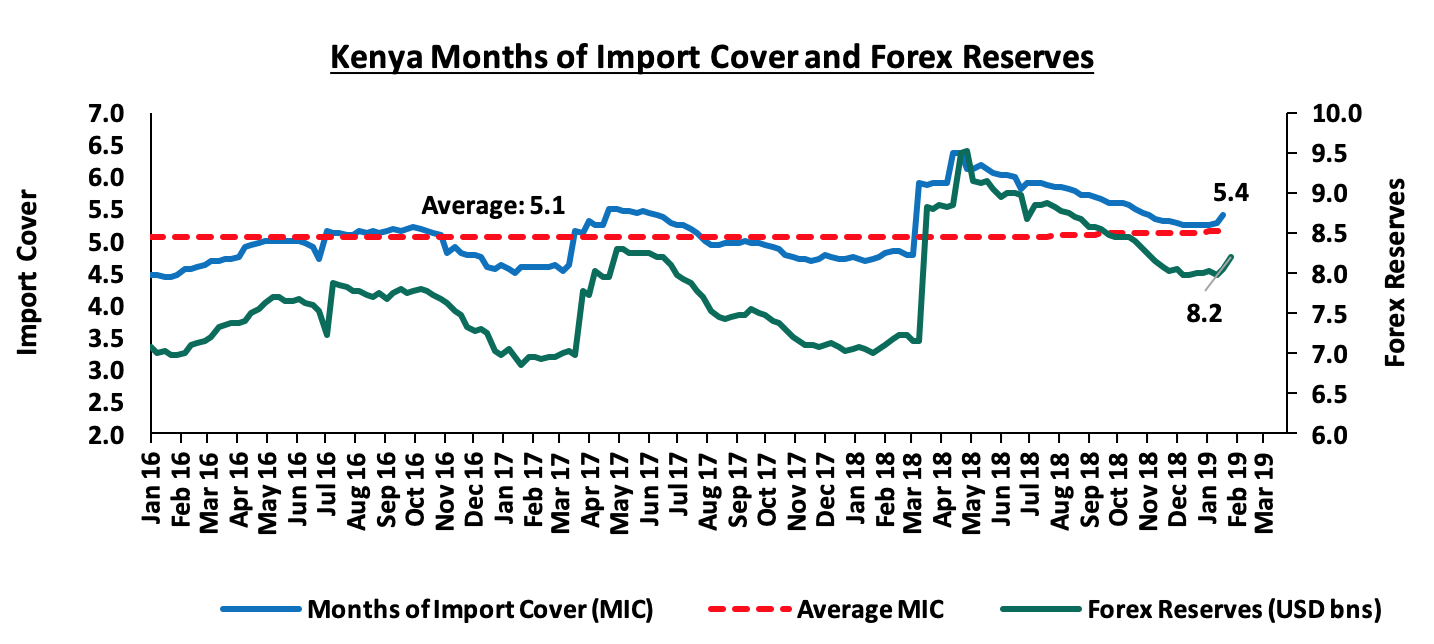
- High levels of forex reserves, currently at USD 8.2 bn, equivalent to 5.4-months of import cover, compared to the one-year average of 5.1 months, as highlighted below:
Highlights of the Week:
According to Stanbic Bank’s Monthly Purchasing Manager’s Index (PMI), the business environment in the country improved at a slower rate in February 2019. The seasonally adjusted PMI came in at 51.2 in February, a decline from 53.2 recorded in January, an indication of only a modest improvement in the health of the Kenyan private sector economy. A PMI reading of above 50 indicates improvements in the business environment, while a reading below 50 indicates a worsening outlook. The decline in the PMI was attributed to a slowdown in the growth of new orders with 25% of firms surveyed seeing a fall in sales owing to easing demand in the domestic economy. Foreign sales however increased as new export order growth increased to a 4-month high, driven by the influx of new business and stronger client bases. The overall weaker demand instigated slower output growth for Kenyan firms in February, driven by cash flow problems and unfavorable weather conditions. Despite the rise in new orders, employment continued to grow at a moderate rate in February. Selling prices charged by Kenyan private sector firms were broadly unchanged in February, following 14 months of successive increases. Input prices increased albeit at the slowest rate in 16 months attributed to cooling inflationary pressures but were offset by increases in food and raw material prices as well as the impact of taxation on input costs. We expect the business environment to improve going forward supported by improved purchasing activity due to suppressed inflation with the expectations of lower international oil prices as well as improved weather conditions following the conclusion of the first quarter of the year usually associated with dry weather.
Rates in the fixed income market have remained stable as the government rejects expensive bids, as it is currently 2.3% ahead of its domestic borrowing target for the current financial year, having borrowed Kshs 225.6 bn against a pro-rated target of Kshs 220.6 bn. However, a budget deficit is likely to result from depressed revenue collection, creating uncertainty in the interest rate environment as additional borrowing from the domestic market goes to plug the deficit. Despite this, we do not expect upward pressure on interest rates due to increased demand for government securities, driven by improved liquidity in the market owing to the relatively high debt maturities. Our view is that investors should be biased towards medium-term fixed income instruments to reduce duration risk associated with long-term debt, coupled with the relatively flat yield curve on the long-end due to saturation of long-term bonds.
Market Performance:
During the week, the equities market recorded mixed performances with NASI and NSE 25 gaining by 2.1% and 2.2%, respectively, while NSE 20 remained flat, taking their YTD performance to gains of 8.8%, 2.0%, and 7.6%, for NASI, NSE 20 and NSE 25, respectively. The performance in NASI was driven by gains in large-cap stocks such as EABL, KCB Group and Safaricom, which gained by 10.7%, 4.8%, and 3.6%, respectively.
Equities turnover rose by 123.6% during the week to USD 55.8 mn, from USD 24.7 mn the previous week, taking the YTD turnover to USD 350.6 mn. Foreign investors turned net buyers for the week, with a net buying position of USD 4.6 mn, a positive shift from last week’s net selling position of USD 1.1 mn.
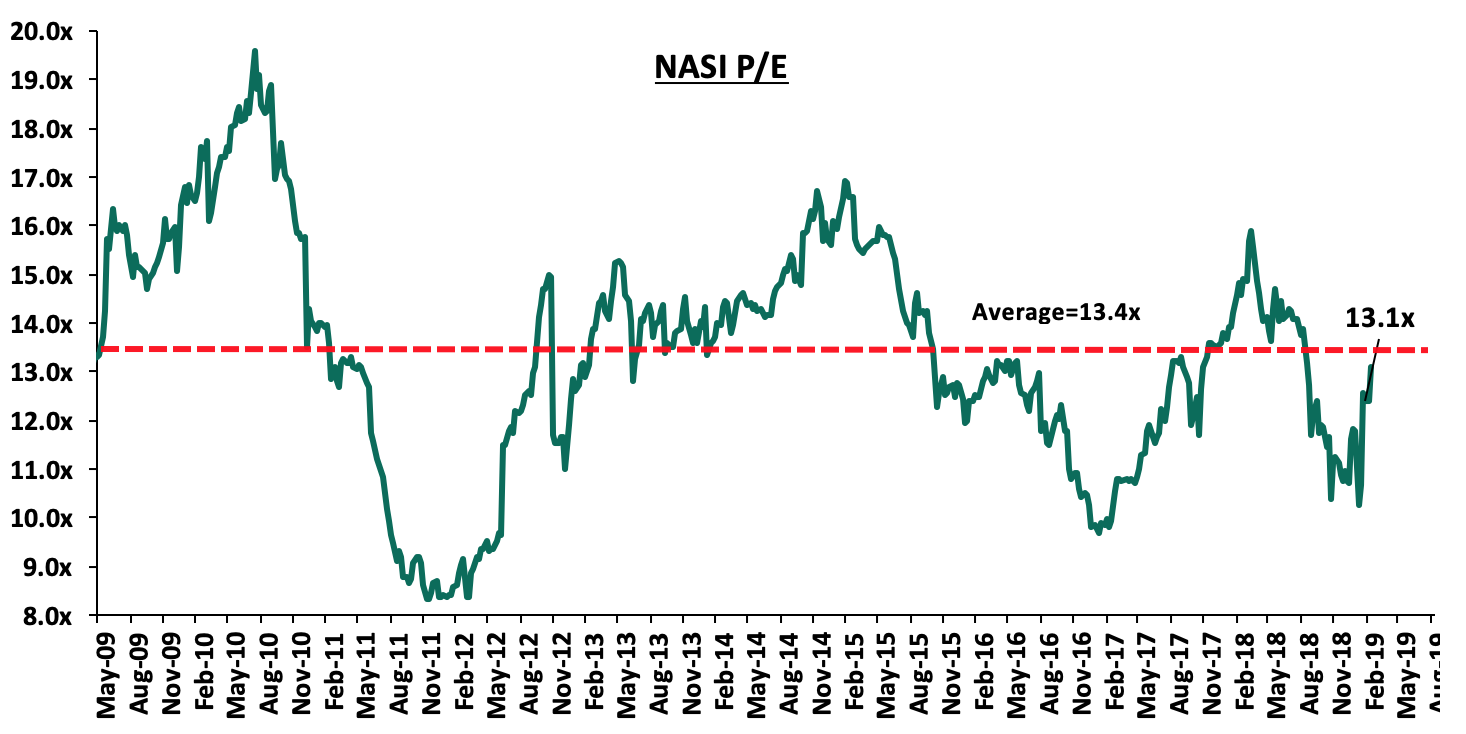
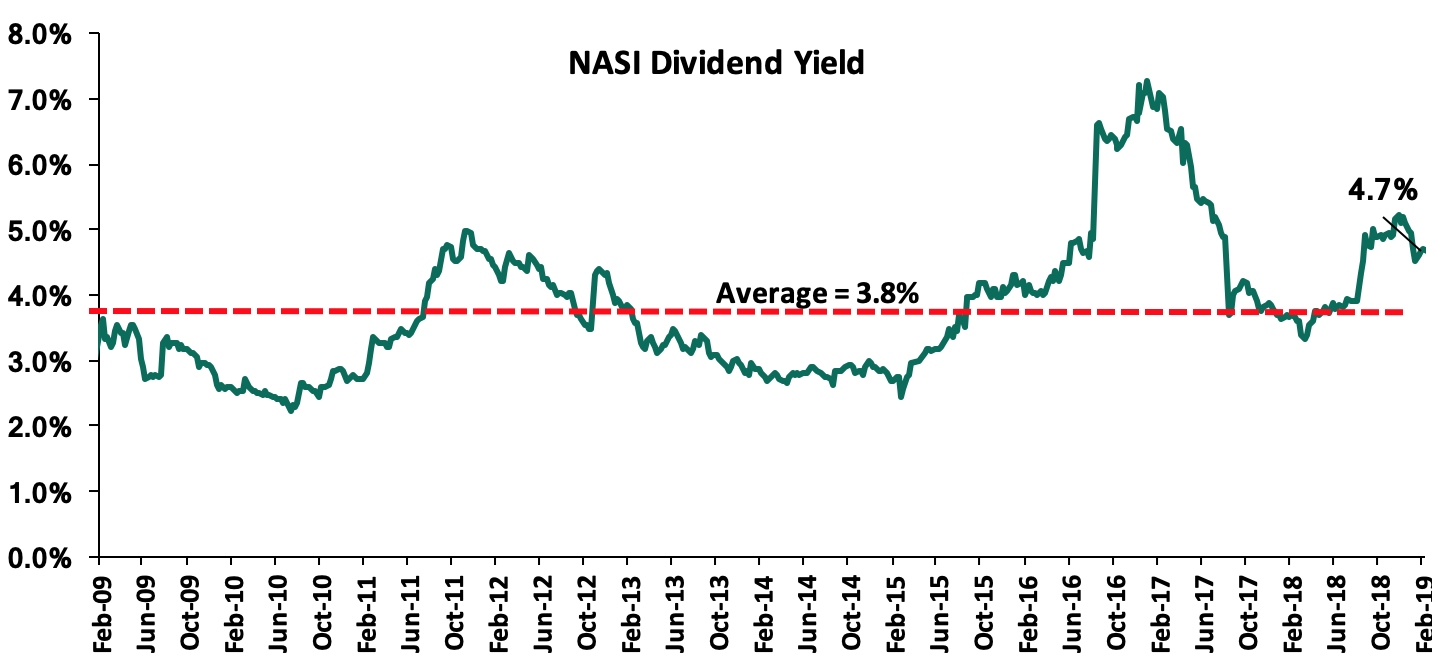
The market is currently trading at a price to earnings ratio (P/E) of 13.1x, 2.2% below the historical average of 13.4x, and a dividend yield of 4.7%, above the historical average of 3.8%. With the market trading at valuations below the historical average, we believe there is value in the market. The current P/E valuation of 13.1x is 35.1% above the most recent trough valuation of 9.7x experienced in the first week of February 2017, and 57.8% above the previous trough valuation of 8.3x experienced in December 2011. The charts below indicate the historical P/E and dividend yields of the market.
Earnings Releases
During the week, KCB Group released its FY’2018 financial results. Core earnings per share increased by 21.8% to Kshs 7.8, from Kshs 6.4 in FY’2017, above our expectation of a 19.4% increase to Kshs 7.7. The performance was driven by a 0.6% increase in total operating income, coupled with a 10.2% decline in total operating expenses. The variance in core earnings per share growth against our expectations was largely due to the 10.2% decline in total operating expenses to Kshs 37.9 bn, from Kshs 42.3 bn in FY’2017 largely driven by the 50.2% decline in Loan Loss Provisions (LLP) to Kshs 2.9 bn from Kshs 5.9 bn, which exceeded our expectation of a 4.2% decline. Highlights of the performance from FY’2017 to FY’2018 include:
- Total operating income increased marginally by 0.6% to Kshs 71.8 bn from Kshs 71.4 bn in FY’2017. This was due to a 0.9% increase in Net Interest Income (NII) to Kshs 48.8 bn, from Kshs 48.4 bn in FY’2017, while Non-Funded Income (NFI) declined marginally by 0.1% to Kshs 22.97 bn, from Kshs 23.0 bn in FY’2017,
- Interest income rose by 4.1% to Kshs 66.3 bn, from Kshs 63.7 bn in FY’2017. This was driven by a 5.0% growth in interest income from government securities to Kshs 13.0 bn, from Kshs 12.4 bn in FY’2017, and a 3.7% increase in interest income on loans and advances to Kshs 52.7 bn, from Kshs 50.8 bn in FY’2017. The yield on interest-earning assets, however, declined to 11.2%, from 11.5% in FY’2017, attributed to a decline in yields on government securities as well as a decline in lending rates due to the two Central Bank Rate (CBR) cuts in 2018. Furthermore, interest-earning assets grew at a faster rate as compared to interest income, rising by 5.5% to Kshs 608.0 bn from Kshs 576.0 bn in FY’2017,
- Interest expense increased by 14.1% to Kshs 17.5 bn from Kshs 15.3 bn in FY’2017, following a 13.6% increase in the interest expense on customer deposits to Kshs 15.5 bn from Kshs 13.6 bn in FY’2017. Interest expense on deposits and placements from banking institutions increased by 18.7% to Kshs 2.0 bn, from Kshs 1.7 bn in FY’2017. The cost of funds thus rose to 3.2% from 3.0% in FY’2017, as the bank sought to support deposit growth amidst tight liquidity in the money market. As a consequence, the Net Interest Margin (NIM) declined to 8.2%, from 8.5% in FY’2017,
- Non-Funded Income (NFI) declined marginally by 0.1% to Kshs 22.97 bn, from Kshs 23.0 bn in FY’2017. The decline was mainly driven by a 25.3% reduction in other fees and commissions to Kshs 6.8 bn, from Kshs 9.1 bn in FY’2017, largely due to a slowdown in NFI growth from the bank’s regional subsidiaries, coupled with the implementation of the Effective Interest Rate (EIR) under IFRS 9, which saw the bank amortize fees charged on loans over future period of a loan’s tenor. As a result, the revenue mix remained unchanged at 68:32 funded to non-funded income,
- Total operating expenses declined by 10.2% to Kshs 37.9 bn, from Kshs 42.3 bn, largely driven by a 50.2% decline in Loan Loss Provisions (LLP) to Kshs 2.9 bn in FY’2018, from Kshs 5.9 bn in FY’2017, coupled with an 11.2% decline in staff costs to Kshs 17.0 bn in FY’2018, from Kshs 19.1 bn in FY’2017. The decline in staff costs was due to the reduction in the number of staff to 6,220 staff in FY’2018 from 6,483 staff in FY’2017, following the staff rationalization programme, that cost the bank Kshs 2.0 bn, and resulted in the layoff of 709 staff,
- Consequently, the Cost to Income Ratio (CIR) improved to 52.8%, from 59.2% in FY’2017. Without LLP, the cost to income ratio also improved to 48.7%, from 50.9% in FY’2017,
- Profit before tax increased by 16.3% to Kshs 33.9 bn, up from Kshs 29.1 bn in FY’2017. Profit after tax grew by 21.8% to Kshs 24.0 bn in FY’2018, from Kshs 19.7 bn in FY’2017, as the effective tax rate declined to 33.3% from 34.8% in FY’2017,
- The bank recommends a final dividend of Kshs 2.5 per share, having already paid an interim dividend of Kshs 1.0 per share, translating to a total dividend payout of Kshs 3.5 per share, a 16.7% rise from the Kshs 3.0 paid in FY’2017, and translates to a dividend yield of 8.0%,
- The balance sheet recorded an expansion as total assets increased by 10.5% to Kshs 714.3 bn from Kshs 646.7 bn in FY’2017. This growth was largely driven by a 9.1% increase in government securities to Kshs 120.1 bn, from Kshs 110.0 bn in FY’2017, coupled with a 7.9% increase in their loan book to Kshs 455.9 bn from Kshs 422.7 bn in FY’2017, which management attributed to a growth in the corporate loan book,
- Total liabilities rose by 11.1% to Kshs 600.7 bn from Kshs 540.7 bn in FY’2017, driven by an 82.1% increase in Placement Liabilities to Kshs 20.1 bn from Kshs 11.0 bn in FY’2017, coupled with a 50.7% increase in Borrowings to Kshs 22.5 bn from Kshs 14.9 bn in FY’2017. The increase in borrowings is attributed to the receipt of the first tranche of the USD 80.0 mn of the USD 100 mn line of credit advanced by the African Development Bank (AfDB) following a deal signed by the two institutions in 2017,
- Customer deposits increased by 7.6% to Kshs 537.5 bn from Kshs 499.6 bn in FY’2017. Deposits per branch increased by 10.0% to Kshs 2.1 bn from Kshs 1.9 bn in FY’2017, owing to a reduction in the number of branches to 258 from 263 in FY’2017,
- The faster growth in loans as compared to deposits led to a marginal rise in the loan to deposit ratio to 84.8% from 84.6% in FY’2017,
- Gross Non-Performing Loans (NPLs) declined by 12.8% to Kshs 32.7 bn in FY’2018 from Kshs 37.5 bn in FY’2017. As a consequence, the NPL ratio improved to 6.9% in FY’2018 from 8.4% in FY’2017. The NPL coverage declined to 56.6% in FY’2018 from 67.9% in FY’2017, as provisions declined at a faster rate than the NPLs,
- Shareholders’ funds increased by 7.3% to Kshs 113.7 bn in FY’2018 from Kshs 106.0 bn in FY’2017, as retained earnings grew by 23.5% y/y to Kshs 85.2 bn from Kshs 69.0 bn in FY’2017,
- KCB Group is currently sufficiently capitalized with a core capital to risk-weighted assets ratio of 18.1%, 7.6% above the statutory requirement of 10.5%. In addition, the total capital to risk-weighted assets ratio was 19.5%, exceeding the statutory requirement of 14.5% by 5.0%. Adjusting for IFRS 9, the core capital to risk-weighted assets stood at 21.3%, while total capital to risk-weighted assets came in at 18.8%,
- The bank currently has a Return on Average Assets (ROaA) of 3.6%, and a Return on Average Equity (ROaE) of 21.9%.
Key Take-Outs:
- The bank’s asset quality improved, with the NPL ratio improving to 6.9% from 8.4% in FY’2017. The improved NPL ratio was mainly attributed to an improvement in the corporate loan book’s NPL ratio to 8.5% in FY’2018 from in 11.0% in ’2017, as well as the SME and Micro loan book, which improved to 13.0% in FY’2018, down from 16.4% in FY’2017. With the ongoing economic recovery, the bank’s asset quality is likely to continue improving, across the other segments such as SMEs and the agricultural segments,
- There was subdued Non-Funded Income growth. The decline in NFI’s was largely due to a slowdown in NFI growth from the bank’s regional subsidiaries, coupled with the implementation of the Effective Interest Rate (EIR) under IFRS 9, which saw the bank amortize fees charged on loans over a future period of a loan’s tenor. KCB Group’s NFI contribution to revenue stands at 32.0%, which is 3.0% lower than its peer average of 35.0%. Going forward, however, the Bank expects improved growth in NFI’s since the effects of the rebasing of fees due to the Effective Interest Rate (EIR) application under IFRS 9 is one-off, and,
- Increased innovation and digitization have seen 88.0% of all transactions of the bank being done on alternative channels, with mobile transactions taking up 45.0% of all transactions, while the agency and internet banking contributing 32.0% of all transactions. Increased usage of these channels should aid the bank in expanding its NFI revenue.
For more information, please see our KCB Group FY’2018 Earnings Note
Weekly Highlights
KCB Group has highlighted its intention to venture into Ethiopia, with the country promoting foreign investment in the financial services sector. With the government pledging a speedy resolution of the reform and liberalization process of the banking and telecommunication sectors, the bank is set to strategically position itself to take advantage of the vast market, which is currently being serviced by 16 private and 3 government-owned banks. With a population of more than 105.0 mn, the Ethiopian market presents a vast market for KCB to tap into, and grow its business, by leveraging on its strong capital position and extensive experience on regional expansion, with the bank currently operating in Kenya, Tanzania, Uganda, Rwanda, Burundi, and South Sudan. With their representative office in operation for 4-years in the market, the bank should have a good understanding of the demands and operational structure of the Ethiopian market, which should enable the bank to smoothly deploy its operations in the market. We are thus of the view that with Ethiopia’s economy witnessing increased infrastructure development, and being the fastest growing economy in Africa, with GDP expanding by an average of 10.3% over the last 10-years, this gives the bank a huge market to expand its loan book. Furthermore, given the lack of price controls on loan pricing, this should see the bank expand it topline interest revenue, whose growth has slowed down owing to the implementation of the interest rate cap in Kenya, which is the bank’s largest market. In addition, successful implementation of the bank’s mobile and alternative transaction channels in the Ethiopian market should result in a gradual and rapid expansion of the Non-Interest Revenue, which would be supported by the vastly untapped market. This should consequently boost the bank’s growth and profitability in the long run.
Universe of Coverage
Below is a summary of our SSA universe of coverage:
|
Banks |
Price as at 1/03/2019 |
Price as at 8/03/2019 |
w/w change |
YTD Change |
Target Price* |
Dividend Yield |
Upside/Downside** |
P/TBv Multiple |
|
GCB Bank |
3.5 |
3.8 |
8.5% |
(17.2%) |
7.7 |
10.0% |
112.6% |
0.9x |
|
Diamond Trust Bank |
148.0 |
140.0 |
(5.4%) |
(10.5%) |
283.7 |
1.9% |
104.5% |
0.8x |
|
Access Bank |
5.7 |
6.0 |
5.3% |
(11.8%) |
9.5 |
6.7% |
65.0% |
0.4x |
|
I&M Holdings |
92.0 |
90.0 |
(2.2%) |
5.9% |
138.6 |
3.9% |
57.9% |
0.9x |
|
CRDB |
135.0 |
135.0 |
0.0% |
(10.0%) |
207.7 |
0.0% |
53.9% |
0.5x |
|
UBA Bank |
7.6 |
7.7 |
0.7% |
(0.6%) |
10.7 |
11.1% |
51.0% |
0.5x |
|
KCB Group*** |
41.3 |
44.0 |
6.5% |
17.5% |
61.3 |
8.0% |
47.3% |
1.4x |
|
Zenith Bank |
23.9 |
25.0 |
4.4% |
8.2% |
33.3 |
10.8% |
44.4% |
1.1x |
|
CAL Bank |
1.0 |
1.0 |
0.0% |
0.0% |
1.4 |
0.0% |
42.9% |
0.8x |
|
Equity Group |
40.8 |
41.0 |
0.5% |
17.6% |
56.2 |
4.9% |
42.0% |
2.0x |
|
Co-operative Bank |
14.5 |
14.6 |
0.7% |
2.1% |
19.9 |
5.5% |
41.8% |
1.3x |
|
Ecobank |
7.8 |
7.8 |
0.0% |
3.3% |
10.7 |
0.0% |
38.5% |
1.7x |
|
NIC Group |
36.0 |
37.0 |
2.8% |
33.1% |
48.8 |
2.7% |
34.6% |
1.0x |
|
Stanbic Bank Uganda |
29.0 |
29.0 |
0.0% |
(6.5%) |
36.3 |
4.0% |
29.1% |
2.1x |
|
Barclays Bank |
11.3 |
11.4 |
1.3% |
4.1% |
12.5 |
8.8% |
18.4% |
1.6x |
|
Union Bank Plc |
6.7 |
7.0 |
4.5% |
25.0% |
8.2 |
0.0% |
16.4% |
0.7x |
|
HF Group |
6.0 |
6.0 |
0.0% |
8.3% |
6.6 |
5.8% |
15.8% |
0.2x |
|
Bank of Kigali |
275.0 |
275.0 |
0.0% |
(8.3%) |
299.9 |
5.0% |
14.1% |
1.5x |
|
SBM Holdings |
6.0 |
6.1 |
1.0% |
2.0% |
6.6 |
4.9% |
12.8% |
0.9x |
|
Guaranty Trust Bank |
35.5 |
37.3 |
5.1% |
8.3% |
37.1 |
6.4% |
5.9% |
2.3x |
|
Stanbic Holdings |
95.0 |
93.0 |
(2.1%) |
2.5% |
92.6 |
6.3% |
5.9% |
0.9x |
|
Standard Chartered |
199.0 |
199.0 |
0.0% |
2.3% |
196.3 |
6.3% |
4.9% |
1.6x |
|
Bank of Baroda |
135.0 |
134.0 |
(0.7%) |
(4.3%) |
130.6 |
1.9% |
(0.7%) |
1.2x |
|
Standard Chartered |
21.0 |
21.0 |
0.0% |
0.0% |
19.5 |
0.0% |
(7.3%) |
2.6x |
|
National Bank |
6.1 |
5.7 |
(6.6%) |
7.1% |
4.9 |
0.0% |
(14.0%) |
0.4x |
|
FBN Holdings |
7.8 |
8.1 |
4.5% |
1.9% |
6.6 |
3.1% |
(15.1%) |
0.4x |
|
Stanbic IBTC Holdings |
46.5 |
48.0 |
3.2% |
0.1% |
37.0 |
1.2% |
(21.7%) |
2.5x |
|
Ecobank Transnational |
14.0 |
14.0 |
0.0% |
(17.6%) |
9.3 |
0.0% |
(33.7%) |
0.5x |
|
*Target Price as per Cytonn Analyst estimates **Upside / (Downside) is adjusted for Dividend Yield ***Banks in which Cytonn and/or its affiliates holds a stake. ****Stock prices indicated in respective country currencies |
||||||||
We are “Positive” on equities for investors as the sustained price declines has seen the market P/E decline to below its historical average. We expect increased market activity, and possibly increased inflows from foreign investors, as they take advantage of the attractive valuations, to support the positive performance.
Sidian Bank, a Kenyan Tier 3 bank, has received a USD 12.0 mn (Kshs 1.2 bn) Tier II capital injection from the Investment Fund for Developing Countries (IFU), a Danish Development Finance Institution (DFI). The funds are expected to boost the bank’s regulatory capital ratios as it works towards achieving its strategic objective of becoming a Tier 2 bank by 2022, as the bank’s total capital to total risk-weighted assets ratio was 14.0% as at Q3’2018, which is below the minimum statutory requirement of 14.5% for banks. The details of the transaction are as follows:
- The investment by IFU is Tier II capital in the form of subordinated debt, and will likely have a minimum tenor of 5 years to maturity,
- IFU will have the option within the first three years to convert their debt investment into equity, subject to approval from the Central Bank of Kenya,
- The conversion option translates to ownership of approximately 20.0%,
- With Sidian Bank having an equity position of Kshs 3.6 bn as at Q3’2018, the transaction could be done at a price-to-book value (P/Bv) multiple of 1.6x, which is a 14.3% premium to the current listed banks trading multiple of 1.4x, and,
- IFU will have two seats on the board of the bank.
The new investment will enable the bank to be well capitalized and improve liquidity, offering ease of access to funds and fast turn-around times for its SME customers, who have been adversely affected by the implementation of the Banking (Amendment) Act 2015, as access to credit became difficult, with banks citing inability to price them within the margins set under the law. In addition, the latest funding follows a series of capital raising efforts by the bank in 2018, including:
- A successful rights issue in 2018 of Kshs 1.5 bn, which saw Centum, its largest shareholder inject Kshs 1.1 bn, to defend its 72.9% shareholding, and,
- A secured loan of Kshs 235.0 mn received in November 2018, from the East African Development Bank for lending to SMEs in the agribusiness sector across the country.
Kenyan banks have, in recent years, taken on substantial loans from international financiers including International Finance Corporation (IFC), European Investment Bank and the African Development Bank (AfDB). Previously, Equity Group, Co-operative Bank, Diamond Trust Bank, Stanbic Holdings and KCB Group have borrowed from international financiers mainly to finance their onward lending businesses. This is as highlighted in the table below;
|
Loans to Banks by International Organizations |
|||||
|
Issuer |
Bank |
Issue Period |
Amount of Loan (Kshs bn) |
Term of Credit |
|
|
1 |
IFC |
Cooperative Bank |
Feb-18 |
15.2 |
7-years |
|
2 |
Africa Development Bank |
KCB Group |
Oct-17 |
10.4 |
Not specified |
|
3 |
14 financial Institutions (syndicated) |
Stanbic Holdings |
May-18 |
10.0 |
2,3 years |
|
4 |
Africa Development Bank |
Diamond Trust bank |
Mar-18 |
7.5 |
7-years |
|
5 |
FMO |
I&M Holdings |
Oct-18 |
4.0 |
Not specified |
|
6 |
Investment Fund for Developing Countries |
Sidian Bank |
Mar-19 |
1.2 |
Not specified |
|
7 |
IFC |
I&M Holdings |
Jan-18 |
1.0 |
Not specified |
|
8 |
SwedFund |
Victoria Commercial Bank |
Apr-18 |
0.5 |
Not specified |
|
9 |
East African Development Bank |
Sidian Bank |
Nov-18 |
0.2 |
8-years |
|
|
Total |
50.1 |
|||
The asset-liability mismatch by tenor due to the relatively long-term nature of loans and short-term nature of deposits exposes a gap that banks have chosen to fill with credit from the international financiers.
We maintain a positive outlook on private equity investments in Africa as evidenced by the increasing investor interest, which is attributed to; (i) economic growth, which is projected to improve in Africa’s most developed PE markets, (ii) attractive valuations in Sub Saharan Africa’s private markets compared to its public markets, and (iii) attractive valuations in Sub Saharan Africa’s markets compared to global markets. Going forward, the increasing investor interest, stable macro-economic and political environment will continue to boost deal flow into African markets.
- Industry Reports
During the week, Knight Frank released a report titled ‘The Wealth Report 2019’ highlighting investment trends of High Net Worth Individuals (HNWIs) in 2018, the appeal of emerging cities to the wealthy and the performance of luxury properties in 100 cities through the Prime International Residential Index (PIRI 100). Knight Frank defines High Net-Worth Individuals (HNWIs) as individuals with a net worth of at least USD 1.0 mn (approx. Kshs 100 mn) excluding their primary residences. Major take-outs from the report include:
- According to the Prime International Residential Index (PIRI 100), Nairobi dropped 17 positions to #92 from #75 last year as prime residential property prices dropped by 4.5% in 2018, 3.6% points higher than the 0.9% decline in 2017, due to an oversupply in the high-end market segment, tighter liquidity and a general market correction in pricing,
- Kenya had 9,482 High Net Worth Individuals in 2018, a 3.3% growth from 9,176 individuals in 2017, with the number projected to grow to 11,584 by 2023,
- Wealthy Kenyans owned an average of 2.7 homes per person in 2018, a 42.1% increase from 1.9 homes per person in 2017. 19% of the wealthy had second homes outside the country, with 7.0% looking to buy outside the country in 2019/2020, and,
Kenyan high net-worth individuals allocated about 22.0% of their investment portfolios to investment properties in 2018, other investments being mostly in equities, cash or cash equivalents and bonds, at 25.0%, 22.0%, and 20.0%, respectively, as shown below:
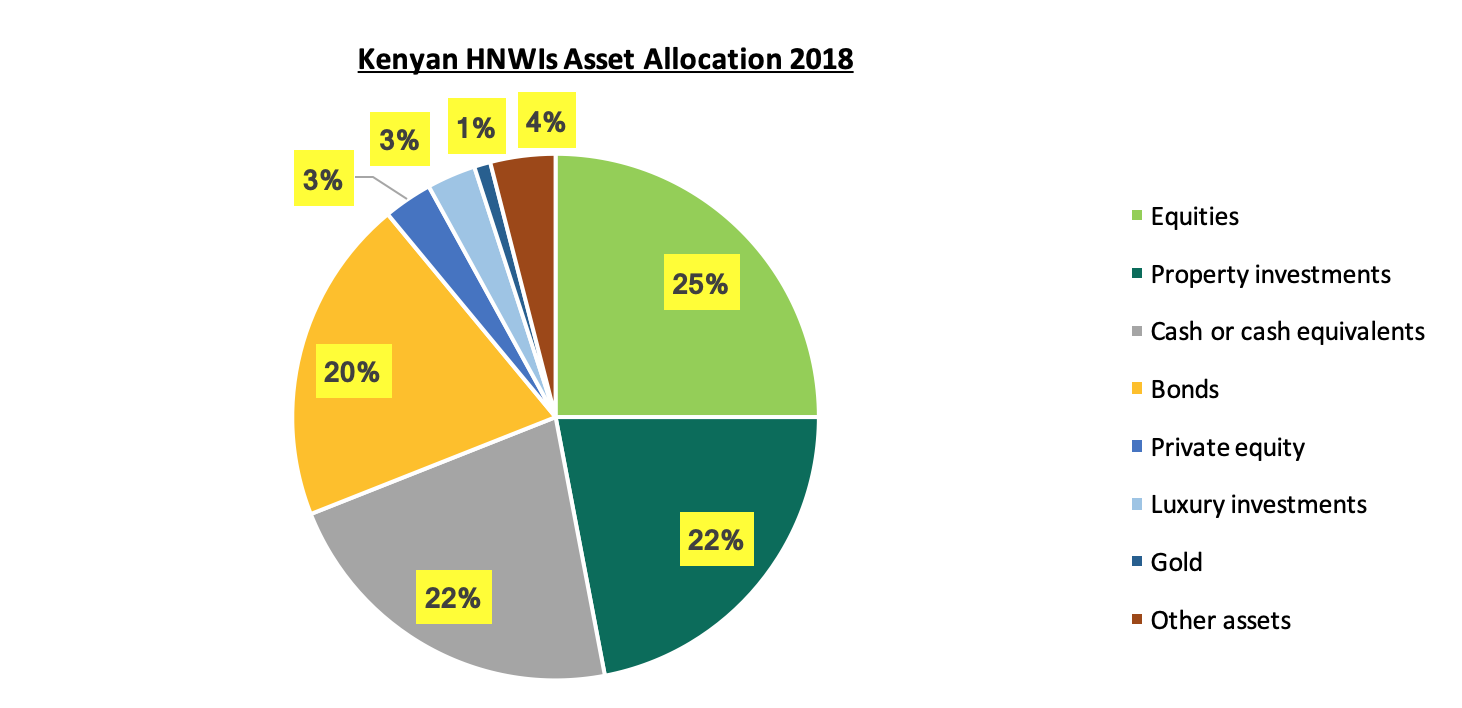
Source: Knight Frank Wealth Report 2019
The report highlights the sustained interest by High Net-worth Individuals in property investments reinforcing demand for luxury housing units. We attribute this to benefits such as (i) stable rental incomes, (ii) preservation of capital by hedging against inflation, and (iii) prestige factors. According to our research, however, increased supply in the high-end market has outpaced the growth in effective demand and thus we expect occupancy and uptake rates to stagnate in the near future. According to the Cytonn Annual Review 2018, prices in the high-end market segment grew by 2.9% in 2018, 1.3% points lower than the residential market average of 4.2%, with average occupancy at 72.8%, compared to the residential market average of 81.0%. We expect investors in the high-end segment to focus on better performing locations such as Kitisuru and Karen that recorded total returns of 8.9% and 8.8%, respectively, compared to the high-end market average of 6.4% in 2018.
- Residential Sector
During the week, Actis, a private equity firm with a key focus on Africa, and Shapoorji Pallonji Real Estate (SPRE), an Indian real estate firm, announced plans to undertake a Kshs 12.0 bn joint venture to develop affordable and middle-income homes in Sub-Saharan Africa, starting with Kenya (specific location details undisclosed). The partnership aims to capitalize on the housing demand in Kenya estimated at 2.0 mn units and growing by approximately 200,000 annually according to the National Housing Corporation, driven by rapid population growth and urbanization at 2.5% and 1.2%, respectively, against slow housing production estimated at 50,000 units annually by the Ministry of Housing. The move will supplement the Kenyan Government’s agenda to deliver 500,000 affordable housing units by 2020. We attribute the increased interest by private investors to the various incentives and policies put in place by the government including:
- A 15.0% tax rate relief for developers who provide at least 100 low–cost housing units p.a.,
- Scrapping off of NEMA and NCA levies, encouraging developers to construct more units, due to the reduction in costs,
- Establishment of the National Housing Development Fund (NHDF), with the Kenyan President approving the Finance Bill 2018, which includes a 1.5% levy on employee’s basic salaries up to Kshs. 5,000 p.m. and the employer expected to match the same amount that will be channeled into the fund, and,
- Partnerships with developers through availing of public land for development.
To further supplement its quest to deliver 500,000 units by 2020, the Ministry of Housing, through its Principal Secretary, Charles Hinga, this week announced the drafting of a bill that would have real estate developers compelled to allocate 30% of their developments to affordable housing. Usually, such a policy is pegged on the size of the development, where only mass housing projects exceeding a set threshold are required to adhere. In our view, the bill is likely to meet opposition from private developers, as it will result in lower profits for investors, not to mention questions whether it would withstand litigation on its constitutionality. We recommend provision of density bonuses, which is an increase in the number of allowable units beyond existing zoning regulations, in order to incentivize private developers in the production of affordable units. Additionally, tax incentives and making it easy to raise funds for affordable housing through capital markets would increase funding for affordable housing.
- Retail Sector
During the week, Swiss-owned shoemaker, Bata Shoe Company, opened its latest outlet at The Hub Mall, in Karen. The store will adopt a red concept, and contemporary retail design focusing on red and white branding, visual merchandising, and digital walls among other features, in order to attract more customers. We continue to see the expansion of retailers, supported by the rising middle class and the provision of high-quality spaces in affluent neighborhoods, leading to increased space uptake and thus higher returns for developers and property managers in retail developments. In 2018, Karen’s retail sector recorded an average rental yield of 11.0%, 2.0% points higher than the market average of 9.0%, with an average occupancy rate of 88.8% compared to the market average at 79.4%. This is mainly attributed to the attractiveness of Karen to retailers as it hosts an affluent population with relatively high purchasing power and thus investors are willing to pay higher rents for retail space in the area. The table below shows a summary of the Nairobi retail market performance in Nairobi:
|
Summary of Nairobi’s Retail Market Performance 2018 |
|||
|
Location |
Rent Kshs/SQFT 2018 |
Occupancy Rate 2018 |
Rental Yield 2018 |
|
Westlands |
219.2 |
88.2% |
12.2% |
|
Karen |
224.9 |
88.8% |
11.0% |
|
Kilimani |
167.1 |
97.0% |
10.7% |
|
Ngong Road |
175.4 |
88.8% |
9.7% |
|
Thika road |
177.3 |
75.5% |
8.3% |
|
Kiambu Road |
182.8 |
69.5% |
8.1% |
|
Mombasa road |
161.5 |
72.4% |
7.9% |
|
Eastland’s |
153.3 |
64.8% |
6.8% |
|
Satellite Towns |
142.1 |
73.7% |
6.7% |
|
Average |
178.2 |
79.8% |
9.0% |
All Values in Kshs unless Stated Otherwise
Source: Cytonn Research 2018
During the week, the Lake Basin Mall in Kisumu opened to the public, following a two-year delay caused by a probe by the Ethics and Anti-Corruption Commission (EACC) into irregularities on the development’s construction costs. The Kshs 4.2 bn Mall owned by Lake Basin Development Authority (LBDA), is located along the Kisumu-Kakamega Road and will bring to the Kisumu market 60,000 SQFT of retail space. The five-floor complex will consist of 140 shops, a three-star hotel and 335 parking bays. Key tenants that booked space last year, according to the dailies include Bata Shoe Company, Best Western Hotel and Communications Authority of Kenya. As per Cytonn Retail Sector Report 2018, Kisumu was among the best performing regions in Kenya recording rental yields of 9.7%, 1.1% points above the Kenyan market average of 8.6% driven by high occupancy rates of 88.0%, 2.0% above the market average of 86.0%, attributable to increased retail business to serve the fast-growing urban population at 52.0% of the population compared to country’s average at 26.5%.
The below table shows Kisumu’s retail market performance in comparison to other regions in Kenya:
|
Summary of Retail Market Performance in Key Urban Cities in Kenya 2018 |
|||
|
Region |
Rent 2018 per SQFT per Month |
Occupancy Rate 2018 |
Rental yield 2018 |
|
Mt Kenya |
141.3 |
84.5% |
9.9% |
|
Kisumu |
148.2 |
88.0% |
9.7% |
|
Nairobi |
178.9 |
83.7% |
9.4% |
|
Mombasa |
103.7 |
96.3% |
8.3% |
|
Eldoret |
137.5 |
78.5% |
7.6% |
|
Nakuru |
83.3 |
85.0% |
6.9% |
|
Average |
132.1 |
86.0% |
8.6% |
|
· Mt. Kenya and Kisumu were the best performing regions, with average rental yields of 9.9% and 9.7%, respectively. This is attributable to high occupancy rates of 84.5% and 88.0%, respectively, above the market average of 86.0% |
|||
All Values in Kshs unless Stated Otherwise
We expect the real estate sector to continue recording increased activities fueled by the focus on the provision of affordable housing, expansion of retailers in the Kenyan market and more developer activity in undersupplied segments such as low-cost housing and selected markets with relatively high returns.
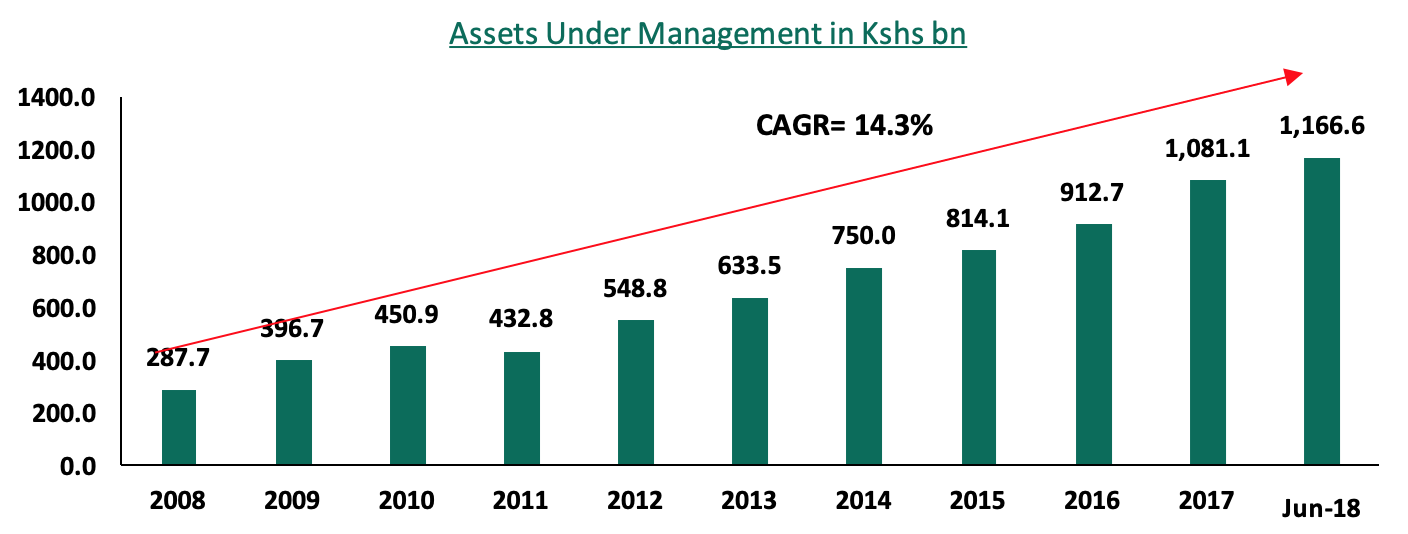
The Retirement Benefits Industry plays a huge role in the economy. According to the Organization for Economic Co-operation and Development (OECD) in 2017, assets in Retirement Benefits Schemes totaled 50.7% of GDP in the OECD countries and 19.7% of total GDP in the non-OECD jurisdictions. It is clear that most non-OECD countries still have a long way to go in the growth of the sector. In Kenya, the Retirement Benefits Assets as a percentage of GDP stood at 13.4%, compared to more developed markets like the USA at 84.1% and the UK at 105.3%. Over the last decades, we have seen reforms and education initiatives by the Retirement Benefits Authority (RBA) to educate people on the importance of saving for retirement. The industry has registered great growth from both member contribution and good performances leading to the assets under management growing to Kshs 1,166.6 bn in 2018, from Kshs 287.7 bn 10-years ago, which is a compound annual growth rate of 14.3% over the 10-years.
We cannot emphasize enough on the importance of saving for retirement, as everyone will have needs at retirement. These needs may vary greatly for different people, but everyone will have basic needs and expenses such as home maintenance or rent, transportation, medical care etc. In order to enjoy your retirement years, one needs a stable source of income, and the primary way to achieve this is through disciplined saving, and investing these funds to grow by gaining interest and returns. This can be achieved by signing up to a registered Retirement Benefits Scheme and contribute to it during your working years. As you contribute, it is also important to review the performance and management of your funds to ensure the returns are attractive on a risk-adjusted basis and outperforming the inflation rates in the economy.
In this report, we will look at how this industry has grown, with a key focus on the performance reported by Fund Managers of Retirement Benefits Schemes in 2018. We shall also analyze this performance and the factors that contributed to the same, as well as give our view on how the growth of this industry and the returns offered can be further supported. As such, we shall cover;
- Retirement Benefits Industry Growth over the Last 10-Years,
- Historical Performance by Retirement Benefits Schemes, and,
- Conclusion and Outlook.
Section I. Retirement Benefits Industry Growth over the Last 10-Years
The Retirement Benefits Industry in Kenya has registered significant growth, with the total Assets Under Management (AUM) having grown by a Compound Annual Growth Rate (CAGR) of 14.3% to the current AUM of Kshs 1,166.6 bn as of June 2018, from Kshs 287.7 bn in 2008. This growth can be attributed to (i) growth in contributions as members registered to Retirement Benefits Schemes continue to increase, (ii) actual individual contributions have also increased driven by the growing middle class, and (iii) increased returns on the investments. Despite the immense growth, the penetration rate of the Retirement Benefits Schemes remains low at 15.0% of the adult population, indicating that most Kenyans are yet to subscribe to a formal Retirement Benefits Scheme.
Changes in the Asset Allocation by Retirement Benefits Schemes in Kenya
Over the years, allocation by Retirement Benefits Schemes has been skewed towards traditional assets, which include Government Securities and Equities. The allocation to alternative assets, including Property, Private Equity, and REITs, has however been increasing, rising to 19.8% of total Assets Under Management (AUM) as of June 2018 from 17.2% in 2013. There is, however, room for improvement and growth as the regulations allow up to 70% allocation towards alternatives, i.e. (Property 30%, Private Equity 10%, REITs 30%).
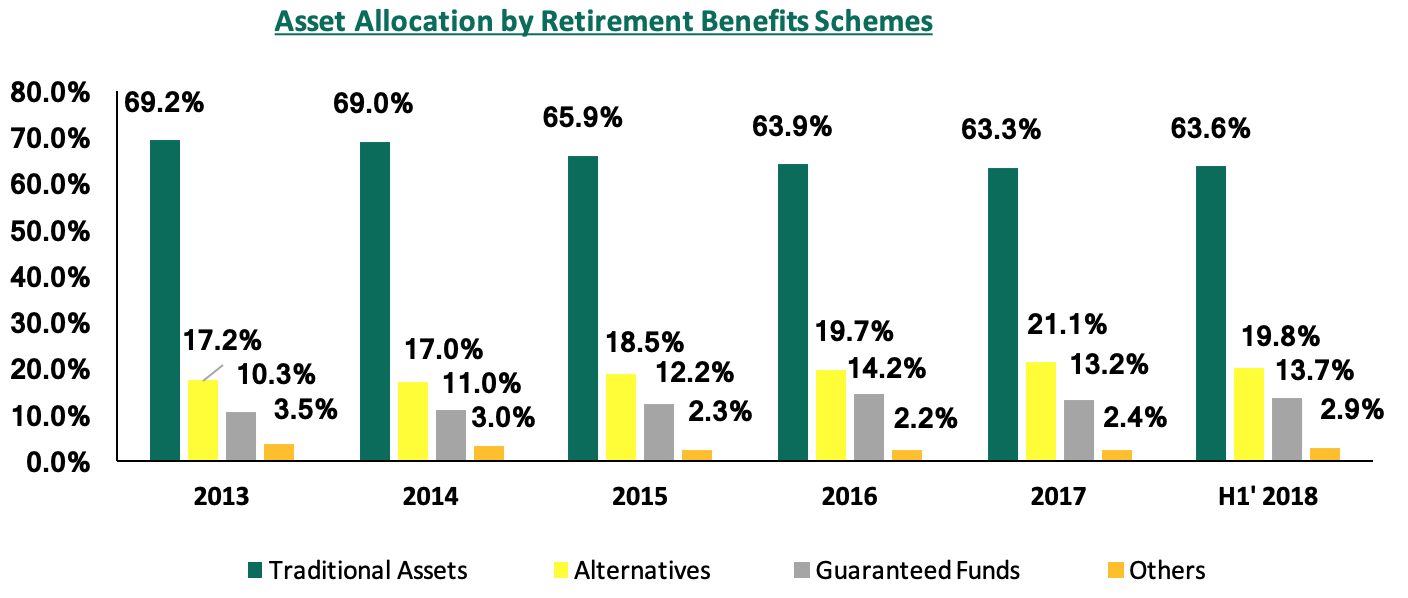
Source: RBA Industry Report June 2018
Fund Managers’ low allocation in alternatives can be attributed to lack of expertise and experience with asset classes such as private equity and real estate, as investing in these asset classes requires detailed due diligence and evaluation as well as engaging legal, financial and sector-specific expertise.
Key Drivers that Determine the Investment Performance of Retirement Benefits Schemes:
- Asset Allocation: Asset allocation is the largest determinant of the performance of a scheme. Over the years, we have seen slight changes in the actual holdings of the Retirement Benefits Schemes, with their allocation being skewed towards traditional assets as seen above. It is important for Fund Managers to have a well-balanced portfolio on a risk-return basis to ensure that they offer their members high returns and at the same time protecting their contributions. Some of the factors that play a key role in determining a schemes asset allocation include;
- Regulation: The RBA provides a guide on how the Retirement Benefits Schemes assets are to be invested and the limits to be applied to different asset classes. These limits have changed over time to reflect the changing investment environment with the regulator adding other asset classes such as private equity and real estate investment trusts to the approved investment asset classes in the regulations,
- Average Age of Members: Depending on the average age of the scheme members, it dictates how aggressive a scheme can be. With members who are closer to retirements, schemes cannot be too aggressive and thus will need to structure their Investment Policy Statements to reflect the risk appetite of their members and this will dictate how their portfolio will be constituted to reflect the low-risk appetite,
- Economic Environment: Investments performance is largely driven by the prevailing economic environment as investments are affected by diverse macroeconomic factors such as fluctuations in the exchange rate, inflation rate, interest rate, money supply, among others. It is therefore important for Fund Managers to carry out extensive research on the macroeconomic environment before making investments decisions,
- Size of the Fund: Larger schemes tend to have more flexibility in terms of investments and are able to make calculated bets when investing, and take up more risks than smaller schemes, and therefore benefit from a high-risk high return, and,
- Management Expertise: Management expertise play a huge role in performance by schemes as better managed schemes perform better than schemes where the management lack the relevant expertise to run the scheme. It is therefore important for the management of schemes to undertake regular training to be able to continually develop their skills and expertise and keep abreast with the changing investment environment.
Section II. Historical Performance by Retirement Benefits Schemes
Guaranteed Schemes
Guaranteed Schemes are largely offered by insurance companies and they guarantee a minimum rate of return, with the maximum allowable rate that can be guaranteed is 4.0% p.a. The insurance companies, however, give higher returns based on the portfolio performance, as seen below:
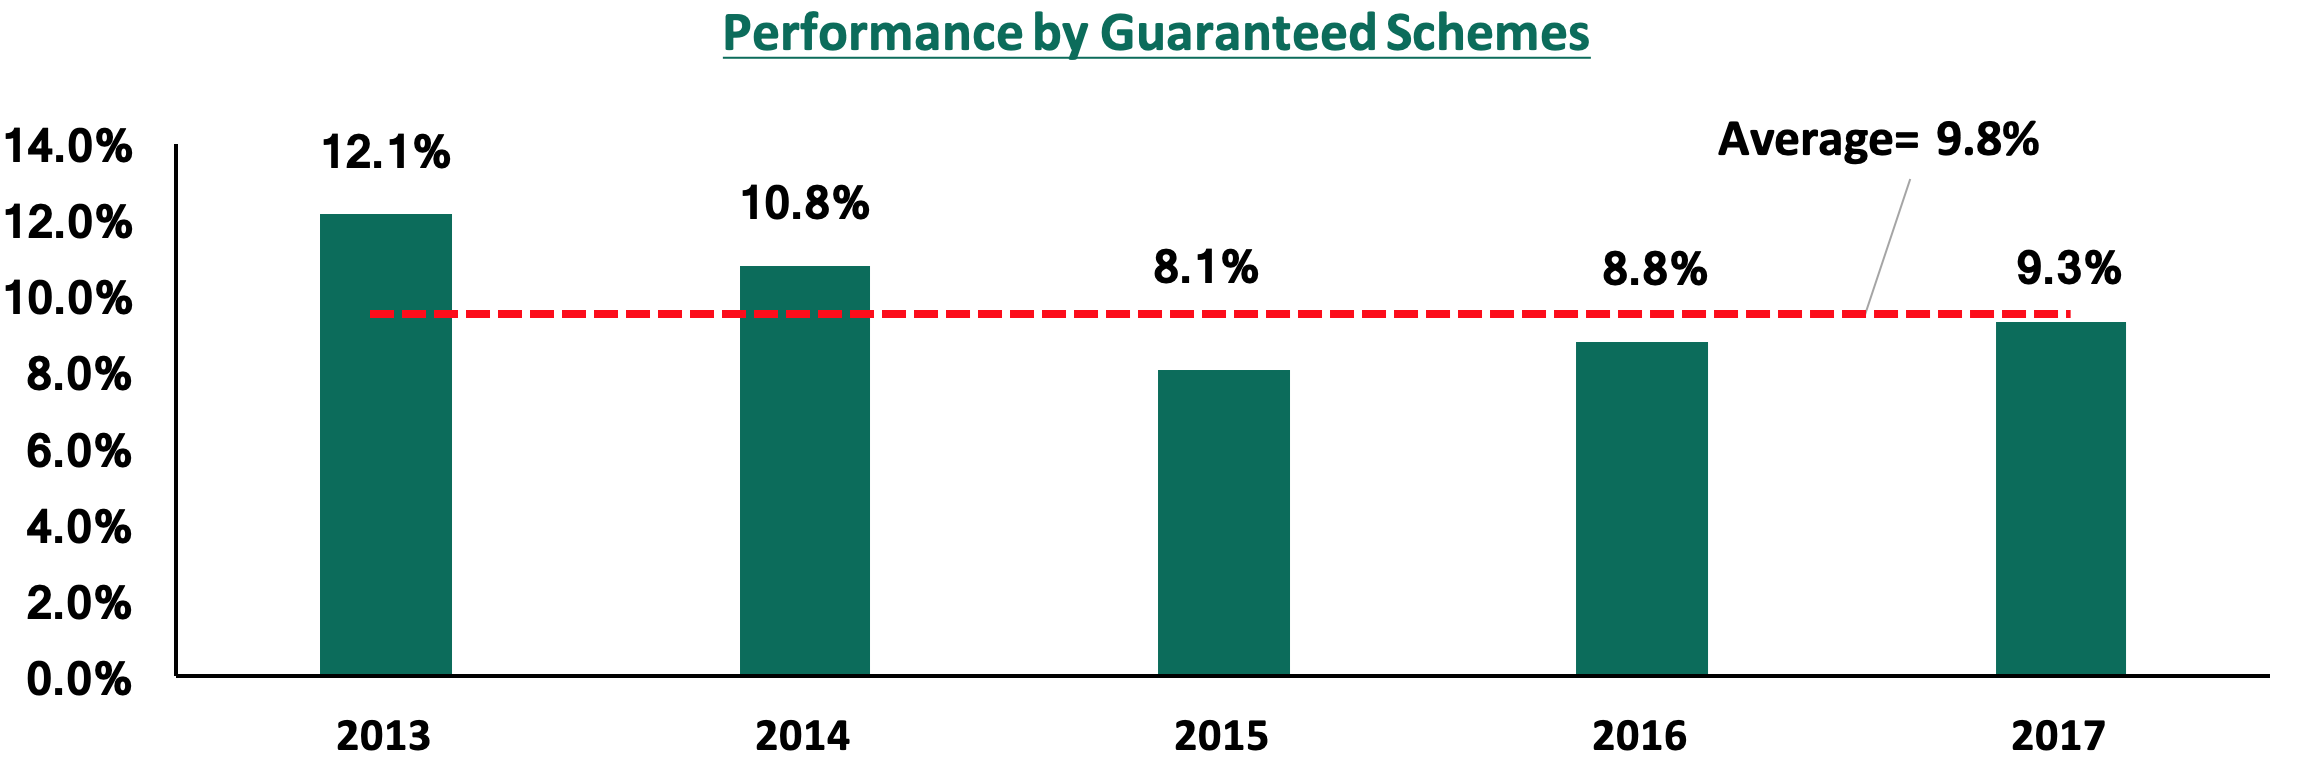
Historically, guaranteed schemes have offered lower returns compared to segregated schemes, at a basic average of 9.8% in the last 5 years compared to the basic average of 11.3% for segregated schemes in the same period, as the insurance companies hold some reserve every year to cater for years where the performance of the market is below the promised rate. For instance, in the year 2013, guaranteed schemes declared a return of 12.1%, which was 8.0% points lower than the average return of 20.1% declared by segregated schemes. However, in 2013 when markets dipped and segregated schemes declared an average return of 1.4%, guaranteed schemes declared a return of 8.1%, 6.7% points higher than the average return declared by segregated schemes. Guaranteed schemes are therefore attractive for members with a conservative risk appetite as the contributions are protected and a minimum return is guaranteed. The 2018 results for guaranteed schemes are yet to be released; we, however, expect them to perform better than segregated schemes, which recorded an average of 5.2% over one year, as they utilize their reserves to shore-up members’ returns and cushion their schemes from the poor performance in the equities markets experienced in 2018.
Segregated Schemes
Segregated Schemes are those where members’ contributions are invested directly by the Trustees via an appointed Fund Manager. The declared returns are based on what the fund achieves, fewer expenses, for the period in the review and the returns are fully accrued to the scheme for the benefit of members. In Kenya, there are two reports that are released on an annual basis. These are the Actuarial Services Company (EA) Limited (Actserve) Pension Schemes Investment Performance Survey, and the Zamara Consulting Actuaries Schemes Survey (Z-CASS).
For the year 2018, the Actserve and Z-CASS reports have indicated average returns for segregated schemes came in at 5.2% (Z-CASS reporting 5.4% and Actserve reporting 5.0%), a 71.7% decline (representing a decline of 13.2% points) from the 18.4% declared in 2017 (Z-CASS reporting 18.1% and Actserve reporting 18.7% in 2017).
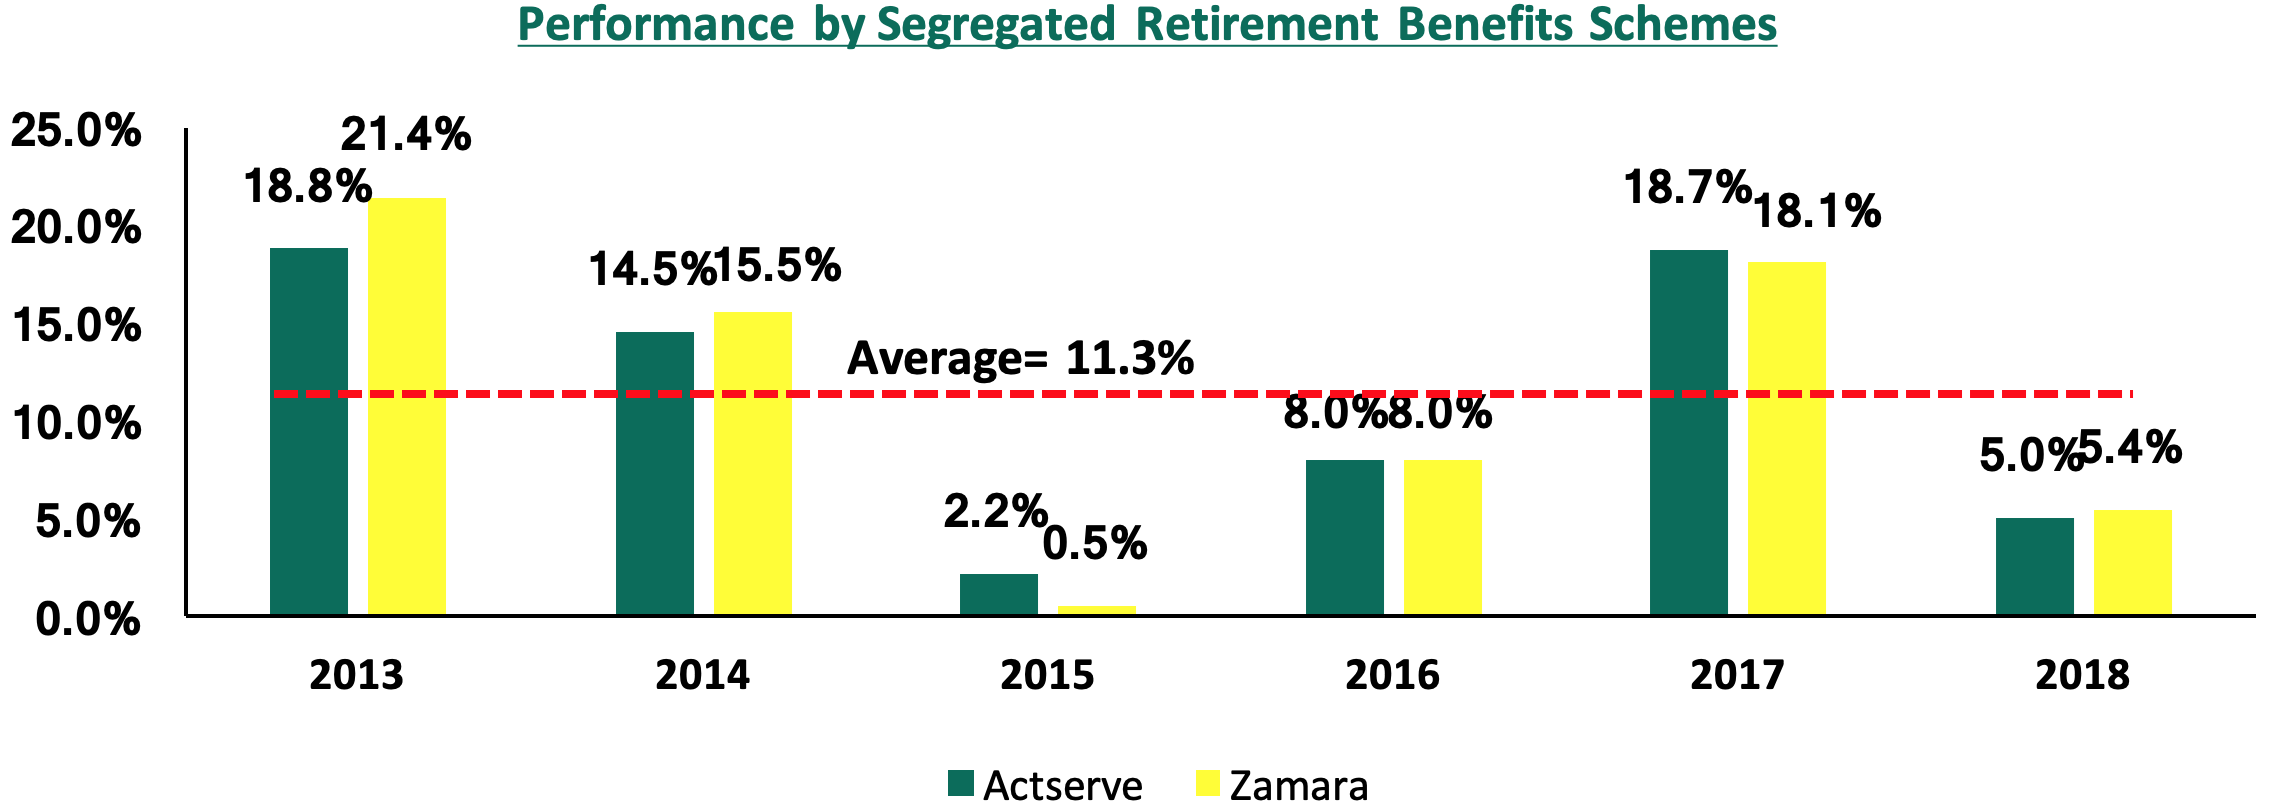
The low performance was greatly attributed to the protracted bear run in the equities market in 2018, which wiped out about Kshs 488.0 bn of investors wealth in the bourse, with NASI and NSE 20 declining by 18.0%, and 23.7%, respectively, in contrast to 2017, where NASI and NSE 20 rose by 27.0% and 16.5%, respectively. Schemes that have huge exposures in the equities market reported much lower returns. The lackluster performance in the equities markets can be attributed to;
- Negative investor sentiments that saw foreign investors remain net sellers with a net outflow of USD 425.6 mn, a 274.3% increase to the net outflows of USD 113.7 mn recorded in FY’2017. This can be attributed to higher risk perception of the country by investors, as international investors exited the broader emerging markets due to the expectation of rising US interest rates, coupled with the International Monetary Fund (IMF) raising the risk of Kenya’s debt distress from low to moderate on October 2018, and,
- Poor company performance with some issuing Profit warnings. The year also saw at least eight (8) companies issue profit warnings to investors with the companies citing the relatively tougher operating environment, which affected the top-line revenue, leading to rising inefficiencies, and consequently declining net income. This made investors shy away from the bourse.
Section III. Conclusion and outlook
Given the continued changes in the Retirement Benefits Industry and increased knowledge of investments, the sector is expected to do well both in terms of growth and returns offered to members. This can be further supported through:
- Increase Mass-Market Education to Increase the Penetration Rate: The current pension’s penetration rate of 15.0% of the adult population is still low and the growth of this industry is highly pegged on attracting more people into Retirement Benefits Schemes, especially those in the informal sector where membership is voluntary. Some of the ways to do this would include:-
- Campaigns by both the RBA and players in the industry including Fund Managers and Fund Administrators to educate people on the importance of saving for retirement, and,
- Fund Managers should make investments in Retirement Benefits Schemes more attractive to millions who are not members by offering superior returns compared to other investments to draw them into these schemes,
- Increased Member Education: The regulator, RBA, has made strides in increasing member education through various member education programs and this will empower members in terms of demanding better service and returns from their Fund Managers,
- Trustee Certification: The RBA has also made it compulsory for Trustees of registered Retirement Benefits Schemes to be certified. This will certainly enhance the capability of Trustees in managing the affairs of the schemes professionally, resulting in better-managed schemes,
- Increased Diversification: Increasing diversification in schemes portfolios will enable Fund Managers to cushion their funds from the effects of non-performance in a particular asset class and minimize the erosion of the value of investments. Strides have been made to achieve this by some Fund Managers through the formation of bodies such as the Kenya Pension Fund Investment Consortium, consisting of 10 Fund Managers with over Kshs 150.0 bn of AUM, with the aim of pooling funds to invest in alternative asset classes. This will result in improved performance by Fund Managers as well as diversified portfolios, and reduce the high exposure in the traditional asset classes,
- Increased Competition by the Various Players in the Market: The RBA has continued to issue licenses to new players in the market and this will beef up competition in the industry keeping the Fund Manager on their toes to ensure that they offer higher returns to their members, and,
- Innovation and Product Development: The RBA has been reviewing its regulations to allow for new products such as the Mortgage Regulations, which allow members to utilize a portion of their accrued benefits as security for a mortgage, and the Post-Retirement Medical Regulations, which allow members to utilize part of their accrued benefits to purchase a post-retirement medical cover. These products have not gained traction but we expect that schemes shall in the near future, find ways of utilizing such regulations to the benefit of their members and draw more people into their schemes.
Disclaimer: The views expressed in this publication are those of the writers where particulars are not warranted. This publication, which is in compliance with Section 2 of the Capital Markets Authority Act Cap 485A, is meant for general information only and is not a warranty, representation, advice or solicitation of any nature. Readers are advised in all circumstances to seek the advice of a registered investment advisor.

- Talk to us
- Kenya
- P.O Box 20695 - 00200, Nairobi, Kenya
- Cell +254709101200
- Tel +254709101200
- WhatsApp +254741676635
- United States
- +254709101200
- DOWNLOAD OUR APP
-


- Kenya
- 8th Floor, Pinetree Plaza, Kaburu Drive, Ngong Road, Nairobi, Kenya
- USA
- Suite 1150, 1775 Eye Street NW, USA, Washington DC 20006, USA
- Investments
- High Yield
- Private Equity
- Real Estate
- Real Estate
- RiverRun Estates
- Cytonn Towers
- The Ridge
- Taraji Heights
- The Alma