Kenya Retail Sector Report 2018, & Cytonn Monthly – August 2018
By Cytonn Research Team, Sep 2, 2018
Executive Summary
Fixed Income
During the month of August, T-bill auctions recorded an undersubscription, with the average subscription rate coming in at 85.1%, a decline from 157.4%, recorded in the month of July. The yields on the 91-day paper remained unchanged at 7.6% while yields on the 182-day and 364-day papers declined by 0.1% points and 0.2% points to 9.0% and 9.9%, respectively. The National Assembly voted to retain the interest rate cap, citing that there was no justification for the repeal, as there were no concerted efforts by banks to address the issue of high credit risk pricing. The National Assembly however voted to remove the 70.0% minimum limit on deposits, pegged on the Central Bank Rate (CBR) and instead, leave the decision of the interest rate charged on deposits at the discretion of the banks and customers. The Bill now awaits the presidential assent in order to become law
Equities
During the month of August, the equities market was on a downward trend with NASI, NSE 20 and NSE 25 declining by 1.7%, 2.8% and 3.2%, respectively, taking their YTD performance as at the end of August to (2.1%), (13.7%) and (2.7%) for NASI, NSE 20 and NSE 25, respectively. Listed banks in Kenya released their H1’2018 financial results, with the core earnings per share rising by an average of 19.0% y/y compared to a 13.8% decline for the same period in 2017
Private Equity
During the month of August, there were private equity activities in Fundraising, as well as in the Financial Services and Fintech sectors. In fundraising, investors in the Abraaj Growth Markets Health Fund (AGHF), a subsidiary of Dubai-based private equity firm Abraaj Group, appointed US firm AlixPartners to oversee the separation of the health fund from Abraaj Group. In Fintech, Jamii Africa announced the receipt of an equity investment of USD 0.7 mn from US-based entrepreneur Patrick Munis, while Lendable secured a USD 0.5 mn convertible grant from the Dutch Government’s MASSIF fund. In the financial services sector, Mauritius based African Rainbow Capital agreed to acquire the remaining 90% stake in the Commonwealth Bank of South Africa Limited (CBSA), while UK based Old Mutual is set to increase its stake in UAP-Old Mutual Holdings from 60.7% to 66.7%
Real Estate
During the month of August, the real estate sector recorded activities as follows; (i) In the residential sector, the Kenya Mortgage Refinancing Company (KMRC) continued to gain much-needed financial support with the Co-operative Bank announcing that it will invest Kshs 200.0 mn worth of share capital in support of the facility while partnership between the National Government and Nairobi County Government has led to acquisition of land parcels in areas such as Kibera, Mariguni, Parkroad, Starehe, Shauro Moyo and Makongeni to be used for provision of affordable housing, (ii) In the commercial sector, Prism Towers, a 33-storey building of 133m in height, developed by Kings Developers Ltd officially opened for occupation, while in the retail sector, international and local retailers such as Bosch, Subway, Burger King, LC Waikiki expanded or announced plans for expansion within the region, and (iii) In hospitality, the Kenya National Bureau of Statistics (KNBS) released their June issue of Leading Economic Indicators highlighting a marginal growth of 0.9% in the number of international arrivals to 443,950 in H1’2018 compared to 439,807 in H1’2017
Focus of the Week
This week we focus on the real estate retail market in Kenya, where we update our annual Kenya’s Retail Sector Report. In the report, we cover the current state of the retail market in terms of supply, demand, drivers, challenges and performance in 2018, which we compare with 2017 performance to gauge trends and hence provide an outlook and recommendations for investors. According to the report, in 2018, Kenya’s retail sector performance improved, recording average rental yields of 8.6%, 0.3% points higher than the 8.3% recorded in 2017, and average occupancy rates of 86.0%, 5.8% points higher than the 80.2% recorded in 2017. The investment opportunity in the sector is in county headquarters, in some markets, namely Mombasa and Mt. Kenya Region (Meru, Nanyuki and Nyeri towns), which have low retail space supply with a market share of just 11.0% and 9.6% compared to Nairobi at 52.1%, retail space demand of 0.3mn and 0.2mn SQFT, attractive rental yields at 8.3% and 9.9% and occupancy rates at 96.3% and 84.5%, respectively
- This week, Cytonn Asset Managers Ltd, our regulated affiliate that is licensed by the Capital Markets Authority, CMA, filed an application to launch a sector fund focused on financial services, the Cytonn African Financials Fund, “CAFF”. CAFF is a financial services fund invested in high growth African markets in Kenya, Nigeria and Ghana. Launched in 2015, CAFF has since inception only been accessible to High Net- Worth Individuals. As at the end of July 2018, CAFF had recorded above average returns of 58.25% compared to NASI returns of 22.7% since inception, and YTD returns of 15.7% compared to NASI returns of (0.4%). “The application to evolve CAFF from a private product to a unit trust fund is consistent with our recent initiatives to make our high returning products more accessible to the general public, a move that requires bringing them into the regulatory ambit. Additionally, through CAFF, investors can get a one stop access to the high growth financial services markets of east and west Africa, which is consistent with the government initiative of Nairobi as a Financial Services Hub.” Said Maurice oduor, the Principal Officer of Cytonn Asset Managers Ltd.
- Maurice Oduor, the Principal Officer of Cytonn Asset Managers Ltd was on Citizen T.V. to discuss the proposed Finance Bill, 2018 to repeal the law capping the interest rate. Watch Maurice here
- Faith Maina, Investments Analyst was on Ebru T.V. to discuss the impact of interest rate capping of 4% above the Central Bank Rate on SMEs. See Faith here
- Faith Maina, Investments Analyst was on Njata T.V. to discuss President Uhuru Kenyatta’s talks with US President Donald Trump and East African Community (EAC) member states plan on banning second hand clothes. See Faith here
- On Monday 27th August 2018, Cytonn’s Unit Manager Sam Muendo trained members of Rotary Club of Nairobi Industrial Area on Future Investments Opportunities. See event note
- We continue to hold weekly workshops and site visits on how to build wealth through real estate investments. The weekly workshops and site visits target both investors looking to invest in real estate directly and those interested in high yield investment products to familiarize themselves with how we support our high yields. Watch progress videos and pictures of The Alma, Amara Ridge, The Ridge, and Taraji Heights. Key to note is that our cost of capital is priced off the loan markets, where all-in pricing ranges from 16.0% to 20.0%, and our yield on real estate developments ranges from 23.0% to 25.0%, hence our top-line gross spread is about 6.0%. If interested in attending the site visits, kindly register here
- We continue to see very strong interest in our weekly Private Wealth Management Training (largely covering financial planning and structured products). The training is at no cost and is open only to pre-screened participants. We also continue to see institutions and investment groups interested in the training for their teams. The Wealth Management Training is run by the Cytonn Foundation under its financial literacy pillar. If interested in our Private Wealth Management Training for your employees or investment group please get in touch with us through wmt@cytonn.com. To view the Wealth Management Training topics, click here
- For recent news about the company, see our news section here
- We have 10 investment-ready projects, offering attractive development and buyer targeted returns of around 23.0% to 25.0% p.a. See further details here: Summary of Investment-Ready Projects
- We continue to beef up the team with ongoing hires for IT Network Engineer and Unit Managers- Mt. Kenya Region. Visit the Careers section on our website to apply
Cytonn Real Estate is looking for a 0.75-acre land parcel for a joint venture in any of the following areas, Lavington, Loresho (near Loresho Shopping Centre and its environs), Spring Valley Shopping Centre and its environs, Redhill Road (should be between Limuru Road Junction and Westlands Link Road), Lower Kabete Road (between Ngecha Road Junction and UON Campus), and Karen. The parcel should be in a good location with frontage to a tarmac road. For more information or leads, email us at rdo@cytonn.com
T-Bills & T-Bonds Primary Auction:
During the month of August, T-bill auctions recorded an undersubscription, with the average subscription rate coming in at 85.1%, a decline from 157.4%, recorded in July. The average subscription rates for the 91-day, 182-day and 364-day papers came in at 57.9%, 59.7% and 121.3%, from 70.2%, 90.9% and 258.6%, in the previous month, respectively, with investors’ participation remaining skewed towards longer dated papers. The yields on the 91-day paper remained unchanged at 7.6%, while yields on the 182-day and 364-day papers declined by 0.1% points and 0.2% points, to 9.0% and 9.9% from 9.1% and 10.1% the previous month, respectively. The average T-bills acceptance rate came in at 90.3% during the month, compared to 74.4% in July with the Kenyan government accepting a total of Kshs 73.8 bn of the Kshs 81.7 bn worth of bids received, indicating that bids were largely within ranges the Central Bank of Kenya (CBK) deemed acceptable.
During the week, T-bills were oversubscribed, with the overall subscription rate coming in at 176.1%, up from 120.4% recorded the previous week, due to improved liquidity in the money market. The yield on the 91-day increased by 0.1% points to 7.7% from 7.6%, the previous week, while yields on the 182-day and 364-day papers remained unchanged at 9.0% and 9.9%, respectively. The acceptance rate for T-bills declined to 77.8% from 79.3% the previous week with the government accepting Kshs 32.9 bn of the Kshs 42.3 bn worth of bids received. The subscription rate for the 91-day and 364-day papers improved to 289.6% and 216.9% from 48.4% and 175.4%, the previous week, respectively while the subscription rate for the 182-day paper declined to 90.0% from 94.1% the previous week, with investors’ participation remaining skewed towards the longer dated paper attributed to the scarcity of newer short-term bonds in the primary market.
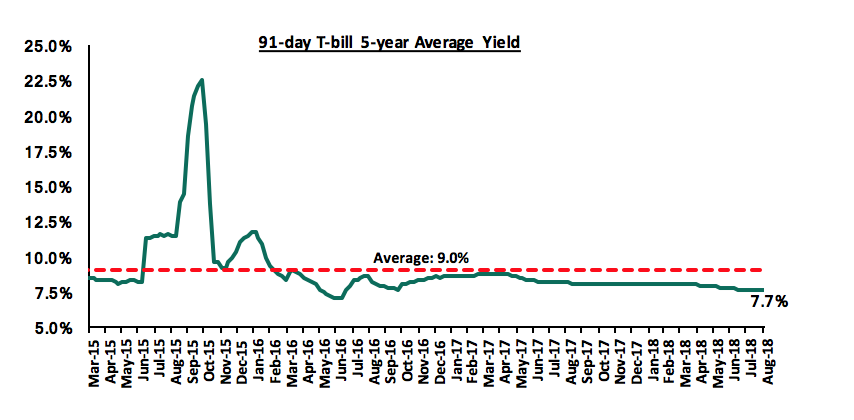
The 91-day T-bill is currently trading at 7.6%, which is below its 5-year average of 9.0%. The lower yield on the 91-day paper is mainly attributable to the low interest rate environment experienced since the passing of the law capping interest rates. We expect this to continue in the short-term, given:
- The discipline of the CBK in stabilizing interest rates in the auction market by rejecting aggressive bids that are priced above market, for both T-bills and T-bonds, and,
- The lowering of the Central Bank Rate by the Monetary Policy Committee in their July meeting to 9.0% from 9.5%.
During the month, the Kenyan Government issued a new 10-year Treasury bond (FXD 1/2018/10) with a market determined coupon rate in a bid to raise Kshs 40.0 bn for budgetary support. The issue was under-subscribed, with the overall subscription rate coming in at 74.6%, while the weighted average rate of accepted bids came in at 12.7%, in line with our expectations of 12.7% - 13.0%. We attributed the undersubscription of the bond to investors being cautious in lengthening their bond portfolio duration due to uncertainties in the interest rate environment as a result of the debate on the interest rate cap, which was still ongoing. With the National Assembly having voted to retain the interest rate cap, now awaiting presidential assent in order to become law, we expect improved performance going forward. The government accepted Kshs 19.4 bn out of the Kshs 29.8 bn worth of bids received, translating to an acceptance rate of 64.9%.
Secondary Bond Market:
The yields on government securities in the secondary market continued to decline in August as the Central Bank of Kenya continued to reject expensive bids in the primary market. According to the FTSE NSE Bond Index, Treasury bonds listed at the Nairobi Securities Exchange (NSE) gained 1.1% during the month, bringing the YTD performance to 10.3%.
Liquidity:
The average interbank rate declined to 5.8% at the end of August from 7.2% in July, pointing to improved liquidity during the month. The improved liquidity was attributed to overnight loans trading at lower interest rates in the interbank markets during the month as well as the pick-up in Government spending, which resulted in improved liquidity in the money market.
During the week, the average interbank rate declined to 5.8%, from 6.1% the previous week, while the average volumes traded in the interbank market increased by 25.6% to Kshs 22.5 bn from Kshs 17.9 bn the previous week, with the increased activity in the interbank market being attributed to a pickup in demand for funds to facilitate VAT remittances by corporates. The decline in the average interbank rate points to improved liquidity, which the Central Bank of Kenya partly attributed to overnight loans trading in the interbank markets at lower interest rates during the week.
Kenya Eurobonds:
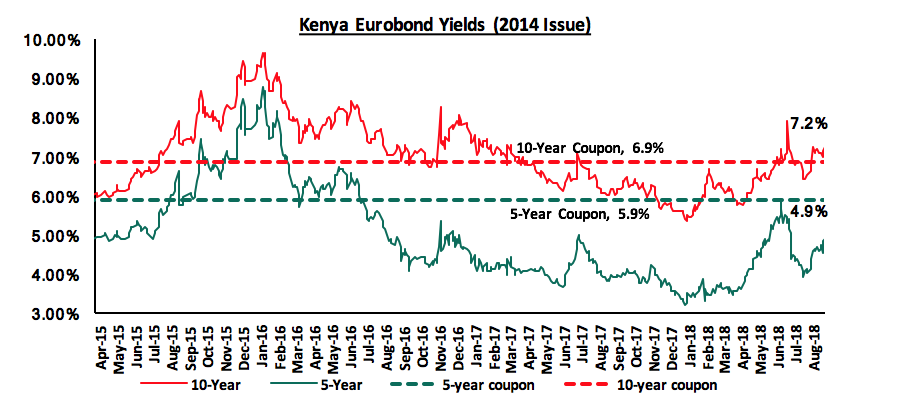
According to Bloomberg, the yield on the 5-year and 10-Year Eurobonds issued in June 2014 both rose by 0.8% points to 4.9% and 7.2%, respectively, from 4.1% and 6.4% in July, attributable to adjustments of global yields to normalization of monetary policies in the advanced economies. During the week, the yields on the 5-year and 10-year Eurobonds issued in 2014 rose by 0.3% points and 0.1% points to 4.9% and 7.2% from 4.6% and 7.1%, respectively. Since the mid-January 2016 peak, yields on the Kenya Eurobonds have declined by 3.9% points and 2.4% points for the 5-year and 10-year Eurobonds, respectively, due to the relatively stable macroeconomic conditions in the country.
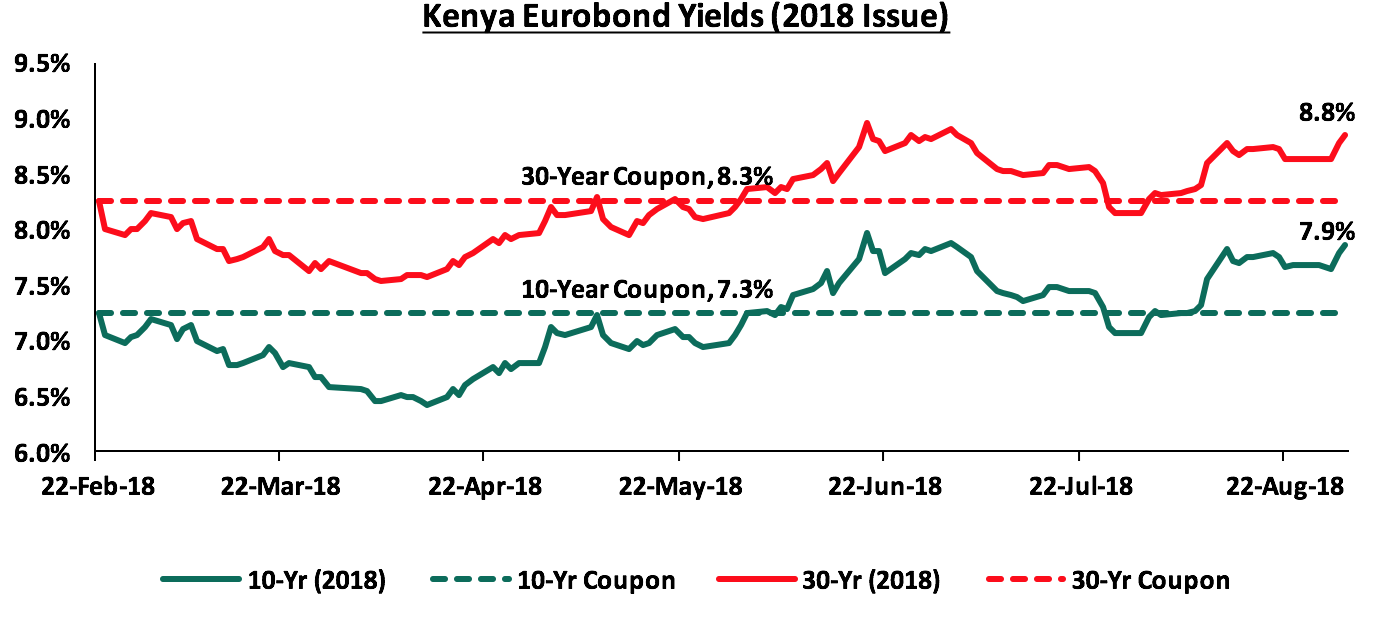
During the month, the yields on the 10-year and 30-year Eurobond issued in February 2018 rose by 0.8% and 0.7% points to 7.9% and 8.8% from 7.1% and 8.1% in July, respectively. During the week, the yields on the 10-year and 30-year Eurobonds both increased by 0.2% points, to 7.9% and 8.8% from 7.7% and 8.6% last week, respectively. Since the issue date, the yield on the 10-year Eurobond has increased by 0.6% points while the 30-year Eurobond has increased by 0.5% points.
The Kenya Shilling:
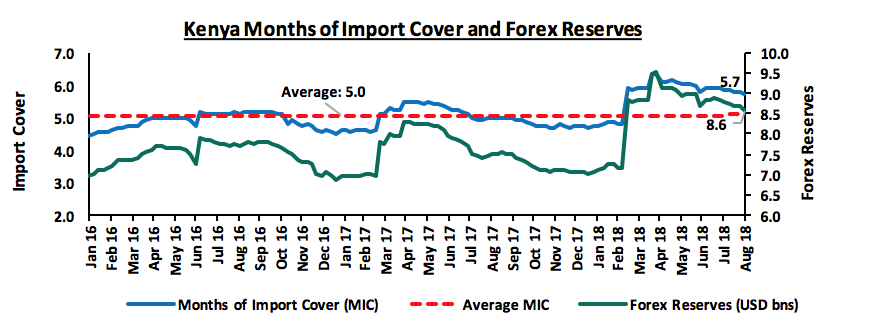
The Kenya Shilling depreciated by 0.2% against the US Dollar during the month of August to Kshs 100.6 from Kshs 100.4 at the end of July. This was driven by dollar demand from traders and oil importers coupled with subdued dollar inflows from exporters. During the week, the Kenya Shilling appreciated marginally against the US Dollar to close at Kshs 100.6 from Kshs 100.7, the previous week, which the CBK attributed to increased inflows from offshore banks. On a YTD basis, the shilling has gained by 2.5% against the US Dollar. In our view, the shilling should remain relatively stable against the dollar in the short term, supported by:
- The narrowing of the current account deficit to 5.8% in June from 6.3% in March, and is expected to narrow to 5.4% of GDP in 2018 driven by growth of agricultural exports, continued diaspora remittances as well as tourism receipts,
- Stronger inflows from principal exports, which include coffee, tea and horticulture, which increased by 10.8% during the month of May to Kshs 24.3 bn from Kshs 21.9 bn in April, with the exports from coffee, tea and horticulture increasing by 11.0%, 19.1% and 2.0% m/m, respectively,
- Improving diaspora remittances, which increased by 4.9% to USD 266.2 mn in June 2018, from USD 253.7 mn in May 2018, with the bulk contribution coming from North America at USD 122.8 mn attributed to (a) recovery of the global economy, (b) increased uptake of financial products by the diaspora due to financial services firms, particularly banks, targeting the diaspora, and (c) new partnerships between international money remittance providers and local commercial banks making the process more convenient, and,
- Sufficient forex reserves, currently at USD 8.6 bn (equivalent to 5.7 months of import cover).
Inflation:
The Y/Y inflation rate for the month of August recorded a decline to 4.0% from 4.4% in July in line with our expectations of 4.0% - 4.4%, mainly due to a decline in food prices that constitute the food index, and the base effect. M/M inflation rate, however increased by 0.3% due to a 2.6% increase in the housing, water, electricity, gas and other fuels’ index, which was driven by a significant increase in prices of electricity that rose by 52.8% and 6.6% for 50 and 200 KWh, respectively, coupled with an increase in the transport index on account of increased pump price of petrol which outweighed the decrease in price of diesel. Food and non-alcoholic Beverages index however declined by 0.7% due to decrease in prices of some foodstuff outweighing increases recorded in respect of others. This decrease was greatly contributed by a fall in prices of maize grains. Below is a summary of key changes in the Consumer Price Index (CPI) in August:
|
Major Inflation Changes in the Month of August 2018 |
|||
|
Broad Commodity Group |
Price change m/m (Aug-18/July-18) |
Price change y/y (August-18/August-17) |
Reason |
|
Food & Non-Alcoholic Beverages |
(0.7%) |
(1.2%) |
This was due to decrease |
|
Transport Cost |
0.9% |
9.4% |
This was on account of an increase in the pump price of petrol which outweighed the decrease in price of diesel |
|
Housing, Water, Electricity, Gas and other Fuels |
2.6% |
16.7% |
This was on account of a significant increase in prices of electricity which |
|
Overall Inflation |
0.3% |
4.0% |
The m/m increase was due to a 2.6% rise in the Housing, Water, Electricity, Gas and other Fuels index which has a CPI weight of 18.3% |
Monthly Highlights:
During the month, the International Monetary Fund (IMF) concluded their visit to Kenya where they were holding discussions with the Kenyan Government on the second review under a precautionary Stand-By Arrangement (SBA), which was extended to Kenya on 14th March 2016. The existing program is set to expire on September 14th 2018 and it remains uncertain if Kenya’s access to the facility will be extended as talks with the government were set to continue with the IMF team expected to submit a final report to the IMF Board by the end of August. Among the key pre-conditions set by the IMF to extend the facility was a substantial modification to the interest rate capping and the implementation of the 16.0% VAT on fuel in order to reduce the large deficits over the last few years. With the National assembly having voted to retain the status quo and keep the top ceiling capping loans at 4.0% above the Central Bank Rate, as well as pushing the implementation of VAT on fuels by another 2 years to September 2020 citing that its implementation would lead to a rise in inflation, it is unlikely that the IMF will renew the supplementary facility. We maintain our view that the facility would be essential to Kenya as it would enhance fiscal discipline due to the attached pre-conditions that the program comes with, which include, policy changes, such as the targeted inflation that the country must maintain, increased taxation in a bid to increase government revenues while minimizing dependency on debt, cutbacks of government spending and reduction of fiscal deficits. As such, this would reduce the risk perception of the country while improving investor sentiments as signing up to undertake the fiscal policy measures in order to be granted access to the facilities would provide reassurance to investors of expected improvements and stability in the macroeconomic conditions of the country.
During the month, the National Assembly voted on the Finance Bill, 2018. During the third reading and final stage of parliamentary debate, the National Assembly voted for the interest rate cap to be retained citing that there was no justification for the repeal, as there was no effort by banks to address the issue of high credit risk pricing. The National Assembly however voted to remove the 70.0% minimum limit on deposits, pegged on the Central Bank Rate (CBR) and instead, leave the decision of deposit pricing at the discretion of the banks and customers. The Bill now awaits the presidential assent in order to become law.
The National Assembly voted to scrap off the Robin Hood Tax, citing that it is punitive and the Kshs 500,000 set threshold was too low. This was despite the proposals by the Finance committee to make limited amendments.
The Members of the National Assembly also voted to scrap off the 2.0% tax increment on mobile transfers from 10.0% to 12.0%. The FY’2018/2019 budget had mainly focused on fiscal consolidation through strengthening of revenues which were projected to rise by 17.5% to Kshs 1.9 tn from Kshs 1.7 tn in the FY 2017/2018, with tax policy measures at the core of achieving the fiscal targets as well as a reduction in expenditure. With Parliament having rejected the tax proposals, there are expectations of a shortfall in Government revenues as there were expectations of a Kshs 86.0 bn rise in VAT collections, which may see it either reducing expenditures or increasing debt capital, which as per the budget was expected to decline by 8.6% to Kshs 271.9 bn from Kshs 297.6 bn in the FY’2017/2018 budget; it remains to be seen how the National Treasury will respond to the outcome of the National Assembly actions.
Rates in the fixed income market have been on a declining trend, as the government continues to reject expensive bids as it is currently 26.0% ahead of its pro-rated borrowing target for the current financial year, having borrowed Kshs 65.9 bn against a prorated target of Kshs 52.3 bn. The 2018/19 budget had given a domestic borrowing target of Kshs 271.9 bn, 8.6% lower than the 2017/2018 fiscal year’s target of Kshs 297.6 bn, which may result in reduced pressure on domestic borrowing. With the rate cap still in place, and the national assembly having voted to retain it, now awaiting presidential assent to become law, we maintain our expectation of stability in the interest rate environment. With the expectation of a relatively stable interest rate environment, our view is that investors should be biased towards medium-term fixed-income instruments.
Market Performance
During the month of August, the equities market was on a downward trend with NASI, NSE 20 and NSE 25 declining by 1.7%, 2.8% and 3.2%, respectively, taking their YTD performance as at the end of August to (2.1%), (13.7%) and (2.7%) for NASI, NSE 20 and NSE 25, respectively. The equities market performance during the month was driven by declines in large caps stocks such as East Africa Breweries Limited (EABL), Equity Group Holdings, Barclays Bank, Diamond Trust Bank (DTB) and KCB Group, which declined by 11.6%, 10.0%, 5.2%, 5.0% and 4.1%, respectively.
During the week, the equities market was also on a downward trend with NASI, NSE 20 and NSE 25 declining by 3.1%, 2.8% and 4.2%, respectively, due to declines in counters such as Equity Group Holdings, Barclays Bank and KCB Group, which declined by 10.0%, 6.4% and 6.3%, respectively. Banking stocks declined owing to investors’ reaction to Parliament’s vote to retain the 4.0% cap above the Central Bank Rate (CBR), on interests charged on loans.
Equities turnover rose by 30.7% during the month to USD 99.8 mn from USD 76.3 mn in July, taking the YTD turnover to USD 1.2 bn. For this week, equities turnover rose by 55.2% to USD 26.8 mn from USD 17.3 mn in the previous week with foreign investors remaining net sellers. Foreign investors remained net sellers for this month, with a net selling position of USD 15.3 mn. We expect the market to remain supported by improved investor sentiment as the economy recovers from shocks experienced last year.
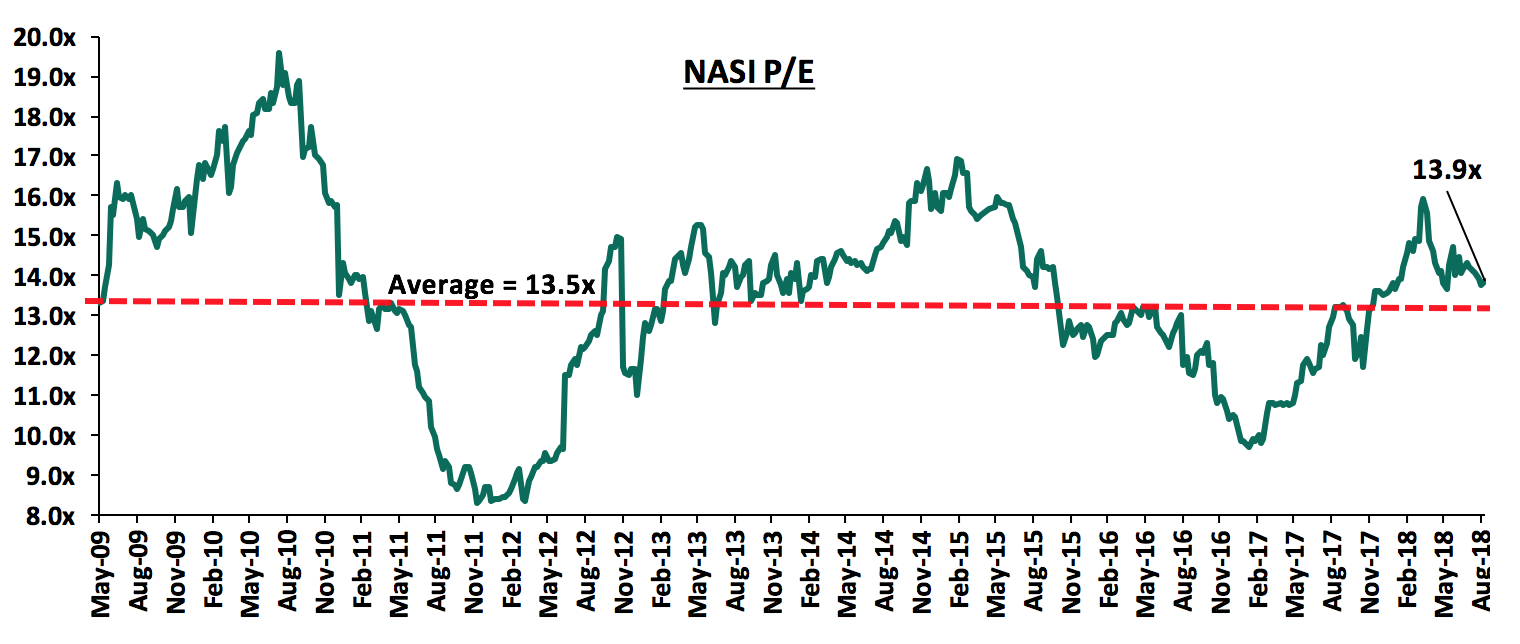
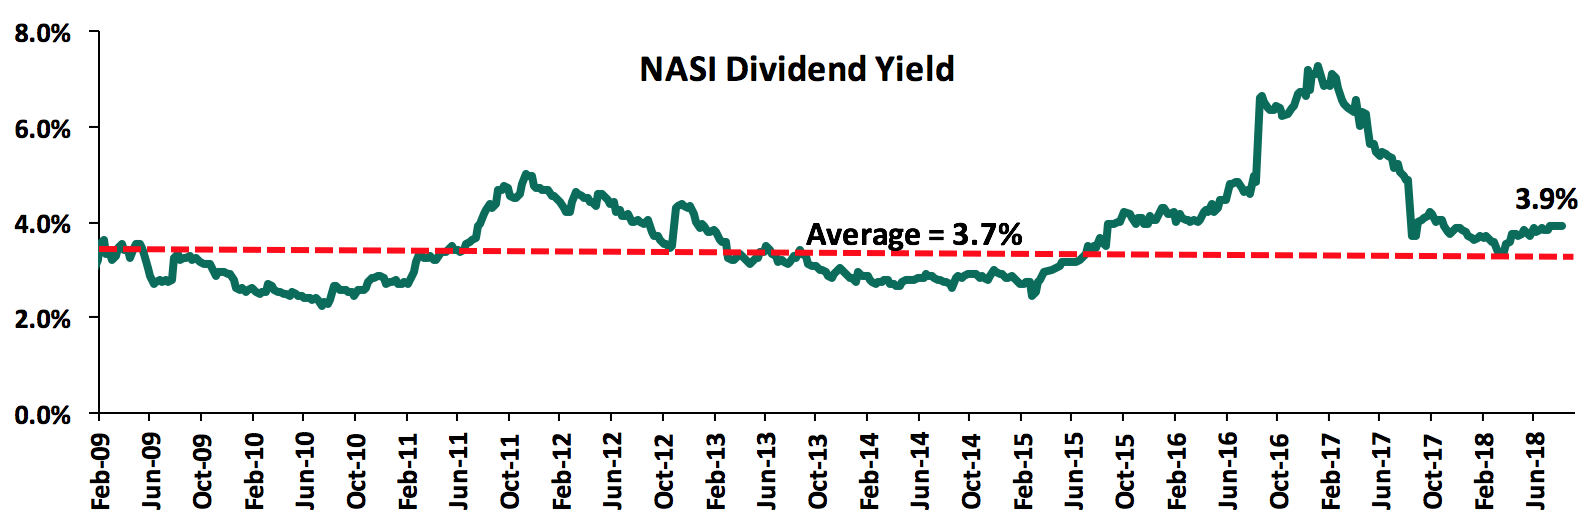
The market is currently trading at a price to earnings ratio (P/E) of 13.9x, 3.0% above the historical average of 13.5x, and a dividend yield of 3.9%, slightly above the historical average of 3.7%. Despite the valuations nearing the historical average, we believe there still exist pockets of value in the market. The current P/E valuation of 13.5x is 43.3% above the most recent trough valuation of 9.7x experienced in the first week of February 2017, and 67.5% above the previous trough valuation of 8.3x experienced in December 2011. The charts below indicate the historical P/E and dividend yields of the market.
Earnings Releases
I&M Holdings released H1’2018 results during the week;
I&M Holdings released their H1’2018 results, registering core earnings per share growth of 11.7% to Kshs 8.8 from Kshs 7.9 in H1’2017, lower than our expectation of a 14.7% increase to Kshs 9.0. Performance was driven by a 9.9% increase in operating income to Kshs 10.6 bn from Kshs 9.6 bn in H1’2017, despite a 15.8% increase in operating expenses to Kshs 5.7 bn from Kshs 4.9 bn. Highlights of the performance from H1’2017 to H1’2018 include:
- Total operating income increased by 9.9% to Kshs 10.6 bn from Kshs 9.6 bn in H1’2017. This was due to a 34.4% increase in Non-Funded Income (NFI) to Kshs 3.7 bn from Kshs 2.8 bn in H1’2017, while Net Interest Income (NII) remained flat at Kshs 6.9 bn,
- Interest income increased by 5.1% to Kshs 11.7 bn from Kshs 11.1 bn in H1’2017. The interest income on loans and advances increased by 7.3% to Kshs 9.0 bn from Kshs 8.4 bn in H1’2017. Interest income on government securities remained flat at Kshs 2.6 bn in H1’2018. The yields on interest earning assets stood at 11.3% in H1’2018, a decline from 12.0% recorded in H1’2017,
- Interest expense increased by 13.2% to Kshs 4.8 bn from Kshs 4.2 bn in H1’2017, as interest expense on customer deposits increased by 16.6% to Kshs 4.2 bn from Kshs 3.6 bn in H1’2017. Interest expense on deposits from other banking institutions declined by 30.4% to Kshs 112.5 mn from Kshs 161.6 mn in H1’2017. The cost of funds decreased to 4.6% from 4.9% in H1’2017, indicating that cheaper non-interest bearing accounts were opened as deposits grew by 30.6%. The Net Interest Margin declined marginally to 7.1% from 7.2% in H1’2017,
- Non-Funded Income increased by an impressive 34.4% to Kshs 3.7 bn from Kshs 2.8 bn in H1’2017. The increase in NFI was driven by a 64.2% increase in fees and commission income on loans to Kshs 0.8 bn from Kshs 0.5 bn in H1’2017, coupled with a 39.2% increase in other income to Kshs 0.5 bn from Kshs 0.4 bn in H1’2017. Other fees and commissions increased by 27.0% to Kshs 1.2 bn from Kshs 1.0 bn in H1’2017, while forex trading income rose by 25.5% to Kshs 1.2 bn from Kshs 1.0 bn in H1’2017. The revenue mix shifted to 65:35 funded to non-funded income from 71:29 in H1’2017, owing to the faster increase in NFI compared to NII,
- Total operating expenses increased by 15.8% to Kshs 5.7 bn from Kshs 4.9 bn, largely driven by a 26.2% increase in loan loss provisions (LLP) to Kshs 1.4 bn in H1’2018 from Kshs 1.0 bn in H1’2017. Staff costs increased by 10.2% to Kshs 2.0 bn in H1’2018 from Kshs 1.9 bn in H1’2017,
- The cost to income ratio deteriorated marginally to 53.7% from 51.0% in H1’2017. Without LLP, however, the cost to income ratio improved to 40.4% from 41.0% in H1’2017, implying a higher cost of risk due to the increase in LLP,
- Profit before tax increased by 3.8% to Kshs 4.9 bn, up from Kshs 4.7 bn in H1’2017. Profit after tax increased by 12.8% to Kshs 3.9 bn in H1’2018 from Kshs 3.4 bn in H1’2017,
- The balance sheet recorded an expansion with total assets growth of 23.5% to Kshs 283.1 bn from Kshs 229.2 bn in H1’2017. This growth was largely driven by a 12.6% increase in net loans and advances to Kshs 162.8 bn in H1’2018 from Kshs 144.5 bn in H1’2017, and a 502.4% growth in deposits and balances due from banking institutions abroad to Kshs 38.6 bn from Kshs 6.4 bn in H1’2017. Government securities decreased by 28.3% to Kshs 36.1 bn from Kshs 50.4 bn in H1’2017,
- Total liabilities rose by 27.2% to Kshs 235.3 bn from Kshs 184.9 bn in H1’2017, driven by a strong 30.6% increase in customer deposits to Kshs 210.9 bn from Kshs 161.5 bn in H1’2017. Deposits per branch increased by 30.6% to Kshs 5.2 bn from Kshs 4.0 bn in H1’2017 as the bank has not increased its branch network from the current 42 branches,
- The faster growth in deposits compared to loan growth led to a decline in the loan to deposit ratio to 77.2% from 89.5% in H1’2017,
- Gross non-performing loans increased by 118.1% to Kshs 22.4 bn in H1’2018 from Kshs 10.3 bn in H1’2017. Consequently, the NPL ratio deteriorated to 13.0% in H1’2018 from 6.0% in H1’2017. General Loan loss provisions increased by 64.1% to Kshs 5.9 bn from Kshs 3.4 bn in H1’2017, hence an improvement in NPL coverage to 43.4% in H1’2018 from 33.6% in H1’2017,
- Shareholders’ funds increased by 7.5% to Kshs 45.1 bn in H1’2018 from Kshs 41.9 bn in H1’2017,
- I&M Holdings is currently sufficiently capitalized with a core capital to risk weighted assets ratio of 16.5%, 6.0% above the statutory requirement. In addition, the total capital to risk weighted assets ratio was 18.2%, exceeding the statutory requirement by 3.7%. Adjusting for IFRS 9, the core capital to risk weighted assets stood at 16.5%, while total capital to risk weighted assets came in at 18.6%, indicating that the bank’s total capital relative to its risk-weighted assets decreased by 0.4% due to the impact of IFRS 9,
- I&M Holdings currently has a return on average assets of 3.0% and a return on average equity of 17.2%.
Going forward, we expect the bank’s growth to be further driven by:
- Non-Funded Income Growth Initiatives – I&M Holdings’ NFI growth is improving as the bank focuses on digital innovation to augment transaction volumes and increase fee income. The bank needs to increase the capacity of its brokerage and advisory businesses so as to increase income contribution from investment and advisory services. The acquisition of Youjays Insurance Brokers provides the bank with an avenue to grow its bancassurance business, thereby putting the firm’s NFI on a positive growth trajectory.
For a more comprehensive analysis, see our I&M Holdings H1’2018 earnings note.
Diamond Trust Bank released the H1’2018 results during the week;
Diamond Trust Bank released their H1’2018 results during the week, with core earnings per share growing by 2.5% to Kshs 12.5 from Kshs 12.2 in H1’2017, lower than our expectation of a 16.6% increase to Kshs 13.8. Performance was driven by a 5.3% increase in total operating income to Kshs 12.7 bn from Kshs 12.0 bn in H1’2017, which outpaced a 4.0% increase in total operating expenses to Kshs 7.3 bn from Kshs 7.0 bn. The variance in core earnings per share growth, relative to our expectations, was as a result of a slower growth in Net Interest Income (NII) of 4.6% against our expectation of an 11.7% increase to Kshs 10.6 bn. Highlights of the performance from H1’2017 to H1’2018 include:
- Total operating income increased by 5.3% to Kshs 12.7 bn from Kshs 12.0 bn in H1’2017. This was due to an increase of 8.0% increase in Non-Funded Income (NFI) to Kshs 2.7 bn from Kshs 2.5 bn in H1’2017, coupled with a 4.6% increase in Net Interest Income (NII) to Kshs 9.9 bn from Kshs 9.5 bn in H1’2017,
- Interest income increased by 3.9% to Kshs 17.5 bn from Kshs 16.9 bn in H1’2017. The interest income on loans and advances decreased by 0.9% to Kshs 11.1 bn from Kshs 11.2 bn in H1’2017. Interest income on government securities increased by 13.5% to Kshs 6.3 bn in H1’2018 from Kshs 5.6 bn in H1’2017. The yield on interest earning assets declined to 11.0% in H1’2018 from 12.0% in H1’2017, due to the relatively faster growth in interest-earning assets by 12.1% to Kshs 338.6 bn from Kshs 302.2 bn in H1’2017, with the increase mainly being government securities that have a lower yield than loans,
- Interest expense increased by 3.0% to Kshs 7.6 bn from Kshs 7.4 bn in H1’2017, as interest expense on customer deposits increased by 1.6% to Kshs 6.8 bn from Kshs 6.7 bn in H1’2017. Interest expense on deposits from other banking institutions increased by 68.3% to Kshs 371.9 mn from Kshs 221.1 mn in H1’2017. The cost of funds decreased to 5.0% from 5.3% in H1’2017. The Net Interest Margin declined to 6.5% from 6.8% in H1’2017,
- Non-Funded Income increased by 8.0% to Kshs 2.7 bn from Kshs 2.5 bn in H1’2017. The increase in NFI was driven by a 70.4% increase in other income to Kshs 0.2 bn from Kshs 0.1 bn in H1’2017, coupled with an 11.7% increase in other fees and commission income to Kshs 1.0 bn from Kshs 989.9 mn in H1’2017. Fees and commissions on loans increased by 4.3% to Kshs 0.7 bn from Kshs 0.6 bn in H1’2017, while forex trading income rose marginally by 0.3% to Kshs 795.9 mn from Kshs 793.8 mn in H1’2017. The revenue mix shifted to 78:22 funded to non-funded income in H1’2018 from 79:21 in H1’2017, owing to the faster increase in NFI compared to NII,
- Total operating expenses increased by 4.0% to Kshs 7.3 bn from Kshs 7.0 bn, largely driven by a 7.3% increase in other operating expenses to Kshs 3.5 bn in H1’2018 from Kshs 3.3 bn in H1’2017. Staff costs increased by 3.8% to Kshs 2.1 bn in H1’2018 from Kshs 2.0 bn in H1’2017. Loan loss provision expense (LLP) declined by 2.2% to Kshs 1.68 bn from Kshs 1.72 bn in H1’2017,
- The cost to income ratio improved to 57.4% from 58.1% in H1’2017. Without LLP, however, the cost to income ratio deteriorated to 44.2% from 43.9% in H1’2017,
- Profit before tax increased by 7.0% to Kshs 5.4 bn, up from Kshs 5.0 bn in H1’2017. Profit after tax increased by 2.5% to Kshs 3.5 bn in H1’2018 from Kshs 3.4 bn in H1’2017,
- The balance sheet recorded an expansion with total assets growth of 9.4% to Kshs 376.1 bn from Kshs 343.7 bn in H1’2017. This growth was largely driven by a 22.5% increase in government securities to Kshs 129.2 bn in H1’2018 from Kshs 105.4 bn in H1’2017. The loan book expanded by 3.5% to Kshs 198.2 bn in H1’2018 from 191.5 bn in H1’2017,
- Total liabilities rose by 8.8% to Kshs 321.1 bn from Kshs 295.2 bn in H1’2017, driven by a 9.9% increase in customer deposits to Kshs 281.8 bn from Kshs 256.3 bn in H1’2017. Deposit per branch increased by 3.5% to Kshs 4.1 bn from Kshs 3.9 bn in H1’2017, with the branches increasing from 65 in H1’2017 to 69 in H1’2018,
- The faster growth in deposits compared with loan growth led to a decline in the loan to deposit ratio to 70.4% from 74.7% in H1’2017,
- Gross non-performing loans increased by 65.6% to Kshs 15.3 bn in H1’2018 from Kshs 9.2 bn in H1’2017. Consequently, the NPL ratio deteriorated to 7.1% in H1’2018 from 4.5% in H1’2017. General Loan loss provisions increased by 40.4% to Kshs 8.5 bn from Kshs 6.0 bn in H1’2017. However, the NPL coverage decreased to 70.7% in H1’2018 from 86.8% in H1’2017 due to the faster increase in NPLs,
- Shareholders’ funds increased by 14.9% to Kshs 50.0 bn in H1’2018 from Kshs 43.5 bn in H1’2017,
- DTB Kenya Limited is currently sufficiently capitalized with a core capital to risk weighted assets ratio of 17.4%, 6.9% above the statutory requirement. In addition, the total capital to risk weighted assets ratio was 18.7%, exceeding the statutory requirement by 4.2%. Adjusting for IFRS 9, the core capital to risk weighted assets stood at 18.5%, while total capital to risk weighted assets came in at 19.8%, indicating that the bank’s total capital relative to its risk-weighted assets decreased by 1.1% due to the impact of IFRS 9,
- DTB currently has a return on average assets of 1.8% and a return on average equity of 14.0%.
Going forward, we expect the bank’s growth to be further driven by:
- Non-Funded Income Growth Initiatives – DTB’s partnership with the Postal Corporation of Kenya has expanded its agency banking reach across the country. This is expected to increase transactional volumes, which will in turn contribute to NFI generation through fees and commissions. DTB should also increase the capacity of its bancassurance business to acquire more customers through cross-selling insurance products to existing customers.
- Better underwriting of loans to ascertain and minimize risks associated with every market segment in which it operates, in order to mitigate the bank’s deteriorating asset quality. The bank obtained a credit facility from Africa Development Bank (AfDB), which it will use to extend credit to SME businesses. It is important for the bank to adopt appropriate risk management policies in order to reduce its bad loan portfolio.
For a more comprehensive analysis, see our Diamond Trust Bank H1’2018 earnings note.
HF Group released the H1’2018 results during the week;
HF Group released their H1’2018 financial results, with core earnings per share declining by 95.7% to Kshs 0.02 from Kshs 0.5 in H1’2017, in line with our expectations of a 95.0% decline. Performance was driven by a 9.4% increase in total operating expenses to Kshs 1.9 bn from Kshs 1.8 bn in H1’2017, coupled with a 1.5% decline in total operating income to Kshs 1.9 bn from Kshs 2.0 bn in H1’2017. The bank recorded a profit after tax of Kshs 6.8 mn. Highlights of the performance from H1’2017 to H1’2018 include:
- Total operating income declined by 2.7% to Kshs 1.9 bn in H1’2018 from Kshs 2.0 bn in H1’2017. Performance was driven by a 13.9% decline in Net Interest Income (NII) to Kshs 1.3 bn from Kshs 1.6 bn in H1’2017, despite a 38.2% increase in Non-Funded Income (NFI) to Kshs 586.8 mn from Kshs 424.5 mn in H1’2017,
- Interest income declined by 13.2% to Kshs 3.2 bn from Kshs 3.7 bn in H1’2017 bn, due to a decline in interest income on loans and advances by 12.4% to Kshs 3.0 bn from Kshs 3.4 bn in H1’2017, and a 34.2% decline in interest income on government securities to Kshs 145.7 mn from Kshs 221.5 mn in H1’2017. The yield on interest earning assets consequently declined to 11.7% in H1’2018 from 13.0% in H1’2017,
- Interest expense declined by 12.7% to Kshs 1.9 bn from Kshs 2.1 bn in H1’2017, following a 3.4% decline in the interest expense on customer deposits to Kshs 1.1 bn from Kshs 1.2 bn in H1’2017. Other interest expenses declined by 27.1% to Kshs 677.4 mn from Kshs 928.9 mn in H1’2017. Consequently, the cost of funds declined to 7.0% from 7.5% in H1’2017, while the Net Interest Margin declined to 4.9% from 5.7% in H1’2017,
- Non-Funded Income increased by 38.2% to Kshs 586.8 mn from Kshs 424.5 mn in H1’2017. The growth in NFI was driven by a 163.0% increase in other income to Kshs 433.0 mn from Kshs 265.6 mn in H1’2017. Fees and commissions on loans declined by 59.9% to Kshs 18.0 mn from Kshs 44.9 mn in H1’2017. Total fees and commissions however increased by 7.2% to Kshs 129.4 mn from Kshs 120.1 mn in H1’2017 due to a 47.0% increase in other fees to Kshs 111.4 mn in H1’2018 from Kshs 75.8 mn in H1’2017. The current revenue mix stands at 70:30 funded to non-funded income as compared to 79:21 in H1’2017. The proportion of non-funded income to total revenue increased owing to the faster growth in NFI, coupled with the decline in NII,
- Total operating expenses increased by 9.4% to Kshs 1.9 bn from Kshs 1.8 bn in H1’2017, largely driven by a 37.0% increase in other operating expenses to Kshs 845.4 mn from Kshs 616.9 mn in H1’2017, as well as a 13.8% rise in staff costs to Kshs 601.4 mn from Kshs 528.4 mn in H1’2017. Loan loss provisions however declined by 40.1% to Kshs 228.1 mn in H1’2018 from Kshs 380.9 mn in H1’2017,
- The cost to income ratio deteriorated to 99.3% from 88.3% in H1’2017. Without LLP, the cost to income ratio also deteriorated to 87.5% from 69.1% in H1’2017,
- Profit before tax declined by 94.5% to Kshs 12.6 mn from Kshs 231.1 mn in H1’2017. Profit after tax declined by 95.7% to Kshs 6.8 mn in H1’2018 from Kshs 159.0 mn in H1’2017,
- The balance sheet recorded a contraction as total assets declined by 8.5% to Kshs 65.5 bn from Kshs 71.6 bn in H1’2017. This decline was driven by a 9.8% decline in the loan book to Kshs 47.6 bn from Kshs 52.8 bn in H1’2017. Government securities increased by 17.3% to Kshs 4.0 bn in H1’2018 from 3.4 bn in H1’2017,
- Total liabilities declined by 9.9% to Kshs 54.4 bn from Kshs 60.3 bn in H1’2017, driven by a 3.1% decline in customer deposits to Kshs 36.2 bn from Kshs 37.4 bn in H1’2017. Furthermore, borrowings declined by 27.7% to Kshs 15.6 bn in H1’2018 from Kshs 21.6 bn in H1’2017. However, deposits per branch increased by 10.2% to Kshs 1.6 bn from Kshs 1.5 bn in H1’2017 with the number of branches declining to 22 from 25 as at H1’2017,
- The loans to loanable funds ratio increased to 91.1% from 89.3% in H1’2017, due to an 11.6% decline in loanable funds to Kshs 52.2 bn from Kshs 59.1 bn in H1’2017,
- Gross non-performing loans increased by 12.0% to Kshs 8.9 bn in H1’2018 from Kshs 7.9 bn in H1’2017. As a consequence, the NPL ratio deteriorated to 17.4% in H1’2018 from 14.2% in H1’2017. General loan loss provisions increased by 15.4% to Kshs 2.0 bn from Kshs 1.7 bn in H1’2017. Thus, the NPL coverage improved to 39.0% in H1’2018 from 36.0% in H1’2017, due to the relatively faster increase in loan loss provisions,
- Shareholders’ funds declined by 9.9% to Kshs 54.4 bn in H1’2018 from Kshs 60.3 bn in H1’2017,
- HF Group Limited is currently sufficiently capitalized with a core capital to risk weighted assets ratio of 15.5%, 5.0% above the statutory requirement. In addition, the total capital to risk weighted assets ratio was 16.9%, exceeding the statutory requirement by 2.4%. Adjusting for IFRS 9, the core capital to risk weighted assets stood at 16.5%, while total capital to risk weighted assets came in at 18.0%, indicating that the bank’s total capital relative to its risk-weighted assets declined by 1.1% due to implementation of IFRS 9,
- HF Group currently has a return on average assets of (0.04%) and a return on average equity of (0.2%).
Given the poor performance, HF Group could improve in the future by:
- NFI growth expansion: HF Group’s NFI is below the industry average, coming in at 30.0%. vs industry average of 34.3%. The growth in NFI could to be driven by increased adoption of alternative channels with the Group shifting focus to deepening its digital banking proposition having launched their digital banking platform in July, dubbed HF Whizz, which will enable customers to open an account, access loans, and deposit and transfer cash on mobile phones in a bid to grow non – funded income streams. This will improve operational efficiency as well as increase the bank’s transactional income,
- Aligning the staff headcount to the bank’s operational needs: The Bank is set to lay off 36 employees in a cost-cutting drive that will see it merge some staff positions. The move will provide clarity on operational accountabilities and curb the high operational costs, thereby improving operational efficiency,
- Fundamentally, we think HF Group as a conventional bank is a long stretch given inability to gather deposits. Ultimately, it seems that the end game will be coupling up with a strong bank with a sizeable asset base and a strong deposit gathering capability, thereby complementing HF’s strength in mortgages and real estate development.
For a more comprehensive analysis, see our Housing Finance Company Limited H1’2018 earnings note.
The performance of the listed banking sector is summarized in the table below:
|
Bank |
Core EPS Growth |
Interest Income Growth |
Interest Expense Growth |
Net Interest Income Growth |
Net Interest Margin |
Non-Funded Income (NFI) Growth |
NFI to Total Operating Income |
Growth in Total Fees & Commissions |
Deposit Growth |
Growth In Govt Securities |
Loan Growth |
LDR |
Cost of Funds |
Return on Average Equity |
|
Stanbic |
104.5% |
15.4% |
21.7% |
11.9% |
4.9% |
34.0% |
50.0% |
(4.2%) |
21.3% |
26.9% |
15.4% |
71.4% |
3.1% |
14.8% |
|
National Bank |
39.3% |
(9.6%) |
(10.1%) |
(8.9%) |
6.9% |
(13.1%) |
28.8% |
(15.7%) |
(2.8%) |
9.8% |
(16.1%) |
49.8% |
3.0% |
(0.6%) |
|
Stanchart |
30.3% |
7.9% |
8.8% |
7.5% |
8.0% |
12.2% |
32.9% |
36.2% |
2.8% |
3.5% |
(1.1%) |
48.4% |
3.6% |
18.0% |
|
KCB Group |
18.0% |
6.1% |
11.9% |
4.3% |
8.6% |
(0.1%) |
32.2% |
(6.0%) |
8.7% |
8.7% |
3.6% |
80.3% |
3.0% |
21.9% |
|
Equity Group |
17.6% |
10.2% |
14.0% |
9.1% |
8.8% |
1.5% |
40.2% |
(1.0%) |
8.5% |
18.7% |
3.8% |
69.9% |
2.7% |
23.9% |
|
I&M Holdings |
11.7% |
5.1% |
13.2% |
0.1% |
7.1% |
34.4% |
35.1% |
39.5% |
30.6% |
(28.3%) |
12.6% |
77.2% |
4.6% |
17.2% |
|
Co-op Bank |
7.6% |
7.9% |
2.2% |
10.4% |
8.6% |
(1.6%) |
32.1% |
(2.6%) |
3.9% |
12.0% |
(0.6%) |
84.6% |
3.9% |
18.0% |
|
Barclays Bank |
6.2% |
7.6% |
22.4% |
4.0% |
9.0% |
6.9% |
30.0% |
1.9% |
14.9% |
33.6% |
7.5% |
81.2% |
2.60% |
17.5% |
|
DTBK |
2.5% |
3.9% |
3.0% |
4.6% |
6.5% |
8.0% |
21.6% |
7.2% |
9.9% |
22.5% |
3.5% |
70.4% |
5.0% |
14.0% |
|
NIC Group |
(2.1%) |
8.6% |
30.0% |
(4.9%) |
6.0% |
7.0% |
29.5% |
(3.0%) |
10.5% |
25.7% |
(1.5%) |
78.2% |
5.4% |
12.8% |
|
HF Group |
(95.7%) |
(13.2%) |
(12.7%) |
(13.9%) |
4.9% |
38.2% |
30.4% |
7.2% |
(3.1%) |
17.3% |
(9.8%) |
131.4% |
7.0% |
(0.2%) |
|
Weighted Average H1'2018 |
19.0% |
7.9% |
12.0% |
6.4% |
8.1% |
6.9% |
34.3% |
4.6% |
10.0% |
13.7% |
3.8% |
73.8% |
3.4% |
19.3% |
|
Weighted Average H1'2017 |
(13.8%) |
(8.3%) |
(9.3%) |
(6.9%) |
7.1% |
(6.9%) |
36.1% |
16.9% |
6.0% |
17.2% |
6.8% |
77.9% |
2.9% |
21.0% |
|
*Weighted average as at 31/8/2018 |
||||||||||||||
Key takeaways from the table include:
- All listed banks recorded an increase in core EPS growth with the exception of only NIC Group and HF Group, with the weighted average increase coming in at 19.0% compared to a decrease of 13.8%, for the same period in 2017. Growth was driven by an increase in the Net Interest Income (NII), which came in at 6.4%, and a 6.9% growth in NFI. This indicates that the banking industry has adjusted to the new operating environment;
- Average deposit growth came in at 10.0%. Interest expense paid on deposits recorded a faster growth of 12.0% on average, indicating that more interest earning accounts have been opened. Deposits are expected to grow going forward as the proposed changes regarding financial inclusion in the Banking Sector Charter take effect;
- Average loan growth came in at 3.8%, while investment in government securities has grown by 13.7%, outpacing the loan growth, showing increased lending to the government by banks as they avoid the risky borrowers. The loan to deposit ratio thus declined to 73.8% from 77.9% in H1’2017; and,
- The average Net Interest Margin in the banking sector currently stands at 8.1%, an increase from the 7.1% recorded in H1’2017.
Monthly Highlights
The Central Bank of Kenya (CBK) proposed to introduce a Banking Sector Charter that will guide service provision in the sector. The Charter aims to instill discipline in the banking sector in order to make it responsive to the needs of the banked population. The charter is expected to facilitate a market-driven transformation of the Kenyan-banking sector and bring about tangible benefits for Kenyans, specifically to increase access to affordable financial services for the unbanked and under-served population. We are of the view that, if adopted, the Banking Sector Charter will go a long way towards removing the existing opacity in loan prices and promote the adoption of the risk-based loan-pricing framework. However, we are even of the stronger view, as captured in our Focus Notes titled “Rate Cap Review Should Focus More on Stimulating Capital Markets” and Status of Rate Cap Review in Finance Bill, that the best way to bring discipline in the banking sector is to reduce banking sector dominance by promoting alternative products. In a developed economy, bank funding makes about only 40% of business funding, while in Kenya, it makes up 95% of business funding, meaning businesses are over reliant on bank funding. To stimulate competing products, we recommend the following measures:
- Legislation and policies to promote competing sources of financing should be the centerpiece of the repeal legislation: A lot of legislative action has focused on the banks, yet we also need legislation to promote competing products that will diversify funding sources, which will enable borrowers to tap into alternative avenues of funding that are more flexible and pocket-friendly. This can be done through the promotion of initiatives for competing and alternative products and channels, in order to make the banking sector more competitive. In developed economies, 40% of business funding comes from the banking sector, with 60% coming from non-bank institutional funding. In Kenya, 95% of all funding is bank funding, and only 5% from non-bank institutional funding, showing that the economy is highly dominated by the banking sector and should have more alternative and capital market products for funding businesses. Alternative investment managers and the capital markets regulators need to look at how to enhance non-bank funding, such as high yield investment vehicles, such as High Yield Solutions. The products offer investors with cash an opportunity to invest at a rate of about 18% to 19% per annum, equivalent to what the fund takers, such as real estate developers, would have to pay to get funds from the banks. Instead of a saver taking money to the bank and getting negligible returns, they can just invest in a funding vehicle where the business would pay them the same 18% to 19% per annum that they would pay to get the same money from the bank. For the saver, it helps improve their rate from low rates, at best 7% per annum, to as high as 18% per annum, and for the business seeking funding, it helps them access funding much faster to grow their business. Promoting alternative funding is also essential to the affordable housing piece of the “Big Four” government agenda, which requires capital markets funding,
- Consumer protection: The implementation of a strong consumer protection, education agency and framework, to include robust disclosures on cost of credit, free and accessible consumer education, enforcement of disclosures on borrowings and interest rates, while also handling issues of contention and concerns from consumers,
- Promote capital markets infrastructure: Efficient capital markets infrastructure is necessary in both regulated and private markets. The Capital Markets Authority (CMA) could aid in enhancing the capital markets’ depth in various ways such as (i) making it easier for new and structurally unique products to be introduced in the capital and financial markets, (ii) institute predictable deadlines for processing submissions from market applicants and expedite processing of applications, (iii) push for a one stop shop for applicants such that an approval from the authority on products such as REITS would suffice, as opposed to current structure where applicants have to chase other approvals from other agencies such as KRA.
- Addressing the tax advantages that banks enjoy: Level the playing field by making tax incentives available to banks to be also available to non-bank funding entities and capital markets products such as unit trust funds and private investment funds. For example, providing alternative and capital markets funding organizations with the same withholding tax incentives that banking deposits enjoy, of a 15% final withholding tax so that depositors don’t feel that they have to go to a bank to enjoy the 15% withholding tax; alternatively, normalize the tax on interest for all players to 30% to level the playing field,
- Consumer education: Educate borrowers on how to be able to access credit, the use of collateral, and the importance of establishing a strong credit history,
- The adoption of structured and centralized credit scoring and rating methodology: This would go a long way to eliminate any biases and inconsistencies associated with accessing credit. Through a centralized Credit Reference Bureau (CRB), risk pricing is more transparent, and lenders and borrowers have more information regarding credit histories and scores, thus enabling banks price customers appropriately, spurring increased access to credit,
- Increased transparency: This can be achieved through a reduction in the opacity in debt pricing. This will spur competitiveness in the banking sector and bring a halt to excessive fees and costs. Recent initiatives by the CBK and Kenya Bankers Association (KBA), such as the stringent new laws and cost of credit website being commendable initiatives,
During the week, the Nairobi Securities Exchange (NSE) hosted London Stock Exchange Group (LSEG) officials, with the discussions centred on dual listing by Kenyan companies on the London Stock Exchange (LSE). This is part of LSE’s initiative to get more African companies listed on the exchange. To date, there are 111 African firms listed on the London Stock Exchange, the greatest number on any international exchange, with a combined market cap of over USD 149.0 bn. The London Stock Exchange has been partnering with African exchanges, such as the Nigerian Stock Exchange, where most recently Seplat Petroleum Development PLC was listed on both the London Stock Exchange and the Nigerian Stock Exchange in 2014, and raised USD 500.0 mn. In March 2016, LSEG formed an Africa Advisory Group, to act as a forum to discuss the development of Africa’s capital markets and how best to address the challenges and opportunities which this presents. Some of the challenges that have been faced by companies seeking to dual-list include; (i) lack of sufficient information on foreign investor appetite, (ii) arcane procedures associated with listing on a foreign exchange and, (iii) regulatory impediments associated with listing on a foreign exchange. A partnership between the LSE and the NSE is important, as it will provide a host of benefits to Kenyan companies, among them being;
- Opening up these companies to a larger pool of potential investors (both retail and institutional), thereby deepening of local capital markets,
- Allowing companies to take advantage of economic conditions in different markets at different times, for instance when there is a slowdown in the Kenyan market, foreign markets can act as a buffer,
- Local companies will uphold the highest standards of governance, given the regulatory requirements by foreign markets such as the UK, which will boost the credibility of local markets, and,
- Increasing the standards of listing and turnaround time in the local market if we were to benchmark and aspire to the global markets standards.
This will be the second time that the LSEG will be collaborating with the NSE, the first being the LSEG’s FTSE Russell benchmarking business collaborated with the Nairobi Securities Exchange in 2011, and Namibian Stock Exchange in 2016 to launch Kenyan and Namibian-focused Index Series.
Corporate Governance Changes:
Standard Chartered Bank Kenya Limited announced the appointment of Mr Imtiaz Khan as an independent Non-Executive director of the company.
Following the Standard Chartered Bank Board Changes:
- The addition of one director brings the sum of board members to 12 (even number) thus the score on board size reduces to 0.5 from 1;
- Gender diversity declined to 25.0% from 27.2%, but the score remains unchanged at 0.5, as it is still less than 30.0%;
- The proportion of Non-Executive members improved slightly to 66.7% from 63.6%, thus the score remains the same at 1, as it is still greater than 50.0%.
Overall, the comprehensive score is reduced to 79.2% from 81.3% and as a result, Standard Chartered drops from 5th position to 6th in the 2017 Cytonn Corporate Governance index.
Universe of Coverage
|
Banks |
Price as at 31/07/2018 |
Price as at 24/08/2018 |
Price as at 31/08/2018 |
w/w change |
m/m change |
YTD Change |
Target Price* |
Dividend Yield |
Upside/ Downside** |
P/TBv Multiple |
|
NIC Bank*** |
34.5 |
32.8 |
30.0 |
(8.4%) |
(13.0%) |
(11.1%) |
54.1 |
3.3% |
68.5% |
0.8x |
|
I&M Holdings*** |
110.0 |
105.0 |
100.0 |
(4.8%) |
(9.1%) |
0.0% |
169.5 |
3.5% |
64.9% |
1.1x |
|
Zenith Bank*** |
21.2 |
22.0 |
21.2 |
(3.6%) |
0.0% |
(17.5%) |
33.3 |
12.8% |
64.6% |
1.0x |
|
Ghana Commercial Bank*** |
5.1 |
5.3 |
5.4 |
0.2% |
5.3% |
5.9% |
7.7 |
7.1% |
51.7% |
1.3x |
|
Diamond Trust Bank*** |
200.0 |
190.0 |
190.0 |
0.0% |
(5.0%) |
(1.0%) |
280.1 |
1.4% |
48.8% |
1.1x |
|
Union Bank Plc |
5.9 |
5.6 |
5.9 |
5.4% |
(0.8%) |
(25.0%) |
8.2 |
0.0% |
46.8% |
0.6x |
|
UBA Bank |
9.6 |
8.0 |
8.1 |
1.3% |
(15.2%) |
(21.4%) |
10.7 |
10.5% |
44.2% |
0.5x |
|
HF Group*** |
8.0 |
7.5 |
7.8 |
3.3% |
(3.1%) |
(25.5%) |
10.2 |
4.1% |
40.1% |
0.3x |
|
KCB Group*** |
47.0 |
48.0 |
45.0 |
(6.3%) |
(4.3%) |
5.3% |
60.9 |
6.7% |
33.5% |
1.5x |
|
CRDB |
160.0 |
160.0 |
160.0 |
0.0% |
0.0% |
0.0% |
207.7 |
0.0% |
29.8% |
0.5x |
|
Barclays |
11.6 |
11.8 |
11.0 |
(6.4%) |
(4.8%) |
14.6% |
14.0 |
9.1% |
28.2% |
1.6x |
|
Co-operative Bank |
17.0 |
16.6 |
16.5 |
(0.6%) |
(2.7%) |
3.1% |
19.7 |
4.8% |
23.5% |
1.5x |
|
Ecobank |
8.2 |
9.0 |
9.0 |
0.0% |
9.0% |
18.0% |
10.7 |
0.0% |
19.6% |
2.0x |
|
Equity Group |
48.0 |
50.0 |
45.0 |
(10.0%) |
(6.3%) |
13.2% |
55.5 |
4.4% |
15.4% |
2.4x |
|
Stanbic Bank Uganda |
32.8 |
33.0 |
33.0 |
0.0% |
0.8% |
21.1% |
36.3 |
3.5% |
13.5% |
2.3x |
|
CAL Bank |
1.3 |
1.3 |
1.1 |
(13.4%) |
(13.4%) |
1.9% |
1.4 |
0.0% |
10.2% |
1.1x |
|
Access Bank |
10.0 |
9.0 |
9.4 |
3.9% |
(6.5%) |
(10.5%) |
9.5 |
4.3% |
9.8% |
0.6x |
|
Bank of Kigali |
290.0 |
290.0 |
290.0 |
0.0% |
0.0% |
(3.3%) |
299.9 |
4.8% |
8.2% |
1.6x |
|
Guaranty Trust Bank |
40.1 |
37.5 |
37.0 |
(1.3%) |
(7.6%) |
(9.2%) |
37.1 |
6.5% |
5.4% |
2.3x |
|
SBM Holdings |
7.4 |
6.7 |
6.6 |
(1.5%) |
(10.8%) |
(12.0%) |
6.6 |
4.5% |
2.5% |
1.0x |
|
Standard Chartered |
203.0 |
206.0 |
205.0 |
(0.5%) |
1.0% |
(1.4%) |
184.3 |
6.1% |
(4.4%) |
1.7x |
|
Bank of Baroda |
140.0 |
145.0 |
144.0 |
(0.7%) |
2.9% |
27.4% |
130.6 |
1.7% |
(8.2%) |
1.3x |
|
Stanbic Holdings |
93.5 |
107.0 |
100.0 |
(6.5%) |
7.0% |
23.5% |
85.9 |
2.3% |
(17.5%) |
1.0x |
|
Stanbic IBTC Holdings |
49.8 |
49.5 |
48.0 |
(3.0%) |
(3.5%) |
15.7% |
37.0 |
1.2% |
(24.0%) |
2.5x |
|
Standard Chartered |
26.0 |
26.5 |
26.0 |
(1.8%) |
0.1% |
3.0% |
19.5 |
0.0% |
(26.6%) |
3.3x |
|
FBN Holdings |
10.1 |
9.7 |
9.0 |
(7.3%) |
(11.4%) |
1.7% |
6.6 |
2.8% |
(28.5%) |
0.5x |
|
Ecobank Transnational |
20.6 |
20.0 |
19.6 |
(2.3%) |
(5.1%) |
15.0% |
9.3 |
0.0% |
(53.6%) |
0.7x |
|
National Bank |
5.8 |
6.1 |
5.8 |
(4.1%) |
0.0% |
(38.0%) |
2.8 |
0.0% |
(53.7%) |
0.4x |
|
*Target Price as per Cytonn Analyst estimates **Upside / (Downside) is adjusted for Dividend Yield ***Banks in which Cytonn and/or its affiliates holds a stake. For full disclosure, Cytonn and/or its affiliates holds a significant stake in NIC Bank, ranking as the 5th largest shareholder ****Stock prices indicated in respective country currencies |
||||||||||
We are “NEUTRAL” on equities for investors with a short-term investment horizon since the market has rallied and brought the market P/E slightly above its’ historical average. However, pockets of value exist, with a number of undervalued sectors like, financial services, which provide an attractive entry point for long-term investors, and with expectations of higher corporate earnings this year, we are “POSITIVE” for investors with a long-term investment horizon.
During the month of August, there were private equity activities in Fundraising, as well as in the Fintech and Financial Services sectors.
Financial Services Sector
- Mauritius based African Rainbow Capital, an investment holding company that invests in financial services businesses, agreed to acquire the remaining 90% stake in the Commonwealth Bank of South Africa Limited (CBSA), which trades as TymeDigital, from the Commonwealth Bank of Australia for an undisclosed amount. African Rainbow Capital currently holds a 10% stake in TymeDigital, with the Commonwealth Bank of Australia holding the remaining 90%. Commonwealth Bank of Australia bought Tyme (Take Your Money Everywhere), the South African FinTech business, in 2015. For more information, see our Cytonn Weekly #30/2018
- Old Mutual, a UK based financial services group, is set to increase its stake in UAP-Old Mutual Holdings from 60.7% to 66.7%, in a deal to purchase a 6.0% stake in UAP-Old Mutual for GBP 24.0 mn (Kshs 3.1 bn). The transaction will involve the acquisition of 12.7 mn shares of UAP-Old Mutual Holdings’ Chairman Joe Wanjui (9.8 mn shares) and Director James Muguiyi (2.9 mn shares) at a price of Kshs 245.6 per share. The current transaction at Kshs 245.6 per share represents a 36.7% premium on the 2015 buyout price of Kshs 180.0 per share. The transaction is valued at GBP 24.0 mn (Kshs 3.1 bn), which puts the value of UAP-Old Mutual Holdings at GBP 400.0 mn (Kshs 52.0 bn). The acquisition will be carried out at a P/B multiple of 2.7x, which is a 30.3% premium on the average insurance sector transaction P/B multiple of 2.1x over the last seven-years. For more information, see our Cytonn Weekly #32/2018
Fundraising
- Investors in the Abraaj Growth Markets Health Fund (AGHF), a subsidiary of Abraaj Group, a Dubai-based private equity firm with USD 13.6 bn in assets under management, have appointed AlixPartners, a US firm, to oversee the separation of the health fund from the Abraaj Group. The separation follows allegations of mismanagement of the USD 1.0 bn invested in the special purpose vehicle. AGHF, whose main investors are the Bill & Melinda Gates Foundation, World Bank’s International Finance Corporation (IFC), Britain’s CDC Group and Proparco Group of France, has invested heavily in Kenyan clinics and hospitals, namely Nairobi Women’s Hospital, Avenue Hospital, Metropolitan Hospital, and Ladnan Hospital. For more information, see our Cytonn Weekly #32/2018
Fintech
- Jamii Africa, an InsurTech (Insurance Technology) company based in Tanzania, received an equity investment of USD 0.7 mn (Kshs 70.6 mn) for an undisclosed stake from US-based entrepreneur, Patrick Munis, as it closes in on its target of USD 2.0 mn (Kshs 201.7 mn) for expansion into Kenya. In February 2018, the GSM Association, announced that it had granted Jamii (an undisclosed amount) as part of its start-up portfolio. In early 2017, Jamii closed a USD 0.75 mn (Kshs 75.6 mn) round of seed funding, split equally between grants and venture capital. This came on the back of a USD 0.25 mn (Kshs 25.2 mn) grant from the Bill and Melinda Gates Foundation. For more information, see our Cytonn Weekly #31/2018
- Lendable, a FinTech platform based in Kenya and the US, has secured a Kshs 45.3 mn (USD 0.45 mn) convertible grant from the Dutch Government’s MASSIF fund, managed by FMO, the Dutch Development Bank. This grant is expected to unlock an additional Kshs 452.7 mn (USD 4.5 mn) from commercial investors to fund alternative lenders. Alternative lenders are non-banking, asset backed finance providers, who operate Pay-as-you-go (PayGo) platforms and also offer microfinance loans. They provide under-banked consumers with access to credit and enable them to own productive assets. In October last year, the firm announced that it had raised Kshs 671.0 mn (USD 6.5 mn) in a Series A round of investment.
Lendable was founded in 2014 and it has analysed over 700,000 loans, signed up seven fast-growing alternative lenders, and has plans to move USD 40.0 mn in capital in 2018. The company helps lenders access multiple finance rounds valued from USD 0.25 mn to USD 10.0 mn, with terms of 6 to 18 months and annual percentage rates of 12% to 18%. Its ‘Maestro’ technology platform allows for direct data integration with these alternative lenders, as well as loan portfolio data analysis and cash flow predictions.
In April last year, the firm secured Kshs 56.6 mn (USD 0.55 mn) debt financing for Raj Ushanga House (RUH), the Kenya distributor for Azuri Technologies Ltd, a leading provider of Pay-as-you-go (PayGo) solar energy solutions. In the same year, it gave Watu Credit, a Mombasa-based lender that finances acquisition of motor cycle taxis on credit, Kshs 155.0 mn (USD 1.5 mn) debt to boost its expansion in Kenya. Lendable’s partnership with FMO is expected to scale up the volume of capital reaching SMEs, as well as support the implementation of the Responsible Finance Guidelines, which they both signed in June 2018.
Private equity investments in Africa remains robust as evidenced by the increasing investor interest, which is attributed to; (i) rapid urbanization, a resilient and adapting middle class and increased consumerism, (ii) the attractive valuations in Sub Saharan Africa’s private markets compared to its public markets, (iii) the attractive valuations in Sub Saharan Africa’s markets compared to global markets, and (iv) better economic projections in Sub Sahara Africa compared to global markets. We remain bullish on PE as an asset class in Sub-Sahara Africa. Going forward, the increasing investor interest and stable macro-economic environment will continue to boost deal flow into African markets.
During the month of August, the real estate sector recorded an increase in activities driven by: i) intensified government efforts to bridge the housing deficit in the country, which stands at 2.0 mn units according to National Housing Corporation, ii) positive demographics such as a high population growth rate of 2.5%, 1.3% points higher than the global average of 1.2% and a high rate of urbanization of 4.2%, compared to the global average of 2.0% as at 2017 as per the World Bank, which have created sustained demand for housing and commercial real estate across the country, iii) a stable macroeconomic environment with GDP growth averaging at 5.5% over the last 5-years, and we expect growth to come in at 5.5% in 2018, and iv) continued infrastructural improvements evidenced by the significant 2017/2018 national budget allocation of Kshs 134.9 bn, which is 22.2% of the total budget, to infrastructural development that will open up areas for investment.
In this report, we have highlighted industry reports that were released during the month, then delved into the review of the residential, commercial, hospitality, infrastructure and listed real estate sectors and concluded with statutory actions that happened during the month.
- Industry Reports:
Two reports released during the month of August underlined the performance of the real estate sector as explained in the table below:
|
Industrial Reports Released in August |
|
|
Report |
Key Take Outs |
|
|
|
|
Source: Cytonn Research
- Residential Sector:
Activities in the residential sector during the month were mostly focused on the affordable housing initiative by the Central Government under the Big 4 Agenda;
- The Kenya Mortgage Refinancing Company (KMRC) continued to gain much-needed financial support with the Co-operative Bank announcing that it will invest Kshs 200.0 mn worth of share capital in support of the facility. The facility is also expected to receive Kshs 15.1 bn seed funding from the World Bank, and Kshs 1.5 bn from the National Treasury. For more information, please see Cytonn Weekly #31/2018,
- The UN – Habitat advised the Kenyan Government to intervene through policies to ensure that the 23,000 Savings and Credit Co-operative Organizations (SACCOs), who have close to Kshs 1 trillion in savings, have access to serviced land, professional expertise, and reduced tax on building materials that would facilitate provision of mass affordable housing to low income earners. If implemented, these policies will create an enabling environment for SACCOs and other players on the supply side to produce low-income housing and thus contribute towards the achievement of the Jubilee Government’s Big 4 Agenda. For more information, please see Cytonn Weekly #30/2018,
- Partnership between the National Government and Nairobi County Government has led to an acquisition of land parcels in areas such as Kibera, Mariguni, Parkroad, Starehe, Shauro Moyo and Makongeni to be used for provision of affordable housing. For more information, please see Cytonn Weekly #30/2018, and,
- Nairobi Lands, Urban Renewal and Housing County Executive, Mr. Charles Kerich, announced that the implementation of the Nairobi Urban Regeneration Plan will start in September 2018 in Pangani Estate, where a developer known as Technofin will break ground. The Regeneration Plan, which aims at providing new homes while renovating old ones, will be a partnership between Nairobi County and various developers, whereby the county provides free land while the developers finance and construct the houses. For more information, please see Cytonn Weekly #31/2018.
The above are testament to the government’s commitment towards delivery of at least 500,000 affordable units by 2022. During the month, however, the proposal by the Treasury to levy a 0.5% deduction of the gross pay per month to workers in the formal sector was turned down by Members of Parliament as they deemed it a burden to both the workers and the companies. The funds were initially meant to partly finance the low-cost housing projects and thus the government has to consider alternative options to raise finance. To encourage the involvement of the private sector, there is need for consideration of policies that will save on development costs with the key areas that require attention being i) construction costs as they contribute to approximately 50%-70% of development costs, ii) provision of offsite infrastructure and serviced land so that developers save on costs that would have otherwise been incurred, and iii) access to finance through advocacy for alternative sources of development funding such as structured products and REITs.
In the middle and high-end market segments, developers continue to invest in real estate attracted by the high returns and increased demand for institutional grade developments. During the month, Double Win Company Limited, a real estate firm, announced plans to put up a residential complex along Argwings Kodhek Road in Kilimani. The project will comprise of two blocks of 14 storeys each, and will have 168-apartments; 2 and 3 bedroom units. According to our research in July 2018, apartments in Kilimani are a lucrative investment opportunity bearing average total returns of 13.9%, 5.7% points higher than the market average of 8.2%, which is attributable to good infrastructure and to its proximity to key business districts and nodes such as CBD, Upperhill and Westlands. For more information, please see Cytonn Weekly #32/2018.
Centum, an investment firm in Kenya, announced plans to break ground on Riverbank Apartments within their Two Rivers Mixed Use Development based in Runda, whereby the residential development will consist of 196 – units of 1-bedroom, 2-bedroom and 3-bedroom typologies measuring 87 SQM, 128 SQM and 185 SQM, respectively. With investments in other sectors such as financial services, power generation, education, healthcare and agribusiness, Centum has diversified into real estate with a view of generating attractive returns. Other real estate projects by Centum in the offing include i) the 180 – acre industrial park in Vipingo at the Coast, ii) the 30 – acre Awali Estate in Kilifi comprising of 62 maisonettes of 210 SQM and 90 bungalows of 155 SQM, and iii) the 1,255 Palm Ridge Homes in Kilifi consisting of 1, 2 and 3-bedroom units for a price Kshs 2.0 mn, Kshs 3.0 mn and 4.0 mn, respectively. The investment firm, however, noted a decline in profits in 2017 from Kshs 6.45 bn to Kshs 4.18 bn on account of a difficult operating environment in 2017 with reduced access to credit and the heated political environment. This is in line with our Cytonn Nairobi Metropolitan Residential Report that showed a 1.2% points drop in returns from 9.4% in 2016/17 to 8.2% in 2017/18. In our view, the setbacks in 2017 were temporary and we expect recovery of the market in 2018 on the back of an attractive demographic profile, infrastructural development, and political stability. However, given the increased supply and competition in the market, we recommend that investors ought to conduct proper research to identify niches in the market before investing.
- Commercial Sector:
In the commercial office sector, Prism Towers, a 33–storey building of 133m in height, developed by Kings Developers Ltd officially opened for occupation. The building, situated in Upperhill, and whose construction began in 2014 brings to the market a total of 250,000 SQFT of lettable office space. According to Cytonn Nairobi Commercial Office Report 2018, yields in the office sector in Upperhill have stagnated at an average of 9.0% in 2016 and 2017 with occupancy rates dropping by 7.8% points from 89.8% in 2016 to 82.0% in 2017 attributable to the increased supply of office space in the node with no adequate demand to take it up. In light of this, we retain a negative outlook for the commercial office sector in Nairobi. For more information, please see Cytonn Weekly #30/2018
In the retail sector, we saw increased uptake of retail space with several global and local retailers expanding or announcing plans to expand. In our view, the expansion of retailers is on the account of (i) high economic growth rates with the GDP growth rate averaging above 5.0% p.a over the last 5-years thus boosting disposable incomes, and increasing purchasing power, (ii) Kenya’s growing position as a regional and continental hub, hence witnessing an increase in multinationals operating in the country, and (iii) the huge opportunity, with Kenya having a formal retail penetration of 35% according to Oxford Business Group, compared to markets like South Africa with a penetration of 60%. The table below shows the various stores and their announced expansion plans;
|
Table Showing Retailers and Their Expansion During The Month |
|||||
|
Name |
Country of Origin |
Type of Store |
Stores opened or announced during the month |
No of Stores in Kenya |
Location of Stores in Kenya |
|
Bosch |
German |
Electronics |
1 Opened at The Oval |
1 |
The Oval, Westlands |
|
Subway |
United States |
Fast Food |
4 planned at CBD, Upperhill, Lavington, and Mombasa Road |
9 |
Junction Mall, Nairobi CBD, Thika Road Mall (TRM), Timau Plaza (Opp Yaya Center), Amee Arcade (in Parklands), Westgate mall, University way, Village Market and The Hub (in Karen) |
|
Burger King |
United States |
Fast Food |
1 opened at Thika Road Mall (TRM) |
4 |
Thika Road Mall, Two Rivers mall, Nextgen Mall and The Hub |
|
LC Waikiki |
Turkey |
Clothing |
1 planned for opening at Thika Road Mall (TRM) |
3 |
Two Rivers mall, The Hub and Mombasa City mall |
|
Java Group |
Kenya |
Restaurant |
3 planned in Kigali, Rwanda |
64 |
Uniafirc, Bufallo Mall, JKIA, Thika Road, Kileleshwa, Kimathi Street, Orbit Place, Capital Center, Parklands, Upper hill, Mama Ngina, Kileleshwa, Hurlingham, Sarit Center, Embassy House, Westlands Square, Waiyaki Way, City Hall, Adam Arcade, Prestige Plaza, |
Source: Cytonn Research
The expansion of retailers into various malls has enhanced footfall as consumers increasingly seek to shop in formal retail stores due to the wide variety of products and new brands from both local and international retailers. In addition, the growth of retailers has a positive impact on real estate through the increased uptake of retail space leading to an improvement in performance in the retail sector. According to Cytonn Kenya Retail Sector Report 2018, occupancy rates increased by 3.4% points to 83.7% in 2018 from 80.3% in 2017 indicating increased retail uptake. However, rental yields declined by 0.2% points to 9.4% in 2018 from 9.6% in 2017 as a result of increased supply of retail space forcing developers to reduce rental charges to remain competitive.
In the industrial sector, Tilisi Research released a report dubbed ‘The Warehousing Market in Kenya’ highlighting the demand and supply of warehousing space in Kenya sector, the key demand drivers and the main challenges facing the sector. The key take-outs from the report were;
- Kenyan warehousing is primarily made up of small-scale go-downs of between 1,076 to 3,200 SQFT, which is lower than the international standards, for example the average size of warehouses in the US warehousing market is 184,693 SQFT. This was attributed to the fact that Kenyan operations are serving a much smaller market as opposed to most international operations,
- The report indicated an acute shortage of warehouse spaces as demand overlaps supply with the findings from their survey showing that 16% of respondents had sought new warehousing facilities in 2017/18, compared with 9% in 2016/17, and 6% in 2015/16 showing the increasing demand mainly from the Pharmaceutical, Logistics and FMCG industries,
- The factors that have led to the rise of demand in warehouse spaces are; i) rising of E-commerce in the region with increasing online retail sites such as Jumia, Kilimall International, Masoko, Aladin and PigiaMe creating the need for easily accessible warehouses, ii) improved infrastructure with the new Standard Gauge Railway establishing an in Inland Container Depot (ICD) in Embakasi-Nairobi that can handle 1,232 twenty-foot equivalent units daily leading to increase in warehouse spaces around the area, and iii) growth of the retail industry,
- The survey found that 75% of the warehouse renting companies pay below the price of Kshs. 45 per SQFT and that rents have been rising by 11.5% between 2015 and 2017 due to increase demand,
- Respondents in the survey highlighted various challenges in terms of warehousing needs including i) accessibility ii) location, iii) warehousing quality, and iv) affordability. The report concludes that infrastructure is key to the sector and noted that areas along Northern, Eastern and Southern Bypasses have attracted companies to set up warehouses as companies are able to save up to 30% on its logistics costs by reducing the cycle time to 2-days from 3 to 4-days, initially. On pricing, while 13% of the respondents cited affordability as an issue, it is important to note that 61% of respondents stated that they would be willing to pay more for warehousing in a well-located logistics park with Grade A facilities as they have the potential to reduce operational costs by up to 35%.
The report highlights the opportunity in investment in high quality warehousing space supported by the high demand. We anticipate further growth given the intensified focus on manufacturing as one of the 4 Pillars of focus by the government for the next 4-years and the increased investment in infrastructure that is likely to improve business in trade and logistics and also open up new fronts for warehouse development. As per Cytonn H1’ 2018 Markets Review, the industrial sector recorded improved performance in 2018 with rental yields increasing by 0.7% points from 5.4% as at H1’2017 to 6.1% in H1’2018, while occupancy levels increased by 11.8% from 77.3% recorded in 2017. The increase in yields was as a result of an 11.8% increase in occupancy levels driven by an increase in demand attributable to: i) the renewal of investor confidence following the conclusion of the prolonged electioneering period, and ii) the increased focus on manufacturing, among the governments Big 4 Agenda.
- The Hospitality Sector:
During the month of August, the Kenya National Bureau of Statistics released their June issue of Leading Economic Indicators showing that international arrivals recorded a 0.9% increase coming in at 443,950 in H1’2018 compared to 439,807 H1’2017. This growth is largely attributed to i) restoration of political calm, ii) the revision of negative travel advisories, warning international citizens, e.g. from the United States against visiting Kenya, iii) increased demand for accommodation and other hospitality services by both local and international guests, with the number of international arrivals growing by 16.7% from 1.2 mn in 2015 to 1.4 mn in 2017, iv) positive reviews from travel advisories such as Trip Advisor who ranked Nairobi as the 3rd best place to visit in 2018, and v) promotions from various campaign projects such as the British Euro-Afro Vocals Kenya campaign project that aims to market Kenya’s cultural tourism and material culture in the United Kingdom. In light of this, we are still confident of our forecast of an 11.0% increase in international arrivals from 1.45 mn in 2017 to 1.61 mn arrivals in 2018 as per the Cytonn Annual Market Outlook 2018, which will result in high occupancies and revenues in the hotel sector.
- Infrastructure:
In the infrastructure sector, the government continues to increase its investments in order to boost the country’s economic growth through; i) revenue generation, ii) increased employment opportunities, iii) betterment of services and facilities, and iv) improving the ease of doing business in Kenya. Below is a table highlighting infrastructural projects across the country that were announced during the month;
|
Announced Infrastructural Projects during the month |
||||
|
Name |
Type |
Length |
County |
Project Value (Kshs.) |
|
Miritini Terminus – Mombasa CBD |
Railway |
22km |
Mombasa |
200 mn |
|
Garissa Road – Thika Super Highway Bypass |
Roads |
10km |
Kiambu |
1.5 bn |
|
Garissa Road – Kenyatta Highway |
Roads |
15km |
Kiambu |
1.5 bn |
|
Nairobi Satellite Towns Water and Sanitation Development Programme Project |
Water |
* |
Kiambu – (Ruiru – Juja) & Kajiado (Kiserian – Ongata) |
3.6 bn |
|
Standard Gauge Railway (SGR) Phase 2B |
Railway |
262km |
Nakuru & Kisumu |
380 bn |
Source: Local Dailies, Cytonn Research 2018
The increased activities in the infrastructural sector by the government intensifies in a bid to address the huge deficit in infrastructure including rail, roads and ports and is evidenced by the significant 2017/2018 national budget allocation of Kshs 134.9 bn, which is 22.2% of the budget to infrastructural development. In our view, the increased investment in infrastructure is an indication that the government is committed to its developmental agenda and such infrastructural initiatives will help open up more areas for real estate development, increasing accessibility and access to essential services such as water, electricity and a sewerage system.
- Listed Real Estate:
- The Fahari I-REIT, Kenya
During the month, Stanlib’s Fahari I-REIT saw a decrease of 12.1%, closing at Kshs 10.2 per share from Kshs 11.6 per share at the end of July 2018. On average, the REIT traded at an average of Kshs 10.2 per share, a 4.7% drop from an average of Kshs 10.7 per share last month and 2.9% below its opening price of Kshs 10.5 per share at the beginning of 2018. Moreover, the highest price per share attained during the month came in at Kshs 10.3 per share, 11.2% lower than the month of July, which recorded a high of Kshs 11.6 per share. The prices for the instrument have remained low largely due to: i) Fahari I – REIT performing poorly with a dividend yield of 5.7% as opposed to brick and mortar retail and office in Nairobi with 9.4% and 9.3%, respectively, ii) inadequate investor knowledge, and iii) lack of institutional support for REIT’s. We expect the REIT to continue trading at low prices and in low volumes.
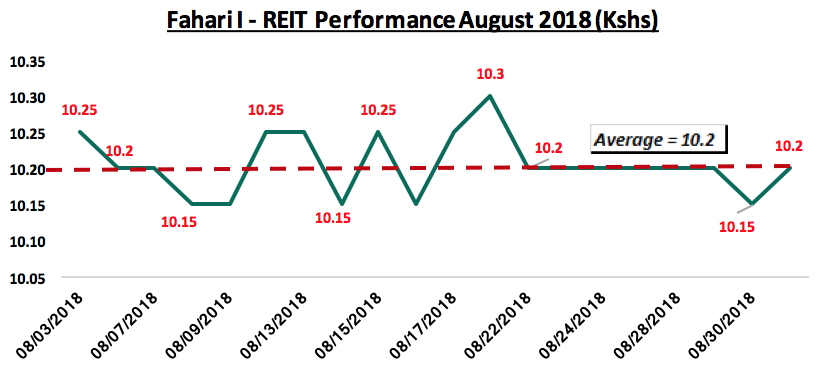
- REITS on the Nigeria Stock Exchange
REIT’s in the Nigerian market however continued to plateau with the three REITS i.e. Union Home, Skye Shelter and UPDC attaining a constant price per share of N45.2, N95.0 and N9.0, respectively, throughout the month. The performance is an indication of stalled demand for the instrument attributable to shallow investor knowledge and, we expect the performance to continue on this trend for the long term.
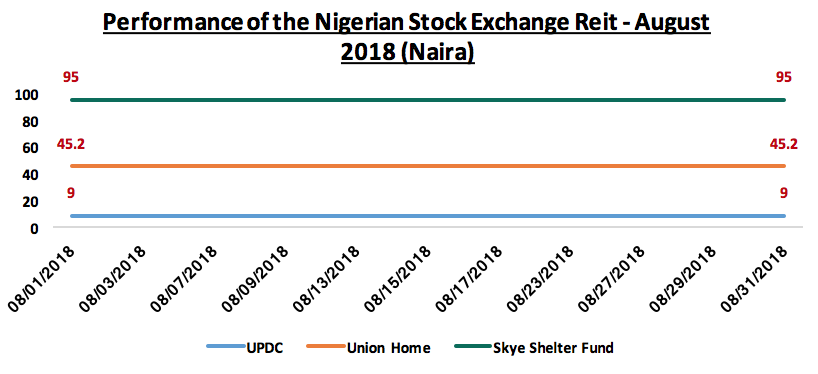
- Statutory Reviews and Actions:
During the month, several stakeholders in the real estate sector were affected by operations by the Nairobi River Regeneration Committee led by the National Environment Management Authority (NEMA) in plans that seek to alleviate the encroachment on riparian land. The move has seen demolition of developments that restrict flow of rivers and thus cause flooding. In addition, an in-house audit conducted by the National Construction Authority (NCA) found that 16.0% i.e. 800 of the 5,000 developments in Nairobi were unsafe for living. 18.3%, 146 of the 800 buildings, required structural adjustments to meet required standards while, 81.7%, 654 buildings did not obtain statutory approvals and had thus been earmarked for demolition. In our view, these challenges are consequences of (i) inadequate due diligence by developers, (ii) corruption in the Lands Ministry that has led to the issuance of public land to private real estate stakeholders, and (iii) lack of clear guidelines within the existing laws on the protection of riparian land i.e. Water Act, 2002, Water Resource Management Act 2007, Environment Management and Coordination Regulations of 2006. For instance, the Environment Management Coordination Regulations of 2006 puts the recommended riparian distance at a minimum of 6-metres and a maximum of 30-metres from the highest water mark while the Agriculture Act puts it at a minimum of 2-metres. We recommend proper due diligence by both the developers and the government officials before handing out approvals for construction and establishment of clear and consistent guidelines on the law of riparian land protection.
On the legal front, Members of Parliament (MPs) repealed the solar water heater law, which imposed a fine of Kshs 1.0 mn or a 1- year jail sentence to developers who fail to install solar water heating systems in their developments. Nullification of such laws will be a benefit to developers and the end user as they are in line to reduce development cost. Additionally, such statutory reviews are commended as such a law would be a hindrance in the achievement of the affordable housing initiative by the government by increasing the cost of development.
We expect the real estate sector in Kenya to continue on an upward trajectory given (i) continued improvement in infrastructure by the central government, (ii) expansion by global retailers into the country, (iii) expanding middle-class, and hence growing disposable incomes, and (iv) the relatively high urbanization rate in Kenya at 4.2% compared to the global average of 2.0%, necessitating the need for adequate housing in the urban areas.
In October 2017, we released the Kenya Retail Sector Report - 2017, themed “Cautious Optimism in the Face of Turbulence”, which focused on the performance of the retail real estate sector in Kenya in 2017. According to the report, the retail sector in Kenya was an attractive investment opportunity with average rental yields of 8.3% countrywide and 9.6% in Nairobi compared to other sectors such as the residential sector at 5.6% and office sector at 9.1%, driven by a growing middle-class population seeking aspirational lifestyles, high GDP growth rate, which averaged at more than 5.0% p.a over the previous five-years, and increased infrastructural developments opening up new areas for development. This week, we update that report with our Kenya Retail Sector Report - 2018. The report is based on findings from research conducted in 8 nodes in the Nairobi Metropolitan Area, as well as key urban cities and regions in Kenya, including North Rift, South Rift, Coastal Region, Western/Nyanza and Mt Kenya. The report highlights the performance of the real estate retail sector in Kenya in 2018, based on rental yields, occupancy rates, demand and supply, all in comparison to 2017 and the years before to identify the trends, and hence provides investors with an outlook for the sector, and we give a recommendation for investment. In this focus note, we will highlight the key take-outs from the report as below;
- Introduction to the Retail Sector in Kenya,
- Performance Summary in 2018,
- Retail Space Demand Analysis,
- Retail Space Investment Opportunity, and,
- Retail Sector Outlook.
1. Introduction to the Retail Sector in Kenya
In 2017, constrained by a tough operating environment characterized by low credit and prolonged electioneering period, Kenya’s retail sector performance softened with average rental yields declining by 0.4% points y/y to 8.3% from 8.7% in 2016. In 2018, the sector recovered in key urban cities, recording average rental yields of 8.6%, 0.3% points higher than the 8.3% recorded in 2017. The improvement in performance is largely attributed to:
- Recovery of the market from the tough economic environment in 2017, characterized by prolonged electioneering and reduced private sector credit growth,
- Prudent methods employed by developers to attract clientele and enhance footfall such as targeting international anchor tenants to attract clientele and enhance footfall,
- Entry and expansion of international retailers, supported by a widening middle class and provision of high-quality spaces in line with international standards as well as infrastructure as shown below; and,
|
Select International Retailers in Kenya |
|||||
|
Outlet |
Parent Company |
Origin Country |
Year of Commencement |
No. of Local Outlets |
Number of Global outlets |
|
Food Chains |
|||||
|
Mugg & Beans |
Famous Brands |
South Africa |
2017 |
1 |
220 |
|
Burger King |
Restaurants Brand International |
United States |
2017 |
4 |
16,859 |
|
Pizza Hut |
Yum! Brands |
United States |
2016 |
2 |
16,796 |
|
Dominos |
Bain Capital, Inc. |
United States |
2014 |
3 |
15,000 |
|
Coldstone |
Kahala Brands |
United States |
2014 |
8 |
1,100 |
|
Chicken Inn/Pizza Inn/Bakers’ Inn/Creamy Inn |
Innscor Africa |
Zimbabwe |
2013 |
121 |
398 |
|
KFC |
Yum! Brands |
United States |
2012 |
19 |
20,404 |
|
Subway |
Doctor's Associates, Inc. |
United States |
2011 |
8 |
44,834 |
|
Hypermarkets |
|||||
|
Miniso |
Miniso |
Japan |
2017 |
6 |
>2,600 |
|
Choppies |
Choppies Enterprises Limited |
Botswana |
2017 |
12 |
212 |
|
Carrefour |
Majid Al Futtaim Holding |
France |
2016 |
6 |
12,300 |
|
Game |
Massmart |
South Africa |
2016 |
1 |
424 |
|
Other Stores |
|||||
|
LC Waikiki |
LC Waikiki Retailing Ltd |
Turkey |
2017 |
3 |
881 |
|
Swarovski |
Swarovski Group |
Austria |
2017 |
1 |
2,800 |
|
Bosch |
Robert Bosch Stiftung GmbH |
Germany |
2018 |
1 |
>440 |
|
Woolworths |
Woolworths Holdings Ltd |
South Africa |
2012 |
12 |
1,400 |
|
Incoming Retailers |
|||||
|
Shoprite |
Shoprite Holdings Ltd |
South Africa |
* |
|
>500 |
Source: Online, Wikipedia
* Shoprite is expected to enter the Kenyan market this year; taking up space in Garden City and Westgate malls
- Increasing purchasing power, with GDP per Capita growing at a rate of 7.9% p.a over the last 5-years, from Kshs 113,539 in 2013 to Kshs 166,314 in 2017, hence sustained demand for retail products.
The sector has however, been constrained by;
- Low private sector credit growth, which averaged at 4.3% as at June 2018, compared to a 5-year average of 14.0% (2013-2018), and,
- Oversupply in some nodes such as Nairobi, Eldoret, Kisumu and Nakuru, which have an oversupply of 2.0mn SQFT, 0.3mn SQFT, 0.2mn SQFT and 0.1mn SQFT, respectively, resulting in stiff competition between malls due to increased supply in the same. For instance, in Nairobi, the oversupply has resulted in an 0.6% decline in rental yields over the last two years from 10.0% in 2016 to 9.4% in 2018.
- Performance Summary in 2018
In our analysis of the retail market performance in 2018, we will cover the general market performance in key urban cities, performance in Nairobi, both by nodes and by class, and then conclude with the performance of key urban cities in the country.
- Retail Sector Performance in Kenya Over Time
In 2018, the retail sector’s performance improved with average rental yields increasing by 0.3% points y/y to 8.6% from an average of 8.3% in 2017, and occupancy rates increased by 5.8% points y/y to 85.7% from 80.2% in 2017. The improvement in performance is attributed to recovery of the market from the tough economic environment in 2017 characterized by prolonged electioneering and reduced private sector credit growth to 4.3% as at June 2018 from a five-year average of 14.0%.
The performance of the sector across the key cities is as summarized below:
(all values in Kshs unless stated otherwise)
|
(all values in Kshs unless stated otherwise) |
|||||
|
Kenya’s Retail Sector Performance Summary 2018 |
|||||
|
Item |
2016 |
2017 |
2018 |
∆ Y/Y 2016/2017 |
∆ Y/Y 2017/2018 |
|
Average Asking Rents (Kshs/SQFT) |
154.9 |
140.9 |
132.1 |
(9.0%) |
(6.2%) |
|
Average Occupancy (%) |
82.9% |
80.2% |
86.0% |
(2.7%) points |
5.6% points |
|
Average Rental Yields |
8.7% |
8.3% |
8.6% |
(0.4%) points |
0.3% points |
|
· The average rental yields increased by 0.3%-points y/y to 8.6% in 2018 from 8.3% in 2017, attributable to increase in occupancy rates |
|||||
|
· The 5.8% points y/y increase in occupancy rates is as a result, Prudent marketing methods employed by developers to attract clientele and enhance footfall such as themed marketing and celebrity Advertising to attract clientele and enhance footfall, and recovery of the market from the tough economic environment characterised by low credit supply and the prolonged 2017 electioneering period |
|||||
|
· Rental rates bucked the 2017 trend declining by 6.2% in 2018 from an average of Kshs 140.9 per SQFT in 2017 to an average of Kshs 132.1 in 2017, this is attributable to increased competition due to increased supply, that has led to developers decreasing rents to attract retailers |
|||||
Source: Cytonn Research
- Nairobi Retail Market Performance – Occupancy increases, while yield declines slightly
- Performance by Nodes- Westlands is the best-performing node
In 2018, the rental charges in Nairobi were Kshs 178.9 per SQFT, which was a 3.4% decline from Kshs 185.3 per SQFT in 2017, occupancy rates were 83.7%, a 3.4% points y/y increase from 80.3% and average rental yield was 9.4%, a 0.2% points y/y decline from 9.6% in 2017. The softening of the performance is as result of an oversupply of mall space, currently at 2.0mn SQFT, hence price wars by developers have erupted in a bid to attract retailers and increase occupancy rates. Westlands, Kilimani and Karen were the best performing retail suburbs in Nairobi with average rental yields of 12.4%, 11.8% and 10.8%, respectively, due to the fact that they are high end neighbourhoods hosting most of Nairobi’s middle-end and high-end populations. The worst performing nodes are the Eastlands and Satellite Towns recording average rental yields of 7.0% and 6.6%, respectively, attributable to low rental charges as a result of competition from informal retail space.
The performance of the key nodes in the Nairobi Metropolitan Area is as summarized below:
(all values in Kshs unless stated otherwise)
|
Summary of Nairobi’s Retail Market Performance by Nodes 2018 |
|||||||||
|
Node |
Average Rent 2018 per SQFT per Month |
Average Occupancy Rate 2018 |
Rental Yield 2018 |
Average Rent 2017 per SQFT per Month |
Average Occupancy Rate 2017 |
Rental Yield 2017 |
Change in Occupancy Y/Y |
Change in Yield Y/Y |
Reason for Change in Yield |
|
Westlands |
218.8 |
90.2% |
12.4% |
234.7 |
91.0% |
13.5% |
(0.8%) |
(1.1%) |
6.8% decline in monthly rental charges y/y, |
|
Kilimani |
184.1 |
97.5% |
11.8% |
181.0 |
87.0% |
10.3% |
10.5% |
1.5% |
10.5% y/y increase in occupancy rates, |
|
Karen |
212.8 |
96.0% |
10.8% |
206.2 |
96.3% |
11.2% |
(0.3%) |
(0.4%) |
3.2% y/y increase in monthly rental charges and 0.3% decline in occupancy rates |
|
Ngong Road |
170.5 |
94.4% |
10.1% |
170.7 |
81.8% |
8.7% |
12.6% |
1.4% |
12.6% y/y increase in occupancy rates |
|
Thika road |
194.3 |
76.5% |
8.8% |
199.2 |
75.3% |
8.7% |
1.3% |
0.1% |
1.3% y/y increase in occupancy rates |
|
Kiambu Road |
199.9 |
67.0% |
8.7% |
216.1 |
78.2% |
10.6% |
(11.2%) |
(1.9%) |
11.2% decline in occupancy rates |
|
Mombasa Road |
156.2 |
74.4% |
7.8% |
180.4 |
68.8% |
8.3% |
5.7% |
(0.5%) |
13.4% decline in monthly rental charges |
|
Eastlands |
149.1 |
68.2% |
7.0% |
148.9 |
61.8% |
6.1% |
6.5% |
1.0% |
6.5% increase in occupancy rates |
|
Satellite Towns |
124.5 |
89.3% |
6.6% |
130.1 |
82.5% |
7.7% |
6.8% |
(1.0%) |
4.4% decline in monthly rental charges |
|
Grand Total |
178.9 |
83.7% |
9.4% |
185.3 |
80.3% |
9.6% |
3.4% |
(0.2%) |
|
|
· The performance softened, recording on average 0.2% points y/y decline in rental yields to 9.4% from 9.6% in 2017 as a result of 3.4% y/y decrease in rental charges, due to an oversupply of mall space, currently at 2.0mn SQFT, hence price wars by developers in a bid to attract retailers and increase occupancy rates · Kilimani, Ngong Road and Nairobi Eastlands, recorded the largest increase in rental yields y/y of 1.5%, 1.4% and 1.0% points, respectively, attributable to increase in occupancy levels of 10.1%, 12.6% and 6.5% points, for Kilimani, Ngong Road and Nairobi Eastlands, respectively · The increase in occupancy rates is attributable to prudent methods employed by developers, such as targeting international retailers as anchor tenants, these include; Carrefour and Shoprite to fill vacancies left by struggling retailers such as Nakumatt and Uchumi · Kiambu road, Westlands and Nairobi Satellite Towns, recorded the largest y/y decline in rental yields of 1.4%, 1.0% and 1.0% points, respectively, attributable to 40, 000 SQFT, 232,340 SQFT and 134,760 SQFT increase in retail space supply. |
|||||||||
Source: Cytonn Research
- Performance by Class - Destination and Community malls are the best performing malls
To analyze the performance of malls by class we classified malls into three bands as below:
- Regional Centers/Destination Malls: They are largest malls, with a Gross Lettable Area (GLA) of 400,000 - 800,000 SQFT and characteristically have two or more anchor tenants, in Nairobi these include; Two Rivers Mall, Next Gen Mall and Garden City,
- Community Centers: These are the second largest mall types, occupying spaces of between 125,001 - 400,000 SQFT and characteristically have zero to two anchor tenants, in Nairobi these include; Galleria, Village Market and Westgate, and,
- Neighborhood Centers: They have the minimum mall space, with a Gross Lettable Area (GLA) of 20,000 SQFT and characteristically having a maximum of one or even no anchor tenant, in Nairobi these include; Cross Roads Mall, Lavington Mall and K-Mall
On performance by class, destination and community malls are the best performing mall typologies with both typologies recording average rental yields of 9.6% attributable to:
- For destination malls, the high rental charges on average Kshs 217.9 per SQFT, 22.2% higher than the market average of Kshs 178.3 per SQFT due to a premium for class, amenities provided and higher footfall in the malls as a result of presence of international retailers mainly as the anchor tenants,
- For community malls high occupancy rates on average 84.5%, 1.1% points higher than the market average of 83.4%, due to community malls competing with destination malls by providing quality amenities and attracting international anchor tenants to boost footfall. Despite the attractive yields, destination malls recorded a 0.7% points decline in rental yields from 10.3% in 2017 to 9.6% in 2018 as a result of a 7.0% decline in monthly rental charges, due to increased competition from community malls that are providing quality amenities and attracting international retailers as well.
Retail market performance in Nairobi by class is as shown below:
(all values in Kshs unless stated otherwise)
|
Retail Market Performance in Nairobi by Class 2018 |
||||||||
|
Class |
Average Rent 2018 per SQFT per Month |
Average Occupancy Rate 2018 |
Rental Yield 2018 |
Average Rent 2017 per SQFT per Month |
Average Occupancy Rate 2017 |
Rental Yield 2017 |
Change in Occupancy Y/Y |
Change in Yield Y/Y |
|
Destination |
217.9 |
81.0% |
9.6% |
234.4 |
77.3% |
10.3% |
3.7% |
(0.7%) |
|
Community |
176.9 |
84.5% |
9.6% |
159.5 |
82.9% |
9.0% |
1.6% |
0.6% |
|
Neighbourhood |
170.0 |
80.2% |
9.0% |
170.8 |
76.9% |
7.5% |
3.3% |
1.5% |
|
Average |
178.3 |
83.4% |
9.4% |
171.2 |
79.8% |
8.9% |
2.9% |
0.5% |
|
· Destination and Community malls are the best performing malls with an average rental yield of 9.6% attributable to the high rental charges on average Kshs 217.9 per SQFT above the market average of Kshs 178.3 per SQFT for destination malls and high occupancy rates on average 84.5% for community malls |
||||||||
|
· Neighborhood malls register a lower rental yield of 9.0% mainly because of competition from retailers such as supermarkets and other small-scale retailers. They also have fewer amenities as compared to destination malls |
||||||||
Source: Cytonn Research
- Retail Market Performance in Key Urban Cities in Kenya
Unlike in Nairobi, where the performance softened as a result of an oversupply, in key urban cities in Kenya, the retail sector performance improved, recording a 0.3% points y/y increase in average yields to 8.6% in 2018, from 8.3% in 2017, while occupancy rates increased by 5.8% points y/y to 86.0% in 2018 from 80.2% in 2017. The better performance is attributable to the recovery of the market from the tough economic environment in 2017 characterized by prolonged electioneering and reduced credit to the private sector, with private credit growth reducing from a five-year average of 14.0 to 4.3% as at June 2018. Mt. Kenya and Kisumu were the best performing regions, with average yields of 9.9% and 9.7%, respectively. Mt. Kenya performance is attributable to a 4.5% points y/y increase in occupancy rates due to low supply of retail space, accounting for 9.6% of market share, while Kisumu performance is driven by high occupancy rates of 88.0%, 2.0% points above market average at 86.0% driven by increased retail business to serve the increasing urban population at 52.0% of the population compared to country average at 26.5%. Nakuru was the worst performing region with a rental yield of 6.9%, which is due to low rental rates charged within that market of an average Kshs 83.3 per SQFT, 38.0% lower than the market average of Kshs 134.3 per SQFT, as a result of competition from mixed use developments (MUDs) that are older in the market.
The performance of the key urban centres in Kenya is as summarized below:
(all values in Kshs unless stated otherwise)
|
Summary of Retail Market Performance in Key Urban Cities in Kenya 2018 |
|||||||||
|
Region |
Average Rent 2018 per SQFT per Month |
Average Occupancy Rate 2018 |
Rental yield 2018 |
Average Rent 2017 per SQFT per Month |
Average Occupancy Rate 2017 |
Rental yield 2017 |
Change in Occupancy Y/Y |
Change in Yield Y/Y |
Reason for Change in yield |
|
Mt Kenya |
141.3 |
84.5% |
9.9% |
136.0 |
80.0% |
9.1% |
4.5% |
0.8% |
4.5% points y/y increase in occupancy rates |
|
Kisumu |
148.2 |
88.0% |
9.7% |
157.2 |
76.4% |
9.1% |
11.6% |
0.6% |
11.6% points y/y increase in occupancy rates |
|
Nairobi |
178.9 |
83.7% |
9.4% |
185.0 |
80.3% |
9.6% |
3.4% |
(0.2%) |
3.4% y/y decline in monthly rental charges |
|
Mombasa |
103.7 |
96.3% |
8.3% |
130.3 |
82.8% |
7.3% |
13.5% |
1.0% |
13.5% points y/y increase in occupancy rates |
|
Eldoret |
137.5 |
78.5% |
7.6% |
96.0 |
83.3% |
6.6% |
(4.8%) |
1.0% |
43.2% y/y increase in rental charges due to entry of new community malls charging 56.4% above market average |
|
Nakuru |
83.3 |
85.0% |
6.9% |
||||||
|
Average |
132.1 |
86.0% |
8.6% |
140.9 |
80.2% |
8.3% |
5.6% |
0.6% |
|
|
· Mt. Kenya and Kisumu were the best performing regions, with average rental yields of 9.9% and 9.7%, respectively. This is attributable to an increase in occupancy rates of on average 4.5% and 11.6% points y/y for Mt. Kenya and Kisumu regions, respectively |
|||||||||
|
· Nakuru had the lowest rental yield of on average 6.9%, which is due to the low rental rates charged within that market of on average Kshs 83.3 per SQFT, 38.0% lower than the market average of Kshs 134.3 per SQFT as a result of competition from MUDs that are older in the market. · Nairobi is the only market that registered a decline in rental yields of 0.2%, to 9.4% from 9.6% due to an oversupply of mall space, currently at 2.0mn SQFT, hence price wars by developers in a bid to attract retailers and increase occupancy rates |
|||||||||
Source: Cytonn Research
- Retail Space Demand Analysis
With an aim to determine the current retail space gap in the market we worked out a demand analysis based on the current and incoming retail space supply, and the required retail space demand per region dependent on the population. Therefore, to determine the retail space demand per region we looked at Net Space Uptake (the total retail space adequate to serve a region dependent on the population less the vacancy rates in malls) per person in SQM, shopping population, and current retail market occupancy rates. In this analysis:
- Total Demand/Gross Uptake is the total retail space adequate to serve a region dependent on the population. This is calculated by multiplying the Net Space Uptake per person by the total shopping population,
- Net Demand/Uptake is the gross uptake less the vacancy rates in malls in a specific region. This is calculated by multiplying the Gross uptake by respective market occupancy rates,
- Supply is calculated by summing up the completed retail stock and the incoming retail space,
- To get the over/undersupply (Gap) in the market, the supply is subtracted from the demand/net uptake, and
- Key assumptions are, (i) number of persons per household at 3.6 based on the average household size in urban areas as per Kenya Population and Housing Census 2009, and (ii) percentage of Shopping Population (14 years and above) at 58.0% according to KNBS (2009 Census).
If it is a positive figure, then the market has an under supply i.e, demand is more than supply and if it is a negative figure then the market has an oversupply, i.e. supply is more than demand.
The retail space demand across key regions in Kenya is as shown below;
|
Required Analysis Summary 2018 |
||||||||||
|
Region |
Population 2018 (F) (Mn) |
Urban Population |
Urban Population 2018 (Mn) |
Shopping Population (Mn) |
Net Space Uptake per Pax in SQFT (Mn) |
Occupancy (2-year Average) |
Gross Space Uptake per Pax (Required Space Kilimani) SQFT (Mn) |
Net Uptake (Space Required) for Each Market SQFT (Mn) |
Total Supply |
GAP at Current Market Performance |
|
Kiambu |
2.1 |
62% |
1.3 |
0.8 |
1.9 |
71% |
2.1 |
1.5 |
0.9 |
0.6 |
|
Mombasa |
1.3 |
100% |
1.3 |
0.7 |
1.9 |
88% |
2.1 |
1.8 |
1.6 |
0.3 |
|
Kajiado |
1 |
41% |
0.4 |
0.2 |
0.6 |
91% |
0.7 |
0.6 |
0.4 |
0.2 |
|
Mt Kenya |
2.7 |
22% |
0.6 |
0.4 |
0.9 |
81% |
1 |
0.8 |
0.6 |
0.2 |
|
Machakos |
1.3 |
52% |
0.7 |
0.4 |
1 |
79% |
1.1 |
0.9 |
0.7 |
0.1 |
|
Nakuru |
2.1 |
45% |
0.9 |
0.6 |
1.4 |
85% |
1.5 |
1.3 |
1.4 |
(0.1) |
|
Kisumu |
1.2 |
52% |
0.6 |
0.4 |
0.9 |
82% |
1 |
0.8 |
1 |
(0.2) |
|
Uasin Gishu |
1.3 |
39% |
0.5 |
0.3 |
0.7 |
80% |
0.8 |
0.6 |
0.9 |
(0.3) |
|
Nairobi |
4.4 |
100% |
4.4 |
2.6 |
6.4 |
81% |
7.1 |
5.7 |
7.8 |
(2.0) |
|
Total |
17.4 |
10.8 |
6.2 |
15.6 |
17.3 |
14.1 |
15.3 |
(1.2) |
||
|
· The market is oversupplied by 1.2mn SQFT following the aggressive retail space supply by developers over the last 5 years, with Nairobi recording an 8-year CAGR of 15.9% |
||||||||||
|
· Kiambu, Mombasa, Kajiado, Mt. Kenya and Machakos are undersupplied by 0.6 mn, 0.3 mn, 0.2 mn, 0.2 mn and 0.1 mn SQFT, respectively |
||||||||||
|
· Nairobi, Eldoret, Kisumu and Nakuru regions are oversupplied by 2.0 mn, 0.3 mn, 0.2 mn and 0.1 mn SQFT, respectively |
||||||||||
Source: KNBS, Cytonn Research
- Retail Space Investment Opportunity – Best opportunity is in Mombasa, Mt. Kenya and Kiambu
To determine the investment opportunity for development of malls in Nairobi and the other key cities, we analyzed the regions based on three metrics, that is performance (rental yield), required retail space and household expenditure as a proxy for purchasing power, which have been allocated 30%, 30% and 40% weights, respectively.
Methodology Used:
- Rental Yield – Measures the expected return from development hence the higher the better. This carried 30% of the weight. The area with highest yield was given the highest score of 9, while the area with least yield was given the least score of 1,
- Household Expenditure - It shows the ability of the population to spend and thus the higher the better. This carried a 40% weight, hence, the area with a high household expenditure was given the highest score of 9, while the area with least household expenditure was given the least score of 1, and
- Retail Space Demand – measures the amount of space a region can take up at the current market occupancy rates. The higher the better. This carried a 30% weight, hence, an area with a high retail space was given the highest score of 9, while the area with least retail space was given the least score of 1.
Based on these metrics, Mombasa, Mt. Kenya and Kiambu offer the best investment opportunities to mall developers. This is mainly due to low retail space supply, with a retail space gap of 0.3mn, 0.2mn and 0.6mn, high household expenditure at Kshs 5,800, Kshs 5,211 and Kshs per adult for Mombasa, Mt. Kenya and Kiambu, respectively. The ranking is as shown below:
|
Retail Space Opportunity |
|||||
|
Region/ |
Rental Yield Score |
Retail Space Demand Score |
Household expenditure (per adult) Score |
||
|
Weight |
30% |
30% |
40% |
Weighted Score |
Rank |
|
Mombasa |
5 |
8 |
7 |
6.7 |
1 |
|
Mt Kenya |
8 |
6 |
5 |
6.2 |
2 |
|
Kiambu |
1 |
9 |
8 |
6.2 |
3 |
|
Machakos |
9 |
5 |
4 |
5.8 |
4 |
|
Nairobi |
6 |
0 |
9 |
5.4 |
5 |
|
Kajiado |
4 |
7 |
3 |
4.5 |
6 |
|
Kisumu |
7 |
0 |
6 |
4.5 |
7 |
|
Nakuru |
2 |
0 |
2 |
1.4 |
8 |
|
Uasin Gishu |
3 |
0 |
1 |
1.3 |
9 |
|
· Mombasa, Mt. Kenya and Kiambu offer the best investment opportunities to mall developers. This is mainly due to low retail space supply, high household expenditure and high yields |
|||||
|
· The lowest ranking regions are Uasin Gishu, Nakuru and Kisumu due to high retail space supply, low rental yields and low household expenditure |
|||||
Source: Cytonn Research
- Retail Sector Outlook
The table below summarizes metrics that have possible impact on retail sector, that is the retail space supply, performance, retail space demand, consumer shopping habits and concluding with the market opportunity/outlook in the sector.
|
Kenya Retail Sector Outlook |
||||
|
Measure |
Sentiment 2017 |
Sentiment 2018 |
2017 Outlook |
2018 Outlook |
|
Retail Space Supply |
•Increasing supply with Nairobi currently having a mall space supply of approximately 5.6 mn SQFT, a having grown from 2.0mn SQFT in 2010 at 7-yr CAGR of 16.9%. Expected to grow with a 3-year CAGR of 7.3% to 6.9mn square feet of retail space by 2020 |
•Increasing supply with Nairobi currently having a mall space supply of approximately 6.5 mn SQFT, a having grown from 2.0mn SQFT in 2010 at 8-yr CAGR of 15.9%. Expected to grow with a 2-year CAGR of 9.5% to 7.8mn square feet of retail space by 2020 |
Neutral |
Neutral |
|
Retail Market Performance |
•The retail sector recorded an average rental yield of 8.3% and occupancy of 80.2% in 2017. Nairobi recorded an average rental yield of 9.6% and occupancy of 80.3% higher than the commercial office yield of 9.2% and residential market yield of 5.6% |
•Kenya retail sector recorded an average rental yields of 8.6%, and occupancy rates of 86.0%, which are 0.3% and 5.8% points y/y increase 2017 •Mt. Kenya and Kisumu were the best performing regions, with average yields of 9.9% and 9.7%, respectively indicating that the investment opportunity is tilted to the counties outside Nairobi Metropolitan Area |
Positive |
Positive |
|
Retail Space Demand |
•Nairobi has sufficient retail space supply factoring in incoming supply of 1.3mn in the next 2-3 years and thus investment opportunity is in other regions such as Mombasa which has relatively low supply |
•Kiambu, Mombasa, Kajiado, Mt. Kenya and Machakos are undersupplied by 0.6mn, 0.3mn, 0.2mn,0.2mn and 0.1mn SQFT, respectively, presenting an investment opportunity in these areas |
Positive |
Positive |
|
Market Sentiments |
•Positive expectations about the retail sector growth due to a widening middle class and a growing economy |
•The market is adopting to formal retail, as consumers are increasingly preferring to shop in formal retail space as opposed to informal channels as a result of product availability |
Positive |
Positive |
|
Market Outlook |
The outlook for the sector is positive and we expect to witness reduced development activity in Nairobi, with developers shifting to county headquarters in some markets such as Mombasa and Mt. Kenya regions that have retail space demand of 0.3mn and 0.2mn SQFT, attractive yields at 8.3% and 9.9% and occupancy rates at 96.3% and 84.5%, respectively |
|||
Source: Cytonn Research
For the 2017 retail sector outlook, we had three out of the four metrics considered as positive and one neutral and thus a positive outlook for the retail sector. For 2018, three of the metrics under consideration are positive and one neutral and thus we retain our positive outlook for the retail sector, given the higher yields at 8.6% from 8.3% in 2017, supported by the improved macro-economic environment. The opportunity is in county headquarters in some markets such as Mombasa and Mt. Kenya regions that have retail space demand of 0.3mn and 0.2mn SQFT, attractive yields at 8.3% and 9.9% and occupancy rates at 96.3% and 84.5%, respectively. For more details on the report see the link Cytonn Retail Sector Report - 2018
Disclaimer: The views expressed in this publication are those of the writers where particulars are not warranted. This publication, which is in compliance with Section 2 of the Capital Markets Authority Act Cap 485A, is meant for general information only and is not a warranty, representation, advice or solicitation of any nature. Readers are advised in all circumstances to seek the advice of a registered investment advisor.

- Talk to us
- Kenya
- P.O Box 20695 - 00200, Nairobi, Kenya
- Cell +254709101200
- Tel +254709101200
- WhatsApp +254741676635
- United States
- +254709101200
- DOWNLOAD OUR APP
-


- Kenya
- 8th Floor, Pinetree Plaza, Kaburu Drive, Ngong Road, Nairobi, Kenya
- USA
- Suite 1150, 1775 Eye Street NW, USA, Washington DC 20006, USA
- Investments
- High Yield
- Private Equity
- Real Estate
- Real Estate
- RiverRun Estates
- Cytonn Towers
- The Ridge
- Taraji Heights
- The Alma