Progress Review of the Affordable Housing Program & Cytonn Weekly #07/2026
By research team, Feb 22, 2026
Executive Summary
Fixed Income
This week, T-bills were oversubscribed for the fourth consecutive week, with the overall subscription rate coming in at 295.6%, lower than the subscription rate of 308.8% recorded the previous week. Investors’ preference for the shorter 91-day paper persisted, with the paper receiving bids worth Kshs 13.0 bn against the offered Kshs 4.0 bn, translating to a subscription rate of 326.2%, higher than the subscription rate of 179.5%, recorded the previous week. The subscription rate for the 182-day paper increased significantly to 113.6% from the 68.8% recorded the previous week, while that of the 364-day paper decreased significantly to 465.4% from 600.5% recorded the previous week. The government accepted a total of Kshs 49.1 bn worth of bids out of Kshs 70.9 bn bids received, translating to an acceptance rate of 69.2%.The yields on the government papers were on a downward trajectory with the yield on the 364-day paper decreasing the most by 7.5 bps to 8.9% from 9.0% recorded the previous week, while the yields on the 91-day and 182-day papers decreased by 2.0 bps each to remain relatively unchanged from the 7.6% and 7.8% respectively recorded the previous week;
During the week, the Kenyan government announced its plan to invite eligible holders of its outstanding USD 1.2 bn 2032 notes and USD 0.4 bn 2028 notes to tender their securities for repurchase under a liability management (buyback) offer, at a purchase price of USD 1,055.0 and 1035.0 per USD 1,000.0 in principal amount of notes accepted for purchase respectively. The purchase is capped at USD 500.0 mn up to USD 350.0 bn for 2032 notes and USD 150.0 mn for the 2028 notes;
During the week, the National Treasury released the 2026 Budget Policy Statement (BPS) in line with Section 25 of the Public Finance Management (PFM) Act, CAP 412A, highlighting that total revenue is projected to increase by 5.4% to Kshs 3,533.7 bn in FY’2026/27 from Kshs 3,352.1 bn in FY’2025/26. External grants are expected to rise by 36.3% to Kshs 54.4 bn, bringing total revenue and grants to Kshs 3,588.1 bn, a 5.8% increase. Total expenditure is projected to increase by 3.8% to Kshs 4,703.9 bn in FY’2026/27 from Kshs 4,532.8 bn in FY’2025/26;
We are projecting the y/y inflation rate for February 2026 to decrease marginally to within the range of 4.2%- 4.3%;
Equities
During the week, the equities market was on a downward trajectory, with NSE 10, NASI, NSE 25, and NSE 20 declining by 3.5%, 3.1%, 2.6% and 0.3% respectively, taking the YTD performance to gains of 15.3%, 12.0%, 11.4% and 10.0% for NSE 20, NASI, NSE 25 and NSE 10 respectively. The equities market performance was mainly driven by loses recorded by large cap stocks such as Safaricom, DTB-K and Equity of 5.7%, 5.3% and 4.6% respectively. However, the performance was supported by gains recorded by large cap stocks such as Stanbic and BAT of 5.6% and 3.5% respectively;
Additionally, during the week, the banking sector index declined by 1.9% to 232.5 from 237.1 recorded the previous week. This is attributable to losses recorded by stocks such as DTB-K, Equity and Absa of 5.3%, 4.6% and 3.7% respectively. However, the performance was supported by gains recorded by stocks such as Stanbic of 5.6%;
During the week, Leapfrog Investments revealed plans to acquire 24.1% minority stake of ICEA Lion Insurance Holdings valued at Kshs 2.4 bn. This comes after the Competition Authority of Kenya approved a 24.1% acquisition of ICEA Lion by Eastern Africa Holdings Limited in October 2025;
Real Estate
During the week, we reviewed the National Infrastructure Fund Bill, 2025 that seeks to establish a statutory framework for the creation and operation of a National Infrastructure Fund (NIF). Its primary objective is to mobilize, manage and deploy long-term capital for infrastructure development;
During the week, the Kenya National Bureau of Statistics (KNBS) released the Leading Economic Indicators (LEI) December 2025 Report, which highlighted the performance of major economic indicators;
During the week, it was reported that Kenya is planning to use up to 90.0% of Railway Development Levy (RDL) collections to secure additional financing for railway projects, subject to approval by Parliament of Kenya under the Miscellaneous Fees and Levies (Amendment) Bill, 2025. The proposed amendments would enable the government to leverage revenues collected under the levy to mobilize fresh capital for railway infrastructure projects;
During the week, airlines began auditing the financial impacts of the strike by Kenya Aviation Workers Union (KAWU) which disrupted operations at Jomo Kenyatta International Airport. The strike began on Monday, 16th February 2026 and affected seven carriers, leading to aircraft groundings, flight cancellations, and passenger refunds. Approximately 5,000 passengers were affected over the two days and departures were delayed by several hours. Airlines reported financial losses linked to fuel burn, processing refunds, compensation claims, cancellations, and lost flying hours. Kenya Airways (KQ) confirmed operational disruptions but indicated no impact on fleet utilization, international airport access, or slot allocations;
On the Unquoted Securities Platform, Acorn D-REIT and I-REIT traded at Kshs 27.4 and Kshs 23.2 per unit, respectively, as per the last updated data on 20th February 2026. Additionally, ILAM Fahari I-REIT traded at Kshs 11.0 per share as of 20th February 2026 representing a 45.0% loss from the Kshs 20.0 inception price;
Focus of the Week
It has been four years since the Kenya Kwanza government assumed office, and one of its key pillars under the Bottom-Up Economic Transformation Agenda (BETA) is providing affordable housing to Kenyans. This housing program builds on initiatives from the previous administration under the Jubilee government's Big Four Agenda, launched in 2017 with the ambitious goal of delivering 1,000,000 housing units by 2022. The Affordable Housing Program (AHP), a flagship pillar of the Bottom-Up Economic Transformation Agenda under President William Ruto, represents one of the most ambitious state-led real estate interventions in Kenya’s post-independence history. Conceived as both a social welfare and economic stimulus mechanism, the program aims to deliver 250,000 housing units annually, with an aggregate target of one million units by 2027. Beyond shelter provision, the initiative is designed to stimulate construction-sector growth, formalize urban housing supply, deepen mortgage penetration, and expand employment across the built environment value chain.
Investment Updates:
-
Weekly Rates: Cytonn Money Market Fund closed the week at a yield of 11.7 % p.a. To invest, dial *809# or download the Cytonn App from Google Play store here or from the Appstore here;
-
We continue to offer Wealth Management Training every Tuesday, from 7:00 pm to 8:00 pm. The training aims to grow financial literacy among the general public. To register for any of our Wealth Management Trainings, click here;
-
If interested in our Private Wealth Management Training for your employees or investment group, please get in touch with us through wmt@cytonn.com;
-
Cytonn Insurance Agency acts as an intermediary for those looking to secure their assets and loved ones’ future through insurance namely; Motor, Medical, Life, Property, WIBA, Credit and Fire and Burglary insurance covers. For assistance, get in touch with us through insuranceagency@cytonn.com;
-
Cytonn Asset Managers Limited (CAML) continues to offer pension products to meet the needs of both individual clients who want to save for their retirement during their working years and Institutional clients that want to contribute on behalf of their employees to help them build their retirement pot. To more about our pension schemes, kindly get in touch with us through pensions@cytonn.com;
Hospitality Updates:
-
We currently have promotions for Staycations. Visit cysuites.com/offers for details or email us at sales@cysuites.com;
Money Markets, T-Bills Primary Auction:
This week, T-bills were oversubscribed for the fourth consecutive week, with the overall subscription rate coming in at 295.6%, lower than the subscription rate of 308.8% recorded the previous week. Investors’ preference for the shorter 91-day paper persisted, with the paper receiving bids worth Kshs 13.0 bn against the offered Kshs 4.0 bn, translating to a subscription rate of 326.2%, higher than the subscription rate of 179.5%, recorded the previous week. The subscription rate for the 182-day paper increased significantly to 113.6% from the 68.8% recorded the previous week, while that of the 364-day paper decreased significantly to 465.4% from 600.5% recorded the previous week. The government accepted a total of Kshs 49.1 bn worth of bids out of Kshs 70.9 bn bids received, translating to an acceptance rate of 69.2%.The yields on the government papers were on a downward trajectory with the yield on the 364-day paper decreasing the most by 7.5 bps to 8.9% from 9.0% recorded the previous week, while the yields on the 91-day and 182-day papers decreased by 2.0 bps each to remain relatively unchanged from the 7.6% and 7.8% respectively recorded the previous week.
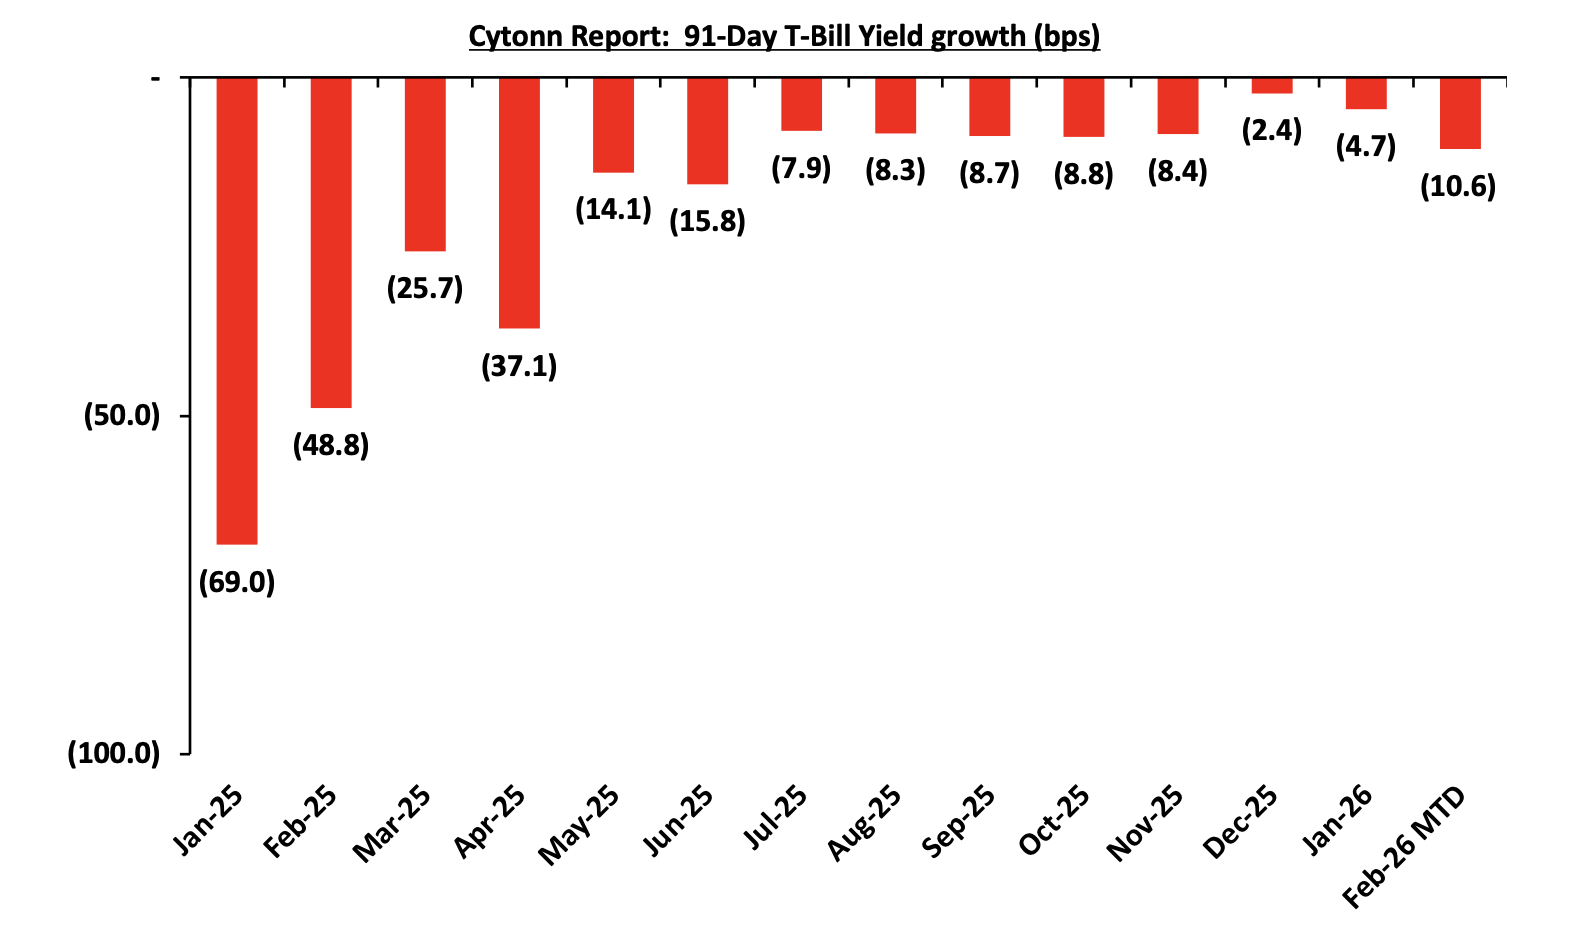
The chart below shows the yield growth rate for the 91-day paper from January 2024 to date:
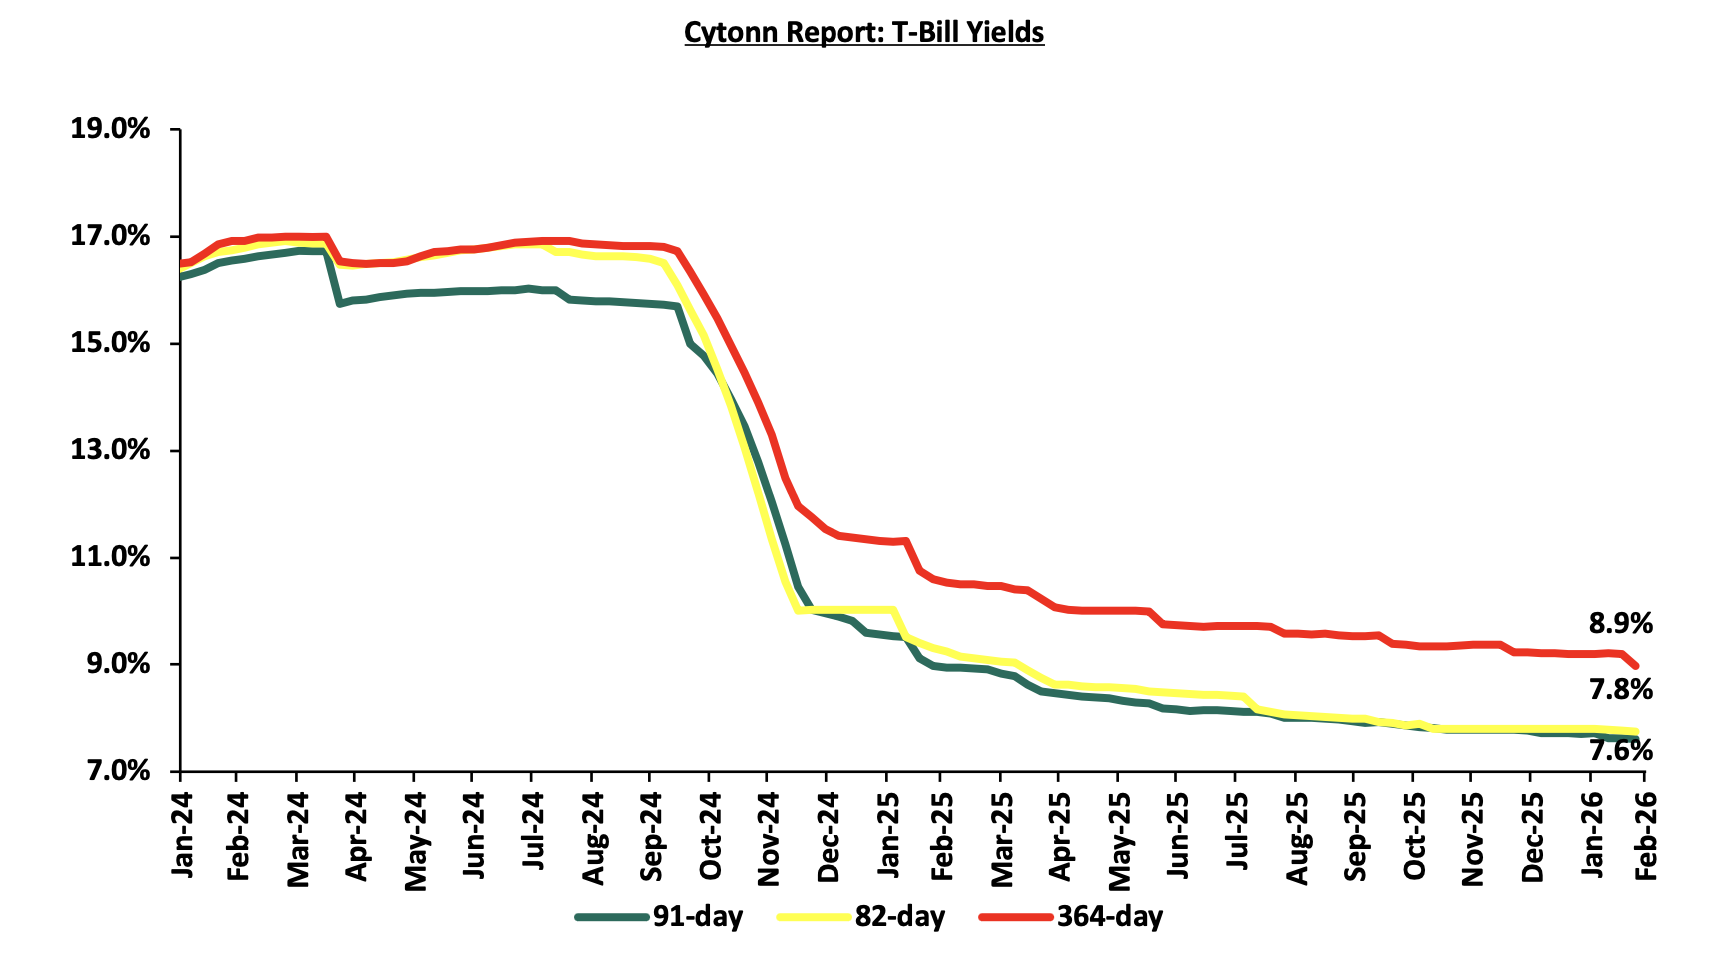
The charts below show the performance of the 91-day, 182-day and 364-day papers from January 2025 to February2026
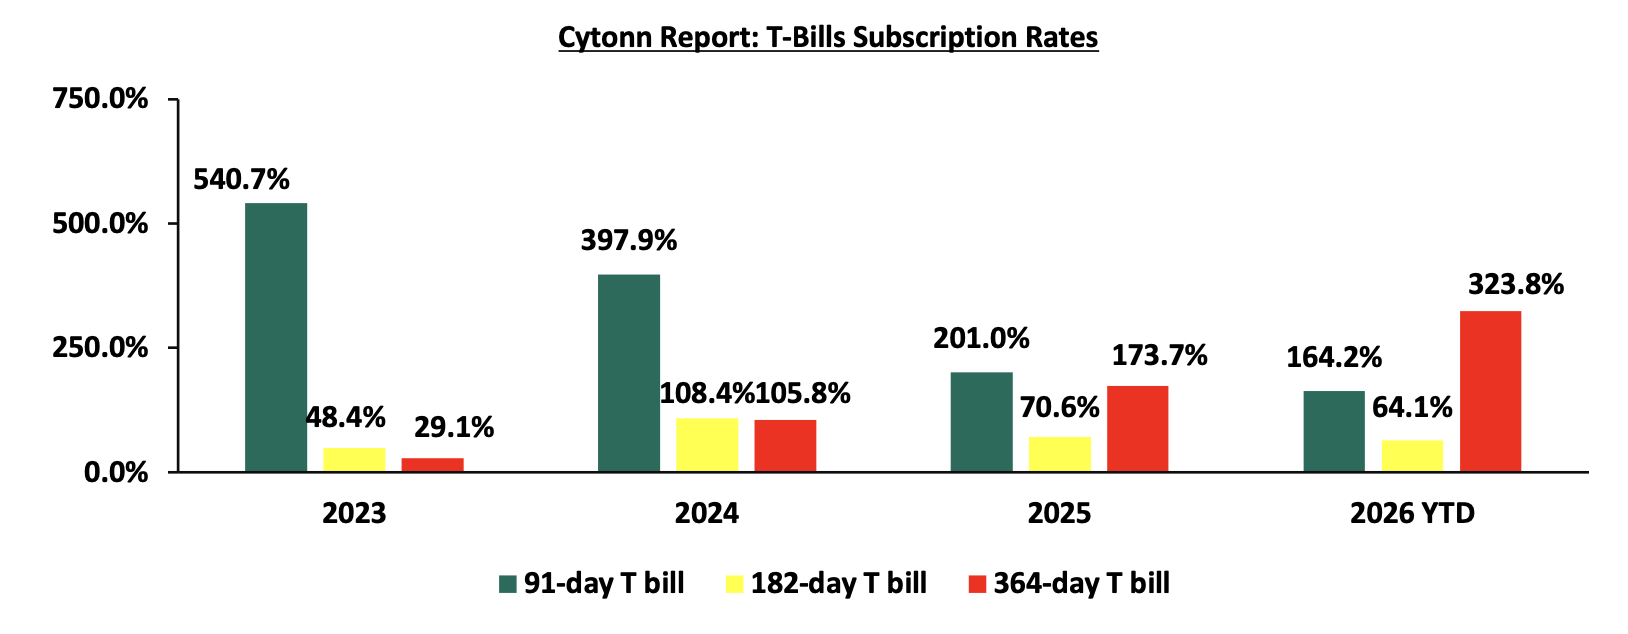
The chart below compares the overall average T-bill subscription rates obtained in 2023, 2024, 2025 and 2026 Year-to-date (YTD):
Money Market Performance:
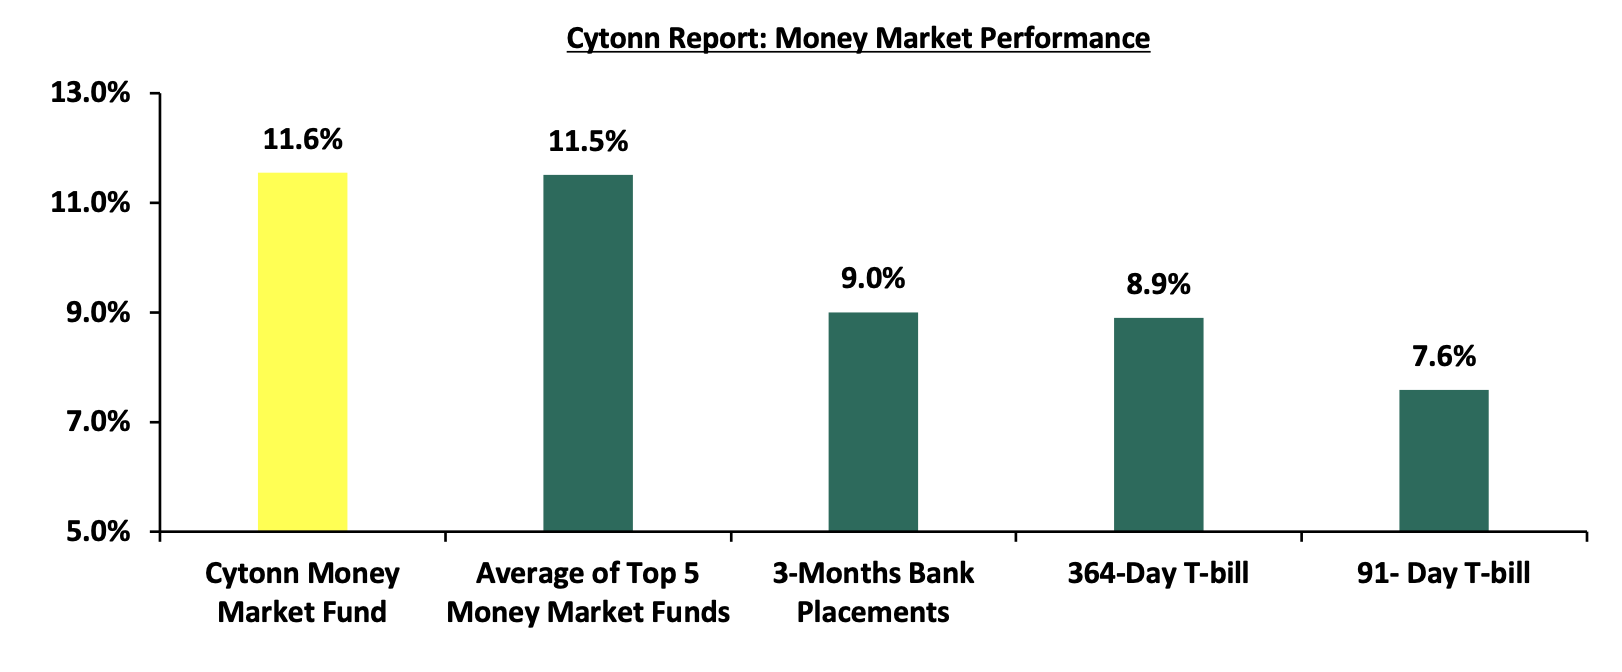
In the money markets, 3-month bank placements ended the week at 9.0% (based on rates offered by various banks), while yields on government papers recorded a downward performance, with the 364-day paper declining by 7.5 bps to 8.9% from 9.0% the previous week, and the 91-day paper decreasing marginally by 2.0 bps to remain relatively unchanged at 7.6% recorded last week. The yield on the Cytonn Money Market Fund decreased by 19.0 bps to 11.6% from 11.7% the previous week, while the average yields on the Top 5 Money Market Funds increased by 31.8 bps to 11.5% from 11.2% recorded the previous week.
The table below shows the Money Market Fund Yields for Kenyan Fund Managers as published on 20th February 2026:
|
Money Market Fund Yield for Fund Managers as published on 20th February 2026 |
||
|
Rank |
Fund Manager |
Effective Annual Rate |
|
1 |
Gulfcap Money Market Fund |
12.5% |
|
2 |
Cytonn Money Market Fund (Dial *809# or download Cytonn App) |
11.6% |
|
3 |
Nabo Africa Money Market Fund |
11.5% |
|
4 |
Arvocap Money Market Fund |
11.2% |
|
5 |
Enwealth Money Market Fund |
10.8% |
|
6 |
Lofty-Corban Money Market Fund |
10.8% |
|
7 |
Ndovu Money Market Fund |
10.5% |
|
8 |
Kuza Money Market fund |
10.5% |
|
9 |
Jubilee Money Market Fund |
10.2% |
|
10 |
Old Mutual Money Market Fund |
10.1% |
|
11 |
Etica Money Market Fund |
10.0% |
|
12 |
Madison Money Market Fund |
10.0% |
|
13 |
Orient Kasha Money Market Fund |
9.9% |
|
14 |
British-American Money Market Fund |
9.9% |
|
15 |
Dry Associates Money Market Fund |
9.5% |
|
16 |
GenAfrica Money Market Fund |
9.5% |
|
17 |
SanlamAllianz Money Market Fund |
9.3% |
|
18 |
Faulu Money Market Fund |
9.3% |
|
19 |
KCB Money Market Fund |
9.2% |
|
20 |
Genghis Money Market Fund |
9.1% |
|
21 |
Apollo Money Market Fund |
8.6% |
|
22 |
CIC Money Market Fund |
8.5% |
|
23 |
Co-op Money Market Fund |
8.3% |
|
24 |
CPF Money Market Fund |
8.2% |
|
25 |
Mali Money Market Fund |
8.2% |
|
26 |
ICEA Lion Money Market Fund |
8.0% |
|
27 |
Absa Shilling Money Market Fund |
7.5% |
|
28 |
Mayfair Money Market Fund |
7.0% |
|
29 |
Ziidi Money Market Fund |
6.3% |
|
30 |
AA Kenya Shillings Fund |
5.9% |
|
31 |
Stanbic Money Market Fund |
5.4% |
|
32 |
Equity Money Market Fund |
4.9% |
Source: Business Daily
Liquidity:
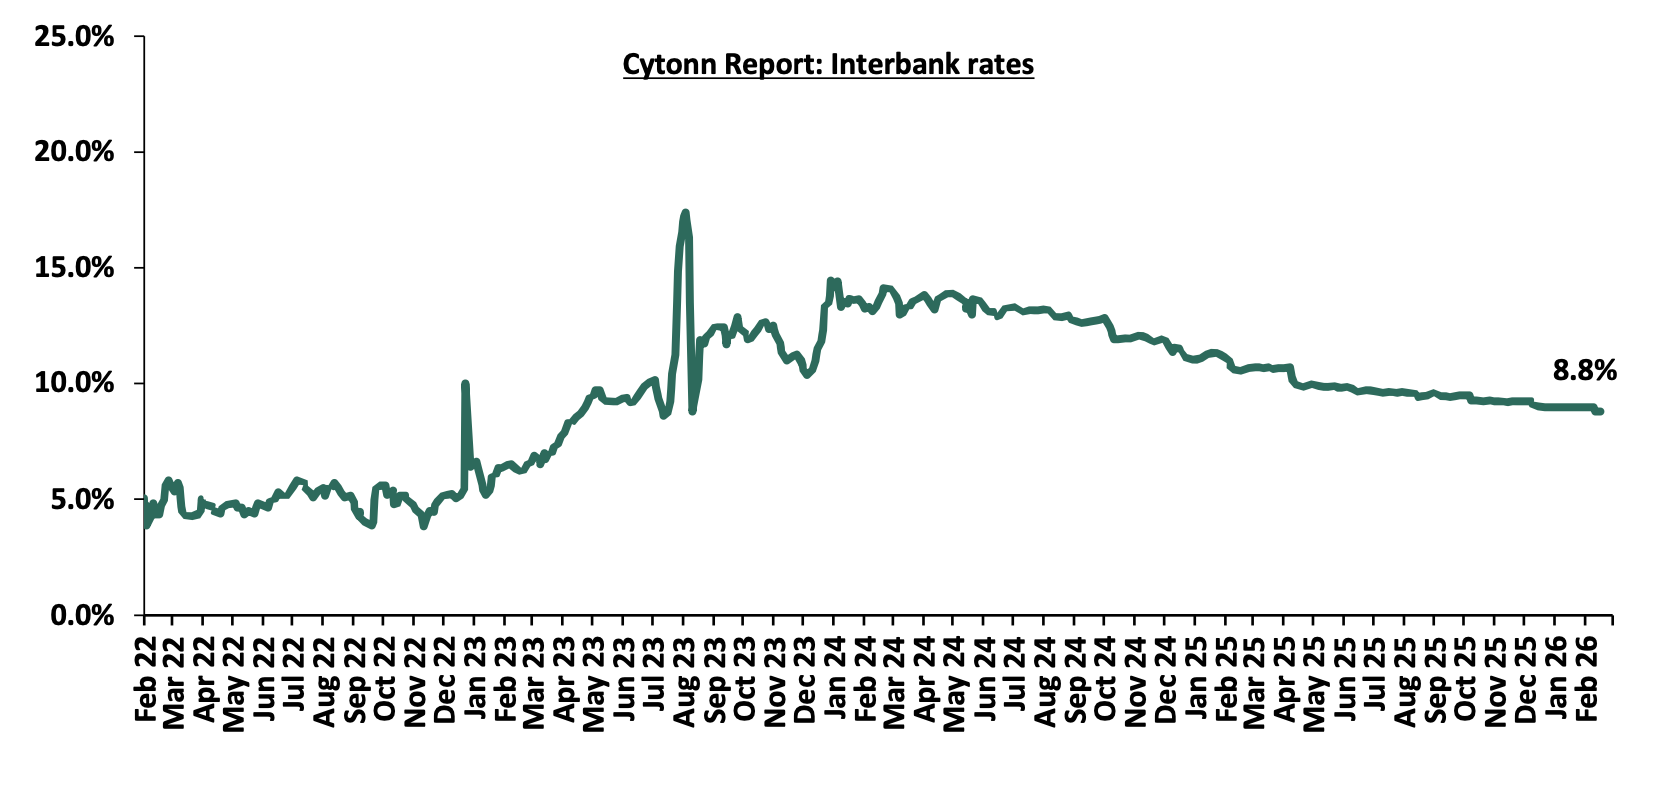
During the week, liquidity in the money markets eased with the average interbank rate decreasing by 14.5 bps to 8.8% from 8.9% recorded the previous week, partly attributable to government payments that offset tax remittances. The average interbank volumes traded increased by 22.2% to Kshs 9.1 bn from Kshs 7.5 bn recorded the previous week. The chart below shows the interbank rates in the market over the years:
Kenya Eurobonds:
During the week, the yields on the Eurobonds recorded a mixed performance with the yield on the 13-year Eurobond issued in 2021, increasing the most by 24.0 bps to 8.1% from 7.8% recorded the previous week respectively while the yield on the 10-year Eurobond issued in 2018 decreased the most by 7.0 bps to remain relatively unchanged from 6.1% recorded the previous week. The table below shows the summary performance of the Kenyan Eurobonds as of 19th February 2026;
|
Cytonn Report: Kenya Eurobonds Performance |
||||||
|
|
2018 |
2019 |
2021 |
2024 |
||
|
Tenor |
10-year issue |
30-year issue |
12-year issue |
13-year issue |
7-year issue |
|
|
Amount Issued (USD) |
1.0 bn |
1.0 bn |
1.0 bn |
1.5 bn |
1.5 bn |
|
|
Years to Maturity |
2.5 |
22.5 |
8.8 |
5.5 |
10.5 |
|
|
Yields at Issue |
7.3% |
8.3% |
6.2% |
10.4% |
9.9% |
|
|
2-Jan-26 |
6.1% |
8.8% |
7.2% |
7.8% |
7.1% |
|
|
2-Feb-26 |
6.1% |
8.6% |
7.0% |
7.7% |
6.8% |
|
|
12-Feb-26 |
6.1% |
8.7% |
7.0% |
7.8% |
6.7% |
|
|
13-Feb-26 |
6.2% |
8.7% |
7.0% |
7.9% |
6.8% |
|
|
16-Feb-26 |
6.2% |
8.7% |
7.0% |
7.9% |
6.8% |
|
|
17-Feb-26 |
6.1% |
8.7% |
7.0% |
7.8% |
6.8% |
|
|
18-Feb-26 |
6.0% |
8.7% |
6.9% |
7.9% |
6.8% |
|
|
19-Feb-26 |
6.1% |
8.8% |
7.0% |
8.1% |
6.8% |
|
|
Weekly Change |
(0.1%) |
0.1% |
0.1% |
0.2% |
0.1% |
|
|
MTD Change |
(0.0%) |
0.2% |
0.1% |
0.3% |
0.1% |
|
|
YTD Change |
0.0% |
(0.1%) |
(0.1%) |
0.2% |
(0.3%) |
|
Source: Central Bank of Kenya (CBK) and National Treasury
Kenya Shilling:
During the week, the Kenya Shilling remained unchanged against the US Dollar at Kshs 129.0. On a year-to-date basis, the shilling has appreciated by 2.3 bps against the dollar, lower than the 22.9 bps appreciation recorded in 2025.
We expect the shilling to be supported by:
-
Diaspora remittances standing at a cumulative USD 5,020.7 mn in the twelve months to January 2026, 1.2% higher than the USD 4,960.2 mn recorded over the same period in 2025. These have continued to cushion the shilling against further depreciation. In the January 2026 diaspora remittances figures, North America remained the largest source of remittances to Kenya accounting for 51.3% in the period, and,
-
Tourism inflows, which strengthened significantly. Tourism receipts reached Kshs 560.0 bn in 2025, up from Kshs 452.2 bn in 2024, representing a 23.9% increase, supported by improved international arrivals through the country’s major airports, and,
-
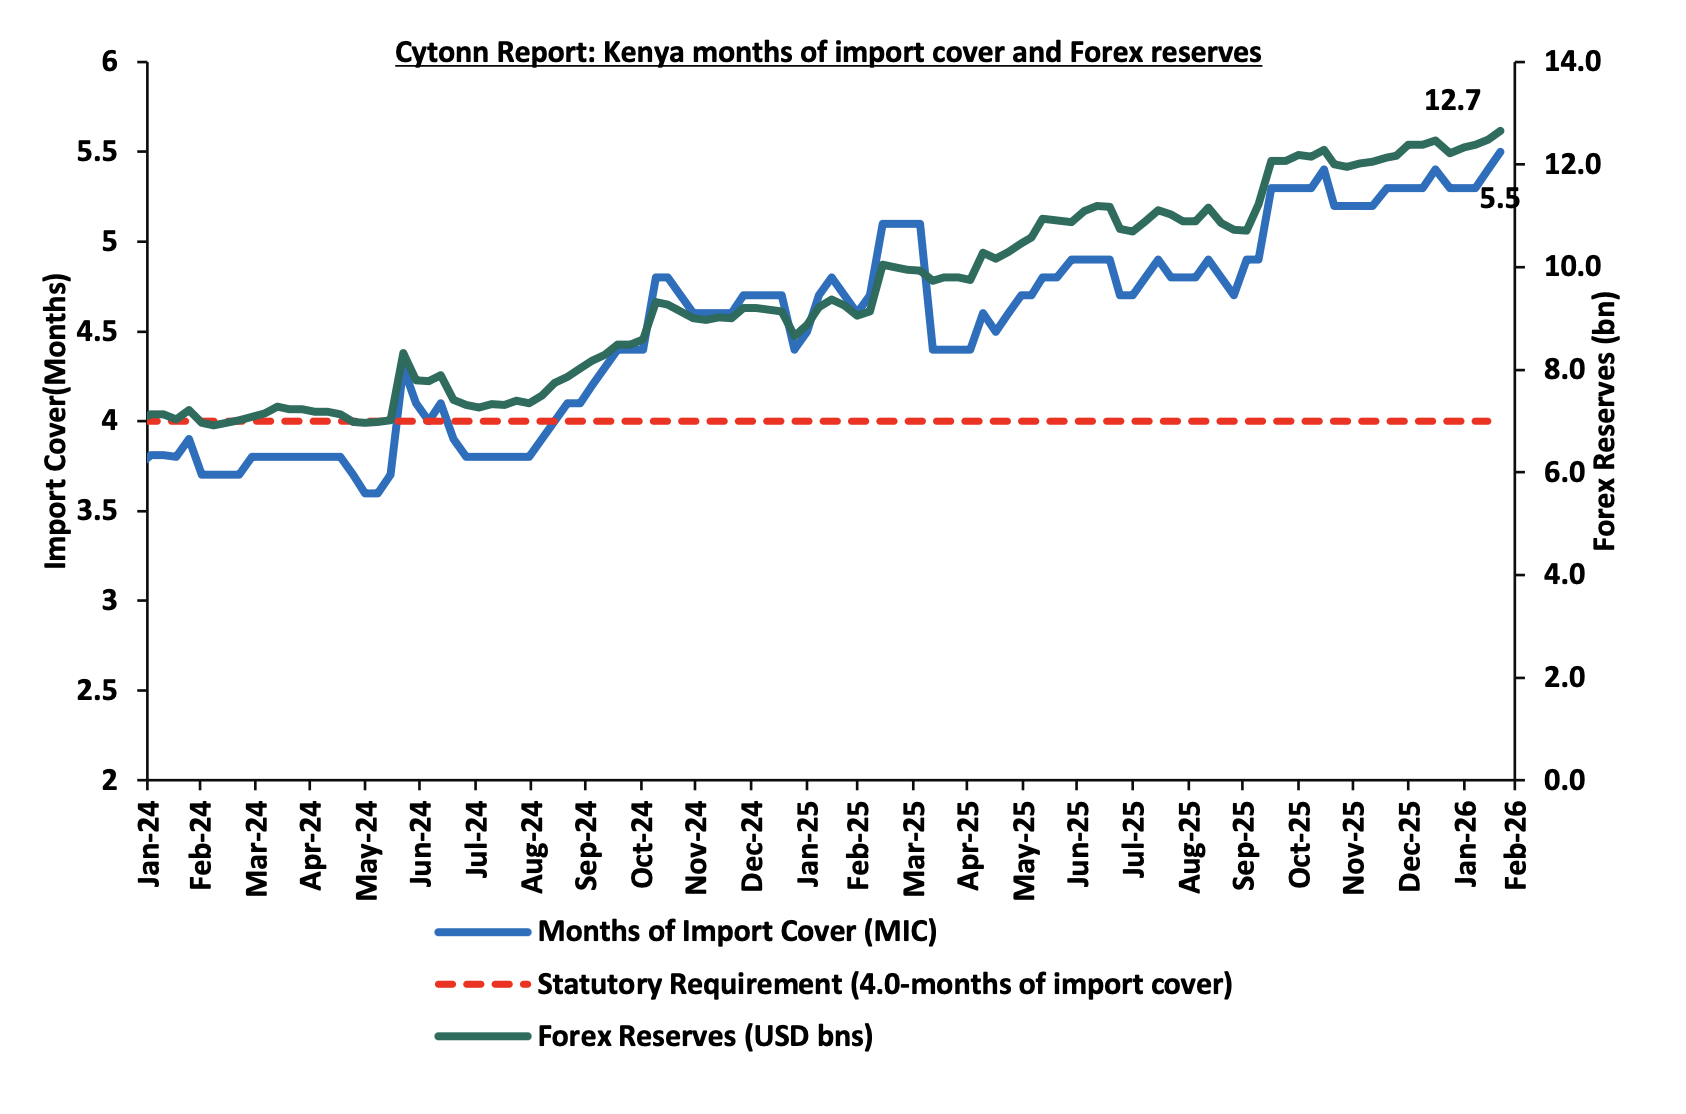
Improved forex reserves currently at USD 12.7 bn (equivalent to 5.5-months of import cover), which is above the statutory requirement of maintaining at least 4.0-months of import cover and above the EAC region’s convergence criteria of 4.5-months of import cover.
The shilling is however expected to remain under pressure in 2025 as a result of:
-
An ever-present current account deficit which is estimated at at 2.4% of GDP in 2025 and 2.2% in 2026, and,
-
Elevated government debt servicing obligations, which continue to exert pressure on foreign exchange reserves, given that 59.7% of Kenya’s external debt is US Dollar-denominated as of June 2025, sustaining demand for hard currency in 2026.
Kenya’s forex reserves increased by 1.4% during the week to USD 12.7 bn from the USD 12.5 bn recorded the previous week, equivalent to 5.5 months of import cover, and above the statutory requirement of maintaining at least 4.0-months of import cover. This is attributable to Eurobond buyback offer, continued strong diaspora remittance inflows, and foreign exchange purchases by the Central Bank of Kenya and reserve accumulation amid relatively stable currency conditions in Kenya.
The chart below summarizes the evolution of Kenya's months of import cover over the years:
Weekly Highlights
-
The 2026 Budget Policy Statement Highlight
During the week, the National Treasury released the 2026 Budget Policy Statement (BPS) in line with Section 25 of the Public Finance Management (PFM) Act, CAP 412A, which states that the National Treasury shall prepare and submit the BPS to the cabinet for approval. Subsequently the approved BPS is submitted to the parliament, by the 15th of February each year. The statement outlines priority economic policies, structural reforms and sectoral expenditure programs to be implemented under the Medium-Term Expenditure Framework (FY’2025/26–2027/28).
Below is a summary of the major changes as per the BPS 2026 from the expected FY’2025/2026 budget performance:
|
Comparison of 2025/26 and 2026/27 Fiscal Year Budgets as per the 2026 Budget Policy Statement |
|||||
|
|
FY'2024/2025 Budget Outturn |
FY'2025/2026 Original Budget |
FY'2025/26 |
FY'2026/2027 BPS |
% change |
|
Supplementary Budget |
Supp.2025/26 to 2026/27 |
||||
|
Total revenue |
2,923.6 |
3,321.7 |
3,352.1 |
3,533.7 |
5.4% |
|
External grants |
33.3 |
47.2 |
39.9 |
54.4 |
36.3% |
|
Total revenue & external grants |
2,956.9 |
3,368.9 |
3,392.0 |
3,588.1 |
5.8% |
|
Recurrent expenditure |
2,948.4 |
3,134.1 |
3,338.7 |
3,456.9 |
3.5% |
|
Development expenditure & Net Lending |
582.9 |
649.0 |
707.3 |
749.5 |
6.0% |
|
County governments + contingencies |
444.6 |
484.8 |
484.8 |
495.5 |
2.2% |
|
Total expenditure |
3,975.9 |
4,269.9 |
4,532.8 |
4,703.9 |
3.8% |
|
Fiscal deficit excluding grants |
1,052.3 |
901.0 |
1,140.7 |
1,115.8 |
(2.2%) |
|
Deficit as % of GDP |
5.9% |
4.7% |
6.0% |
5.3% |
(0.7%) |
|
Net foreign borrowing |
179.7 |
287.4 |
254.8 |
225.5 |
(11.5%) |
|
Net domestic borrowing |
854.5 |
613.5 |
885.9 |
890.4 |
0.5% |
|
Total borrowing |
1,034.2 |
901.0 |
1,140.7 |
1,115.8 |
(2.2%) |
|
GDP Estimate |
17144.0 |
19272.8 |
19003.2 |
20947.4 |
10.2% |
Key take-outs from the table include:
-
Total revenue is projected to increase by 5.4% to Kshs 3,533.7 bn in FY’2026/27 from Kshs 3,352.1 bn in FY’2025/26. External grants are expected to rise by 36.3% to Kshs 54.4 bn, bringing total revenue and grants to Kshs 3,588.1 bn, a 5.8% increase.
-
Total expenditure is projected to increase by 3.8% to Kshs 4,703.9 bn in FY’2026/27 from Kshs 4,532.8 bn in FY’2025/26.
-
Development expenditure & net lending is set to rise by 6.0% to Kshs 749.5 bn, while recurrent expenditure is projected to increase by 3.5% to Kshs 3,456.9 bn. Recurrent expenditure remains the largest share of total spending accounting for 73.5%, while development expenditure will be allocated 15.9%.
-
The fiscal deficit (including grants) is projected to decrease by 2.2% to Kshs 1,115.8 bn in FY 2026/27 from Kshs 1,140.8 bn in FY’2025/26, with the deficit as a share of GDP declining to 5.3% from 6.0%.
-
Total borrowing is projected to decline to Kshs 1,115.8 bn from Kshs 1,140.7 bn in FY’2025/26. This comprises net foreign borrowing of Kshs 225.5 bn and net domestic borrowing of Kshs 890.4 bn, reflecting the government’s continued preference for domestic financing amid constrained access to external markets and efforts to manage foreign exchange risk.
-
GDP is projected to grow by 10.2% to Kshs 20,947.4 bn in FY 2026/27 from Kshs 19,003.2 bn in FY 2025/26, providing some fiscal space for the planned expenditure increase.
For more information, please check our BPS 2026 Note.
-
Kenya’s Eurobond Buyback Offer and Issue Highlight
During the week, the Kenyan government announced its plan to invite eligible holders of its outstanding USD 1.2 bn 2032 notes and USD 0.4 bn 2028 notes to tender their securities for repurchase under a liability management (buyback) offer, at a purchase price of USD 1,055.0 and 1,035.0 per USD 1,000.0 in principal amount of notes accepted for purchase respectively. The purchase is capped at USD 500.0 mn up to USD 350.0 bn for 2032 notes and USD 150.0 mn for the 2028 notes. The maturity date for the 2032 and 2028 notes is 22nd May 2032 and 28th February 2028 respectively. The offer began on 18th February 2026 and will expire on 25th February 2026, unless extended, re-opened, amended or terminated by the Republic of Kenya.
The government during the week, raised USD 2.3 bn through a new dual-tranche Eurobond issuance comprising a USD 900.0 mn 7-year Eurobond priced at 7.9% and maturing in 2034 with amortization in 2032–2034, and a USD 1.4 bn 12-year note priced at 8.7% maturing in 2039 with amortization in 2037–2039. Of the proceeds, USD 500.0 mn will finance the buyback of the 8.0% 2032 and 7.25% 2028 notes, while the remaining USD 1.8 bn will be used for budget support, marking a relatively costly refinancing transaction.
The graphs below show the yields for the two bonds since they were issued in 2018 and 2019:
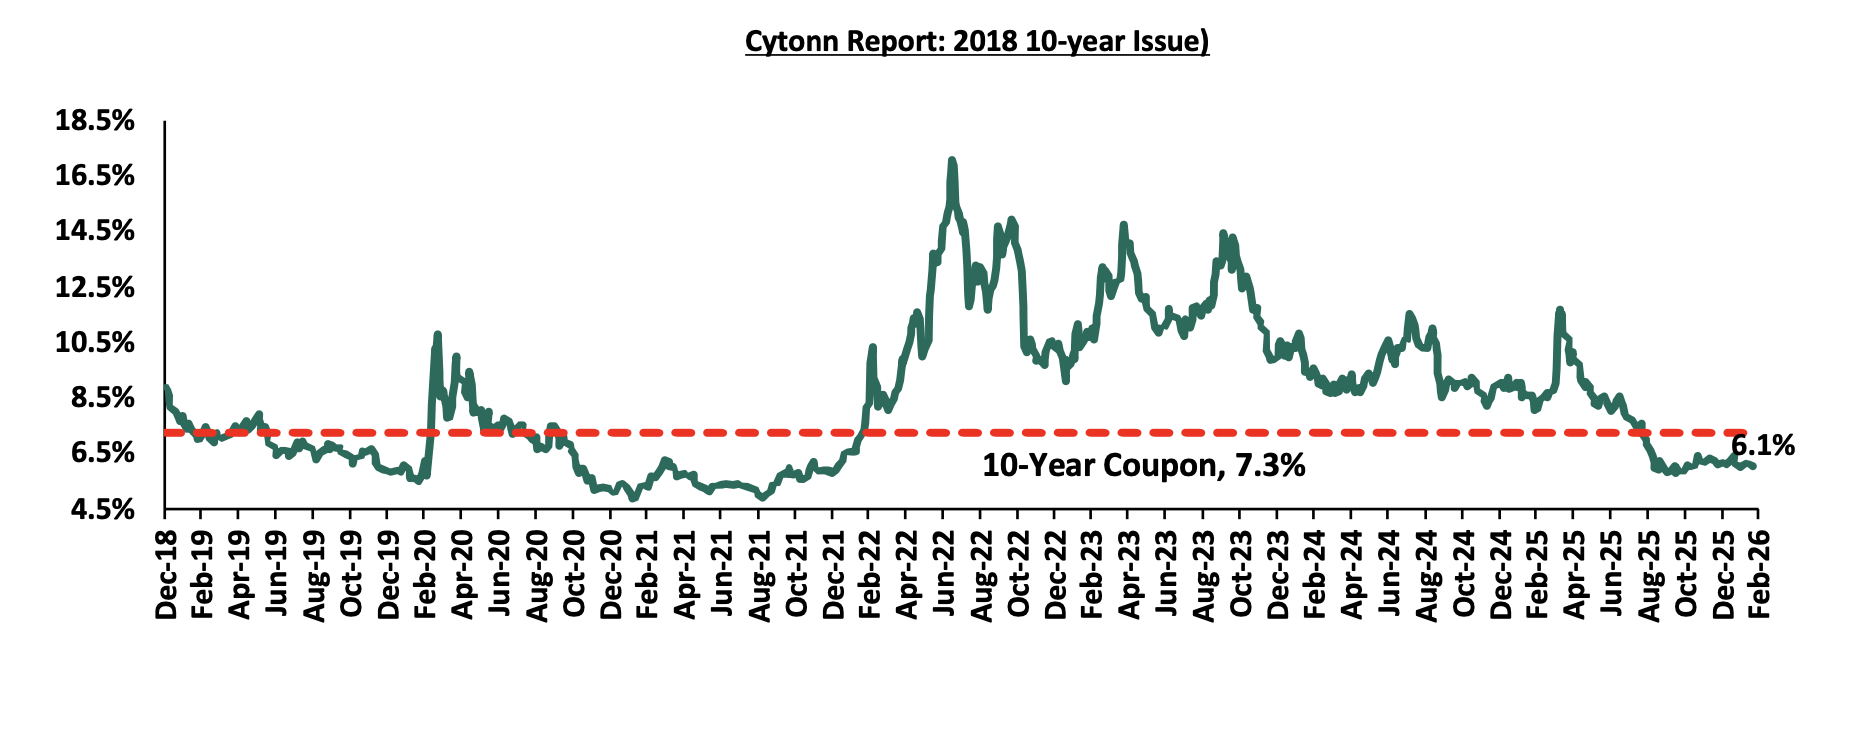
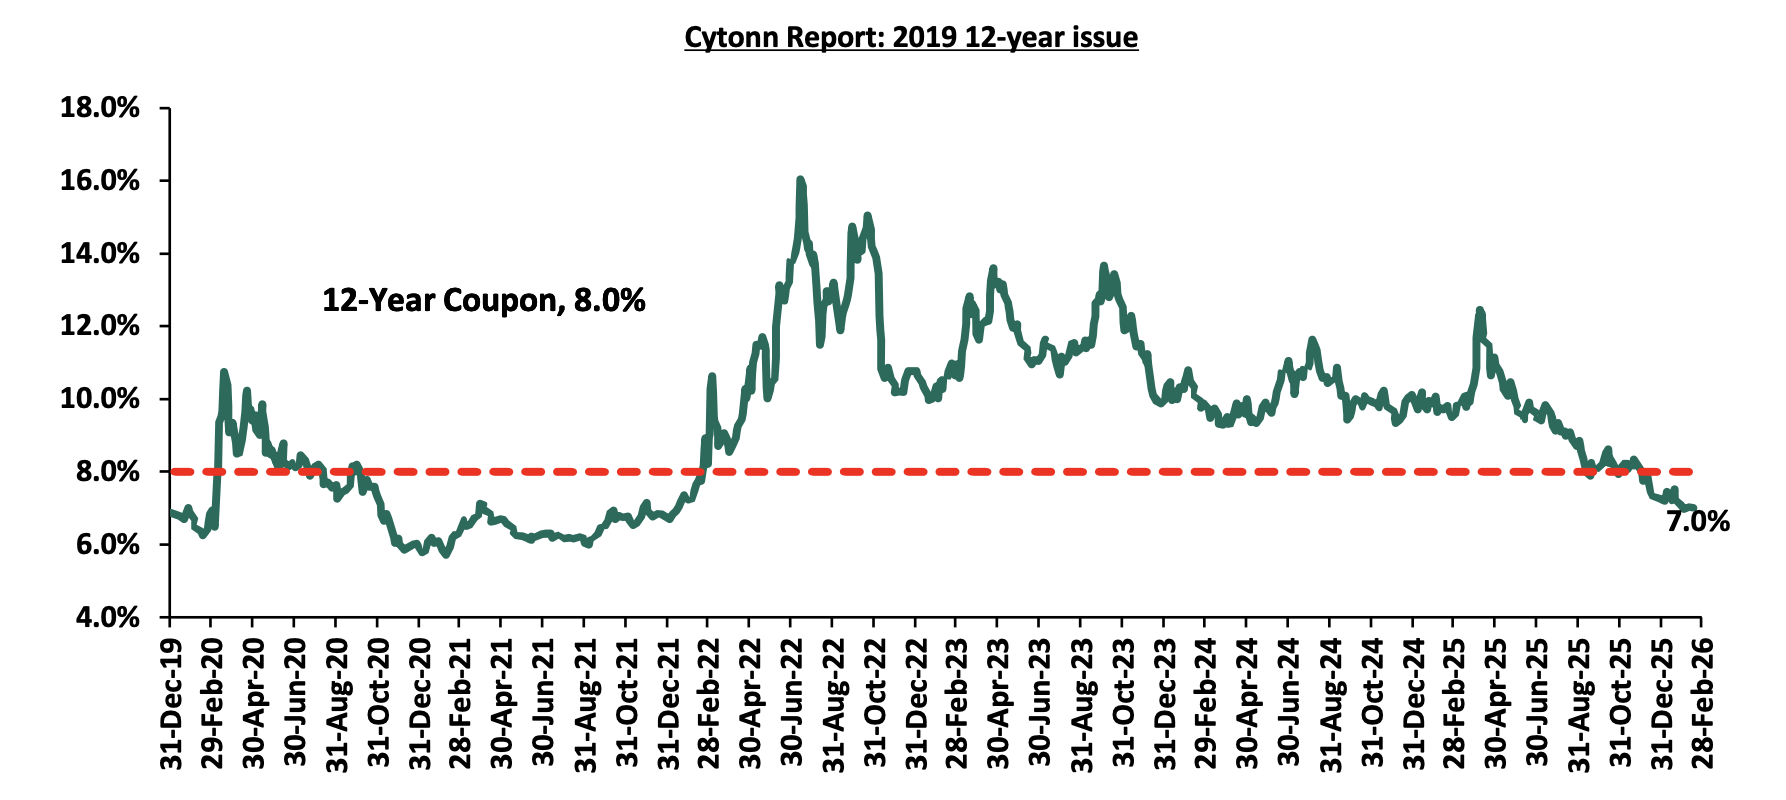
Kenya’s successful Eurobond buybacks such as the 2018 10-year bond and the 2019 7-year bond and the oversubscribed issuance set a positive precedent for its future engagement with international capital markets. While repeated Eurobond buybacks have strengthened market confidence and helped smooth the external debt maturity profile, their long-term sustainability depends on whether they materially reduce debt vulnerabilities rather than simply shift repayment timelines. For Kenya, buybacks financed through new commercial borrowing or reserve drawdowns can weaken external buffers and increase rollover dependence if not accompanied by fiscal consolidation and stronger foreign exchange inflows. Empirical evidence across emerging markets shows that liability-management operations lower refinancing risk only when paired with declining primary deficits and credible debt-reduction paths, otherwise, they may amount to debt reprofiling rather than deleveraging. Sustained effectiveness therefore hinges on maintaining adequate reserve coverage, improving revenue mobilization, and advancing structural reforms under programs such as those supported by the International Monetary Fund, ensuring buybacks remain a risk-management tool rather than a recurring financing necessity.
-
February 2026 Inflation Projection
We are projecting the y/y inflation rate for February 2026 to decrease marginally to within the range of 4.2%- 4.3%, mainly on the back of:
-
Appreciation of the Kenya Shilling against the US Dollar- The Kenya Shilling recorded a 0.8 bps month-to-date appreciation as of 20th February to Kshs 129.02 from Kshs 129.03 recorded at the beginning of the month. This appreciation in the exchange rate could ease inflationary pressures, making imported goods more affordable.
-
Decline in Fuel Prices in February 2026- The Energy and Petroleum Regulatory Authority (EPRA) released their monthly statement on the maximum retail fuel prices in Kenya, effective from 15th February 2026 to 14th March 2026. Notably, the maximum allowed prices for Super Petrol, Diesel and Kerosene decreased by Kshs 4.2, Kshs 3.9 and Kshs 1.0 per litre to Kshs 178.3, Kshs 166.5 and Kshs 152.8 per litre from Kshs 182.5, Kshs 170.5 and Kshs 153.8 per litre respectively in January 2026. This decline in fuel prices may help ease inflation pressure, given fuel's significant role in transportation and production costs across the economy.
We, however, anticipate that inflationary pressures will be driven higher by:
-
The decrease in the Central Bank Rate (CBR) by 25.0 bps to 8.75% from 9.00%- In 2026, the CBK Monetary Policy Committee has continued adopting an accommodative monetary policy stance, reducing the Central Bank Rate (CBR) by a cumulative 25.0 bps from 9.0% at the beginning of 2026. This reduction in the CBR is likely to increase the money supply through lower borrowing costs, which may cause a slight rise in inflation rates as the effects of the CBR continue to gradually take hold in the broader economy.
Going forward, we expect inflationary pressures to remain anchored in the short term, remaining within the CBK’s target range of 2.5%-7.5% aided by a stable currency and stable fuel prices. However, risks remain, particularly from the potential for increased demand-driven inflation due to accommodative monetary policy. The decision to lower the CBR to 8.75% during the latest MPC meeting will likely increase money supply, in turn increasing inflation, especially with further cuts expected in the coming meetings. The CBK’s ability to balance growth and inflation through close monitoring of both inflation and exchange rate stability will be key to maintaining inflation within the target range.
Rates in the Fixed Income market have been on a downward trend due to easing inflation, strong money market liquidity, and the government’s rejection of high-priced bids supporting yield curve normalization. The government is 114.8% ahead of its prorated net domestic borrowing target of Kshs 413.3 bn, having a net borrowing position of Kshs 887.6 bn (inclusive of T-bills). Going forward, we anticipate stabilization across the short to medium end of the yield curve as the government increasingly turns to external borrowing to sustain its fiscal position, thereby easing pressure on the domestic market. In this environment, investors are expected to shift towards longer-dated securities to lock in the prevailing high yields.
Market Performance:
During the week, the equities market was on a downward trajectory, with NSE 10, NASI, NSE 25, and NSE 20 declining by 3.5%, 3.1%, 2.6% and 0.3% respectively, taking the YTD performance to gains of 15.3%, 12.0%, 11.4% and 10.0% for NSE 20, NASI, NSE 25 and NSE 10 respectively. The equities market performance was mainly driven by loses recorded by large cap stocks such as Safaricom, DTB-K and Equity of 5.7%, 5.3% and 4.6% respectively. However, the performance was supported by gains recorded by large cap stocks such as Stanbic and BAT of 5.6% and 3.5% respectively.
Additionally, during the week, the banking sector index declined by 1.9% to 232.5 from 237.1 recorded the previous week. This is attributable to losses recorded by stocks such as DTB-K, Equity and Absa of 5.3%, 4.6% and 3.7% respectively. However, the performance was supported by gains recorded by stocks such as Stanbic of 5.6%.
During the week, equities turnover decreased by 21.0% to USD 45.0 mn from USD 56.9 mn recorded the previous week, taking the YTD total turnover to USD 243.1 mn. Foreign investors remained net sellers for the third consecutive week with a net selling position of USD 6.6 mn, from a net selling position of USD 4.6 mn recorded the previous week, taking the YTD foreign net selling position to USD 27.9 mn, compared to a net selling position of USD 92.9 mn recorded in 2025.
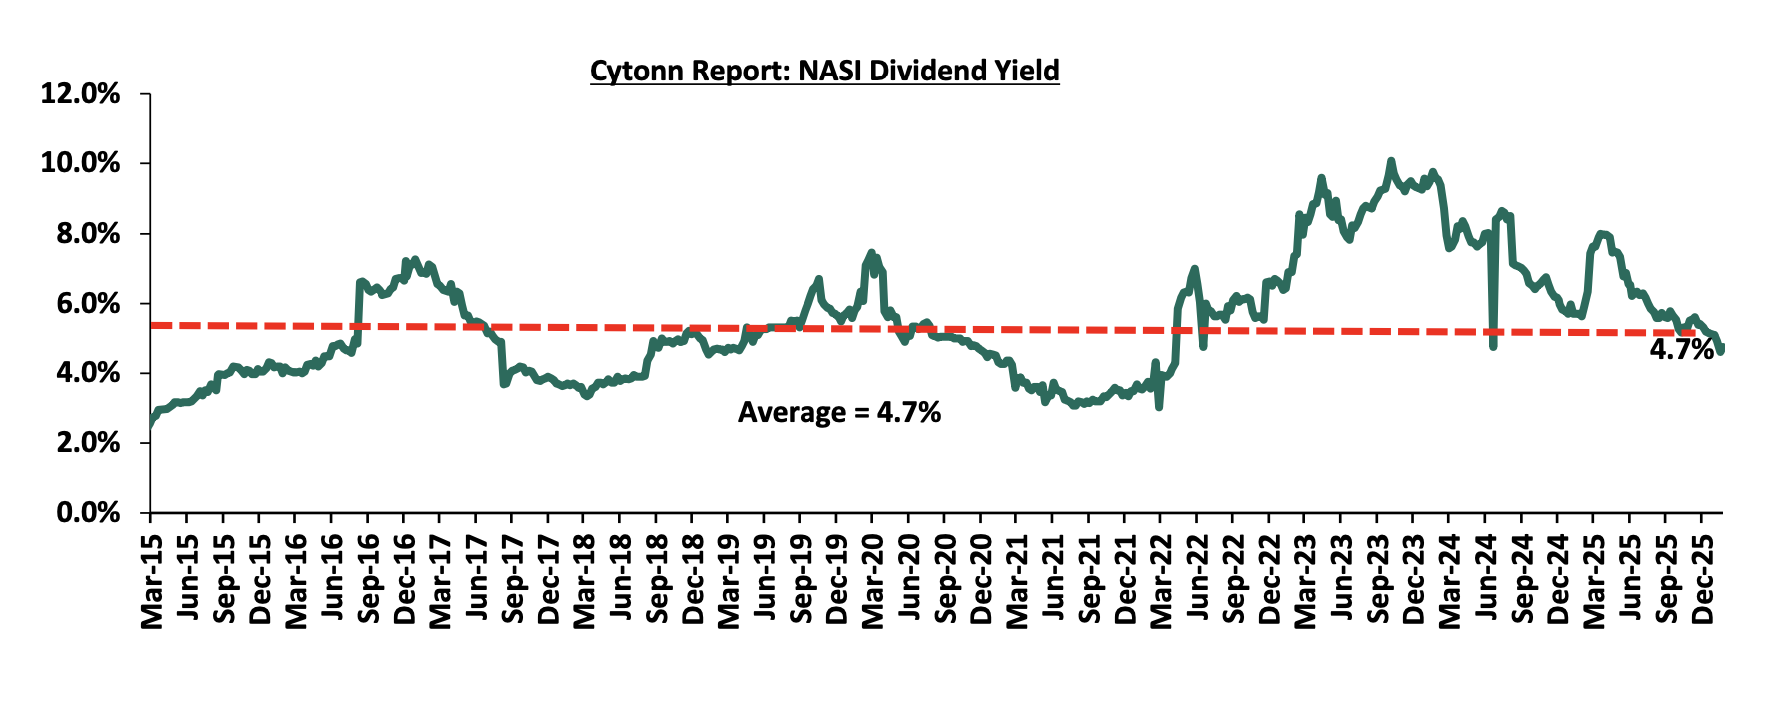
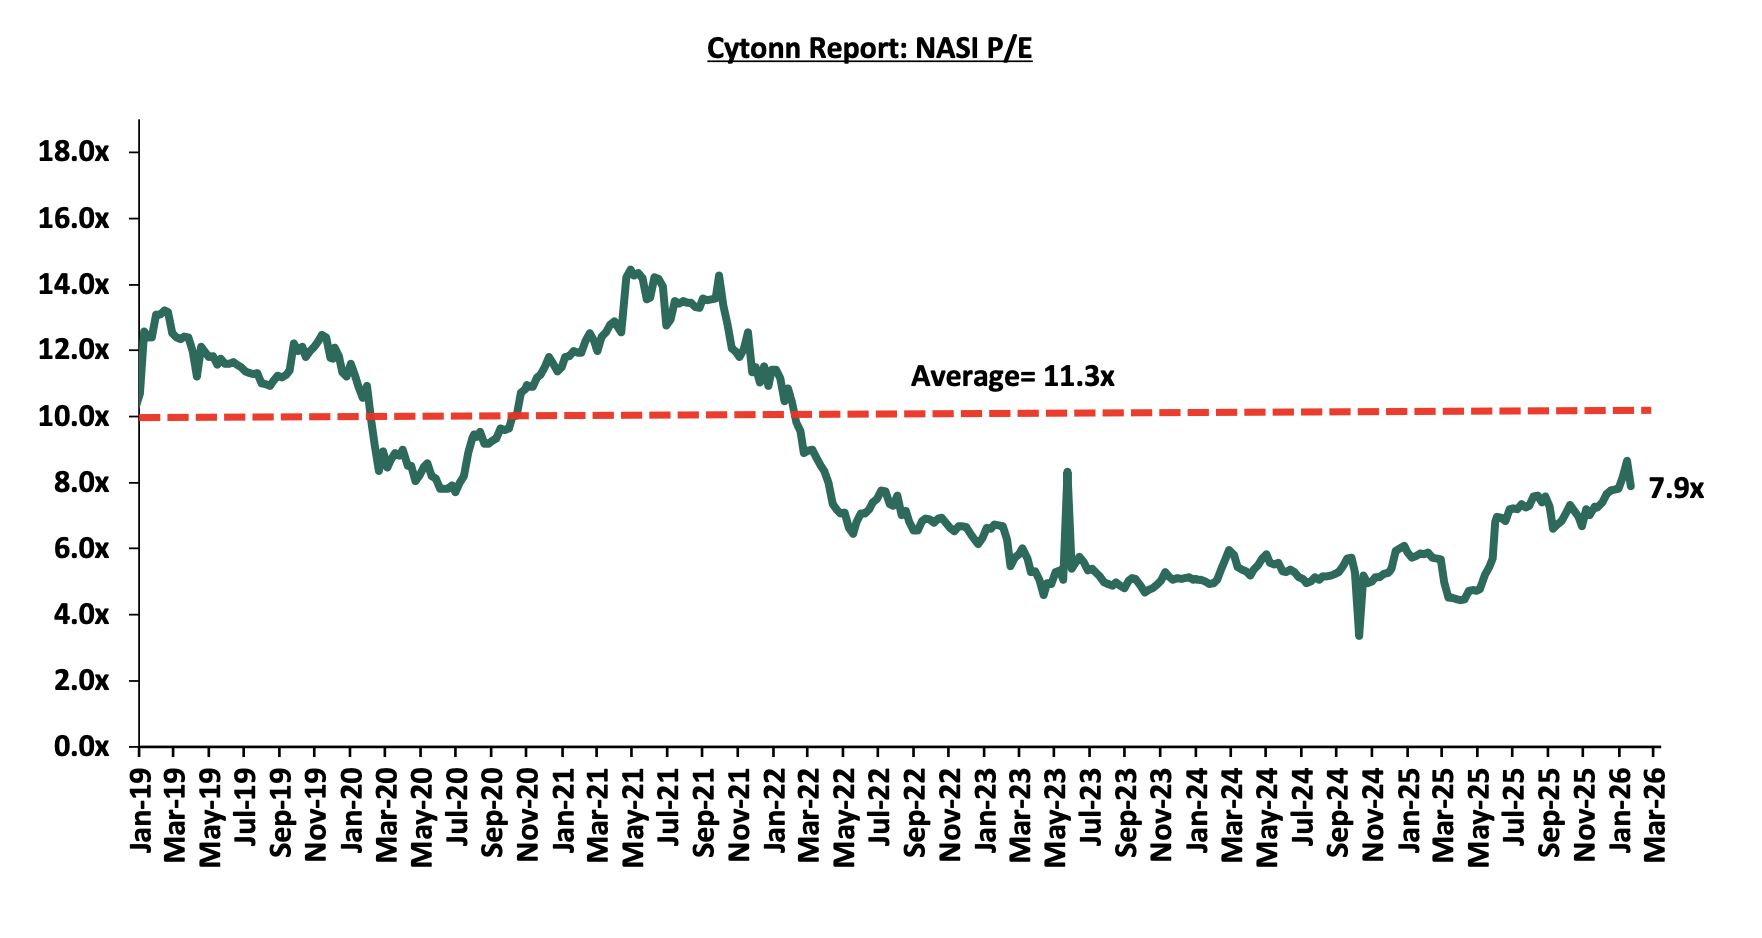
The market is currently trading at a price to earnings ratio (P/E) of 7.9x, 30.2% below the historical average of 11.3x. The dividend yield stands at 4.7%, at par with the historical average of 4.7%. Key to note, NASI’s PEG ratio currently stands at 1.0x, an indication that the market is fairly valued relative to its future growth. A PEG ratio greater than 1.0x indicates the market may be overvalued while a PEG ratio less than 1.0x indicates that the market is undervalued.
The charts below indicate the historical P/E and dividend yields of the market.
Universe of Coverage:
|
Cytonn Report: Equities Universe of Coverage |
||||||||||
|
Company |
Price as at 13/02/2026 |
Price as at 20/02/2026 |
w/w change |
YTD Change |
Year Open 2026 |
Target Price* |
Dividend Yield |
Upside/ Downside** |
P/TBv Multiple |
Recommendation |
|
NCBA |
89.75 |
88.25 |
(1.7%) |
3.8% |
85.0 |
101.3 |
6.2% |
21.0% |
1.4x |
Buy |
|
Equity Group |
76.75 |
73.25 |
(4.6%) |
9.3% |
67.0 |
83.2 |
5.8% |
19.3% |
1.3x |
Accumulate |
|
Standard Chartered Bank |
336.75 |
336.25 |
(0.1%) |
12.2% |
299.8 |
354.6 |
13.4% |
18.8% |
1.9x |
Accumulate |
|
Diamond Trust Bank |
160.00 |
151.50 |
(5.3%) |
32.0% |
114.8 |
170.0 |
4.6% |
16.8% |
0.5x |
Accumulate |
|
I&M Group |
49.85 |
48.35 |
(3.0%) |
13.0% |
42.8 |
53.1 |
6.2% |
16.0% |
0.8x |
Accumulate |
|
ABSA Bank |
29.55 |
28.45 |
(3.7%) |
14.5% |
24.9 |
30.7 |
6.2% |
14.1% |
1.8x |
Accumulate |
|
Co-op Bank |
29.60 |
29.05 |
(1.9%) |
21.5% |
23.9 |
31.5 |
5.2% |
13.6% |
1.2x |
Accumulate |
|
KCB Group |
75.25 |
74.75 |
(0.7%) |
13.7% |
65.8 |
78.0 |
4.0% |
8.4% |
0.9x |
Hold |
|
Britam |
11.55 |
11.90 |
3.0% |
31.3% |
9.1 |
12.8 |
0.0% |
7.6% |
1.1x |
Hold |
|
Stanbic Holdings |
240.00 |
253.50 |
5.6% |
28.2% |
197.8 |
250.6 |
8.2% |
7.0% |
1.5x |
Hold |
|
CIC Group |
5.52 |
6.20 |
12.3% |
36.6% |
4.5 |
6.5 |
2.1% |
6.9% |
1.7x |
Hold |
|
Jubilee Holdings |
349.75 |
359.00 |
2.6% |
11.3% |
322.5 |
354.3 |
3.8% |
2.4% |
0.5x |
Lighten |
|
*Target Price as per Cytonn Analyst estimates **Upside/ (Downside) is adjusted for Dividend Yield ***Dividend Yield is calculated using FY’2024 Dividends |
||||||||||
Weekly Highlights
-
Proposed acquisition of a minority stake in ICEA Lion by Leapfrog Investments
During the week, Leapfrog Investments revealed plans to acquire 24.1% minority stake of ICEA Lion Insurance Holdings valued at Kshs 2.4 bn. This comes after the Competition Authority of Kenya approved a 24.1% acquisition of ICEA Lion by Eastern Africa Holdings Limited in October 2025.
ICEA Lion has registered a positive performance in their financial statements where as of 2024 it recorded an 18.2% increase in their profit for the year to Kshs 1.3 bn from Kshs 1.1 bn in 2023. Moreover, their net premiums registered a 25.8% increase to Kshs 3.8 bn from Kshs 3.1 bn in 2023. With this, Leapfrog’s planned acquisition of a 24.1% stake appears well-timed to tap into the insurer’s strong financial momentum.
Key highlights of the proposed transaction include:
-
The acquisition will be executed through a structured minority investment, with LeapFrog Investments acquiring a 24.1% stake in ICEA Lion Group. This positions it as a significant but non-controlling shareholder.
-
Upon completion, ICEA Lion’s existing shareholders will retain majority ownership, with LeapFrog securing minority protections and certain veto rights over key strategic matters in line with private equity practice.
-
The transaction is still subject to regulatory approval from the Competition Authority of Kenya, with clearance yet to be granted, meaning completion remains contingent on the authorities’ review and satisfaction that the deal does not raise material competition concerns
-
Leapfrog Investments is a private equity firm that focuses on backing high-growth businesses that deliver essential services to emerging market consumers, primarily in Africa and Asia. It was founded in 2007 by Andrew Kuper with its main focus on financial services, healthcare and climate solutions.
The proposed 24.1% stake acquisition in ICEA Lion Group by LeapFrog Investments introduces a strategic partner with experience in scaling financial services across emerging markets. Beyond capital, LeapFrog’s involvement could strengthen governance, accelerate digital innovation, and support regional expansion. If executed effectively, the partnership may enhance ICEA Lion’s competitiveness and unlock sustainable long-term growth in East Africa’s evolving insurance sector.
We are “Bullish” on the Equities markets in the short term due to current attractive valuations, lower yields on short-term government papers and expected global and local economic recovery, and, “Neutral” in the long term due to persistent foreign investor outflows. With the market currently trading at par to its future growth (PEG Ratio at 1.0x), we believe that investors should reposition towards value stocks with strong earnings growth and that are trading at discounts to their intrinsic value.
-
Statutory Reviews
-
Review of the National Infrastructure Fund Bill, 2025
-
The National Infrastructure Fund Bill, 2025 seeks to establish a statutory framework for the creation and operation of a National Infrastructure Fund (NIF). Its primary objective is to mobilize, manage and deploy long-term capital for infrastructure development. By formalizing infrastructure financing within a legally recognized institutional structure, the Bill attempts to move away from fragmented, project-by-project financing toward a consolidated national investment mechanism. This is the second bill under the current regime that will directly impact the real estate sector after the Affordable Housing Bill of 2023.
Here are the key highlights from the bill:
-
Institutional Design: The Bill establishes the National Infrastructure Fund as a body corporate with perpetual succession and the capacity to acquire property, enter contracts and institute or defend legal proceedings. This corporate personality is significant because it grants the Fund operational continuity and legal autonomy. The structure allows it to function with a degree of separation from routine ministerial administration, at least in formal terms. However, the extent of real independence depends heavily on the appointment mechanisms and oversight structures embedded in the Bill. While the creation of a Board provides a governance framework, the degree to which executive authorities influence appointments and removals may ultimately determine whether the Fund operates as an independent financial institution or as an extension of central government control.
-
Funding Mechanisms and Financial Architecture: The Bill provides for multiple sources of funding which include i) government appropriations, ii) bond issuances, iii) external financing arrangements, iii) returns on investments, and, iv) participation from private sector actors. This diversified funding model is conceptually sound because infrastructure projects typically require large capital commitments with long repayment horizons. By enabling borrowing and investment in varied financial instruments, the Bill attempts to position the Fund as a catalytic financier capable of leveraging public capital to crowd in private investment. Such an approach aligns with contemporary development finance strategies. Nevertheless, the Bill appears to leave certain fiscal risk parameters insufficiently defined. If borrowing powers and guarantees are not subject to explicit ceilings or prudential ratios, the Fund could accumulate significant contingent liabilities. In such a scenario, risks may materialise outside traditional budgetary scrutiny, raising concerns about fiscal transparency and macroeconomic stability.
-
Investment Mandate and Operational Scope: The Fund is empowered to invest in infrastructure projects, enter joint ventures and participate in public-private partnerships. This flexibility is advantageous because infrastructure financing often requires hybrid arrangements involving government participation, private equity, multilateral funding and debt instruments. However, the Bill’s articulation of “infrastructure” may be broad. Without clearly defined sectoral priorities or project selection criteria, there is a risk of discretionary allocation. The absence of explicit benchmarks for economic viability, developmental impact or climate resilience could allow politically motivated investments to override objective assessment. We recommend embedding measurable performance indicators and clearly defined evaluation methodologies. Infrastructure investments are long-term commitments, and their success must be assessed not only on financial returns but also on socio-economic impact.
-
Governance and Accountability: The governance framework centres on a Board responsible for managing the affairs of the Fund. While this is consistent with corporate best practice, questions arise concerning transparency in appointments, conflict-of-interest safeguards and oversight mechanisms. If appointments are primarily executive-driven without parliamentary confirmation or independent vetting, perceptions of political influence may undermine investor confidence. Moreover, the Bill’s treatment of conflict-of-interest disclosures and recusal obligations is critical. Infrastructure financing frequently involves large procurement contracts, and inadequate safeguards may expose the Fund to corruption risks. Oversight mechanisms also merit scrutiny. Although reporting obligations may exist, the depth, frequency and public accessibility of such reports are decisive factors. Annual reporting alone may not suffice for a fund managing large-scale national assets. We propose stronger provisions for periodic disclosure and legislative review would enhance accountability.
-
Broader Policy Reflections: The Bill resembles, in several respects, a sovereign or strategic investment vehicle limited to infrastructure. This raises an important policy question: should the Fund’s mandate remain narrowly sectoral, or should it evolve into a broader development finance institution? Additionally, the centralized structure invites reflection on regional equity. If allocation mechanisms are not transparently designed to ensure geographic balance, disparities in infrastructure development may persist or worsen. The Bill could benefit from clearer provisions ensuring equitable national distribution of investments.
The National Infrastructure Fund Bill, 2025 represents a significant legislative step toward institutionalizing infrastructure finance under a formal statutory regime. If well executed, the National Infrastructure Fund Bill, 2025 could significantly transform Kenya’s infrastructure sector by creating a stable, long-term financing mechanism that reduces overreliance on annual budget allocations and external sovereign borrowing. By pooling capital and professionally managing investments, the Fund could accelerate the delivery of priority projects in transport, energy, water and digital infrastructure, improve project preparation standards, and crowd in private sector participation through structured public-private partnerships.
-
Industry Report
-
December Leading Economic Indicators (LEI)
During the week, the Kenya National Bureau of Statistics (KNBS) released the Leading Economic Indicators (LEI) December 2025 Report, which highlighted the performance of major economic indicators. The key highlights related to the Real Estate sector include:
-
In December 2025, cement consumption reached 938,302 metric tonnes, representing a 24.7% y/y increase from the same month in 2024. Month-on-month, consumption decreased by 1.4%, to 938,302 from 951,901 in November 2025 reflecting a decline in momentum in the construction sector. The y/y performance was anchored by (i) continued private sector construction activity in urban hubs such as Nairobi, Mombasa, and Kisumu, (ii) government-led infrastructure investments under the Bottom-Up Economic Transformation Agenda (BETA), including roads, affordable housing, water, and sanitation projects, and (iii) public works initiatives in rural and semi-urban areas, which both support livelihoods and expand critical infrastructure.
The chart below shows cement consumption in metric tonnes in Kenya between Q1’2023 and Q4’2025
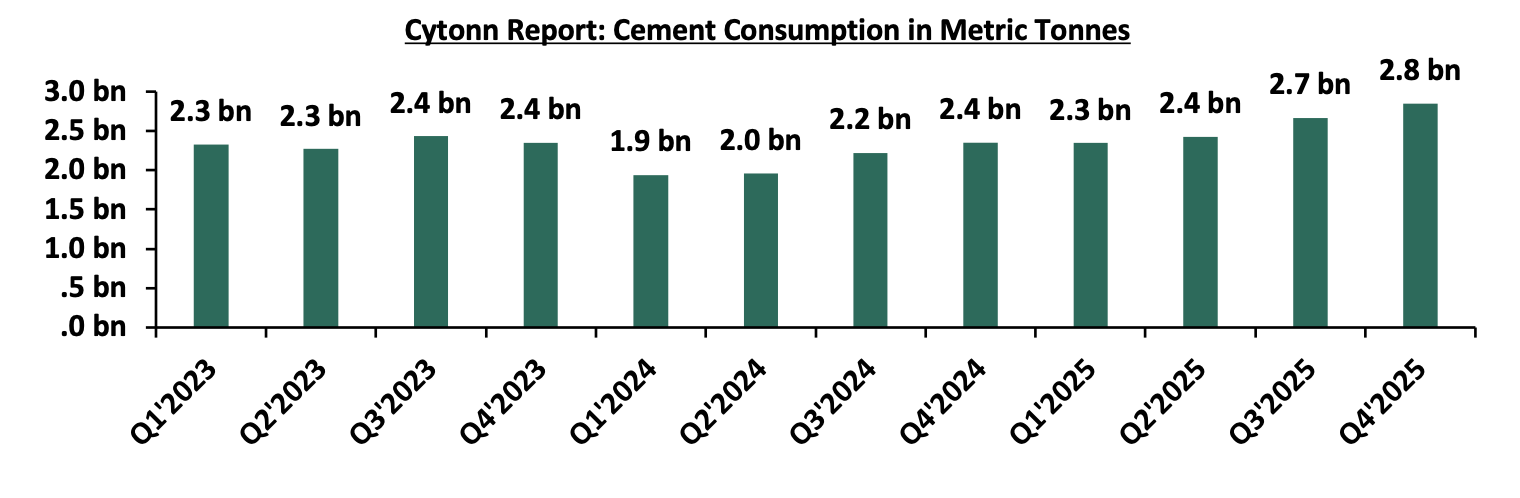
Source: Kenya National Bureau of Statistics (KNBS)
-
Infrastructure Sector
-
Kenya to tap 90.0% of railway levy for SGR bonds
Kenya plans to amend the Miscellaneous Fees and Levies (Amendment) Bill, 2025 to allow up to 90% of Railway Development Levy (RDL) collections, charged at 2% of the customs value of imports, to be used as security for additional financing of railway projects, subject to approval by the Parliament of Kenya. The proposal mirrors the securitization model applied to the Road Maintenance Levy Fund, transforming future levy proceeds into a financial anchor for loans, bonds, or other structured instruments. It also introduces a ring-fenced Railway Development Levy Fund, administered by a corporate Board comprising government representatives and experts in infrastructure finance, law, investment, and PPPs. The move comes amid engagements with China Exim Bank to remove restrictions tying the levy to existing SGR debt repayment, thereby freeing it to support new borrowing, including the extension of the Standard Gauge Railway (SGR) from Naivasha to Malaba, while broadening the levy’s scope to cover safety, regulation, and rehabilitation.
Going forward, leveraging predictable levy inflows is expected to accelerate railway expansion and enhance connectivity across key trade corridors, particularly along the SGR route. Improved logistics efficiency and reduced transport costs could stimulate demand for logistics parks, warehousing, industrial nodes, and mixed-use developments around railway-linked hubs, positioning SGR-adjacent towns as emerging real estate growth centers. However, increased reliance on future levy flows as collateral also heightens fiscal exposure risks, especially amid rising debt-servicing pressures, making project execution efficiency and traffic uptake critical to sustaining investor confidence and unlocking long-term real estate value.
-
Hospitality Sector
-
Airlines counted losses after disruptive workers’ strike
During the week, airlines began auditing the financial impacts of the strike by Kenya Aviation Workers Union (KAWU) which disrupted operations at Jomo Kenyatta International Airport, affecting seven carriers, leading to aircraft groundings, flight cancellations, and passenger refunds. Jambojet operated 23 return flights out of the scheduled 64 return flights between Monday and Tuesday, with approximately 5,000 passengers affected over the two days. Departures were delayed by several hours, some even up to six hours, while aircraft were running engines for up to one and a half hours on the tarmac before clearance to depart, increasing fuel and maintenance costs and reducing aircraft utilization from six flights a day to three. Airlines reported financial losses linked to fuel burn, refunds, compensation claims, cancellations, and lost flying hours, while Kenya Airways (KQ) confirmed operational disruptions but indicated no impact on fleet utilization, international airport access, or slot allocations. The disruption affecting approximately 5,000 passengers within two days is likely to translate into reduced short-term hotel occupancy, lower airport retail turnover, and deferred conference and business travel activity, as refunds and rescheduling of flights temporarily disrupt travel-related spending patterns, directly impacting airport-adjacent commercial and hospitality assets.
The strike led to sectors such as restaurants, airport‑adjacent retail outlets, and other hospitality businesses experiencing lower customer traffic and reduced revenue. Overall, the disruption temporarily suppressed earnings and underutilized capacity across the hospitality sector.
-
Real Estate Investments Trusts
-
REITs Weekly Performance
On the Unquoted Securities Platform Acorn D-REIT and I-REIT traded at Kshs 27.4 and Kshs 23.2per unit, respectively, as per the last updated data on 20th February 2025. The performance represented a 33.4% and 14.5% gain for the D-REIT and I-REIT, respectively, from the Kshs 20.0 inception price. The volumes traded for the D-REIT and I-REIT came in at 13.4 mn and 42.2 mn shares, respectively. Additionally, ILAM Fahari I-REIT traded at Kshs 11.0 per share as of 20th February, representing a 45.0% loss from the Kshs 20.0 inception price. The volume traded to date came in at 1.2 mn shares for the I-REIT, REITs offer various benefits, such as tax exemptions, diversified portfolios, and stable long-term profits. However, the ongoing decline in the performance of Kenyan REITs and the restructuring of their business portfolios are hindering significant previous investments. Additional general challenges include:
-
Insufficient understanding of the investment instrument among investors leading to a slower uptake of REIT products,
-
Lengthy approval processes for REIT creation,
-
High minimum capital requirements of Kshs 100.0 mn for REIT trustees compared to Kshs 10.0 mn for pension funds Trustees, essentially limiting the licensed REIT Trustee to banks only
-
The rigidity of choice between either a D-REIT or and I-REIT forces managers to form two REITs, rather than having one Hybrid REIT that can allocate between development and income earning properties
-
Limiting the type of legal entity that can form a REIT to only a trust company, as opposed to allowing other entities such as partnerships, and companies,
-
We need to give time before REITS are required to list – they would be allowed to stay private for a few years before the requirement to list given that not all companies maybe comfortable with listing on day one, and,
-
Minimum subscription amounts or offer parcels set at Kshs 0.1 mn for D-REITs and Kshs 5.0 mn for restricted I-REITs. The significant capital requirements still make REITs relatively inaccessible to smaller retail investors compared to other investment vehicles like unit trusts or government bonds, all of which continue to limit the performance of Kenyan REITs.
We expect the performance of Kenya’s Real Estate sector to remain resilient, supported by several factors: i) Kenya tapping 90.0% of railway levy for SGR bond. ii) The reviewing of the National Infrastructure Fund bill, 2025. However, challenges such as the financial impact of the strike by KAWU at the Jomo Kenyatta International Airport, weak investor appetite in listed REITs like ILAM Fahari I-REIT and high capital requirements will continue to constrain the sector’s optimal performance.
It has been four years since the Kenya Kwanza government assumed office, and one of its key pillars under the Bottom-Up Economic Transformation Agenda (BETA) is providing affordable housing to Kenyans. This housing program builds on initiatives from the previous administration under the Jubilee government's Big Four Agenda, launched in 2017 with the ambitious goal of delivering 1,000,000 housing units by 2022.
The Affordable Housing Program (AHP), a flagship pillar of the Bottom-Up Economic Transformation Agenda under President William Ruto, represents one of the most ambitious state-led real estate interventions in Kenya’s post-independence history. Conceived as both a social welfare and economic stimulus mechanism, the program aims to deliver 250,000 housing units annually, with an aggregate target of one million units by 2027. Beyond shelter provision, the initiative is designed to stimulate construction-sector growth, formalize urban housing supply, deepen mortgage penetration, and expand employment across the built environment value chain.
As of 2026, the program demonstrates measurable momentum in financing mobilization and project initiation, yet it continues to lag behind original delivery timelines. While construction activity is visible across multiple counties and revenue collection via the Housing Levy has been robust, actual completed and occupied units remain significantly below annual targets. The program therefore sits at a critical juncture between structural transformation and execution risk.
In line with these goals, the government has implemented several notable initiatives. These include the launch of numerous Affordable Housing Programs across the country, the establishment of the Housing Levy through the Affordable Housing Act of 2024, and improved access to KMRC loans. Together, these efforts are aimed at comprehensively addressing the country's housing needs.
Housing remains a significant challenge in the country, and the government must progressively work towards implementing a holistic housing program to address diverse housing needs. With the Affordable Housing Program now in its second year under the Kenya Kwanza government, it is prudent to review its progress and provide necessary recommendations where applicable.
In June 2025 we did a focus on the Review of The Affordable Housing Initiative and we covered the areas of focus, key developments in 2025, Challenges faced by the fund and we offered recommendations on the same.
This week, we focus on the Affordable Housing Program in the country, covering the following areas;
-
Review of the Affordable Housing Levy funding performance,
-
Key developments under the program 2026,
-
Challenges faced by the Affordable Housing Program,
-
Recommendations, and,
-
Conclusion
Section I: Review of the affordable housing levy funding performance
The Affordable Housing Levy remains the primary revenue instrument underpinning Kenya’s Affordable Housing Program (AHP). Introduced legally through the Affordable Housing Act, 2024, it mandates a 1.5% deduction of gross income from employees, matched by 1.5% from employers, with collections remitted to the Kenya Revenue Authority (KRA) to finance housing delivery.
-
Performance of Levy Collections
In the 2024/2025 fiscal year, KRA collected Kshs 73.2bn from the housing levy, surpassing the target of Kshs 63.2 bn by about 15.8%. This marked a significant improvement on the program’s early performance, the first full year of collections saw Kshs 54.2 bn in receipts, narrowly missing the initial target but still showing momentum.
Prior to this, in 2023 a parliamentary budget committee report showed approximately Kshs 26.8 bn collected in the first six months of implementation, signaling steady monthly inflows. In the first year of enforcement, the levy generated about Kshs 88.7bn, underlining aggressive mobilization during rollout.
The performance exceeding targets reflects improved compliance by formal employers and employees, stronger enforcement by KRA, and institutionalization of remittance systems. However, there are concerns around coverage gaps, notably in capturing informal sector incomes, which comprise a large share of the Kenyan workforce.
-
Utilization of Levy Funds
While the mobile collections figures suggest financial strength, actual utilization remains slow. As of mid-2025, nearly half of the levy proceeds, over KShs 30.0 bn, remained unspent and were instead invested in Treasury bills to preserve value and earn interest pending deployment into housing projects. These investments have yielded returns; for example, interest earnings from T-bills surpassed Kshs 2.0 bn, which the government plans to channel back into the housing program. Prior analysis indicated that only about 52.8% of Kshs 88.7 bn collected was utilized in housing activities, with the remainder unabsorbed due to implementation delays.
Moreover, earlier budget oversight reports revealed low budget absorption rates. For instance, in one review period, only about 30.8% of the planned housing levy expenditures were executed, hinting at planning and procurement bottlenecks. High levels of unutilized funds point to a mismatch between revenue flow and project absorption capacity. Construction timelines, procurement procedures, and phased rollouts mean cash accumulates faster than it is spent, resulting in significant portions parked in short-term government securities.
-
Analytical insights on funding model efficiency
The levy provides a predictable and expanding revenue source, especially as compliance increases. Ring-fencing under law reduces risk of fund diversion and protects housing investments. Investing idle cash in Treasury instruments preserves value and generates returns.
The performance of the fund however is being affected by challenges such as:
-
Implementation lag: project rollout and procurement slow fund deployment, weakening impact,
-
Coverage limitations: informal sector contributions remain hard to enforce, leaving a large contributor base untapped.
-
Utilization bottlenecks: spending rates lag relative to collection, risking public perception of underachievement.
The levy has emerged as a cornerstone funding model, mobilizing tens of billions annually. However, its effectiveness hinges on aligning collection flows with project execution capacity and expanding mechanisms to efficiently channel funds into housing construction and supporting infrastructure.
Section II: Key Developments under the Program
-
Regulatory Reform for Broader Access
In August 2025, Kenya’s National Assembly approved major changes to the Affordable Housing regulations to expand access to the program. Key reforms included cutting required deposits for affordable units to 5% and clarifying eligibility criteria. The changes also opened the program to rural housing loans and strengthened the home savings platform, signaling policy efforts to lower barriers for low and middle-income buyers.
-
Scaling Up Nationwide Construction Progress
The Ministry announced plans to complete 500,000 affordable housing units by December 2026, with approximately 320,000 units already completed across counties by end of 2025. The ministry noted that Kenya was on track to deliver approx. 200,000 housing units in the 2025 cycle, with almost all 47 counties having projects underway or nearing completion, indicating expanded geographic deployment.
These shifts reflect stronger emphasis on national rollout scale-up and meeting revised annual production goals as part of the Bottom-Up Economic Transformation Agenda (BETA) projections for 250,000 units per year to reach broader supply goals.
-
Flagship Site Delivery and Specialized Projects
The government commenced construction of 4,096 affordable units in Starehe, Nairobi, incorporating affordable, market-rate, and social housing categories accessible through digital platforms like Boma Yangu. Under the Affordable Housing Program, plans were also unveiled to build dedicated homes for police officers and students, beginning with 100 units at a police training facility, expanding public sector housing targets. These site-specific developments demonstrate an expanding scope beyond general residential builds to institutional and social housing categories. The below table shows the current affordable housing projects in pipeline
|
Cytonn Report: Affordable Housing Projects in Pipeline, 2026 |
|||
|
# |
Name of the Affordable Housing Project |
Number of Units |
|
|
1 |
Pioneer Affordable Housing Project |
2,105 |
|
|
2 |
Kidiwa Affordable Housing Project |
1,976 |
|
|
3 |
Kapsuswa Affordable Housing |
220 |
|
|
4 |
Nanyuki Affordable Housing Project |
200 |
|
|
5 |
Timau Affordable Housing project |
279 |
|
|
6 |
Makenji Affordable Housing Project |
220 |
|
|
7 |
Talai Affordable Housing Project |
400 |
|
|
8 |
Nyaribari Masaba Affordable Housing Project |
240 |
|
|
10 |
Alego Usonga Affordable Housing Project-Siaya |
882 |
|
|
11 |
Embu Affordable Housing project |
100 |
|
|
11 |
Lumumba Affordable Housing Project |
2,348 |
|
|
12 |
Makasembo Affordable Housing Project |
1,870 |
|
|
13 |
Kakamega Affordable Housing Project |
2,100 |
|
|
14 |
Jogoo Road Affrodable Housing Project |
2,760 |
|
|
15 |
Stoni-Athi Affordable Housing Project |
10,500 |
|
|
16 |
Mokowe Affordable Housing |
496 |
|
|
17 |
Starehe affordable Housing |
4,096 |
|
|
Total Units |
30,792 |
||
Source: Boma Yangu and Cytonn Research
Key milestones within the period under review include:
-
The National Treasury disclosed that KMRC’s interventions have helped lift cumulative mortgage lending to Kshs 21.4 bn as at August 2025 and that more than 4,500 affordable home loans were disbursed across 39 counties under its refinancing programme. These loans have an average interest rate of 10.0%, made possible by KMRC’s provision of long-term funding to primary mortgage lenders (PMLs) at approximately 5.0%, which in turn helps reduce borrowing costs for homebuyers. For more information, please see our Cytonn Weekly #52/2025,
-
The State Department of Housing and Urban Development reported that the State missed its affordable housing buyer registration and delivery targets, with 292,326 Kenyans registered on the Boma Yangu platform by June 2025, 41.5% below the government’s initial expectations of onboarding over 500,000 buyers. Official disclosures show that only 292,326 people registered by end-June, while just 2,075 housing units had been completed under the Affordable Housing Programme (AHP) between July 2022 and June 2025, significantly undershooting target of 250,000 units annually signifying 0.8% achievement of the target. The State attributes the slow progress to court cases, delays in passing housing regulations, and the lack of a legal framework to support Housing Levy collections, which constrained funding and construction momentum, despite Kshs 81.4 bn already spent on the programme and a long-term budget of Kshs 627.0 bn up to 2032. For more information, please see our Cytonn Weekly #51/2025,
-
Private Sector Engagement and Financing Calls
A major theme late 2025 was the persistent financing gap, with government officials highlighting an annual shortfall of about Kshs 326.0 bn relative to the estimated Kshs 400.0 bn needed to deliver 250,000 units yearly. To address this, the Cabinet Secretary called on the private sector, banks, SACCOs, pension schemes, and development partners to help bridge financing shortfalls, especially through co-investment and innovative mortgage products.
This marks a strategic shift toward public-private partnership scaling and capital market mobilization as housing levy receipts alone are insufficient for targets.
-
Completions and Handovers
Since 2025, the following affordable housing units were handed over in Kenya between 2025 and 2026:
-
New Boma Yangu Mukuru Affordable Housing Estate (Nairobi)- 4,500 homes handed over in December 2025 to beneficiaries.
-
Machakos Town Affordable Housing Phase 1 (Machakos County)- 176 units handed over to owners in November 2025.
-
Mukuru Kwa Njenga Affordable Housing Project (Nairobi) - Phase 1- 1,080 units were handed over in May 2025.
The table below shows all completed Affordable Housing Projects and Uptake since 2025.
|
Cytonn Report: Completed Affordable housing projects in 2025 |
|||||
|
Project Name |
Location |
Units Completed |
Month & Year Handed Over |
Units Sold / Occupied |
Uptake Rate |
|
Mukuru Affordable Housing Phase 1 |
Nairobi (Mukuru Kwa Njenga) |
1,080 |
May-25 |
1,080 |
100% |
|
New Mukuru Estate (Boma Yangu Mukuru) |
Nairobi |
4,500 |
Dec-25 |
4,500 |
100% |
|
Bondeni Affordable Housing Estate |
Nakuru |
605 |
Jan- 25 |
480 |
80% |
|
Homa Bay Affordable Housing Estate |
Homa Bay |
110 |
Jan-25 |
110 |
100% |
|
Machakos Town Phase 1 |
Machakos |
220 |
Nov-25 |
220 |
100% |
|
Total |
|
6,515 |
|
6,390 |
98% |
Source: Boma Yangu and Cytonn Research
-
Registration Milestone on Boma Yangu
Registrations on the government’s Boma Yangu housing platform stood at 1.1 mn users as of early February 2026 as compared to 500,000 users as of February 2025, a significant milestone in Kenya’s Affordable Housing Programme (AHP). This means over one million Kenyans have actively signed up to register interest, save toward, and eventually acquire affordable homes through the official portal. The surge can be attributable to growing public confidence in government housing delivery, expanded access & digital accessibility, persistent urban housing demand & affordability gaps, and project delivery signals & milestones.
Section III: Challenges and Gaps in the Program
-
Slow Execution and Persistent Delivery Delays: The most glaring challenge is the lag between funds collected and units delivered. While the levy has mobilized over Kshs 170 bn cumulatively and monthly inflows exceed Kshs 6 bn, on-ground completions remain modest. For instance, large projects like Mukuru Phase II and Kikuyu Estate have reached handover stages in early 2026, but many others are stuck at foundation or superstructure levels. Delays stem from procurement bottlenecks, contractor performance issues, and incomplete essential fittings. For instance, the launch of the Mukuru affordable housing project was deferred from an initial target of March 2025 to May 2025 due to technical delays, including the installation of lifts. This creates a "pipeline illusion" where units appear "under construction" but progress stalls, eroding public trust,
-
Unspent Funds and Absorption Gaps: A significant portion of levy collections has remained idle or parked in short-term Treasury bills (nearly half of FY’2024/25 funds as of late 2025). This opportunity cost (funds earning minimal interest instead of generating economic multipliers through jobs and supply-chain activity) remains a core inefficiency,
-
Infrastructure and Site-Readiness Deficiencies: Many project sites suffer from inadequate last-mile infrastructure (internal roads, water reticulation, sewerage, electricity distribution, and drainage). Developers or the government often bear these extra costs, inflating budgets and causing overruns. A notable example is the Buxton Point Apartment project incurring a Kshs 450.0 mn loss in under a year due to soft ground requiring foundation strengthening and the need to install water/sewer systems that counties failed to provide,
-
Land Acquisition, Titling, and Displacement Issues: Compulsory land acquisition delays, exacerbated by the paralysis at the National Land Commission (due to commissioner vacancies in early 2026), threaten nationwide rollout. Contested land evictions without adequate compensation or consultation, and displacement (e.g., church demolitions in Murang’a affecting 700 worshippers) generate local opposition and legal risks. Some developments have faced community resistance over siting or lack of stakeholder engagement.
-
Affordability and Off-Take Barriers: Even with registrations booming, actual purchases lag due to high entry barriers. There is a required deposit of 12.5% under the Tenant Purchase Scheme. For a typical Kshs 2.5 mn 1-bedroom unit, this translates to an upfront deposit of Kshs 312,500. Deposit assistance schemes exist for those earning below Kshs 20,000, but uptake is limited due to strict eligibility and processing delays. The subsidized 7% interest rate over 25 years is attractive compared to market mortgage rates (currently 12 to 16% for conventional loans). However, even at 7%, monthly repayments on a Kshs 2.5 mn unit average Kshs 17,700. For a Kshs 4 mn 2-bedroom unit, repayments easily exceed Kshs 28,200 per month. Using the United Nations’ widely accepted 30% housing expense rule (housing costs should not exceed 30% of gross monthly income) informal sector workers have a median monthly income below Kshs 25,000. The maximum affordable housing payment is only Kshs 7,500 per month. This means even the smallest studio or one-bedroom units (priced from Kshs 1.2–2.5 mn) are out of reach for the majority of the target low-income group without heavy subsidies or additional support. Formal sector workers earning Kshs 50,000 to 80,000 (lower middle class) can just about manage the payments. The result is a crowding-out effect: middle-income applicants dominate demand for the more spacious 2 and 3-bedroom units, while smaller, genuinely social-housing units (studios and 1bedroom) see lower uptake. Mortgage access remains constrained by high interest rates and creditworthiness issues. The off-take challenge is no longer about demand; it is fundamentally about purchasing power in an economy where cost-of-living pressures and statutory deductions continue to squeeze disposable incomes,
Section IV: Recommendations
To maintain the quality of building projects, the government should strengthen builder accountability by including warranties that require developers to address structural or quality-related issues within a specific period after handover. Additionally, the government can establish a maintenance fund, where a small percentage of the purchase price or rent is allocated to cover repairs and upkeep post-handover.
To improve the uptake of houses under the project, the government should launch targeted marketing and awareness campaigns to educate the public on the availability, pricing, and benefits of the housing units. These campaigns should emphasize how the program aligns with their housing needs and highlight all the advantages of purchasing houses through the program. Additionally, the government should invest in essential infrastructure, such as roads, schools, healthcare facilities, and public transport near housing projects, to enhance their appeal to potential buyers.
A comprehensive pipeline of housing projects should be developed, outlining projects for both the short-term (1–2 years) and long-term (3–5 years). The pipeline should include detailed project plans, timelines, budgets, and expected outcomes, with each project in the pipeline having clear milestones and objectives. This structured approach will help prevent delays and allow for continuous project execution, ensuring that funds are regularly absorbed.
A well-developed plan is necessary in order to improve absorption of the housing fund; plan must include a robust monitoring and evaluation framework to track the progress of each project in the pipeline. Regular assessments will allow the government to identify challenges early on, make necessary adjustments, and ensure that the funds are being spent effectively. Feedback updates should be established to revise project plans based on real-time data and outcomes.
Section V: Conclusion
The Kenya Kwanza government has made significant progress towards providing affordable housing in the country, particularly over the past two years. This progress has been catalyzed by the introduction of the Housing Levy under the Affordable Housing Act of 2024, which has provided a substantial boost to the government’s ambitious goal of delivering 250,000 housing units annually. This move aligns with the government’s broader agenda to address the growing housing deficit and make homeownership more accessible to Kenyans.
However, despite these positive strides, there remains considerable room for improvement, especially in the efficient implementation and management of the program. The private sector plays a pivotal role in the provision of housing in the country, and as such, attracting more private developers into the program is crucial. The government’s incentives for developers are an essential aspect of this effort, but they need to be continuously evaluated and enhanced to make the program more appealing to private investors because it will assist in covering the overall housing deficit.
Disclaimer: The views expressed in this publication are those of the writers where particulars are not warranted. This publication, which is in compliance with Section 2 of the Capital Markets Authority Act Cap 485A, is meant for general information only and is not a warranty, representation, advice or solicitation of any nature. Readers are advised in all circumstances to seek the advice of a registered investment advisor.

- Talk to us
- Kenya
- P.O Box 20695 - 00200, Nairobi, Kenya
- Cell +254709101200
- Tel +254709101200
- WhatsApp +254741676635
- United States
- +254709101200
- DOWNLOAD OUR APP
-


- Kenya
- 8th Floor, Pinetree Plaza, Kaburu Drive, Ngong Road, Nairobi, Kenya
- USA
- Suite 1150, 1775 Eye Street NW, USA, Washington DC 20006, USA
- Investments
- High Yield
- Private Equity
- Real Estate
- Real Estate
- RiverRun Estates
- Cytonn Towers
- The Ridge
- Taraji Heights
- The Alma