Real Estate Investment Trusts (REITs) Performance in Kenya, & Cytonn Weekly #14/2022
By Cytonn Research, Apr 10, 2022
Executive Summary
Fixed Income
During the week, T-bills remained undersubscribed, with the overall subscription rate coming in at 60.4%, up from the 29.7% recorded last week, partly attributable to the tightened liquidity in the market, with the average interbank rate coming in at 4.8%, from 4.6% recorded the previous week. The 364-day paper recorded the highest subscription rate, receiving bids worth Kshs 8.2 bn against the offered Kshs 10.0 bn, translating to a subscription rate of 81.7%, an increase from the 24.7% recorded the previous week. The higher preference for the 364-day paper is attributable to its higher yield of 9.7% compared to the 7.4% and 8.1% yields offered by the 91-day and 182-day papers, respectively. The subscription rate for the 91-day and 182-day papers increased to 59.6% and 39.3%, respectively, from 38.1% and 31.3%, recorded the previous week. In the Primary Bond Market, the government released the auction results for the recently issued three-year treasury bond, FXD1/2022/03, which recorded an undersubscription of 85.1%, receiving bids worth Kshs 34.0 bn out of the Kshs 40.0 bn on offer. The weighted average Interest rate of the accepted bids was 11.8%;
During the week, Cabinet Secretary for the National Treasury tabled the FY’2022/2023 Budget Statement before parliament indicating that the total budget for FY’2022/23 will increase by 4.1% to Kshs 3.3 tn from the Kshs 3.2 tn in FY’2021/2022. Additionally, Stanbic Bank released its monthly Purchasing Manager’s Index (PMI) highlighting that the index for the month of March 2022 declined to 50.5 from 52.9 recorded in February 2022 pointing towards slower growth in the Kenyan private sector;
Equities
During the week, the equities market was on an upward trajectory, with NASI gaining by 0.8%, while NSE 20 and NSE 25 both gained by 0.4%, taking their YTD performance to losses of 5.9%, 3.3% and 5.1% for NASI, NSE 20 and NSE 25, respectively. The equities market performance was driven by gains recorded by large cap stocks such as NCBA Group, Safaricom and ABSA of 3.7%, 1.4% and 1.2%, respectively. The gains were however weighed down by losses recorded by other large cap stocks such as Bamburi, Diamond Trust Bank (DTB-K) and KCB Group of 4.9%, 3.8% and 2.3%, respectively;
Also during the week, Britam Holdings (the parent company), and Britam Life Assurance (subsidiary), jointly announced that the two firms are in the final stages of executing the sale agreement to sell their combined stake of 6.7% in Equity Group Holdings to the International Finance Corporation (IFC) and the IFC Financial Institutions Growth (FIG) Fund, and expect to finalize the transactions by 29th April 2022. Additionally during the week, the Insurance Regulatory Authority (IRA), announced the placing of Resolution Insurance under statutory management, following continued challenges by the insurer to meet its obligations such as settling claims to claimants, policyholders and other creditors, coupled with failure to mitigating inherent risks. The regulator appointed the Policyholders Compensation Fund as the statutory manager of Resolution Insurance Company for a period of 12 months, commencing 5th April 2022, the date at which all existing policies ceased to exist;
Real Estate
In the proposed FY’2022/23 Budget Statement, infrastructure, housing and tourism sectors were allocated Kshs 212.5 bn, Kshs 27.7 bn and Kshs 15.8 bn, respectively, representing 6.4%, 0.8% and 0.4% of the Kshs 3.3 tn total budget, respectively. In the commercial office sector, Jubilee Holdings, an international insurance company, purchased Coca-Cola East Africa’s former head office located in Upper Hill, Nairobi, at a cost of Kshs 1.1 bn. In the retail sector, Eat’N’Go Limited, an international fast food chain, opened a new outlet in Westlands Square, bringing its total operating outlets in Nairobi to 9. Eat’N’Go Limited is the master franchisee for the Domino’s Pizza, Cold Stone Creamery, and Pinkberry Gourmet Frozen Yoghurt. In the hospitality sector, French’s Fairmont Norfolk Hotel located in Nairobi’s Central Business District (CBD), resumed operations after having been shut down for nearly two years. In the infrastructure sector, the Kenya Urban Roads Authority (KURA) announced that it was seeking Kshs 1.0 bn from an undisclosed party to complete the upgrade of roads in Nairobi’s informal settlement areas. For the listed Real Estate, ILAM Fahari I-Reit closed the week trading at an average price of Kshs 6.5 per share, up 10.2% from Kshs 5.9 recorded in the previous week;
Focus of the Week
Real Estate Investment Trusts (REITs) are regulated collective investment vehicles which invest in Real Estate, where investors pool their funds and invest in a trust with the intention of earning profits or income from real estate, as beneficiaries of the trust. REITs promoters’ source funds to build or acquire Real Estate assets, which they sell or rent to generate income. In 2013, Kenya became the third African country to establish REITS as an investments vehicle after Ghana and Nigeria who launched their REIT frameworks in 1994 and 2007, respectively. The fourth African country to establish REITs was South Africa South in 2013, and after Kenya. We have recently seen significant transactions done by foreign REITS. First was the GRIT Real Estate Income Group 20.0% acquisition of Kshs 5.5 bn residential houses established by Gateway Real Estate Africa in Rosslyn, and, second was the purchase of Orbit Products manufacturing facilities for Kshs. 6.1 billion in March 2021 by Grit Real Estate Income Group. These two transactions done by a foreign REIT triggered us to review the status of the local Real Estate Investment Trust market. In the Nairobi stock Exchange (NSE) there are currently three REITs namely the ILAM Fahari I-REIT which started trading in November 2015, and, the Acorn Student Accommodation I-REIT and D-REIT launched in February 2021. This week, we focus in the performance of REITs in Kenya over the past few years highlight key challenges faced by REITs investors as well as our suggested solutions;
Investment Updates:
- Weekly Rates:
- Cytonn Money Market Fund closed the week at a yield of 10.51%. To invest, dial *809#;
- Cytonn High Yield Fund closed the week at a yield of 14.07% p.a. To invest, email us at sales@cytonn.com and to withdraw the interest, dial *809#;
- Kevin Karobia, an Assistant Investments Analyst, moderated a panel on Twitter Spaces to discuss Kenya’s rising cost of living. Listen to the conversation here,
- We continue to offer Wealth Management Training every Thursday and every third Saturday of the month, from 9:00 am to 11:00 am, through our Cytonn Foundation. The training aims to grow financial literacy among the general public. To register for any of our Wealth Management Trainings, click here;
- If interested in our Private Wealth Management Training for your employees or investment group, please get in touch with us through wmt@cytonn.com;
- Any CHYS and CPN investors still looking to convert through assignment of debt are welcome to consider one of the five projects currently available for assignment, click here for the latest term sheet;
- Cytonn Insurance Agency acts as an intermediary for those looking to secure their assets and loved ones’ future through insurance namely; Motor, Medical, Life, Property, WIBA, Credit and Fire and Burglary insurance covers. For assistance, get in touch with us through insuranceagency@cytonn.com;
- Cytonnaire Savings and Credit Co-operative Society Limited (SACCO) provides a savings and investments avenue to help you in your financial planning journey. To enjoy competitive investment returns, kindly get in touch with us through clientservices@cytonn.com;
Real Estate Updates:
- For an exclusive tour of Cytonn’s real estate developments, visit: Sharp Investor's Tour, and for more information, email us at sales@cytonn.com;
- Phase 3 of The Alma is now ready for occupation. To rent please email properties@cytonn.com;
- We have 8 investment-ready projects, offering attractive development and buyer targeted returns; See further details here: Summary of Investment-ready Projects;
- For recent news about the group, see our news section here;
Hospitality Updates:We currently have promotions for Staycations. Visit cysuites.com/offers for details or email us at sales@cysuites.com;
Money Markets, T-Bills & T-Bonds Primary Auction:
During the week, T-bills remained undersubscribed, with the overall subscription rate coming in at 60.4%, up from the 29.7% recorded last week, partly attributable to the tightened liquidity in the market, with the average interbank rate coming in at 4.8%, from 4.6% recorded the previous week. The 364-day paper recorded the highest subscription rate, receiving bids worth Kshs 8.2 bn against the offered Kshs 10.0 bn, translating to a subscription rate of 81.7%, an increase from the 24.7% recorded the previous week. The higher preference for the 364-day paper is attributable to its higher yield of 9.7% compared to the 7.4% and 8.1% yields offered by the 91-day and 182-day papers, respectively. The subscription rate for the 91-day and 182-day papers increased to 59.6% and 39.3%, respectively, from 38.1% and 31.3%, recorded the previous week. The yields on the government papers recorded mixed performance with yields on the 91-day and 182-day papers increasing by 7.5 bps and 5.5 bps, to 7.4% and 8.2%, respectively while the yield on the 364-day paper declined by 0.9 bps to 9.7%. The government accepted bids worth Kshs 14.4 bn, out of the Kshs 14.5 bn worth of bids received, translating to an acceptance rate of 99.6%, reflecting the government’s debt appetite.
In the Primary Bond Market, the government released the auction results for the recently issued three-year treasury bond, FXD1/2022/03, which recorded an undersubscription of 85.1%, partly attributable to the tightened liquidity in the money markets. The government sought to raise Kshs 40.0 bn for budgetary support, received bids worth Kshs 34.0 bn and accepted bids worth Kshs 33.1 bn, translating to a 97.3% acceptance rate. The bond had a coupon rate and a market weighted average rate of 11.8%. For the month of April, the Government had opened one other bond, namely; FXD1/2022/15, whose period of sale will end on 19th April 2022 and we expect investors to prefer this longer dated bond in search of higher yields on a risk-adjusted basis. Bonds of a similar tenor to maturity are currently trading at yields in the range of 13.1%-13.6%.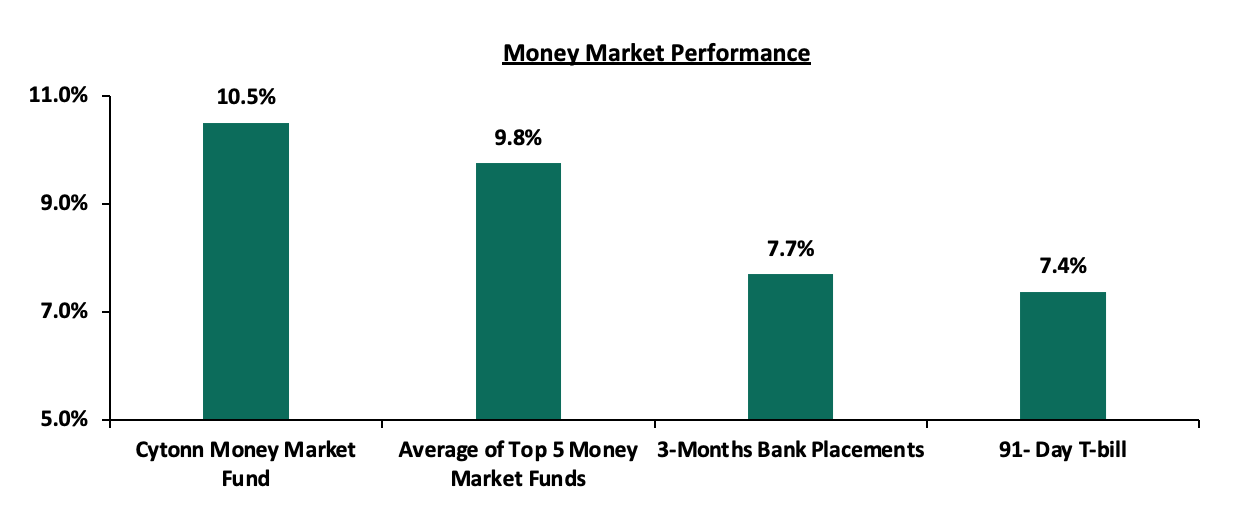
In the money markets, 3-month bank placements ended the week at 7.7% (based on what we have been offered by various banks), while the yield on the 91-day T-bill increased by 7.5 bps to 7.4%. The average yield of the Top 5 Money Market Funds declined marginally by 0.1% points to 9.8%, from 9.9% recorded the previous week while the yield on the Cytonn Money Market Fund remained relatively unchanged at 10.5%, as recorded the previous week.
The table below shows the Money Market Fund Yields for Kenyan Fund Managers as published on 8th April 2022:
|
Money Market Fund Yield for Fund Managers as published on 8th April 2022 |
||
|
Rank |
Fund Manager |
Effective Annual Rate |
|
1 |
Cytonn Money Market Fund |
10.5% |
|
2 |
Zimele Money Market Fund |
9.9% |
|
3 |
Nabo Africa Money Market Fund |
9.8% |
|
4 |
Sanlam Money Market Fund |
9.3% |
|
5 |
Apollo Money Market Fund |
9.3% |
|
6 |
Dry Associates Money Market Fund |
9.2% |
|
7 |
CIC Money Market Fund |
9.0% |
|
8 |
Madison Money Market Fund |
8.9% |
|
9 |
GenCap Hela Imara Money Market Fund |
8.6% |
|
10 |
Co-op Money Market Fund |
8.5% |
|
11 |
Orient Kasha Money Market Fund |
8.4% |
|
12 |
NCBA Money Market Fund |
8.4% |
|
13 |
ICEA Lion Money Market Fund |
8.3% |
|
14 |
British-American Money Market Fund |
8.0% |
|
15 |
AA Kenya Shillings Fund |
7.9% |
|
16 |
Old Mutual Money Market Fund |
7.7% |
Source: Business Daily
Liquidity:
During the week, liquidity in the money markets tightened, with the average interbank rate increasing to 4.8%, from 4.6%, recorded the previous week, partly attributable to government payments which offset tax remittances. The average interbank volumes traded increased by 99.8% to Kshs 28.7 bn, from Kshs 14.4 bn recorded the previous week.
Kenya Eurobonds:
During the week, the yields on Kenyan Eurobonds were on an upward trajectory, partly attributable to investors attaching higher risk premium on the country due to increasing inflationary pressures, local currency depreciation and risks abound the August 2022 elections. Yields on the 10-year bond issued in 2014, 10-year and 30-year bonds issued in 2018, 12-year bond issued in 2019 and the 12-year bond issued in 2021 all increased by 0.3% points to 7.0%, 8.3%, 9.7%, 8.8% and 8.6%, respectively. Similarly, yields on the 7-year bond issued in 2019 increased by 0.2% points to 8.3%. Below is a summary of the performance:
|
Kenya Eurobond Performance |
||||||
|
2014 |
2018 |
2019 |
2021 |
|||
|
Date |
10-year issue |
10-year issue |
30-year issue |
7-year issue |
12-year issue |
12-year issue |
|
3-Jan-22 |
4.4% |
8.1% |
8.1% |
5.6% |
6.7% |
6.6% |
|
1-April-22 |
6.7% |
8.1% |
9.4% |
8.1% |
8.5% |
8.3% |
|
4-April-22 |
6.7% |
8.1% |
9.4% |
8.1% |
8.6% |
8.3% |
|
5-April-22 |
6.7% |
8.0% |
9.4% |
8.1% |
8.6% |
8.3% |
|
6-April-22 |
6.9% |
8.3% |
9.5% |
8.4% |
8.7% |
8.6% |
|
7-April-22 |
7.0% |
8.3% |
9.7% |
8.3% |
8.8% |
8.6% |
|
Weekly Change |
0.3% |
0.2% |
0.3% |
0.2% |
0.3% |
0.3% |
|
MTD Change |
0.3% |
0.2% |
0.3% |
0.2% |
0.3% |
0.3% |
|
YTD Change |
2.6% |
0.2% |
1.6% |
2.7% |
2.1% |
2.0% |
Source: CBK
Kenya Shilling:
During the week, the Kenyan shilling depreciated by 0.3% against the US dollar, to close the week at Kshs 115.3, from Kshs 115.0 recorded the previous week, partly attributable to increased dollar demand from the oil and energy sectors. Key to note, this is the lowest the Kenyan shilling has ever depreciated against the dollar. On a year to date basis, the shilling has depreciated by 1.9% against the dollar, in comparison to the 3.6% depreciation recorded in 2021. We expect the shilling to remain under pressure in 2022 as a result of:
- Rising global crude oil prices on the back of supply constraints and geopolitical pressures at a time when demand is picking up with the easing of COVID-19 restrictions and as economies reopen. Key to note, risks abound the recovery following the emergence of the new COVID-19 variants,
- Increased demand from merchandise traders as they beef up their hard currency positions in anticipation for more trading partners reopening their economies globally,
- An ever present current account deficit due to an imbalance between imports and exports, with Kenya’s current account deficit estimated to come in at 5.6% of GDP in the 12 months to February 2022 compared to the 4.3% for a similar period in 2021. The wider deficit reflects a higher import bill, particularly for oil, which more than offset increased receipts from agricultural and services exports, and remittances, and,
- The aggressively growing government debt, with Kenya’s public debt having increased at a 10-year CAGR of 18.4% to Kshs 8.0 tn in December 2021, from Kshs 1.5 tn in December 2011 thus putting pressure on forex reserves to service some of the public debt.
The shilling is however expected to be supported by:
- High Forex reserves currently at USD 8.4 bn (equivalent to 5.0-months of import cover), which is above the statutory requirement of maintaining at least 4.0-months of import cover, and the EAC region’s convergence criteria of 4.5-months of import cover. In addition, the reserves were boosted by the USD 1.0 bn proceeds from the Eurobond issued in July 2021, USD 972.6 mn IMF disbursement, USD 130.0 mn World Bank loan financing received in June 2021, and, the USD 750.0 mn World Bank loan facility issued in March 2022, and,
- Improving diaspora remittances evidenced by a 23.5% y/y increase to USD 321.5 mn as of February 2022, from USD 260.3 mn recorded over the same period in 2021, which has continued to cushion the shilling against further depreciation.
Weekly Highlights:
- FY’2021/2022 Budget Statement
During the week, Cabinet Secretary for the National Treasury presented the FY’2022/2023 Budget Statement before parliament. The table below summarizes the key buckets and the projected changes:
|
Draft Budget Estimates FY'2022/23 (Kshs billions) |
|||
|
Item |
FY'2021/22 Approved Budget |
FY'2022/23 Estimates |
Change y/y (%) |
|
Total revenue |
2,038.6 |
2,447.0 |
20.0% |
|
Total grants |
62.0 |
33.3 |
(46.3%) |
|
Total revenue & grants |
2,100.6 |
2,480.3 |
18.1% |
|
Recurrent expenditure |
2,071.8 |
2,257.3 |
9.0% |
|
Development expenditure & Net Lending |
667.7 |
715.5 |
7.2% |
|
County Transfer & Contingencies |
414.9 |
370.0 |
(10.8%) |
|
Total expenditure |
3,154.4 |
3,342.8 |
6.0% |
|
Projected Deficit as % of GDP |
8.1% |
6.2% |
(1.9%) pts |
|
Net foreign borrowing |
334.0 |
280.7 |
(16.0%) |
|
Net domestic borrowing |
661.6 |
581.7 |
(12.1%) |
|
Total borrowing |
995.6 |
862.4 |
(13.4%) |
Source: Exchequer Feb 2022 issue and FY’2022/23 Budget Statement, National Treasury of Kenya
Some of the key take-outs include;
- The government projects total revenue for FY’2022/23 to increase by 20.0% to Kshs 2.4 tn from the Kshs 2.2 tn in FY’2021/2022. The increase is mainly due to a 25.4% increase in ordinary revenue to Kshs 2.1 tn from the Kshs 1.8 tn collected in FY’2021/22,
- Total expenditure is set to increase by 6.0% to Kshs 3.3 tn (equivalent to 23.9% of GDP), from Kshs 3.2 tn (equivalent to 25.0% of GDP) in the FY’2021/22 Budget,
- Recurrent expenditure is set to increase by 9.0% to Kshs 2.3 tn in FY’2022/23, from Kshs 2.1 tn in FY’2021/22 budget, while development expenditure is projected to increase by 7.2% to Kshs 715.5 bn in FY’2022/23, from Kshs 667.7 bn as per the FY’2021/22 budget,
- Public debt is expected to continue growing in FY’2022/23, as the approximate Kshs 862.5 bn fiscal deficit will be financed through domestic debt totaling Kshs 581.7 bn and foreign debt totaling Kshs 280.7 bn, and,
- The budget deficit is projected to decline to Kshs 862.4bn (6.2% of GDP) from the projected Kshs 995.6 bn (8.1% of GDP) in the FY’2021/22 budget, mainly as growth in revenues outpace growth in expenditure.
The FY'2022/2023 budget points to an expansionary budget which is meant to accelerate the economic recovery. In our view, however, there are still concerns on how the government will be able to meet its revenue collection targets given that the rising cost of living affecting commodities demand, erratic weather conditions affecting the Agriculture sector and uncertainties around the upcoming August elections. Additionally, despite the fiscal deficit being estimated to decline to 6.2% of GDP, debt sustainability remains a key concern as the debt to GDP ratio remains at 66.2%, significantly above the recommended IMF threshold of 50.0% and debt servicing expenditure to total revenue ratio increasing to 53.8% in FY’2022/23 from 52.4% in FY’2021/22. We shall be focusing on this fiscal year’s budget in detail in the coming weeks.
- Stanbic Bank’s March 2022 Purchasing Manager’s Index (PMI)
During the week, Stanbic Bank released its monthly Purchasing Manager’s Index (PMI) highlighting that the index for the month of March 2022 declined to 50.5 from 52.9 recorded in February 2022 pointing towards marginal improvement in the Kenyan private sector. The decline was partly attributable to rise in input costs and output charges which led to increased cost pressures on the consumers. Key to note, purchasing activity continued to increase despite the rise in prices as businesses sought to restock goods amid concerns that supply would worsen. Additionally, firms reported a slight increase in employment in March, as they worked to increase capacity and close new sales. The chart below summarizes the evolution of the PMI over the last 24 months: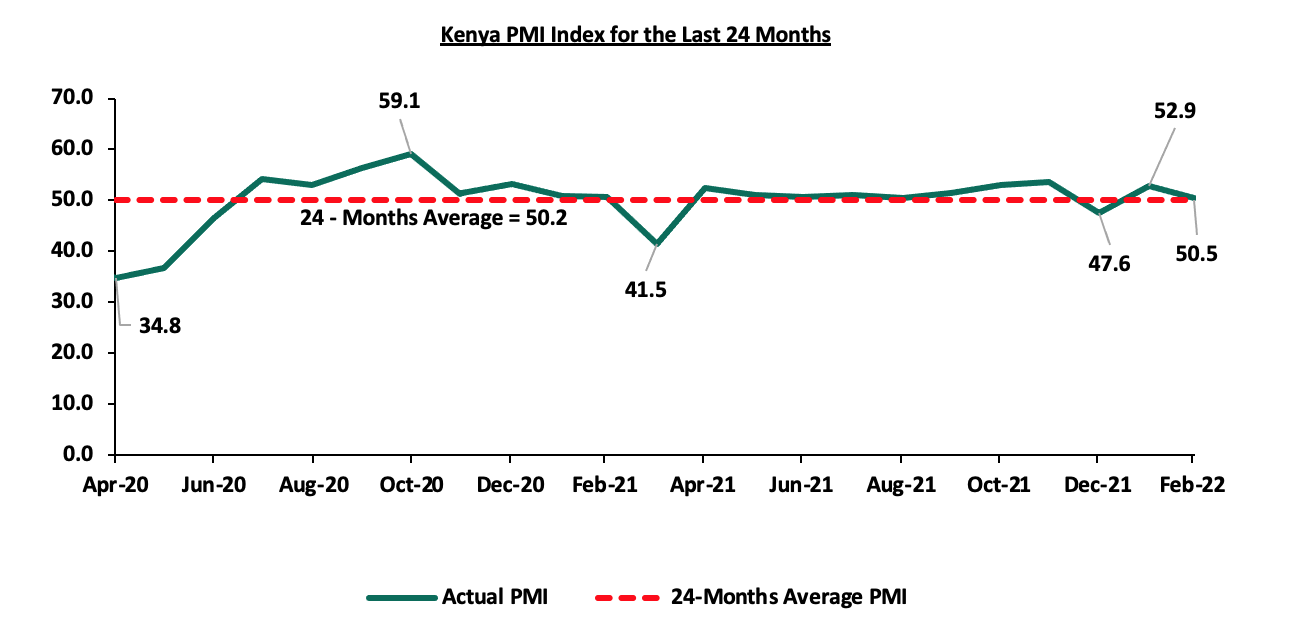
*** Key to note, a reading above 50.0 signals an improvement in business conditions, while readings below 50.0 indicate a deterioration.
Kenya’s general business environment has deteriorated in the first three months of 2022 with the average PMI coming in at 50.3, lower than the 51.6 that was recorded in a similar period in 2021. Going forward, we maintain a cautious outlook in the short-term owing to the continued rise in cost of fuel and production materials which has led to reduced consumer spending. With fuel being a major input cost to many businesses, we expect the increasing global fuel prices to further contribute to the deterioration of business conditions in the country. Additionally, we believe that the stabilization under the fuel subsidy program by the National Treasury is unsustainable given the continued rise in the average landed cost of fuel. Further, the uncertainties surrounding the upcoming August elections, are likely to have a negative effect on the business environment due to a possible cautious approach taken by business owners to reduce spending leading to a slowdown in manufacturing activities.
Rates in the Fixed Income market have remained stable due to the relatively ample liquidity in the money market. The government is 8.9% ahead of its prorated borrowing target of Kshs 521.7 bn having borrowed Kshs 568.0 bn of the Kshs 661.6 bn borrowing target for the FY’2021/2022. We expect a gradual economic recovery as evidenced by the revenue collections of Kshs 1.2 tn during the first eight months of the current fiscal year, which was equivalent to 100.8% of the prorated revenue collection target. However, despite the projected high budget deficit of 11.4% and the affirmation of the `B+’ rating with negative outlook by Fitch Ratings, we believe that the support from the IMF and World Bank will mean that the interest rate environment will remain stable since the government is not desperate for cash. Owing to this, our view is that investors should be biased towards short-term fixed-income securities to reduce duration risk.
Markets Performance
During the week, the equities market was on an upward trajectory, with NASI gaining by 0.8%, while NSE 20 and NSE 25 both gained by 0.4%, taking their YTD performance to losses of 5.9%, 3.3% and 5.1% for NASI, NSE 20 and NSE 25, respectively. The equities market performance was driven by gains recorded by large cap stocks such as NCBA Group, Safaricom and ABSA of 3.7%, 1.4% and 1.2%, respectively. The gains were however weighed down by losses recorded by other large cap stocks such as Bamburi, Diamond Trust Bank (DTB-K) and KCB of 4.9%, 3.8% and 2.3%, respectively.
During the week, equities turnover declined by 43.2% to USD 9.6 mn, from USD 17.0 mn recorded the previous week, taking the YTD turnover to USD 257.8 mn. Foreign investors remained net sellers, with a net selling position of USD 2.7 mn, from a net selling position of USD 3.0 mn recorded the previous week, taking the YTD net selling position to USD 17.4 mn.
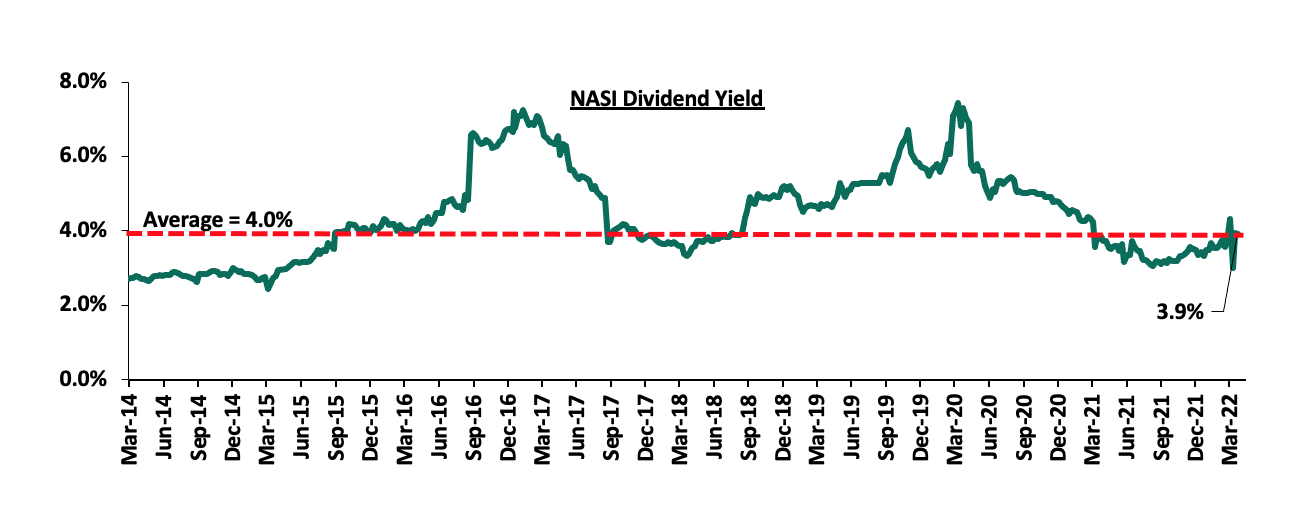
The market is currently trading at a price to earnings ratio (P/E) of 9.0x, 30.3% below the historical average of 12.9x, and a dividend yield of 3.9%, 0.1% points below the historical average of 4.0%. Key to note, NASI’s PEG ratio currently stands at 1.2x, an indication that the market is trading at a premium to its future earnings growth. A PEG ratio greater than 1.0x indicates the market may be overvalued while a PEG ratio less than 1.0x indicates that the market is undervalued. The current P/E valuation of 9.0x is 16.6% above the most recent trough valuation of 7.7x experienced in the first week of August 2020. The charts below indicate the historical P/E and dividend yields of the market: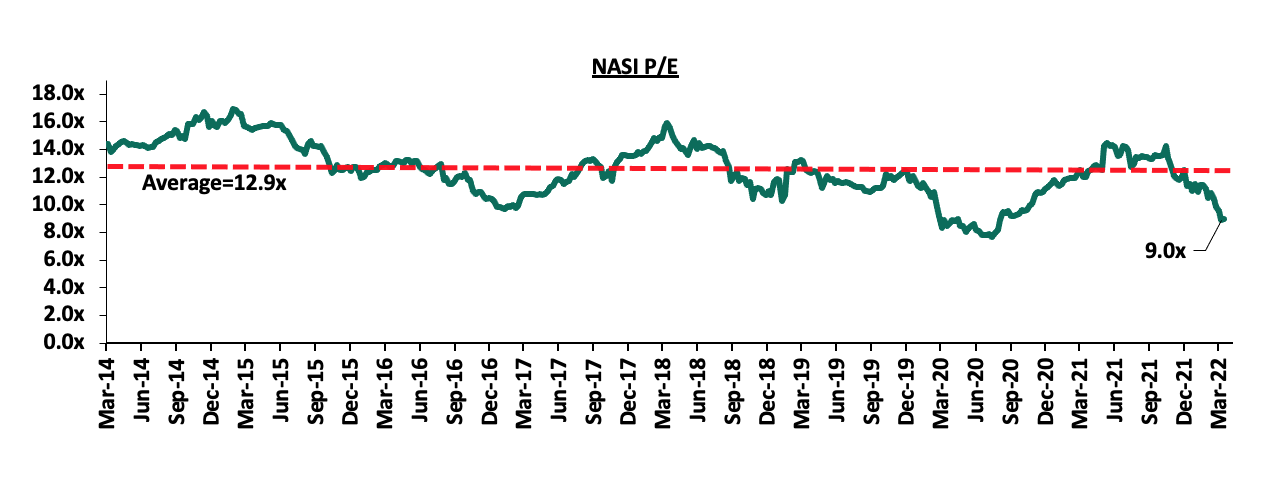
Weekly Highlights:
- Britam Holdings and Britam Life’s shares in Equity Group Holding sale
During the week, Britam Holdings (the parent company), and Britam Life Assurance (subsidiary), jointly announced that the two firms are in the final stages of executing the sale agreement to sell their stakes in Equity Group Holdings to the International Finance Corporation (IFC) and the IFC Financial Institutions Growth (FIG) Fund, and expect to finalize the transactions by 29th April 2022. Britam Holdings is seeking to sell 166,390,750 shares in EGH (110,901,488 shares to IFC and 55,489,262 shares to the IFC FIG Fund), constituting 4.4% of EGH’s issued shares, while Britam Life Assurance Company will be selling 86,719,611 shares (53,620,247 shares to IFC and 33,099,364 shares to the IFC FIG Fund), and constituting 2.3% of EGH’s issued capital. Below is a summary of the transaction:
|
Seller |
No. of Shares |
Percentage of Ownership |
Expected Amount to Britam and Britam Life (Kshs bn) |
Purchaser |
No. of Shares after the Sale |
Percentage of Ownership |
|
Britam Holdings |
166,390,750 |
4.4% |
9.2 |
IFC |
164,521,735 |
4.4% |
|
Britam Life Assurance |
86,719,611 |
2.3% |
4.7 |
IFC FIG Fund |
88,588,626 |
2.3% |
|
Total |
253,110,361 |
6.7% |
13.9 |
|
253,110,361 |
6.7% |
As highlighted in our Cytonn Weekly 1/2022, IFC and IFC FIG Fund are expected to acquire the shares at Kshs 55.0 per share, which represents a 11.6% premium on EGH’s current market price of Kshs 49.3 as at 8th April 2022. Britam Holdings is expected to receive Kshs 13.9 bn from the transaction. We expect that Kshs 3.3 bn of the sale proceeds will go towards paying the holding company’s bank loan facility, secured with quoted ordinary shares, Kshs 5.0 bn will likely go to plugging the loss in the Wealth Management LLP portfolio, with the balance of Kshs. 5.6 bn going to shoring up the holding company’s reserves. The sale, once approved by the necessary regulators, is expected to significantly improve the Group’s bottom-line in FY’2022, with the group earning a profit of Kshs 72.3 mn in FY’2021, up from a loss of Kshs 9.1 bn in FY’2020. The FY’2021 performance was mainly weighed down by an effective tax rate of 92.9%, attributable to provisions for investment losses of Kshs 5.2 bn in FY’2020, which were not tax allowable.
We anticipate that completion of the sale will allow Britam Holdings to concentrate on its core offering in its insurance business, which has remained unprofitable and also simplifying the business model by making it more transparent. Britam Holdings posted a combined ratio of 149.4% in the recently released FY’2021 results, with total expenses coming in at Kshs 38.9 bn, while net premiums totalled a lower Kshs 25.7 bn. We also expect the boosted capital and liquidity to enable Britam to return value to its shareholders, through paying dividends, with the group failing to pay dividends in the last two financial years.
- Resolution Insurance Placed Under Statutory Management
During the week, the Insurance Regulatory Authority (IRA), announced that Resolution Insurance Company had been placed under statutory management by the Commissioner of Insurance, following continued challenges by the insurer to meet its obligations such as settling claims to claimants, policyholders and other creditors, coupled with failure to mitigating inherent risks. The regulator appointed the Policyholders Compensation Fund (PCF) as the Statutory Manager of Resolution Insurance Company for a period of 12 months, commencing 5th April 2022, the date at which all existing policies ceased to exist.
The placing of Resolution Insurance under statutory management comes after the insurer announced the pausing of underwriting new or renewing non-medical business on 27th March 2022, as it continued to raise capital. Key to note, Resolution Insurance had entered into an agreement with Linkham Group, a UK-based global Insurance solutions firm to buy 100.0% of Resolution Insurance’s stake held by Leapfrog Investments, a private equity firm. However, the sale did not materialize leaving Resolution Insurance to source for alternative sources of capital injection. According to IRA’s Q4’2021 industry report, Resolution Insurance recorded a Profit after Tax (PAT) loss of Kshs 290.6 mn in FY’2021, a reversal from the Kshs 150.7 mn profit recorded in FY’2020 mainly attributable to a 28.7% increase in claims to Kshs 1.6 bn in FY’2021 from Kshs 1.2 bn in FY’2020 which outpaced the 5.1% increase in net premiums to Kshs 2.1 bn in FY’2021 from Kshs 2.0 bn in FY’2020. The loss recorded in FY’2021 took the insurer’s accumulated losses to Kshs 2.5 bn, depleting its equity reserves to a net of (Kshs 392.2 mn). The sustained losses have been driven by aggressive growth in claims as compared to premiums, which has seen Resolution insurance record higher than industry claims ratios. In FY’2021, Resolution Insurance recorded a claims ratio of 77.4% as compared to an industry average of 68.8%. The table below highlights Resolution Insurance key ratios and metrics over the last five years:
|
Resolution Insurance Financial Performance FY’2017 – FY’2021 |
||||||
|
Metric (Kshs bn) |
FY’2017 |
FY’2018 |
FY’2019 |
FY’2020 |
FY’2021 |
5-Year CAGR |
|
Net Premium Amount |
1.7 |
2.7 |
2.6 |
2.0 |
2.1 |
4.3% |
|
Claims Amount |
1.0 |
1.9 |
1.8 |
1.2 |
1.6 |
8.7% |
|
Expenses |
1.1 |
1.2 |
1.2 |
1.2 |
1.0 |
(1.1%) |
|
Profit / (Loss) After Tax |
(0.4) |
(0.4) |
(0.3) |
0.2 |
(0.3) |
(5.4%) |
|
Total Assets |
4.9 |
4.6 |
4.9 |
4.6 |
4.2 |
(3.0%) |
|
Total Liabilities |
5.2 |
4.8 |
5.3 |
4.9 |
4.6 |
(2.4%) |
|
Key Ratios |
|
|
|
|
|
|
|
Claims ratio |
62.8% |
72.0% |
69.8% |
63.3% |
77.4% |
- |
|
Expense ratio |
64.9% |
46.1% |
47.0% |
62.2% |
49.9% |
- |
|
Combined ratio |
127.7% |
118.1% |
116.8% |
125.5% |
127.3% |
- |
|
Overall Liquidity ratio |
94.3% |
96.1% |
91.9% |
94.4% |
91.4% |
- |
It is evident that core insurance business in Kenya remains largely unprofitable and firms need to re-valuate their strategies to prevent further collapse of insurance companies. In addition to the increasing claims, Resolution Insurance has struggled to meet the minimum capital adequacy ratios of 200% above the minimum capital of Kshs 600.0 mn for general insurance as recommended by the regulator, IRA. As of FY’2021, Resolution Insurance’s capital adequacy level stood at 186.2% above the minimum capital of Kshs 600.0 mn pointing towards insufficient capitalisation. Key to note, the statutory manager, PCF, can only compensate for claims, within the next 14 days, up to a maximum of Kshs 250,000 per policyholder, as provided for by law with claims. We also expect to see continued capital-raising activities especially by the smaller insurance and mergers in the sector as smaller firms try to reach the minimum levels set by the IRA as it implements the risk-based supervision through guidelines that require insurers to maintain the minimum specified capital adequacy ratios.
Cytonn Coverage:
|
Company |
Price as at 01/04/2022 |
Price as at 08/04/2022 |
w/w change |
YTD Change |
Year Open 2022 |
Target Price* |
Dividend Yield |
Upside/ Downside** |
P/TBv Multiple |
Recommendation |
|
Kenya Reinsurance |
2.2 |
2.2 |
1.4% |
(2.2%) |
2.3 |
3.2 |
4.5% |
46.4% |
0.2x |
Buy |
|
Jubilee Holdings |
274.8 |
273.5 |
(0.5%) |
(13.7%) |
316.8 |
381.7 |
5.1% |
44.7% |
0.5x |
Buy |
|
Liberty Holdings |
5.7 |
6.0 |
5.3% |
(15.0%) |
7.1 |
7.7 |
0.0% |
27.6% |
0.4x |
Buy |
|
Britam |
6.7 |
6.7 |
0.6% |
(11.1%) |
7.6 |
7.9 |
0.0% |
17.2% |
1.1x |
Accumulate |
|
Sanlam |
11.0 |
11.0 |
0.0% |
(4.8%) |
11.6 |
12.1 |
0.0% |
9.6% |
1.2x |
Hold |
|
CIC Group |
2.2 |
2.1 |
(5.0%) |
(3.2%) |
2.2 |
1.9 |
0.0% |
(10.3%) |
0.7x |
Sell |
|
*Target Price as per Cytonn Analyst estimates **Upside/ (Downside) is adjusted for Dividend Yield |
||||||||||
We are currently reviewing our target prices for the banking sector coverage ahead of our FY’2021 Banking Report.
We are “Neutral” on the Equities markets in the short term. With the market currently trading at a premium to its future growth (PEG Ratio at 1.2x), we believe that investors should reposition towards value stocks with strong earnings growth and that are trading at discounts to their intrinsic value. We expect the discovery of new COVID-19 variants, the upcoming Kenyan general elections and the slow vaccine rollout to continue weighing down the economic outlook. On the upside, we believe that the relaxation of COVID-19 containment measures in the country will lead to improved investor sentiments.
- Industry Report
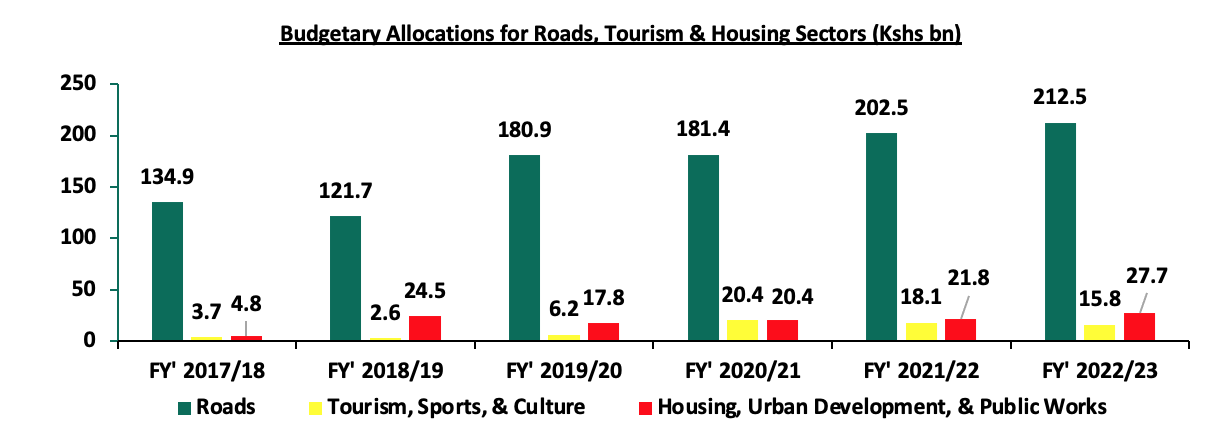
In the proposed FY’2022/23 Budget Statement there was an allocation of Kshs 256.0 bn for key themes in the Real Estate and related sectors as highlighted below;
- Infrastructure sector was allocated a total of Kshs 212.5 bn in the FY’2022/23 to support construction of roads and bridges as well as the rehabilitation and maintenance of roads, which is a 4.9% increase from Kshs 202.5 bn allocated in FY’2021/22,
- Housing, Urban Development and Public Works were allocated a total of Kshs 27.7 bn, a 27.1% increase from Kshs 21.8 bn in FY’2021/22, with Kenya Mortgage Refinance Company (KMRC) receiving Kshs 4.6 bn to enhance its lending capacity to primary mortgage lenders. Other key areas in the residential sector including construction of affordable housing units, urban housing units and Kenya Informal Settlement Improvement Phase II, received an allocation of Kshs 8.7 bn, Kshs 1.2 bn, and Kshs 5.9 bn, respectively, and,
- The tourism sector was allocated a total of Kshs 15.8 bn, with the Tourism Promotion Fund (TPF) receiving Kshs 1.8 bn, and Tourism Fund receiving Kshs 3.2 bn. The allocation to the tourism sector is a 12.7% decrease from the Kshs 18.1 bn allocated in FY’2021/22, due to the recovery of the sector amidst the reopening of the economy and easing of the COVID-19 pandemic containment measures, which in turn led to increased visitor arrivals into the country as well as improved operations in the hospitality sector.
The graph below shows comparison among road, tourism and housing budgetary allocations in the last six fiscal years;
Source: National Treasury of Kenya
With the increased budget allocations in the infrastructure and housing sectors, as well as the reopening of the economy boosting performance of the hospitality sector, we expect increased development activities in the aforementioned sectors, thus in turn boost the overall performance of the Kenyan Real Estate sector.
- Commercial Office Sector
During the week, Jubilee Holdings, an international insurance company, purchased Coca-Cola East Africa’s former head office located in Upper Hill, Nairobi, at a cost of Kshs 1.1 bn. The insurance firm is expected to begin its operations in the Grade A Commercial Office building totaling 116,350 SQFT and sitting on a 3.2 acre piece of land, in September 2022, upon completion of the renovations being done. Currently, the insurer’s offices are located at the Jubilee Insurance House along Wabera Street in Nairobi’s CBD, where they will lease out part of it, whilst also continue to house its agents and customer service operations. Additionally, Jubilee Holdings also has interest in purchasing other office buildings including; Nairobi’s IPS Building, Nation Centre, and Courtyard, among others, which in turn will increase its investment magnitude in the real estate market.
The decision by Jubilee to take up the office building in Upper Hill as its head office is driven by;
- The need to acquire better quality office spaces due to limited supply of Grade A offices in Nairobi’s CBD currently at 5.9%,
- Preference for Green Buildings thereby posing the Coca Cola East Africa Green building as a good match,
- Favorable prices with the building having been sold to the insurer at Kshs 1.1 bn, 45.0% lower than the original listing price of Kshs 2.0 bn in June 2019, and,
- Availability of funds with the insurer having realized a strong growth in its FY’2021 earnings, evidenced by a 67.0% net profit growth to Kshs 6.8 bn in the review period.
In terms of performance, according to the Cytonn Q1’2022 Markets Review, Upper Hill office spaces recorded relatively high selling prices at Kshs 12,409 per SQFT compared to the market average of Kshs 12,113 per SQFT. The insurer bought the 116,350 SQFT office building at Kshs 1.1 bn thereby realizing a Kshs 9,454 per SQFT buying price, which is 21.9% lower than Upper Hill’s average selling prices for office spaces. This signifies a good deal for the insurer, as it was able to leverage on the affordability of the office space as basis of purchasing the building. The table below shows summary of Nairobi Metropolitan Area commercial office sub market performance;
All Values in Ksh Unless Stated Otherwise
|
Nairobi Metropolitan Area Commercial Office Submarket Performance Q1’2022 |
||||
|
Area |
Price (Kshs) /SQFT Q1’2022 |
Rent Kshs/ SQFT Q1’2022 |
Occupancy (%) Q1’2022 |
Rental Yield (%) Q1’2022 |
|
Gigiri |
13,500 |
118 |
83.3% |
8.8% |
|
Westlands |
11,846 |
105 |
74.5% |
8.1% |
|
Karen |
13,325 |
107 |
82.8% |
7.8% |
|
Parklands |
11,562 |
91 |
82.8% |
7.7% |
|
Kilimani |
12,440 |
91 |
80.2% |
7.1% |
|
Upperhill |
12,409 |
94 |
76.1% |
6.9% |
|
Nairobi CBD |
11,863 |
82 |
83.8% |
6.9% |
|
Thika Road |
12,571 |
78 |
77.6% |
5.7% |
|
Mombasa Road |
11,250 |
73 |
64.6% |
5.1% |
|
Average |
12,113 |
94 |
77.9% |
7.3% |
Source; Cytonn Research
The commercial office sector continues to show signs of recovery evidenced by the various expansion activities witnessed in the sector, hence we expect this to continue driving performance of the sector. However, the existing oversupply of office spaces currently at 6.7 mn SQFT coupled with other firms still embracing the remote working strategy is expected to hinder the performance of the sector.
- Retail Sector
During the week, Eat’N’Go Limited, an international fast food chain, opened a new outlet in Westlands Square, Nairobi, bringing its total operating outlets in Nairobi to 9. This comes barely a week after the master franchisee for the Domino’s Pizza, Cold Stone Creamery, and Pinkberry Gourmet Frozen Yoghurt brands announced plans to open 100 new stores in Kenya. The retailer’s decision to open the new store in Westlands was driven by;
- Strategic location of the shopping mall along Waiyaki way thus promoting accessibility,
- Stiff market competition from close rivals such as Galitos and Pizza Inn,
- Positive demographics, evidenced by Kenya’s high urbanization and growth rates currently at 4.0% and 2.3%, respectively, compared to the world’s 1.8% and 1.0%, respectively, according to the World Bank and,
- Nairobi’s recognition as a regional hub hence attracting foreign investments.
In terms of performance, Cytonn Q1’2022 Markets Review report highlights that Westlands recorded average rental yields of 9.5%, 1.6% points higher than the market average of 7.9% in the period under review, hence the retailer is leveraging on the remarkable performance of the area as basis of investments.
|
Nairobi Metropolitan Area Retail Market Performance Q1’2022 |
|||
|
Area |
Rent Kshs/ SQFT Q1’2022 |
Occupancy (%) Q1’2022 |
Rental Yield (%) Q1’2022 |
|
Karen |
200 |
85.0% |
10.0% |
|
Kilimani |
183 |
86.8% |
9.9% |
|
Westlands |
214 |
72.9% |
9.5% |
|
Ngong Road |
164 |
81.0% |
8.3% |
|
Kiambu road |
179 |
77.6% |
8.1% |
|
Mombasa road |
146 |
78.6% |
7.0% |
|
Thika Road |
156 |
74.2% |
6.6% |
|
Satellite towns |
145 |
70.8% |
6.2% |
|
Eastlands |
131 |
73.0% |
5.8% |
|
Average |
170 |
77.2% |
7.9% |
Source: Cytonn Research 2022
We expect the retail sector to continue realizing aggressive expansion activities from local and international retailers such as Naivas, Eat’N’Go, and QuickMart, among others, due to; i) positive demographics, ii) Nairobi’s recognition as a regional hub hence driving foreign investments, and, iii) availability of infrastructure enhancing accessibility to retail stores. Conversely, the existing retail space oversupply in the Nairobi Metropolitan Area currently at 3.0 mn SQFT, coupled with the online shopping strategy still being adopted by some retailers hence derailing occupancy rates, is expected to weigh down performance of the sector.
- Hospitality Sector
During the week, French’s Fairmont Norfolk Hotel located in Nairobi’s Central Business District (CBD), resumed operations after having been shut down for nearly two years. The five star hotel seized its operations in July 2020 amidst the onset of the COVID-19 pandemic which caused a slowdown of business activities. The move by Norfolk comes barely two weeks after global five-star hotel Radisson Blu located in Nairobi Upper Hill announced plans to resume operations as well on 9th May 2022. This is a sign that the hospitality sector performance is regaining normalcy, after having been one of the worst hit sectors at the onset of the pandemic. Some of the factors driving increased activities in the sector and the reopening of various hotels such as Norfolk include;
- Lowered pandemic restrictions i.e. social distancing and lockdowns,
- Roll out of COVID-19 vaccines thereby boosting confidence of visitors in the sector, and,
- Increased events, conferences, and tourism activities leading to increased booking and operation of hotels.
According to Central Bank of Kenya’s Monetary Policy Committee Hotels Survey March 2022 report, the hospitality sector realized an overall improvement in activities and performance evidenced by the increased number of hotels in operations, bed occupancy levels, and share of foreign clientele. The graph below shows the overall percentage of the number of operating hotels in Kenya as of January 2021– March 2022;
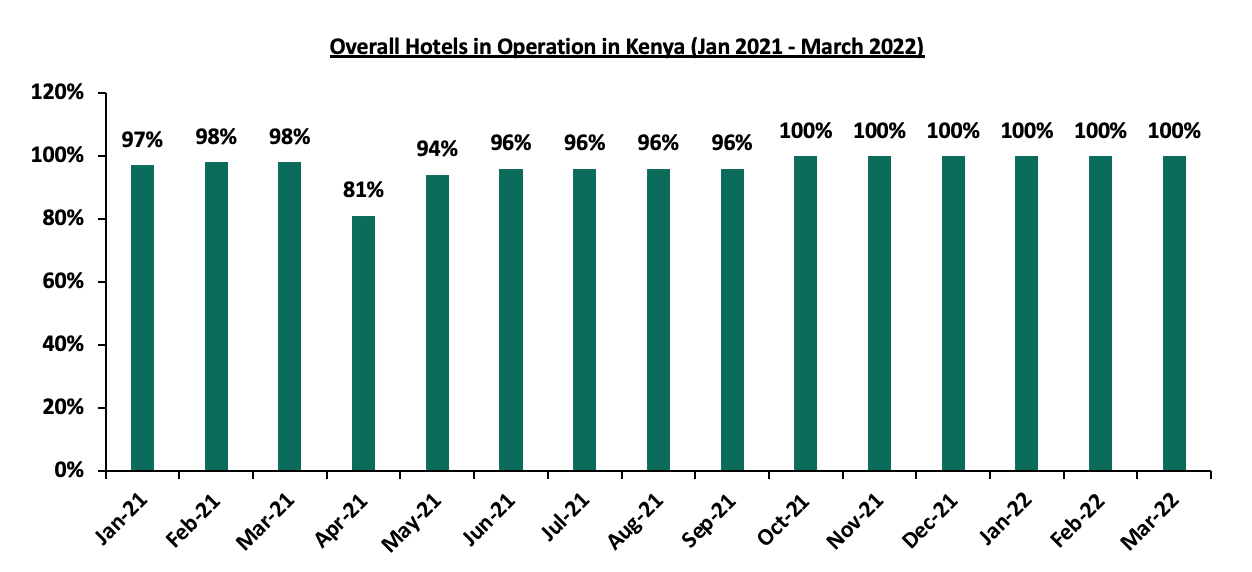
Source: Central Bank of Kenya (CBK)
The graph below highlights the hotel bed occupancy rates in Kenya between January - March 2022;
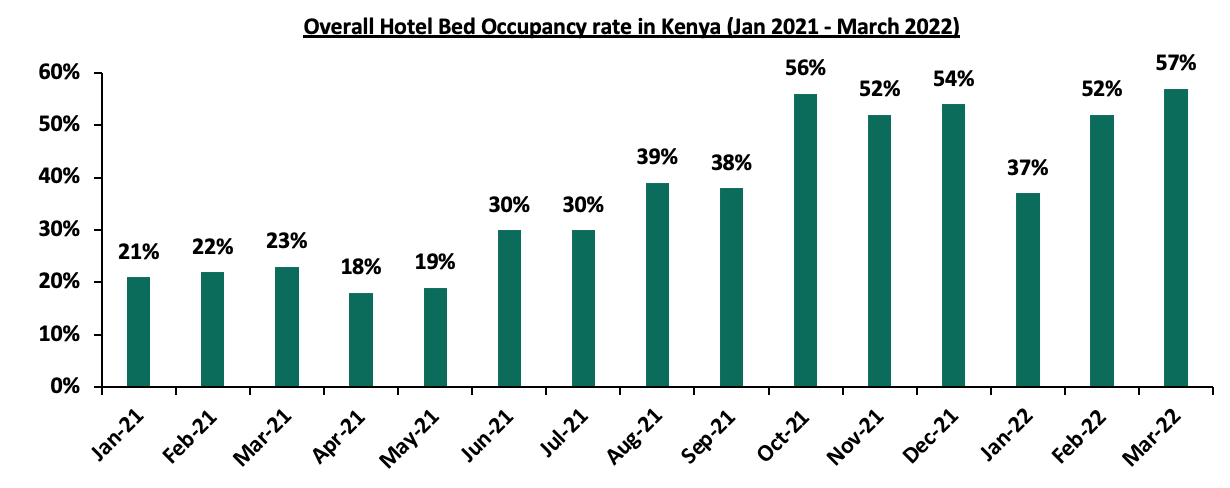
Source: Central Bank of Kenya (CBK)
We expect the hospitality sector to continue recording remarkable performance and activities mainly as a result of the relaxation of COVID-19 containment measures, increased visitor arrivals thereby boosting performance of hotels and serviced apartments, and, the roll out of vaccines in various parts of the country. However, uncertainties around the upcoming general elections are expected to weigh down performance of the sector, especially with regards to visitor arrivals.
- Infrastructure
During the week, the Kenya Urban Roads Authority (KURA) announced that it was seeking Kshs 1.0 bn from an undisclosed party to complete the upgrade of roads in Nairobi’s informal settlement areas. The two-year project worth Kshs 5.4 bn began in 2021 and was expected to be completed by December 2022, however has been stalling for the past three months due to financial constraints. Currently, the project is approximately 90.6% done, with 370.0 Km roads done out of the total planned 408.4 Km. The breakdown of the roads are as follows, 70.0 Kms in Githurai, Githurai 57.5 Kms, Roysambu 50.8 Kms, Mwiki 42.0 Kms, Kangemi 41 kms, Dandora, Utawala, Mihango and Ruai 40.0 Kms cumulatively, and Kawangare 22.6 Kms. Upon its completion, the roads will; i) Ease transport services by promoting seamless transport of goods, people, and services, to various surrounding areas such as Kawangware, Kibera, Mathare, and ii) Boost Real Estate investments in the surrounding areas by promoting accessibility.
Infrastructure development has proven to be a top priority for the Government of Kenya evidenced by the numerous ongoing and completed projects in the country such as; i) the Nairobi Expressway, ii) Nairobi Commuter Rail project, and, iii) the Western Bypass project, among others. We therefore expect a similar trend to continue being witnessed in the sector as a result of government’s aggressiveness to implement projects through various strategies including; i) issuing of infrastructure bonds to raise funds for construction, ii) initiating project partnerships such as Public Private Partnerships, and, iii) priority in the YoY budget allocations, with the sector having been allocated Kshs 212.5 bn in the proposed FY’2022/23 Budget Statement, a 4.9% increase from Kshs 202.5 bn in FY’2021/22.
- Real Estate Investment Trusts (REITS)
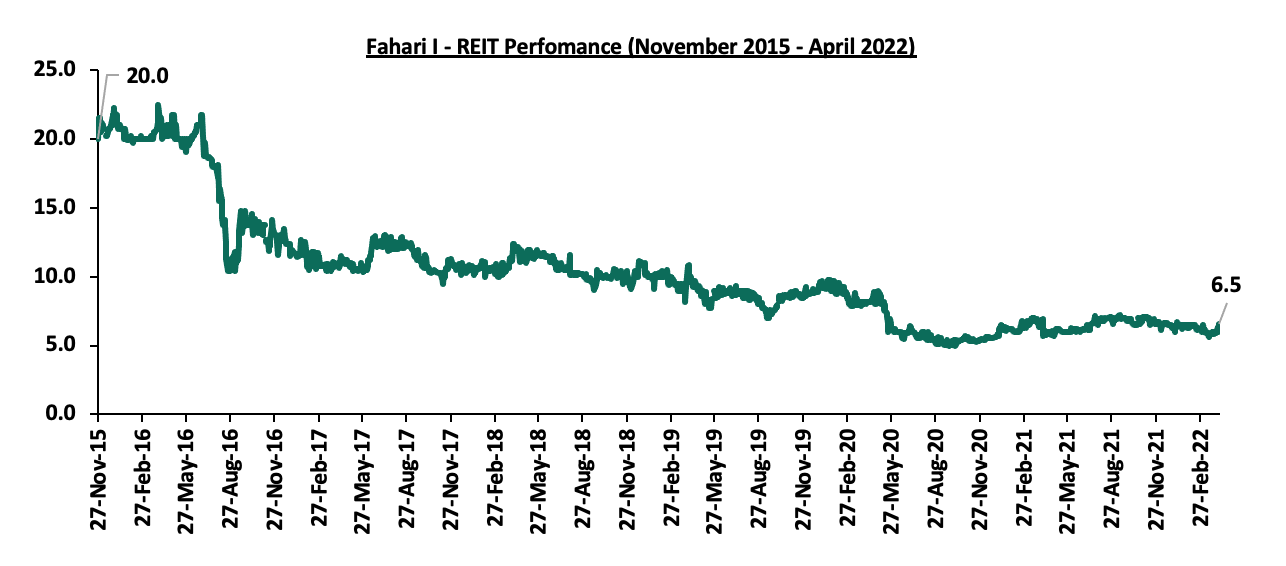
In the Nairobi Stock Exchange, ILAM Fahari I-Reit closed the week trading at an average price of Kshs 6.5 per share. This represented a 10.2% and 1.6% Week-to-Date (WTD) and Year-to-Date (YTD) increase respectively, from Kshs 5.9 per share and Kshs 6.4 per share, respectively. On Inception-to-Date (ITD) basis, the REIT’s performance continues to be weighed down having realized a 67.5% decline from Kshs 20.0. Overall, the Kenyan REIT market performance continues to be weighed down by; i) a general lack of knowledge on the financing instrument, ii) general lack of interest of the REIT by investors, and, iii) lengthy approval processes to get all the necessary requirements thus discouraging those interested in investing in it. The graph below shows Fahari I-REIT’s performance from November 2015 to April 2022:
We expect Kenya’s property market to be on an upward trajectory driven by an improved budget allocation in Real Estate and related sectors, increased uptake of office spaces as most tenants resume full operations, aggressive expansion in the retail sector, and increased activities in the hospitality thereby boosting performance of hotels and serviced apartments. However, investor’s minimal appetite for the REIT instrument is expected to continue weighing down the overall performance of the property sector.
Kenya’s Real Estate sector has been one of the fastest-growing sectors of the economy over the past years, growing at a compound annual growth rate of 6.4% in the past 6 years. With the onset of the COVID-19 pandemic, the sector realized a slowdown in activities with the most affected investment classes being the hospitality sector brought about by a decline in tourism arrivals and the commercial office sector, which saw people adopting the working-from-home initiative coupled with an oversupply of 6.7 mn SQFT as of 2021. As the real estate sector recovers from the pandemic effects, key challenges such as inadequate access to development financing still persist as most developers rely on bank loans as their main source of funding despite lower lending levels witnessed in Q4’2021. The gross loans advanced to the Real Estate sector decreased by 1.5% to Kshs 456.0 bn in FY’2021, from Kshs 463.0 bn in Q3’2021 according to the Quarterly Economic Review Report October-December 2021, by the Central Bank of Kenya. The over-reliance on traditional sources of financing real estate projects such as debt financing continues to be a challenge mainly due to difficulty in accessing credit loans, coupled with the burden of being in debt. To address the funding gap, Real Estate industry players have been focusing on exploring alternative ways of financing Real Estate Developments such as Real Estate Investment Trusts.
In light of this, the Capital Markets Authority (CMA) in 2013 put in place REITs regulations that developers can use to raise capital and paving the way for registration of the three active REITs in the market – ILAM Fahari REIT, Acorn D-REIT and Acorn I-REIT. In an aim to establish a clear understanding of REITS, we have previously done two topicals namely Real Estate Investment Trusts, REITs, as an Investment Alternative in 2019, and, Real Estate Investment Trusts in Kenya in 2021. However, activity by local REITs remains low given two recent foreign transactions- i) Grit Real Estate Income Group REIT acquired a 20.0% stake in Gateway Real Estate Africa Ltd (GREA) which invested Kshs 5.5bn to build a diplomatic housing estate Rosslyn, and, Ii) Grit Real Estate Income Group REIT invested Kshs 6.1 bn to acquire Orbits Products Africa, a warehousing complex in March 2022. We therefore look into the REIT market to understand why the development of REITs continues to be slow. This week, we update our topicals and provide an update on the performance of the established REITs by covering the following topics;
- Overview of REITs,
- Types of REITs,
- Benefits of investing in REITs,
- Challenges investors have encountered investing in REITs and suggested solutions,
- REITs performance in Kenya,
- Case Study of Singapore and lessons learnt, and,
- Conclusion.
- Overview of REITs
Real Estate Investment Trusts (REITS) are regulated collective investment vehicles which invest in Real Estate. REITs promoters source funds to build or acquire Real Estate assets, such as residential, commercial, retail, mixed-use developments among others which they sell or rent to generate income. The income generated is then distributed to the investors as returns. The Real Estate assets are held by a trustee on behalf of unit holders and professionally managed by a REIT manager. To help improve accountability and transparency within the REIT structure, there are four key parties who work together to ensure that the interests of REITS investors fully protected. These parties include:
- The Promoter: This is an individual or a company involved in setting up a Real Estate Investment Trust (REIT) scheme. The promoter is regarded as the initial issuer of REIT securities and is involved in making a submission to the regulatory authorities to seek for approval of a draft trust deed, draft prospectus or an offering memorandum. In the existing Acorn D-REIT, Acorn Investment Management is the promoter. For the attempted D-REITs, Fusion Investment Management Limited was the Promoter in Fusion D-REIT, and Cytonn Asset Managers Limited (CAML) was the Promoter in Cytonn D-REIT,
- The REIT Manager: This is a company that has been incorporated in Kenya and has been issued a license by the authority (CMA) to provide Real Estate management and fund management services for a REIT scheme on behalf of investors,
- The Trustee: This is a corporation or a company appointed under a trust deed and licensed by the regulatory authorities to hold the real estate assets on behalf of investors. The Trustee’s main role is to act on behalf of beneficiaries, usually the investors in the REIT, by assessing the feasibility of the investment proposal put forward by the REIT Manager and ensuring that the assets of the scheme are invested in accordance with the Trust Deed, and,
- Project/Property Manager: The role of the project manager is to oversee the planning and delivery of the construction projects under a REIT and ensuring that they bring value to the REIT’s investors. The property manager on the other hand plays the role of managing the completed real estate development that has been acquired by a REIT.
The figure below shows the relationships between the key parties in a typical REITs structure;
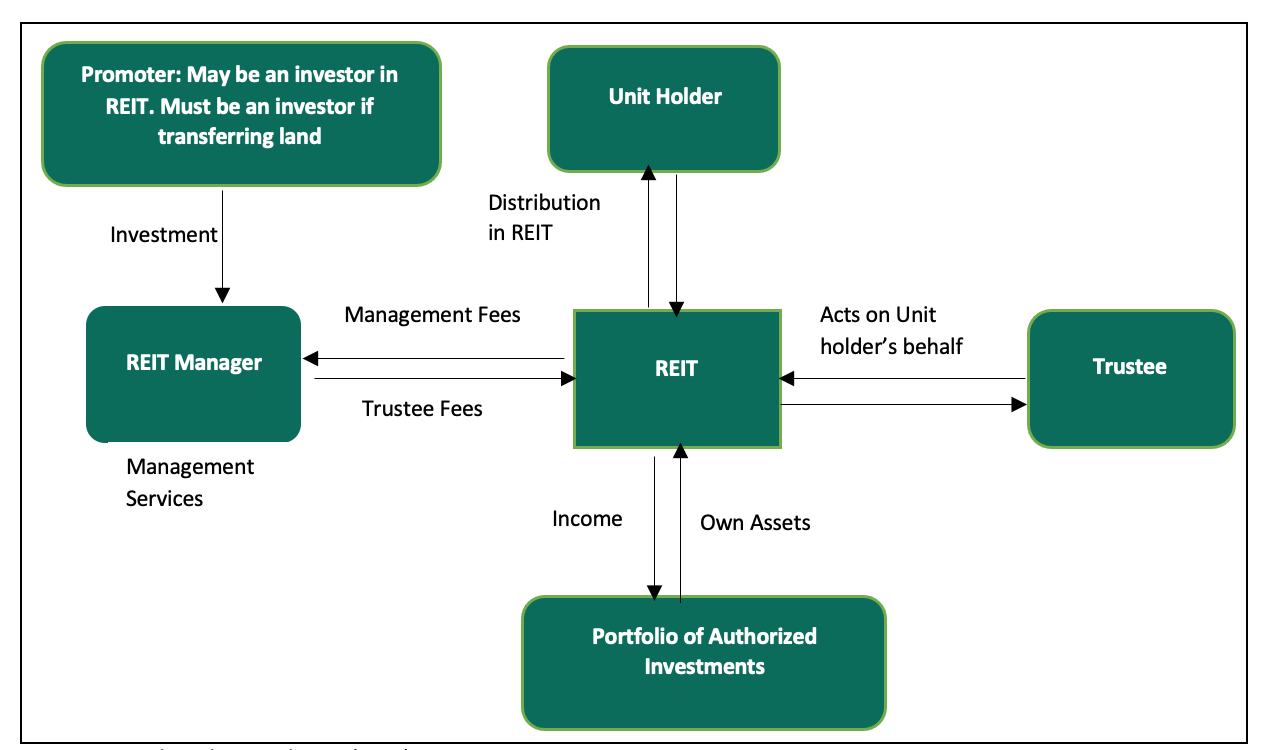
Source: Capital Markets Authority (CMA)
- Types of REITs
There are three main types of REITs which include
- Income Real Estate Investment Trusts (I-REITs): This is a Real Estate trust that primarily derives its revenues from rental properties. These properties may be in any Real Estate asset class such as the residential, hospitality, retail, student housing among others. The investors gain through rental income and capital appreciation form the investments undertaken,
- Development Real Estate Investment Trust (D-REITs): This is a type of Real Estate trust where resources are pooled together for purposes of developing of Real Estate projects. Once a development has been completed, a D-REIT may be converted to an I-REIT and here the investors may choose to either re-invest their funds to another development by the same REIT manager, sell, or, lease their shares, and,
- Islamic Real Estate Investment Trusts: This is a unique type of a Real Estate Investment Trust, which only undertakes Shari’ah compliant activities. A fund manager is required to do a compliance test before making an investment in this type of REIT to ensure it is Shari’ah compliant.
- Benefits of Investing in Real Estate Investment Trusts (REITs)
Some of the benefits of investing in Real Estate Investment Trusts include;
- Competitive Long-term returns: The performance of the REITs are derived from the Real Estate investments and we have seen that Real Estate has outperformed other asset classes, in the last 5-years, generating returns of over 25.0% p.a., compared to 5- year average returns of the 91-day T-bills at 7.3%, NASI at 6.4%, the 10 Year treasury bond at 12.4% and Bank deposits return at 7.0%,
- Diversification: REITs, fixed income securities, and equities have different investment characteristics creating diversification when combined within a single portfolio. Diversification helps to reduce the risks taken when the investments are spread across various asset classes, industries and geographies,
- Flexible Asset Class: REITs are regarded as a flexible payment option where investors are able to customize their REITs portfolio based on the fund characteristics, the various real estate sectors and geographic exposures,
- Liquidity: A physical property takes time and money (in terms of commissions, fees and taxes) to sell. A REIT, on the other hand, offers high liquidity since an investor can buy and sell units/shares in the REITs any time and especially if they are listed. The advantage of liquidity also extends to Real Estate developers as well since they may not need to completely sell their entire assets if they are seeking for some little liquidity,
- Stable and Consistent Income Stream: Investors especially those who take the I-REIT option have the advantage of getting rental income thus guaranteeing a stable and consistent income stream, I-REITs are required by the law to pay off at least 80.0% of their income to unit holders in the form of dividends,
- Taxation Benefits: REITs general have a number of tax benefits which include; i) REITs registered by the Commissioner of Income Tax are exempted from income tax except for the payment of withholding tax on interest income and dividends, ii) transfer of properties to a REIT also attracts a stamp duty exemption, as per Section 96A (1) (b) of the Stamp Duty Act, iii) REITs’ investee companies are exempted from income tax as stated in the Finance Bill 2019, section 20 of the Income Tax Act, and, withholding tax constitutes final tax on that income,
- Transparency: REITs provides operating transparency mainly because of how they are structured and operated. REITs, particularly, the listed ones are regulated by the securities markets regulators who adhere to high standards of corporate governance, financial reporting and information disclosure, and,
- Affordability: REITs offer the benefit of investing in large Real Estate developments at affordable prices particularly through the security exchange platform, as opposed to purchasing an entire unit or development, which may be expensive sometimes. For instance, instead of purchasing a Kshs 5.0 mn 1-bedroom house in order to enjoy the relatively high real estate returns, an investor may require only Kshs 975.0 to purchase 100 shares of the listed ILAM Fahari I-REIT and enjoy the same benefits as any real estate investor. The affordability opens up real estate investment and returns to retail investors.
- Challenges facing the adaptation of REITs in Kenya & Suggested Solutions
The REITS market in Kenya has continued to face numerous challenges evidenced by the low REIT market Cap to GDP at less than 0.1% compared to more developed countries such as South Africa and Australia at 7.8% and 7.9% respectively. The graph below shows the REIT market Capitalization to GDP for various countries.
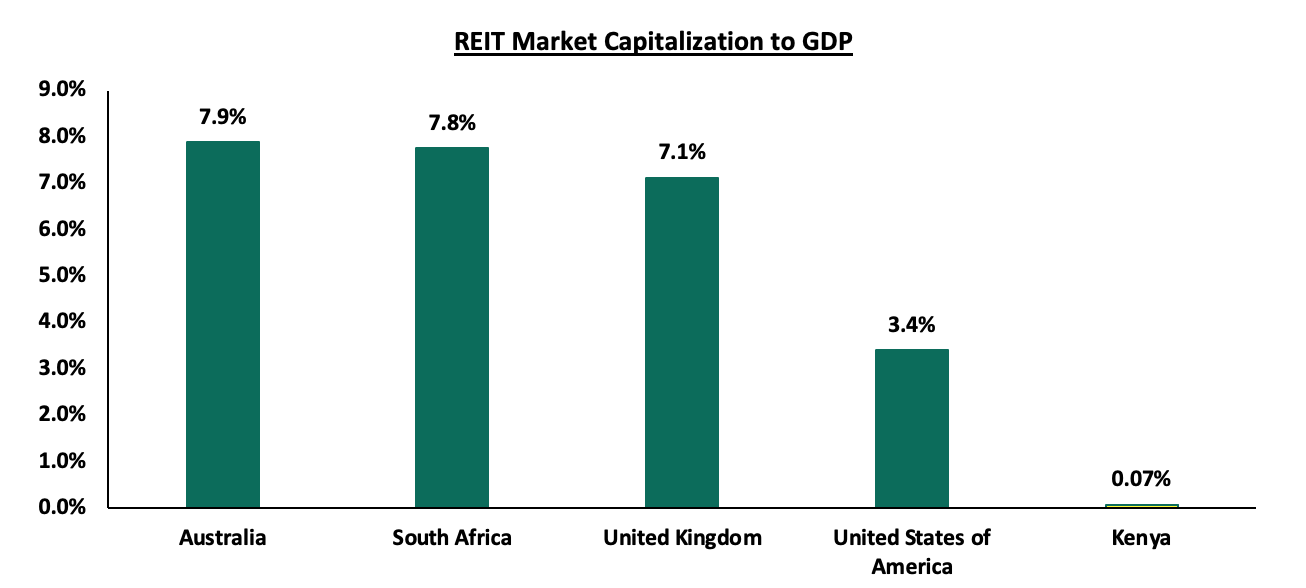
Source: World Bank, online research
The dismal performance of the REIT market in Kenya is attributed to various factors which include;
- High Minimum Capital Requirements for a Trustee of Kshs 100.0 mn: This essentially limits the eligible trustees to only banks, efficiently eliminating corporate trustees and other fund managers. When compared to the minimums for a REIT Fund Manager and a pension scheme Corporate Trustee at Kshs 10.0 mn, the Kshs 100.0 mn for a REIT Trustee is 10x higher. This exacerbates the problem of overreliance on banks as only banking institutions qualify with such high minimum requirement. Case in point, Kenya currently has only three licensed REITs trustees who are all banks. The Solution is to drop the minimum capital requirement to match what is required of a fund manager, that is Kshs. 10.0 mn, allowing for inclusion of corporate and non-bank trustees,
- High Minimum Investment Amounts Set at Kshs 5.0 mn: Based on the current regulations, the minimum investment amounts for a D-REIT is 5.0 mn, which is 100x higher than the gross median income of Kshs 50,000 in Kenya. This discriminates against many investors who need the benefit of regulated structures to protect their investments, especially in alternative asset classes markets. The Solution is to bring down the minimum required investment amount for a REIT to Kshs 100,000, which is the amount required by regulations for a private offer,
- Lengthy Approval Process: The approval process can take time particularly to get the necessary documentations, and meet all the required regulatory requirements. This might discourage promoters from perusing their interests in focusing on REITs and look for other more efficient ways to raise capital. The Solution is to have a defined approval time within which an application must be processed and either approval or reasons for failure to approve clearly communicated to the applicant,
- Inherent conflicts of interests with Trustees: Due to the high minimum capital amounts, there are only 3 Trustees who are all banks. There have been instances where banks have asked for deposits in order to undertake the REIT Trustee work, this would be cured by enabling Corporate Trustees as is the case with Pensions.
- Inadequate Investor Knowledge: Despite the fact that REITs have been existence in the Kenyan market for the past 9 years, the popularity of the instrument has remained low mainly. The low popularity of the instrument is a major contributor to the low subscription rates and the consequent poor performance of the FAHARI I-REIT and the failed issuance of the Fusion D-REIT in 2016. The Solution is to have broader investor education on the benefits of REITs, through seminars, workshops or advertisements but this will only make sense after several REITS have come to market,
- Subdued Performance of the Real Estate Market: Despite the fact that the Real Estate sector has demonstrates pockets of recovery as per the Cytonn Q1’2022 Markets Review, oversupply in various sectors such as the Nairobi Metropolitan Area commercial office and the Kenyan retail sector of 1.7 mn SQFT and 6.7 mn SQFT continues to affect performance. This directly affects the occupancies and the rental returns. The solution is that REIT managers should focus on ensuring continued sector monitoring in order to ensure that they take advantage of the performing subsectors and nodes in order to boost returns to unit holders and help in the industry growth, and,
- Economic Uncertainty: There is much uncertainty surrounding not just the REIT market, but the overall economy due to COVID-19 which had a major impact on the real estate sector particularly on the commercial office and hospitality sector and the upcoming general elections since investors are anticipated to reduce their investments as they adopt a wait and see approach. The hospitality industry is yet to recover and this will have repercussions on the economic outlook of REITs.
- REITs performance in Kenya
In 2013, Kenya became the third African country to establish REITS as an investments vehicle after Ghana and Nigeria who launched their REIT frameworks in 1994 and 2007, respectively. The fourth African country to establish REITs was South Africa South in 2013, and after Kenya. In the Nairobi stock Exchange (NSE), there are currently three REITs namely the ILAM Fahari I-REIT which was listed and started trading in November 2015, and, the Acorn Student Accommodation I-REIT and D-REIT which were launched in February 2021. The two Acorn REITs are not listed but investors can trade their shares over the counter through the NSE Unquoted Securities Platform (USP). The total of only three REITs in Kenya is low compared to countries like South Africa which has 33 listed REITs despite REITs regulations becoming operation in 2013 and after Kenya. Below we look at the REITs industry’s performance in Kenya through different metrics – licensing, notable activities in the market, foreign REITS transactions, and, financial performance of the operational REITs:
- Licensing
In the nine years since REITs became operationalized in Kenya, the REITs market has remained underdeveloped and has been marked with some notable failures along the way in terms of licensing. The Fusion Capital D-REIT, which was launched in 2016, failed due to low subscription rates and the Cytonn D-REIT launched in 2019 failed due to conflicts of interest by the prospective bank Trustee who requested for significant deposits in order to accept the Trustee role and a slow approval process. Kenya currently has 10 licensed REITs managers with the latest one being Acorn Investment Management Limited which was licensed in late 2020. Other REIT managers in Kenya are; Cytonn Asset Managers Limited (CAML), Stanlib Kenya Limited Nabo Capital, ICEA Lion Asset Managers Limited, Fusion Investment Management Limited, H.F Development and Investment Limited, Sterling REIT Asset Management, Britam Asset Managers Limited, and CIC Asset Management Limited. However, Kenya has only three licensed REITs trustees, Kenya Commercial Bank (KCB), Housing Finance Bank (HF), and, Cooperative Bank of Kenya Limited (Coop Bank) mainly attributable to the high minimum capital requirement of Kshs 100.0 mn.
- Notable Market Activities
In August 2019, the Capital Markets Authority of Kenya approved the issuance of Acorn Holdings’ Medium-Term green bond worth Kshs 5.0 bn, the first green bond in Kenya. In the issuance a total of Kshs 4.3 bn was raised with the funds allocated to six Purpose Built Student Accommodation (PBSA) projects with a capacity of 4,503 beds. In July 2021, Acorn Green Bond programme was re-opened after, the company received approval from the Capital Markets Authority to raise the ceiling of its bond programme to Kshs 5.7 bn from the previous Kshs 5.0 bn. Its final tranche which closed on 16th July 2021, aiming to raise Kshs 1.4 bn recorded an oversubscription rate of 146.0%, through which Acorn Holdings managed to raise Kshs 2.1 bn. The firm managed to raise a total of Kshs 6.4 bn from the medium term green bond.
- Foreign REITs Transactions
There have been notable activities related to REIT transactions being done by foreign companies notably from GRIT Real Estate Income Group. These include:
- In January 2022, Grit Real Estate Income group REIT acquired a 20.0% stake in Gateway Real Estate Africa Ltd (GREA) which invested Kshs 5.5bn to build a diplomatic housing estate in Rosslyn which will be leased to the staff of the United States embassy in Nairobi for 8 years. Rosslyn is an attractive investment area that is likely to provide high returns to investors supported by: i) the categorization of the area as a Blue Diplomatic Zone, ii) close proximity to social amenities such as the Rosslyn Riviera Mall, Two Rivers Mall, and Village Market, and, iii) ease of accessibility as the area is served by the Limuru Road and Kiambu Road. It was also the best perforing node in the high end segment in Q1’2022 recording total returns of 6.2%, 0.5% points higher than the market average of 5.7% according to the Cytonn Q1’2022 Markets Review, and,
- Grit Real Estate Income group REIT also invested Kshs 6.1bn to acquire Orbits Products Africa, a warehousing complex in March 2022. This comes after the investment firm entered a Kshs 2.9 bn loan agreement with the International Finance Corporation (IFC) in July 2021, with an aim of acquiring and developing the warehousing and manufacturing facility. Grit’s decision to invest in Orbit factory signifies a rising demand for warehouse facilities in the country amidst the continuing expansion of the manufacturing guaranteeing returns. This was also driven by i) Strategic location with high concentration of industries, as the area is mainly deemed as an industrial area,, ii) adequate infrastructural network with the area being served by roads such as the ongoing Nairobi Expressway, and, iii) presence of a Standard Gauge Railway terminus that serves as an offloading point for Nairobi for goods coming from Mombasa.
GRIT Real Estate Income Group, which is a multi-listed income group has also invested into other properties in Kenya namely i) 50.0% stake in Naivasha Buffalo Mall, and, ii) a pharmaceutical warehouse along Mombasa Road that it leases out to South Africa’s Imperial Health Sciences Logistics. The Company has investments in retail, office, light industrial and corporate accommodation sectors. Mauritius continues to provide a favourable investment platform for firms both local and international and this allows for companies to make offshore investments in other countries. This is coupled with taxation benefits for both local and foreign firms coupled with clear operational guidelines as stipulated in the securities (Real Estate Investment Trusts) rules 2021.
The local REIT market activities have remained low due to the challenges surrounding the establishment of REITS in Kenya as mentioned above. Given the two recent successful REITS transactions in Kenya in the first quarter of the year, by GRIT Real Estate Income Group, we expect more foreign nationals to show their interest in Kenyan developments with the worst case scenario being dominating the REITS market in Kenya.
- Financial performance
In terms of financial performance, Acorn D-REIT recorded profits of Kshs 775.9 mn in FY’2021 while the I-REIT profits came in at Kshs 387.5 mn – both in their first year of operations. The D-REIT performance was mainly driven by a positive adjustment in the fair value of its investment Property to Kshs 1.1 bn from Kshs 339.0 mn in H1’2021. On the other hand, the listed Fahari I-REIT saw a 183.7% decline in its earnings per unit to Kshs (0.7) in FY’2021, from Kshs 0.8 in FY’2020 as it recorded a loss of Kshs 124.0 mn in FY’2021 compared to a profit of Kshs 148.0 mn in FY’2020. The performance was mainly attributable to revaluation losses recorded by the property portfolio in the context of the COVID-19 pandemic, whose impact continues to be a material valuation uncertainty in the short to medium term, particularly in the retail space. This was coupled by an 18.2% decline in total operating income to Kshs 299.6 mn, from Kshs 324.5 mn in FY’2020.
The table below includes a summary of the three REIT’s performance in FY’2021:
|
Balance Sheet Items (Kshs bn) |
Acorn I-REIT FY’2021 |
Acorn D-REIT FY’2021 |
ILAM Fahari I-REIT FY’2021 |
ILAM Fahari I-REIT FY’2020 |
ILAM Y/Y Change (%) |
|
Total Assets |
3.8 |
8.4 |
3.7 |
3.9 |
(4.4%) |
|
Total Liabilities |
0.2 |
3.2 |
0.2 |
0.1 |
56.8% |
|
Total Unitholders’ Funds |
3.6 |
5.2 |
3.5 |
3.8 |
(6.2%) |
|
Income Statement Items (Kshs bn) |
|||||
|
Rental Income |
0.3 |
0.1 |
0.30 |
0.34 |
(12.8%) |
|
Total Operating Income |
0.4 |
0.1 |
0.30 |
0.35 |
(13.8%) |
|
Total Operating Expenses |
(0.2) |
(0.4) |
(0.2) |
(0.2) |
0.0% |
|
Investments Property Revaluation Gain/(Loss) |
0.1 |
1.1 |
(0.2) |
0.01 |
(1,760.7%) |
|
Profit/ (Loss) |
0.4 |
0.8 |
0.2 |
(0.1) |
(183.7%) |
|
Basic EPS |
2.3 |
3.5 |
(0.7) |
0.8 |
(183.7%) |
|
Ratios Summary (%) |
|||||
|
ROA |
10.3% |
9.9% |
(3.3%) |
3.8% |
(7.2%) points |
|
ROE |
10.8% |
14.8 |
(3.5%) |
3.9% |
(7.4% points |
|
Debt Ratio |
4.7% |
37.9% |
4.6% |
3.9% |
1.8% points |
|
PBT Margin |
87.6% |
67.7% |
(41.4%) |
42.6% |
84.0% points |
|
Rental Yield |
11.4% |
10.0% |
9.1% |
9.8% |
(0.7%) points |
|
Distribution Per Unit -Kshs (Subject to Approval) |
1.02 |
- |
0.5 |
0.6 |
0.1 |
|
Distribution Yield |
4.9% |
- |
8.5% |
10.2% |
(1.7%) points |
|
Distribution Pay-out Ratio |
93.5% |
- |
88.7% |
80.8% |
7.9% points |
Fahari I-REIT is currently trading at an average price of Kshs 6.5 per share, which is a 67.5% decline from the inception to date price of Kshs 20.0. The poor performance of the Fahari I-REIT is an indication of the dwindling interest of the instrument by investors. The graph below shows Fahari I-REIT’s performance since inception:
- Case Study of Singapore
Singapore is presently considered the largest Real Estate Investment Trust (REIT) market in the Asia-Pacific region. Singapore Real Estate Investment Trusts (S-REITs) are regulated as Collective Investment Schemes under the Monetary Authority of Singapore's Code on Collective Investment Schemes or alternatively as Business Trusts. The first REIT to be listed in the Singapore Exchange (SGX) was CapitaLand Mall Trust (CMT), which made its debut in 2002. Since the listing of the first REIT in the Singapore Exchange, notable growth has been witnessed in the instrument particularly among the retail investors. As of 31st December 2021, there were 19 S-REITS whose Real Estate portfolio is entirely comprised of overseas properties. As of 31st December 2021, there were 44-REITS and property trusts listed in the Singapore Stock exchange made up a market capitalisation of S$115 billion (Kshs 9.7 tn) and 13.0% of the entire Singapore stock market. S-REITs’ (Singapore-Real Estate Investment Trust) market capitalisation has grown at a compounded annual growth rate of 13.0% over the last 10 years. More than 85.0% of S-REITS and property trusts have overseas properties across Asia Pacific, South Asia, Europe and USA in their portfolios. The table below shows the REIT market capitalization for various countries as of June 2021, Singapore data is as at 31 December 2021 while Kenya’s data is as at 1st April 2022;
|
NO. |
COUNTRY |
REIT MARKET CAP ($US Bn) |
% OF STOCK MARKET CAP |
|
1 |
Singapore |
86 |
13% |
|
2 |
Australia |
105 |
6% |
|
3 |
USA |
1,492 |
3% |
|
4 |
UK |
92 |
3% |
|
5 |
Canada |
72 |
3% |
|
6 |
Japan |
158 |
2% |
|
7 |
France |
55 |
2% |
|
8 |
Malaysia |
9 |
2% |
|
9 |
Hong Kong |
29 |
0.4% |
|
10 |
India |
8 |
0.3% |
|
11 |
Kenya |
0.072 |
0.3% |
Source: Online Research, SGX, REITAS Singapore 2021
The government of Singapore has provided a conducive regulatory environment for REITS transactions. Other key factors supporting the growth of the REIT market in Singapore include:
- High Earnings Distribution Requirement - S-REITs that own Singapore Real Estate properties are required to distribute at least 90.0% of their specified taxable income (generally income derived from the Singapore Real Estate properties) to unitholders as dividends in order to qualify for tax transparency treatment. This has proven to be an attractive proposition for individuals in favor of the “income investing” distributions to unit holders. The dividends are exempt from taxes and may be distributed semiannually or quarterly,
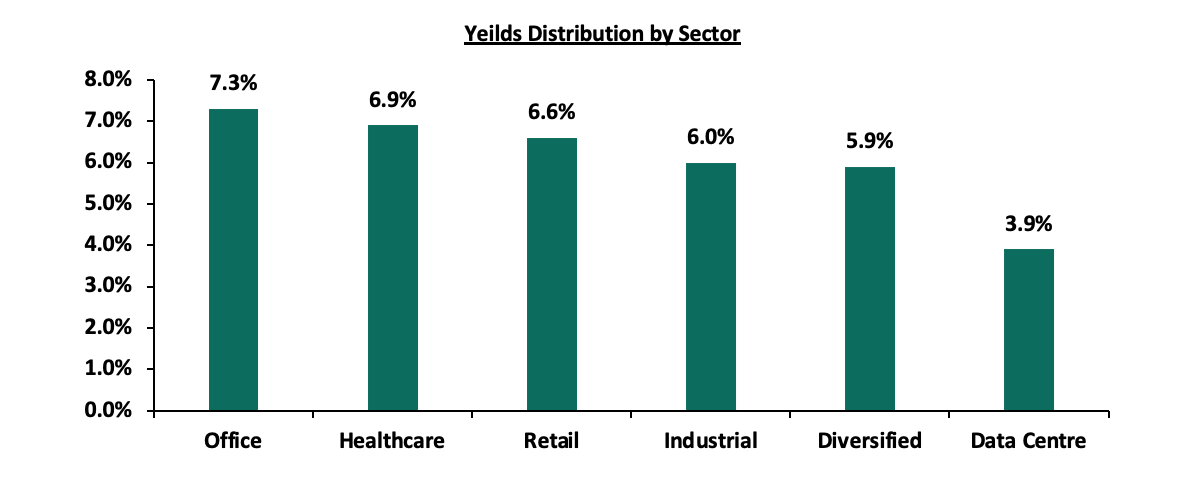
- Attractive Returns - S-REITS have proven offer attractive returns with an average dividend yield of between 5.0%-6.0% higher than the country’s 10 year government bond providing returns of 2.6% as at 8th April 2022. The attractive returns have continued to prove that S-REITS are a good investment option. The returns are mainly driven by the performance of the commercial office which recorded high distribution yields of 7.3% compared to the retail and industrial sector at 6.6% and 6.0% respectively, as at August 2021
- Diversified Investment Options - In Singapore, the REITS market is well diversified across various sub sectors which includes retail, hospitality, industrial, land, and health care among others. There are some REITS in Singapore that have invested in more than one Real estate sub-sector and this accounts for more than half of the S-REITS in the Market. The diverse offering of the REITS in various investment classes creates a safe investment space especially for risk averse clients. The chart below shows the percentage spread of the S-REITS in different Real Estate sectors as at 2021;
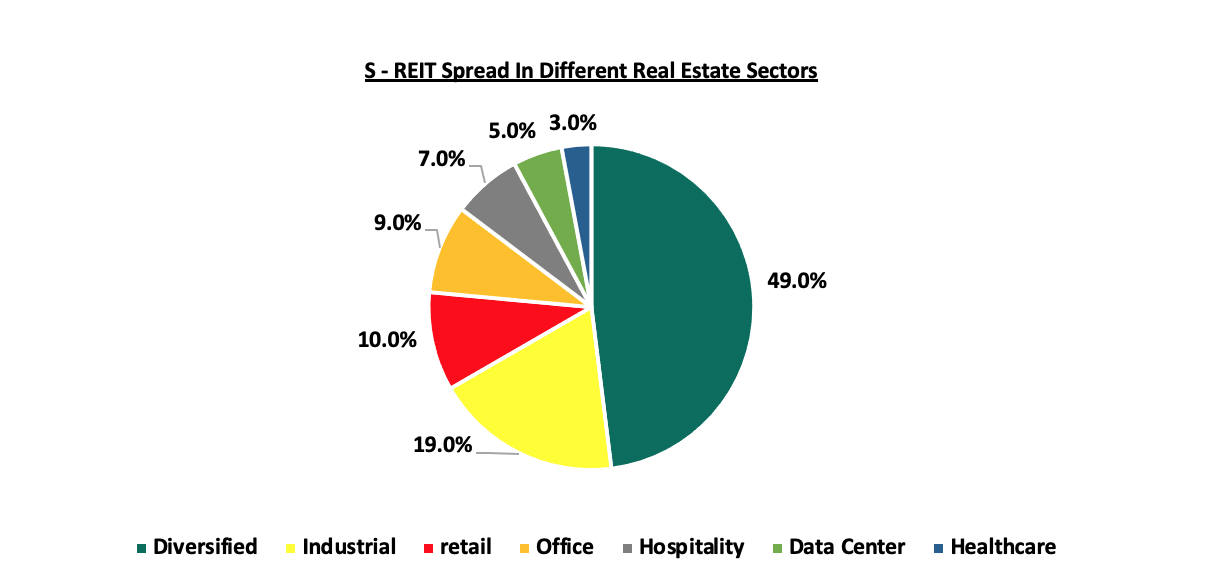 Source: Source: REITAS Singapore, 2021
 - Good Corporate Governance - The main regulatory body of the S-REITS, the Monetary Authority of Singapore has made major efforts to strengthen the corporate governance in the S-REIT market. These includes a requirement by REIT managers to prioritize the interest of investors over the managers and other sponsors when there is a conflict of interest. These policies have helped to facilitate the growth of the REIT market in Singapore. Additionally in light of this, the Monetary Authority of Singapore alongside the Island Revenue authority of Singapore (IRAS) and Ministry of Finance in 2020 put in place measures aimed at ensuring that the listed REITS in Singapore have greater flexibility when managing their cash flows and raising funds in a challenging environment during COVID-19. Some of these measures included: i) Higher Leverage Limit and Deferral of Interest Coverage Requirement, and, ii) Extension of Permissible Period for Distribution of Taxable Income. These strategies were aimed at ensuring that the REITs market is well governed, and,
- Increased Investor Knowledge of the REITS instrument - The Monetary Authority of Singapore has made efforts to ensure that there is increased investor knowledge of REITS in the market. This has been achieved through publishing relevant information aimed at increasing investor knowledge, and creating an environment where REIT managers can compete freely thereby expanding investor knowledge. As a result, investors are able to explore the various REITS investments options in Singapore, making it the largest REITS market within Asia
Lessons learnt from the case of Singapore
The Kenyan REITs market has the potential to grow and this is possible if there is a supportive framework set up just like the case of Singapore, supporting both local and foreign investments. Based on the case study of Singapore the following measures can be implemented to rejuvenate the REIT Market;
- Working on increasing the awareness of the REITS instrument through organizing conferences, advertisements, workshops among others for investors to boost their confidence, this however may be possible if several REITS have come into the market,
- Continuous Improvement on the Regulation and Government Support for REITs e.g. providing regulations that assist in Real Estate uptake to help increase cash flows into the property market especially during challenging times of the economy,
- Key industry players in the Real Estate market can work on developing institutional grade Real Estate assets which will guarantee higher returns as seen in the case of Singapore since REITS are able to yield high returns to investors,
- Prioritize the needs of the investors first through providing a limit on the amount that can be distributed to clients in form of dividends within a specific period either quarterly, semi-annually or annually just like the case of Singapore where the S-REITS are required to distribute at least 90.0% of their specified taxable income in form of dividends, and,
- REIT managers in Kenya can diversify their investments and returns by establishing trusts for a variety of properties not just limited to residential, student housing and retail sector. They can explore Real Estate asset classes such as the hospitality sector, industrial sector, mixed-use/lifestyle developments etc. just like the case of Singapore.
- Conclusion
Real Estate Investment Trusts (REITS) have proven to be a viable investment option for investors as they have proven to be effective in encouraging people to tap into the Real Estate market. REIT as an alternative means for financing Real Estate projects can help plug the existing housing deficit and reduce overreliance on the expensive debt financing for developments while boosting returns for investors & developers. In Kenya, despite the REITS being in existence for more than nine years, the instrument remains subdued due to various factors among them being lack of investor knowledge. There is potential for growth of the instrument if reforms are made to favour the needs of investors, if the approval processes are aligned with well-defined timelines, and, if the public is sensitized in an aim to improve investor knowledge.
Disclaimer: The views expressed in this publication are those of the writers where particulars are not warranted. This publication, which is in compliance with Section 2 of the Capital Markets Authority Act Cap 485A, is meant for general information only and is not a warranty, representation, advice or solicitation of any nature. Readers are advised in all circumstances to seek the advice of a registered investment advisor.

- Talk to us
- Kenya
- P.O Box 20695 - 00200, Nairobi, Kenya
- Cell +254709101200
- Tel +254709101200
- WhatsApp +254741676635
- United States
- +254709101200
- DOWNLOAD OUR APP
-


- Kenya
- 8th Floor, Pinetree Plaza, Kaburu Drive, Ngong Road, Nairobi, Kenya
- USA
- Suite 1150, 1775 Eye Street NW, USA, Washington DC 20006, USA
- Investments
- High Yield
- Private Equity
- Real Estate
- Real Estate
- RiverRun Estates
- Cytonn Towers
- The Ridge
- Taraji Heights
- The Alma